
Lessons
Best Days to Trade Forex: Why Sunday Wrecks Accounts
Best Days & Times To Trade
Sunday night, ten pm Eastern. Marcus opens his charts, sees EUR/USD drifting, and jumps in. Two hours later he's down three percent, staring at a chart that barely moved but still stopped him out twice. He didn't mess up his entry — he picked the wrong day and the wrong hour.
That single mistake, trading blind to time, is what this guide fixes. Not a new indicator, not a new pattern — a clock and a calendar. Because in forex, when you trade decides how much room your setup actually gets to work.
EUR/USD was trading at 1.1516 on August 4, 2026, up slightly on the session — a perfectly normal-looking number that hides a huge amount of information about *when* that price actually moved and when it just sat there.
The Sunday Trap
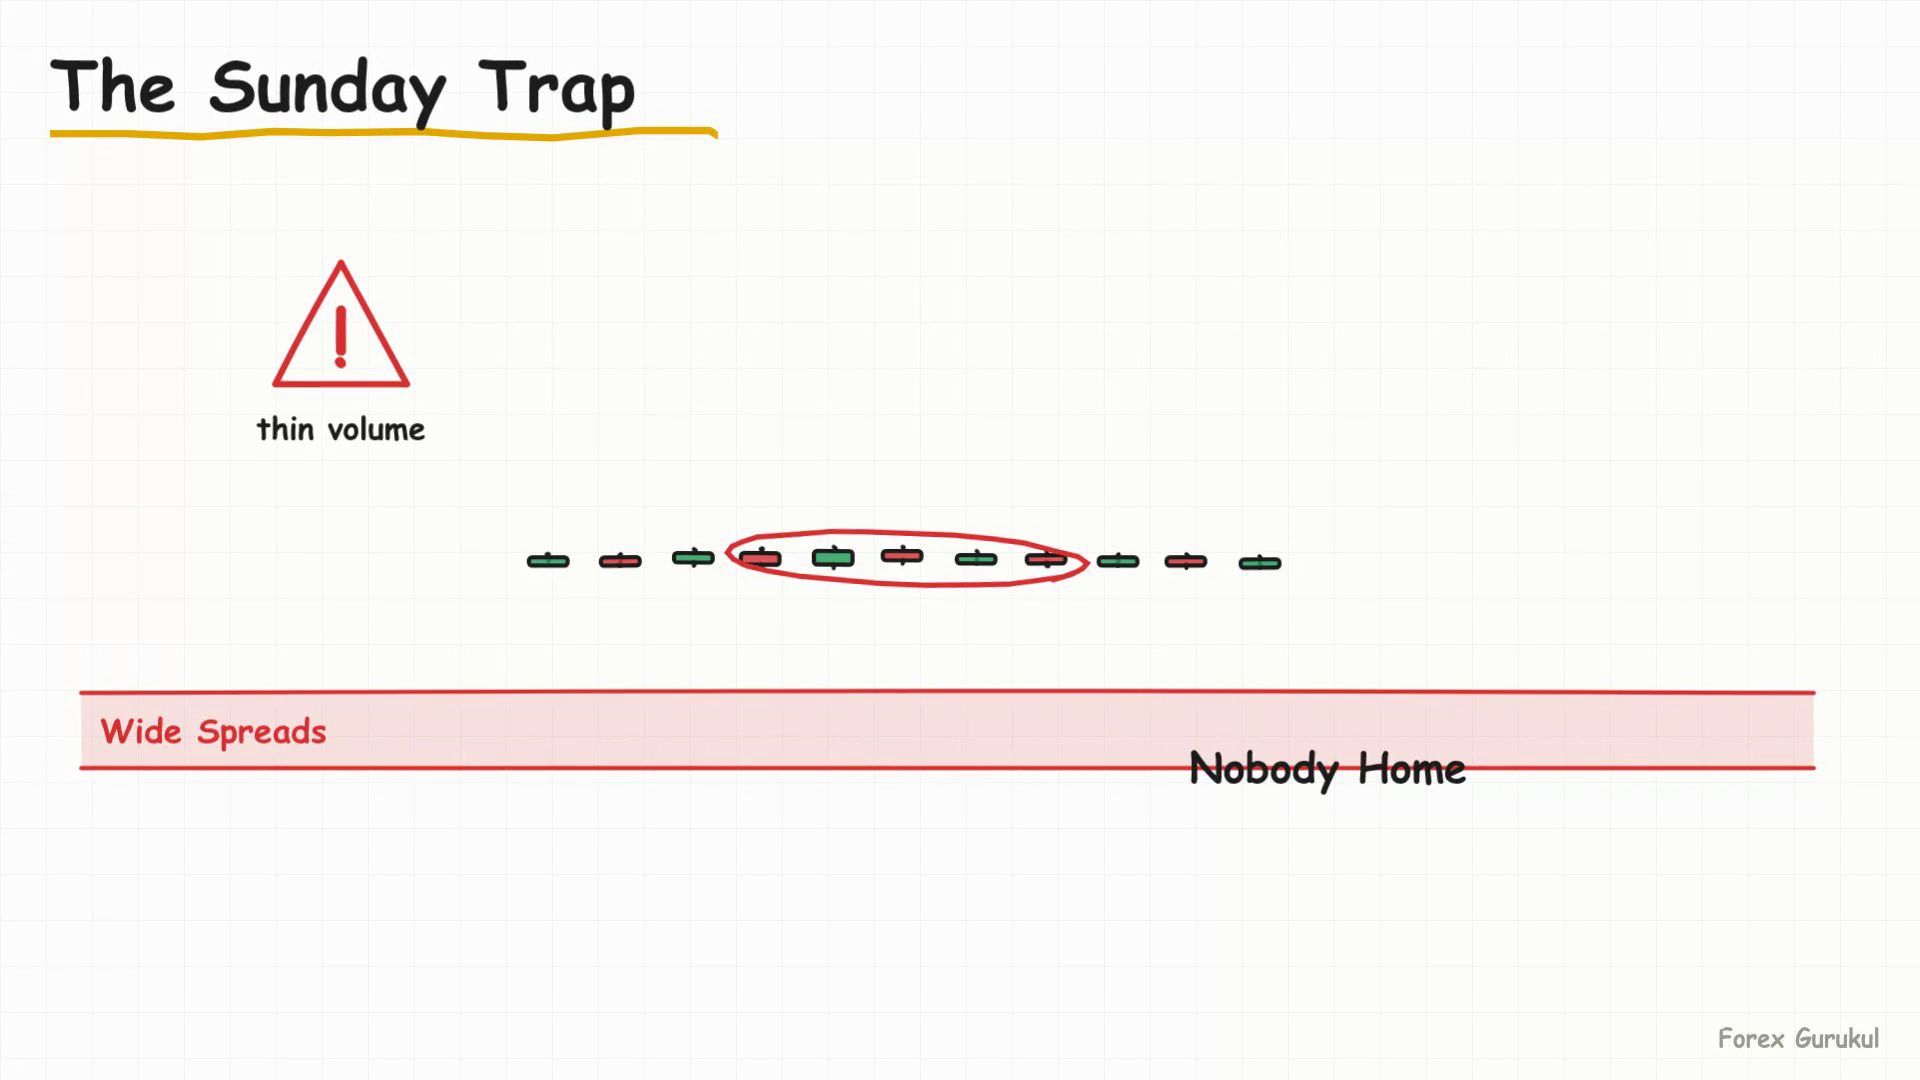
Here's what Marcus didn't know: forex opens at 5pm Eastern on Sunday, but 'open' doesn't mean 'active.' Sunday evening in New York is Monday morning in Tokyo and Sydney, and most of the big banks and funds haven't reached their desks yet.
Volume is thin, so an order size that barely nudges price on a Tuesday can shove price around like a pinball on a Sunday. Spreads widen, stops get tagged on moves that reverse minutes later, and the candles look busy but go nowhere.
Volatility Equals Opportunity, Measuring The Move
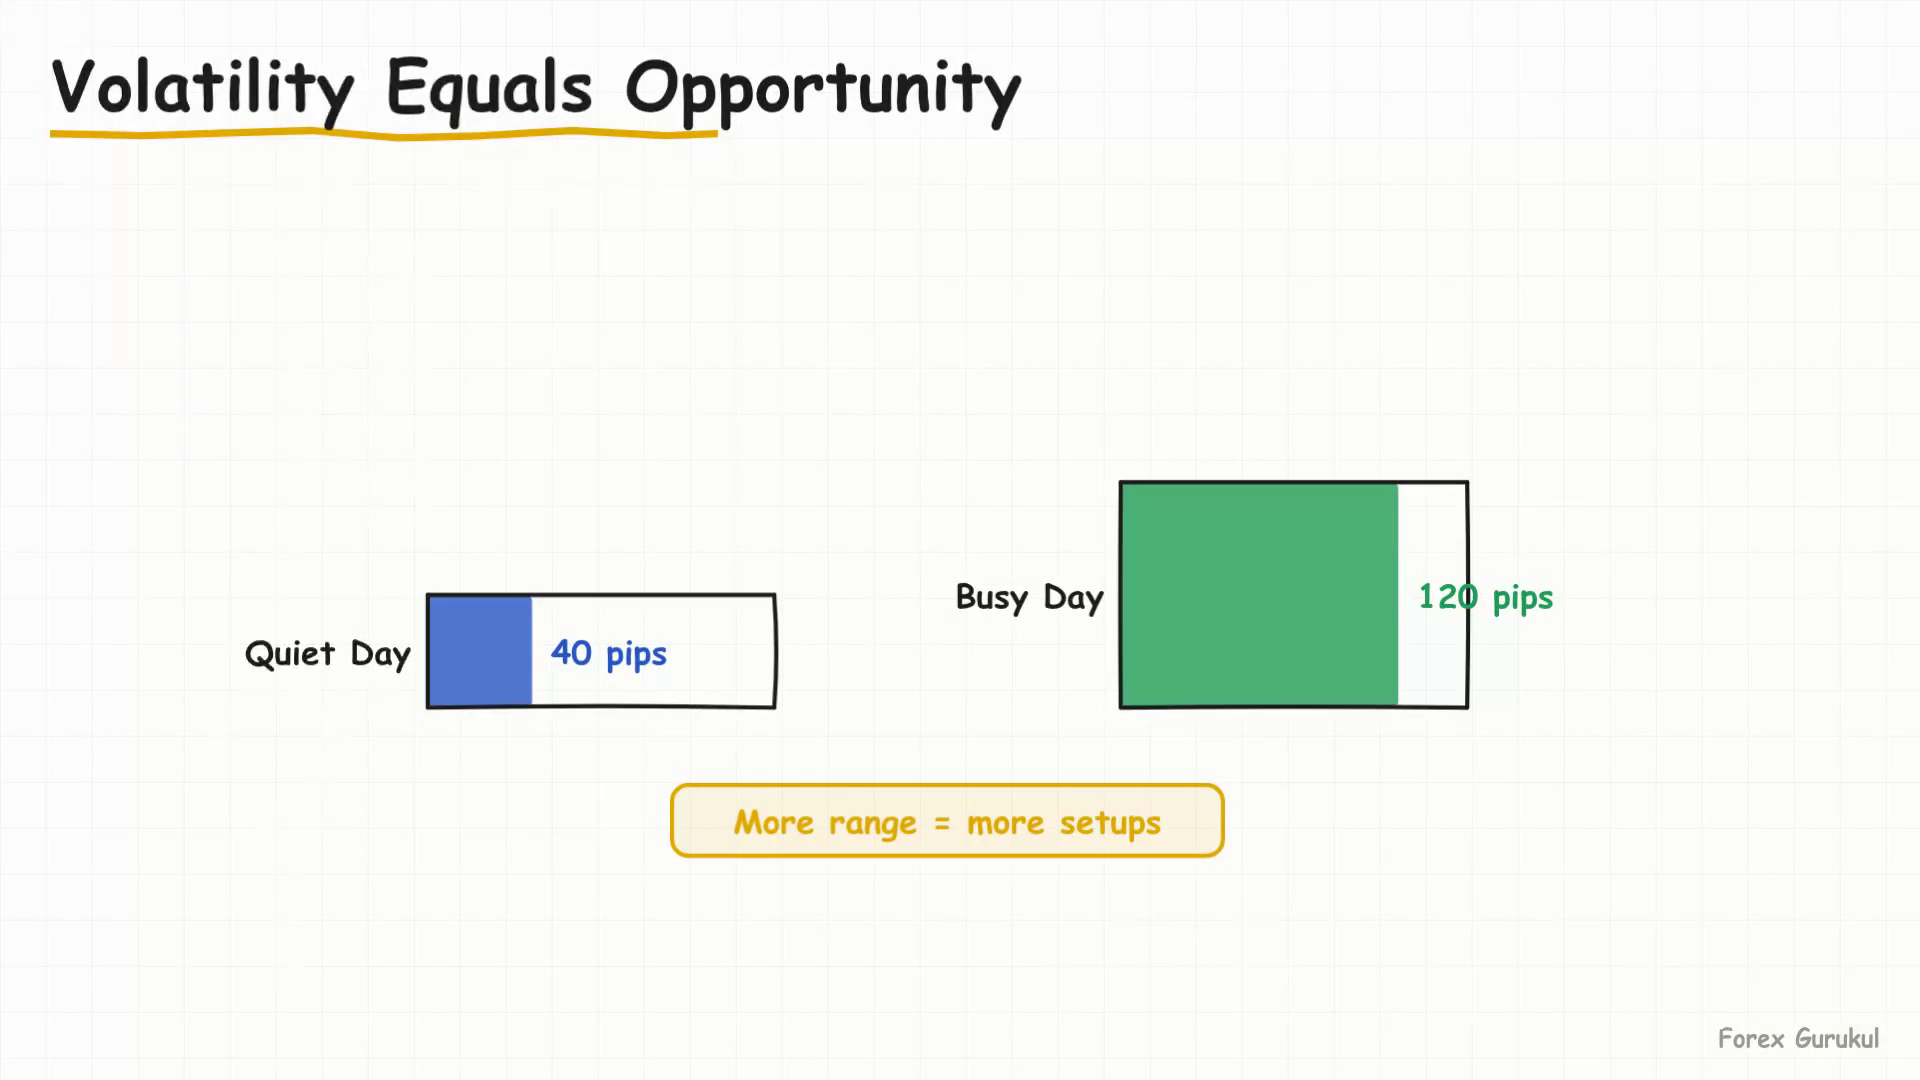
Think of volatility as simply how far price is willing to travel in a day. A quiet day might give EUR/USD 40-50 pips of total range. A busy day might give it 100+. Every setup — entry, stop, target — needs room to develop, and room only exists when the market is actually moving.
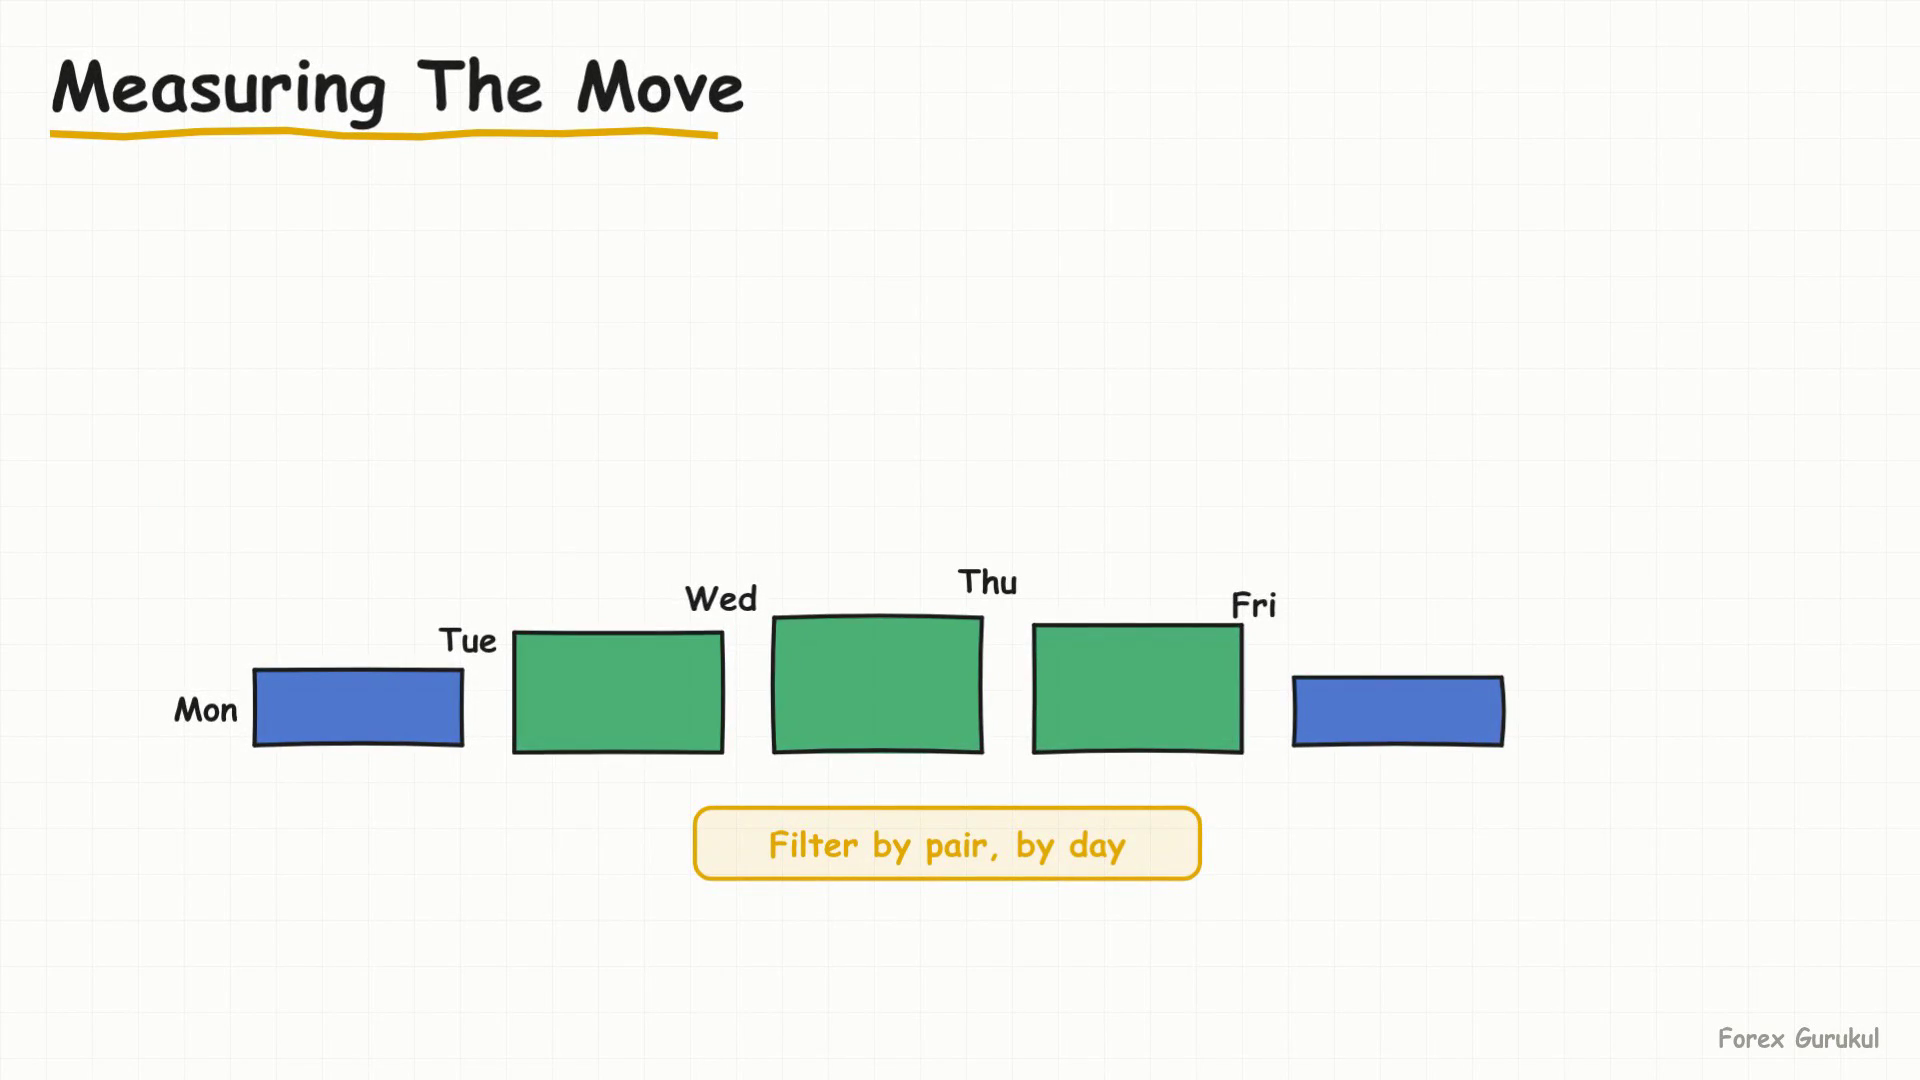
This is where a volatility tool earns its spot in your routine. Feed it a pair and it pulls historical daily ranges, broken down by day of the week and hour of the day, in pips or percent. As of mid-2026, EUR/USD sits in what analysts call a common low volatility regime — averaging roughly 50-70 pips of daily movement, down from the 70-90 pip range seen earlier in the year, and well below the 110-130 pip days of 2021-2022.
Lower baseline volatility doesn't mean no opportunity — it means being picky about *when* inside the week and the day you actually engage matters even more than it used to.
Where The Money Moves, The Weekly Shape
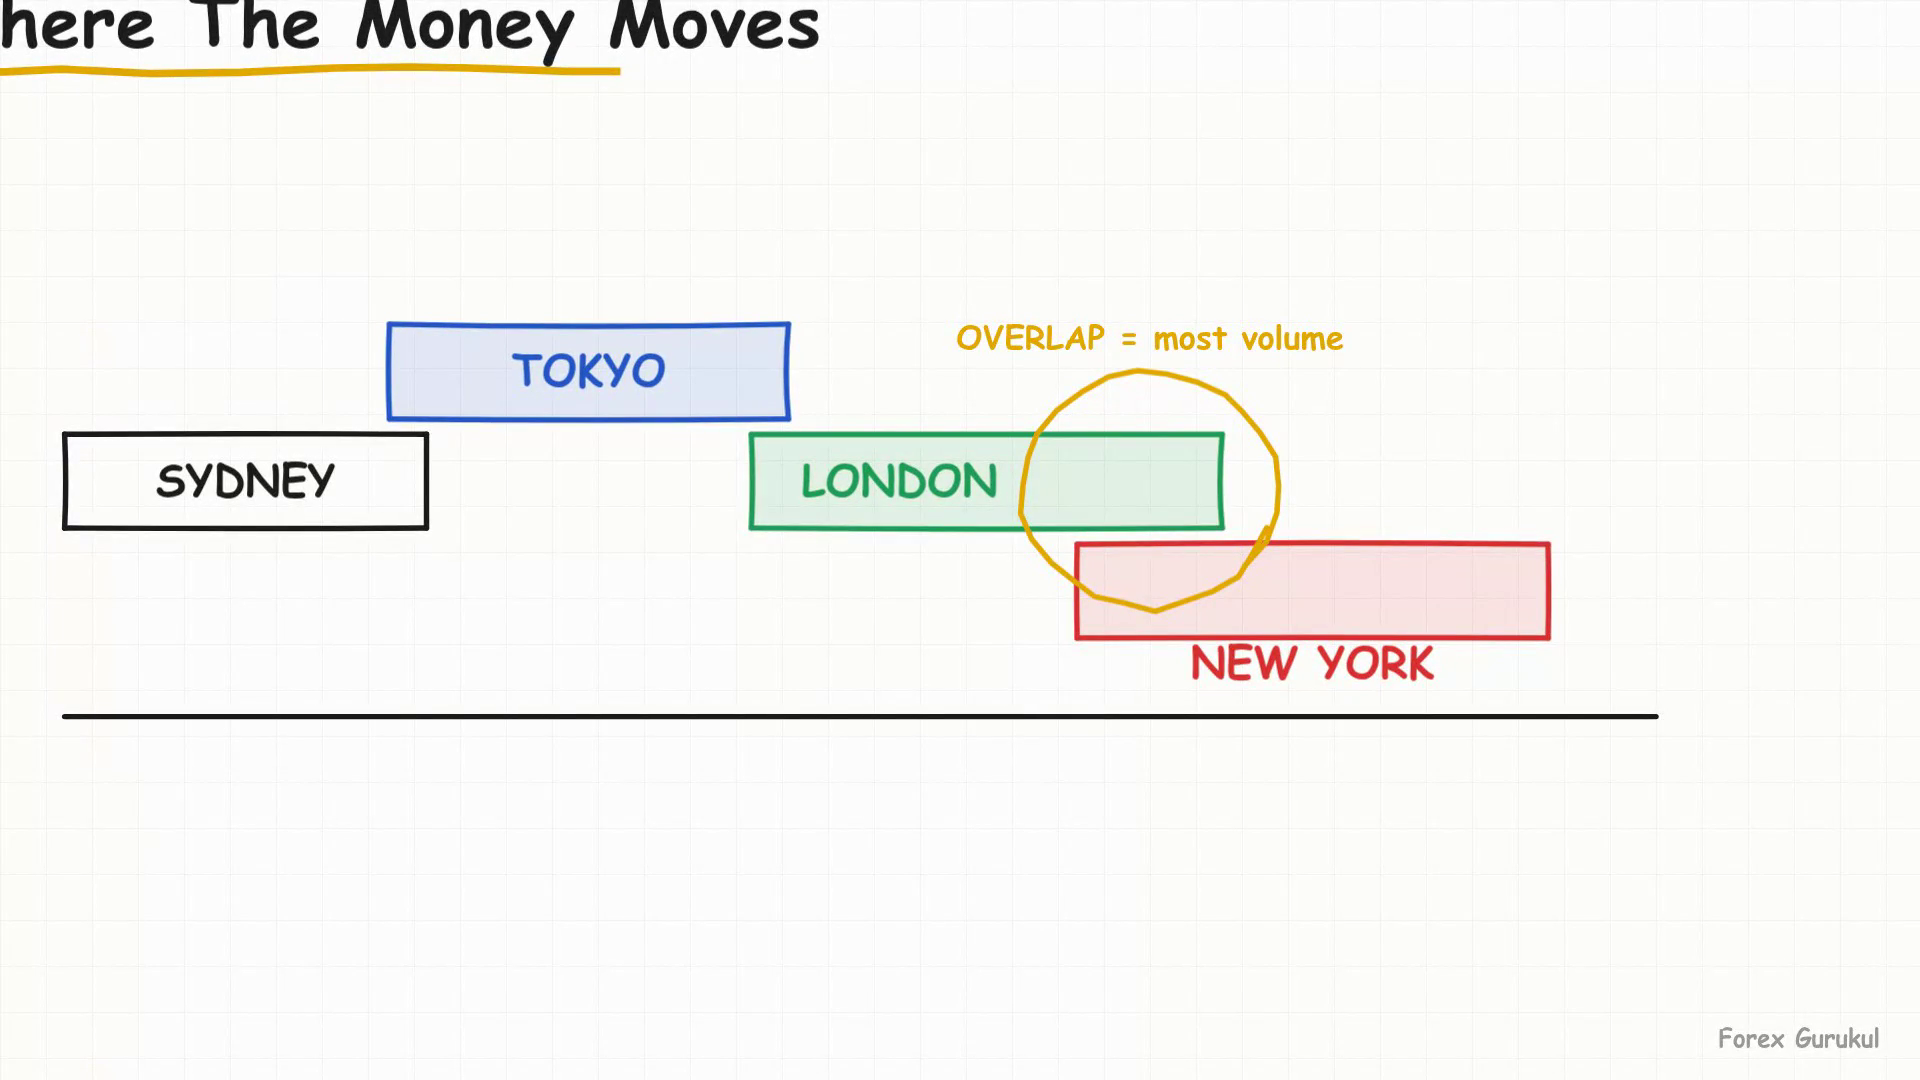
Guess which two sessions overlapping create the single busiest window in all of forex before reading on. It's London and New York, roughly 8am to noon Eastern. European desks handle the largest share of daily currency volume on the planet, and for four hours a day they're trading at the exact same time as every major U.S. bank and fund.
One striking stat: over the last three months, the New York session has broken at least one side of the pre-existing London session's high or low 95.45% of the time — 70% of the time breaking only one side, 26% of the time breaking both. That's not noise. That's the overlap doing the heavy lifting, every single day.
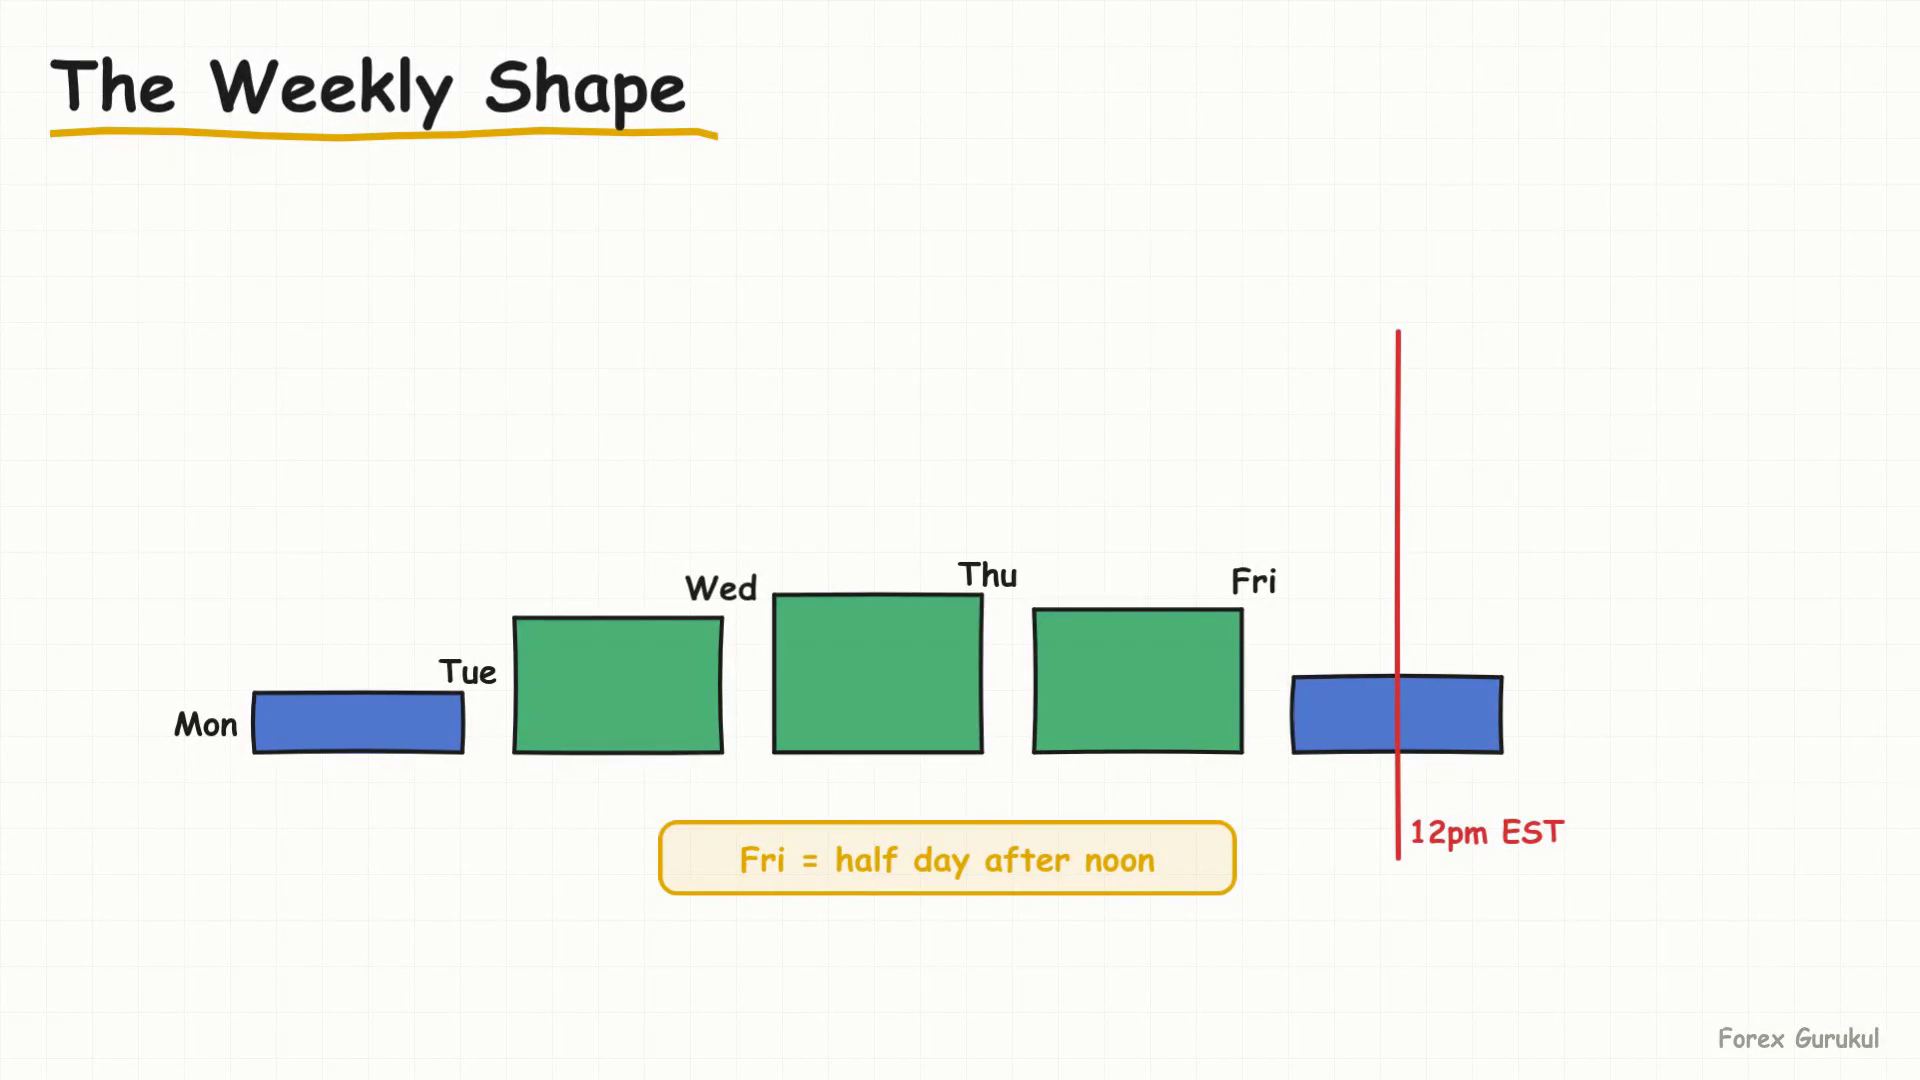
Zoom out to the full week and a pattern appears. A recent 10-week average of EUR/USD daily movement shows it clearly:
| Day | Avg. Daily Range (pips) | Character |
|---|---|---|
| Monday | 55 | Waking up — Asia/Europe re-establishing rhythm |
| Tuesday | 63 | Full participation begins |
| Wednesday | 56 | Meat of the week, heavy news flow |
| Thursday | 65 | Widest average range of the week |
| Friday | 63 | Strong through the overlap, fades hard after noon |
Source: 10-week EUR/USD average, mid-2026. Tuesday and Thursday consistently print the widest ranges; Monday is the quietest full session.
Times To Sit On Your Hands
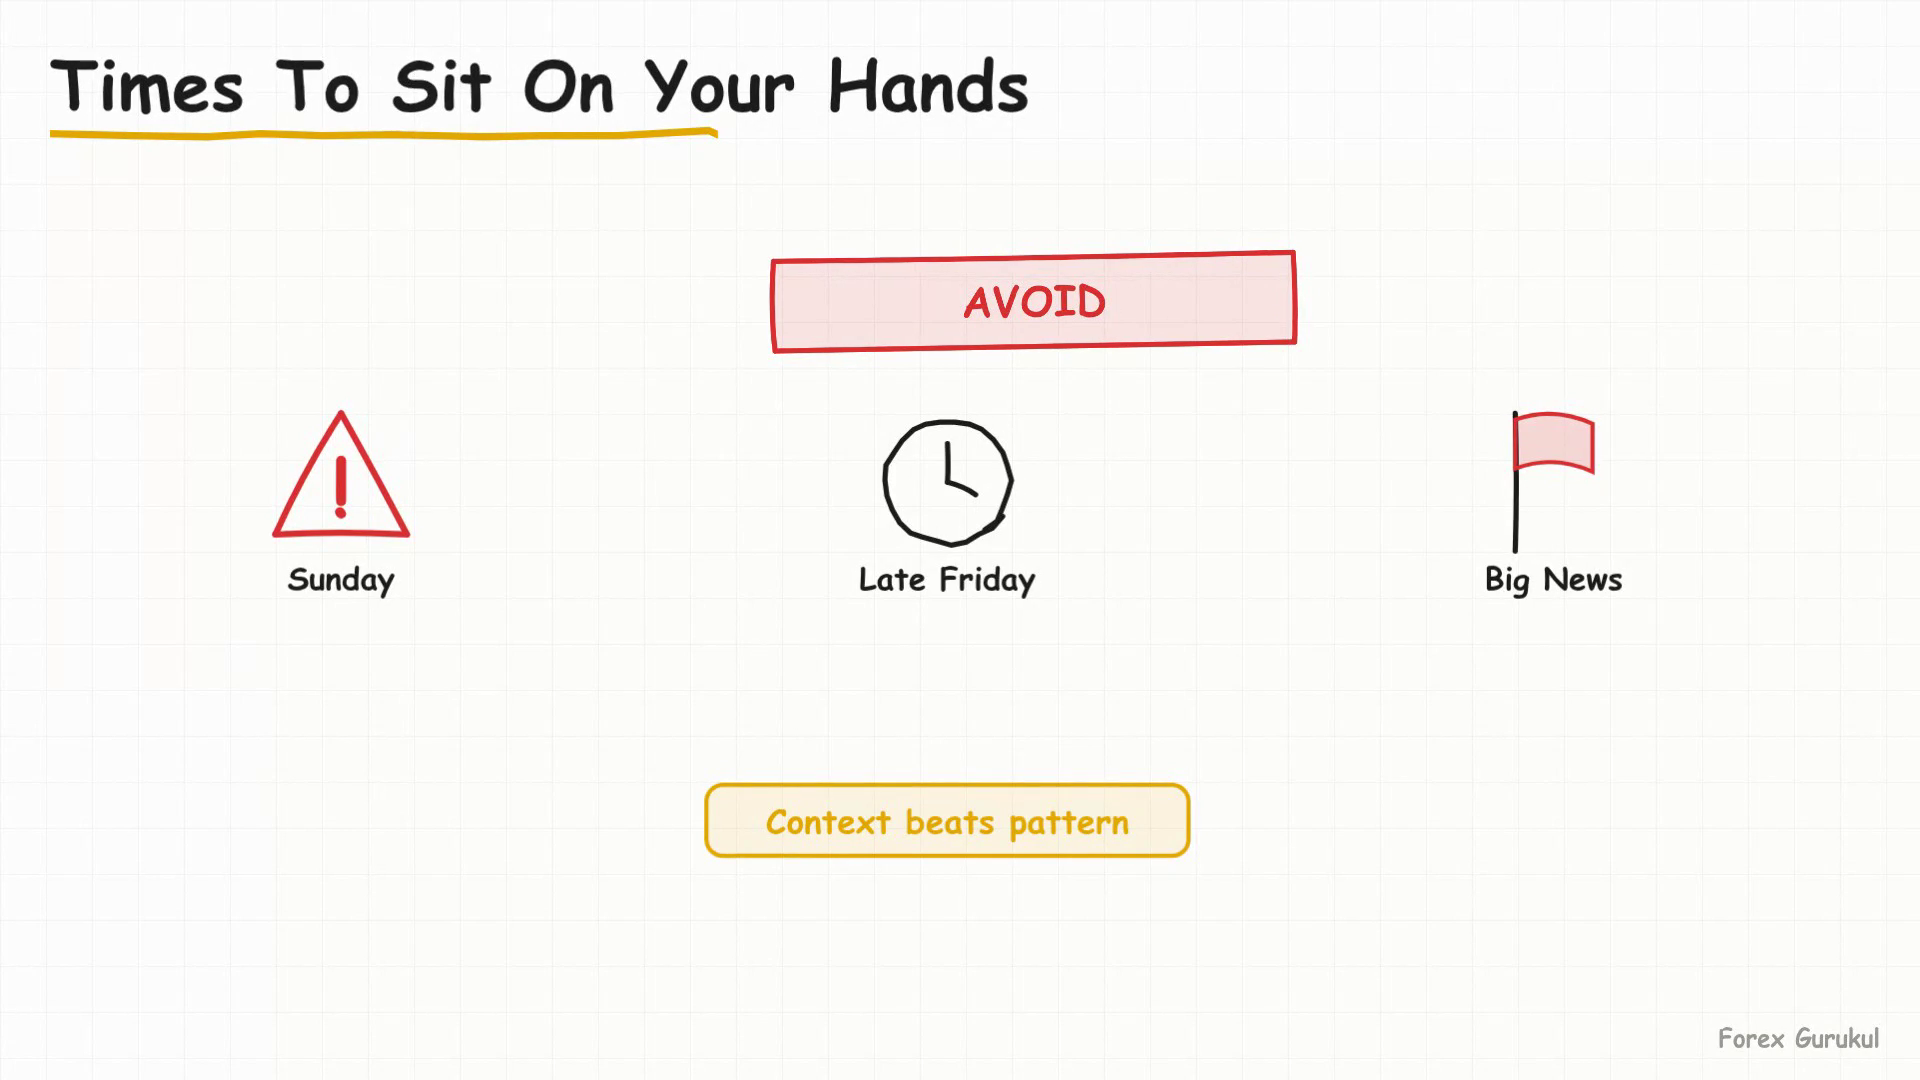
Three windows deserve a hard no, regardless of how good your setup looks:
| Window | Why It's Dangerous |
|---|---|
| Sunday evening (open through ~10pm ET) | Thin liquidity, exaggerated moves, fake range |
| Friday after ~noon ET | Desks book profits and head into the weekend; spreads widen, moves stop meaning anything |
| 60 seconds around major scheduled news | Not trending — a coin-flip with extra zeros, prone to violent whipsaws that stop out both sides |
Euro Dollar, Live & Bull Flag Inside The Overlap
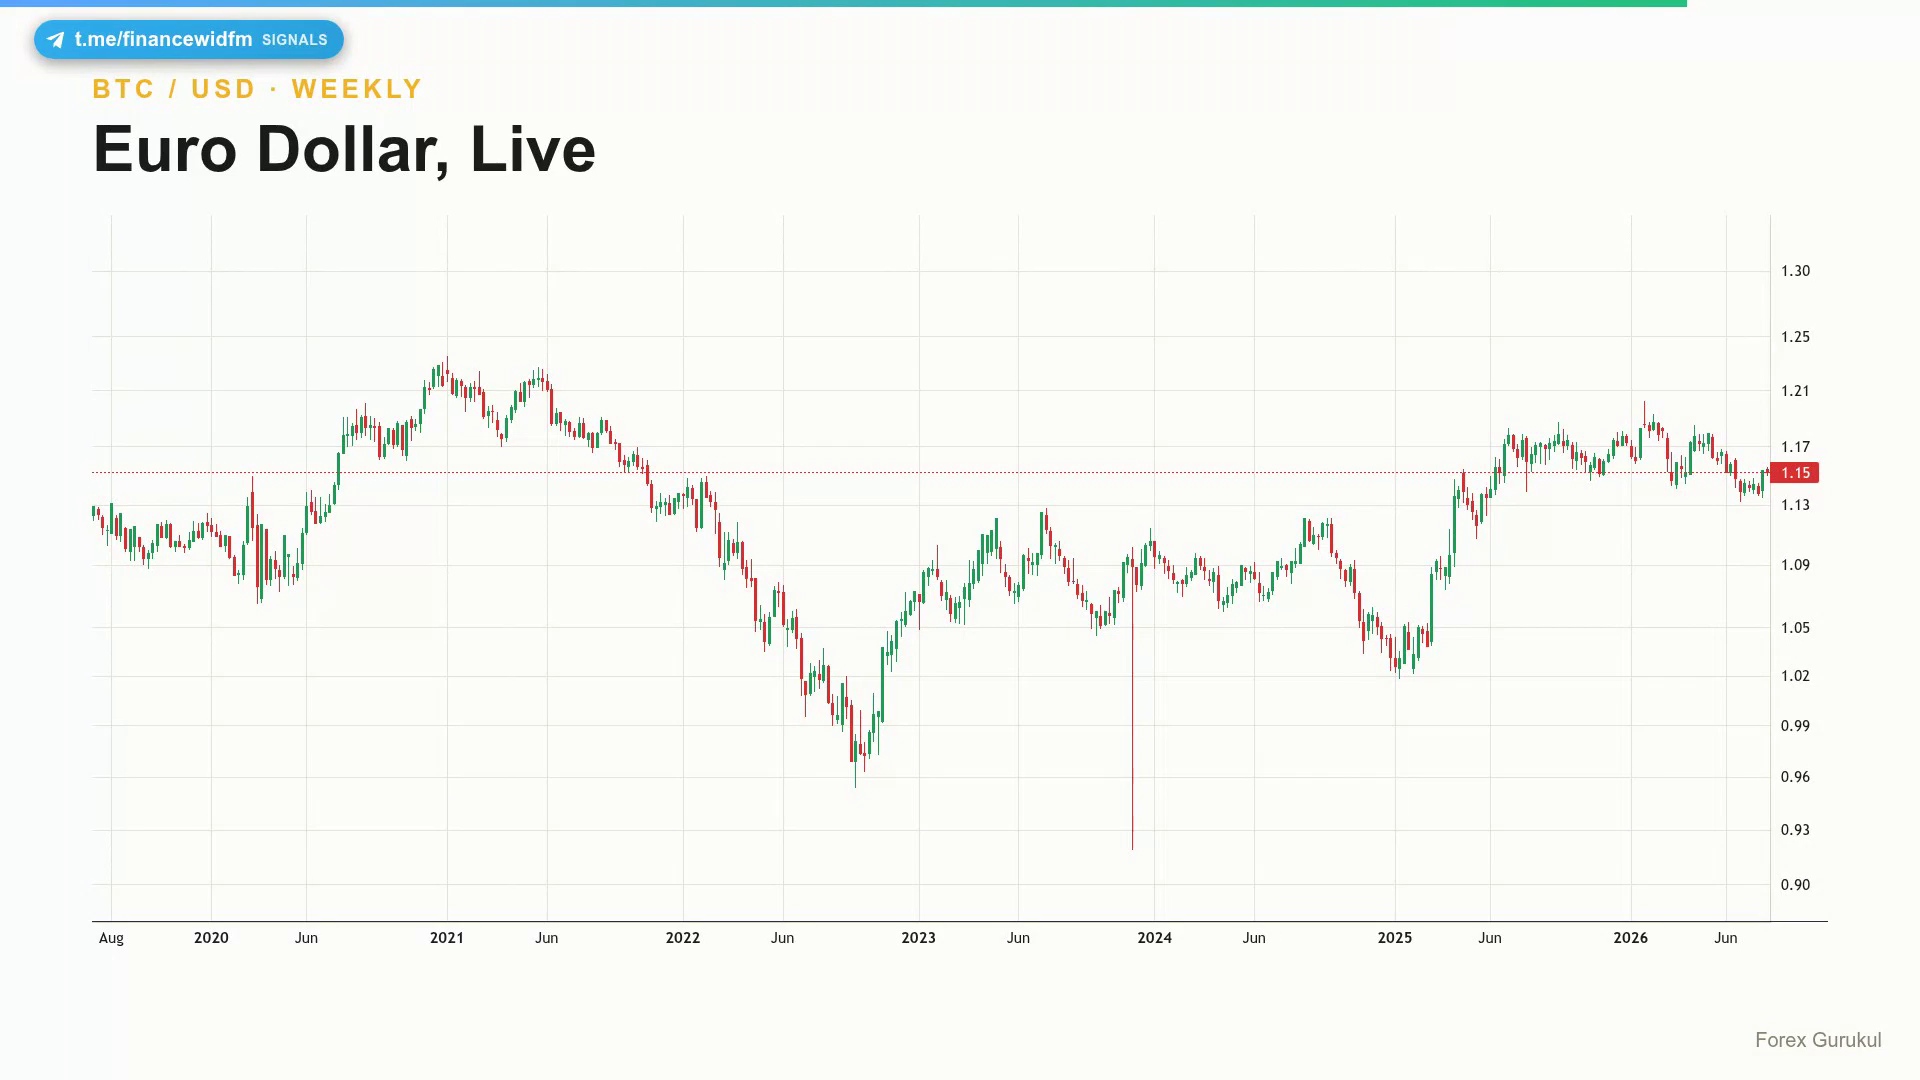
Let's hunt for this live on EUR/USD, currently trading around 1.1516. The first move isn't staring at candle shapes — it's checking the clock. Are we inside the London/New York overlap? Second: is candle size expanding versus the last few days, or is the market still asleep? Third: has a scheduled release just printed — if so, give it a few minutes to settle before trusting the direction.
Only once time and range agree do you start looking for an actual setup. Context first, pattern second — every single time.
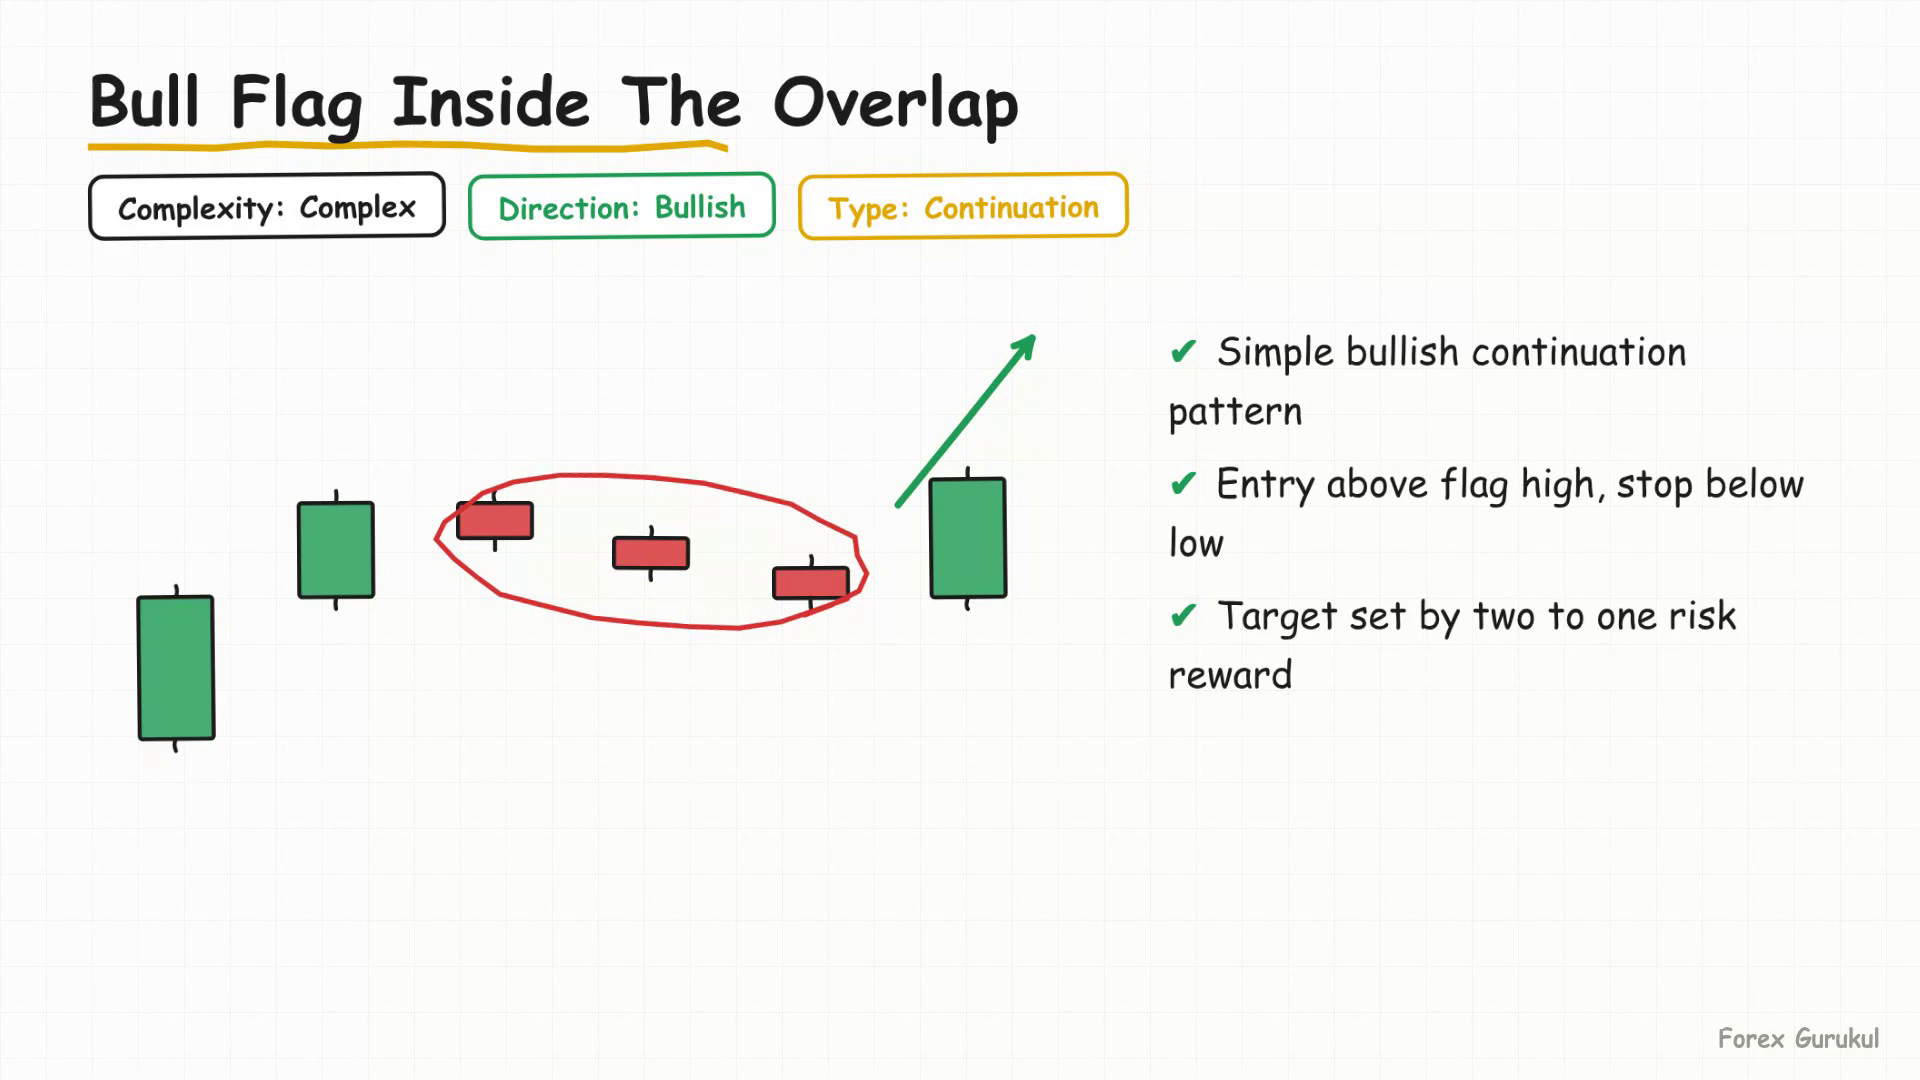
Say price shoves higher right as the overlap opens, then pulls back into a tight flag for a few candles. Classify it out loud: bullish, continuation — betting the original push keeps going, not reversing.
| Element | Rule |
|---|---|
| Entry trigger | Break above the flag's high |
| Stop loss | Just under the flag's low, with a little wiggle room for noise |
| Target | Minimum 2:1 reward-to-risk — 20 pip risk needs at least 40 pips of target |
| Invalidation | Price breaks the flag and reverses into your stop — that's the plan working, not failing |
Building A Schedule, A Different Clock
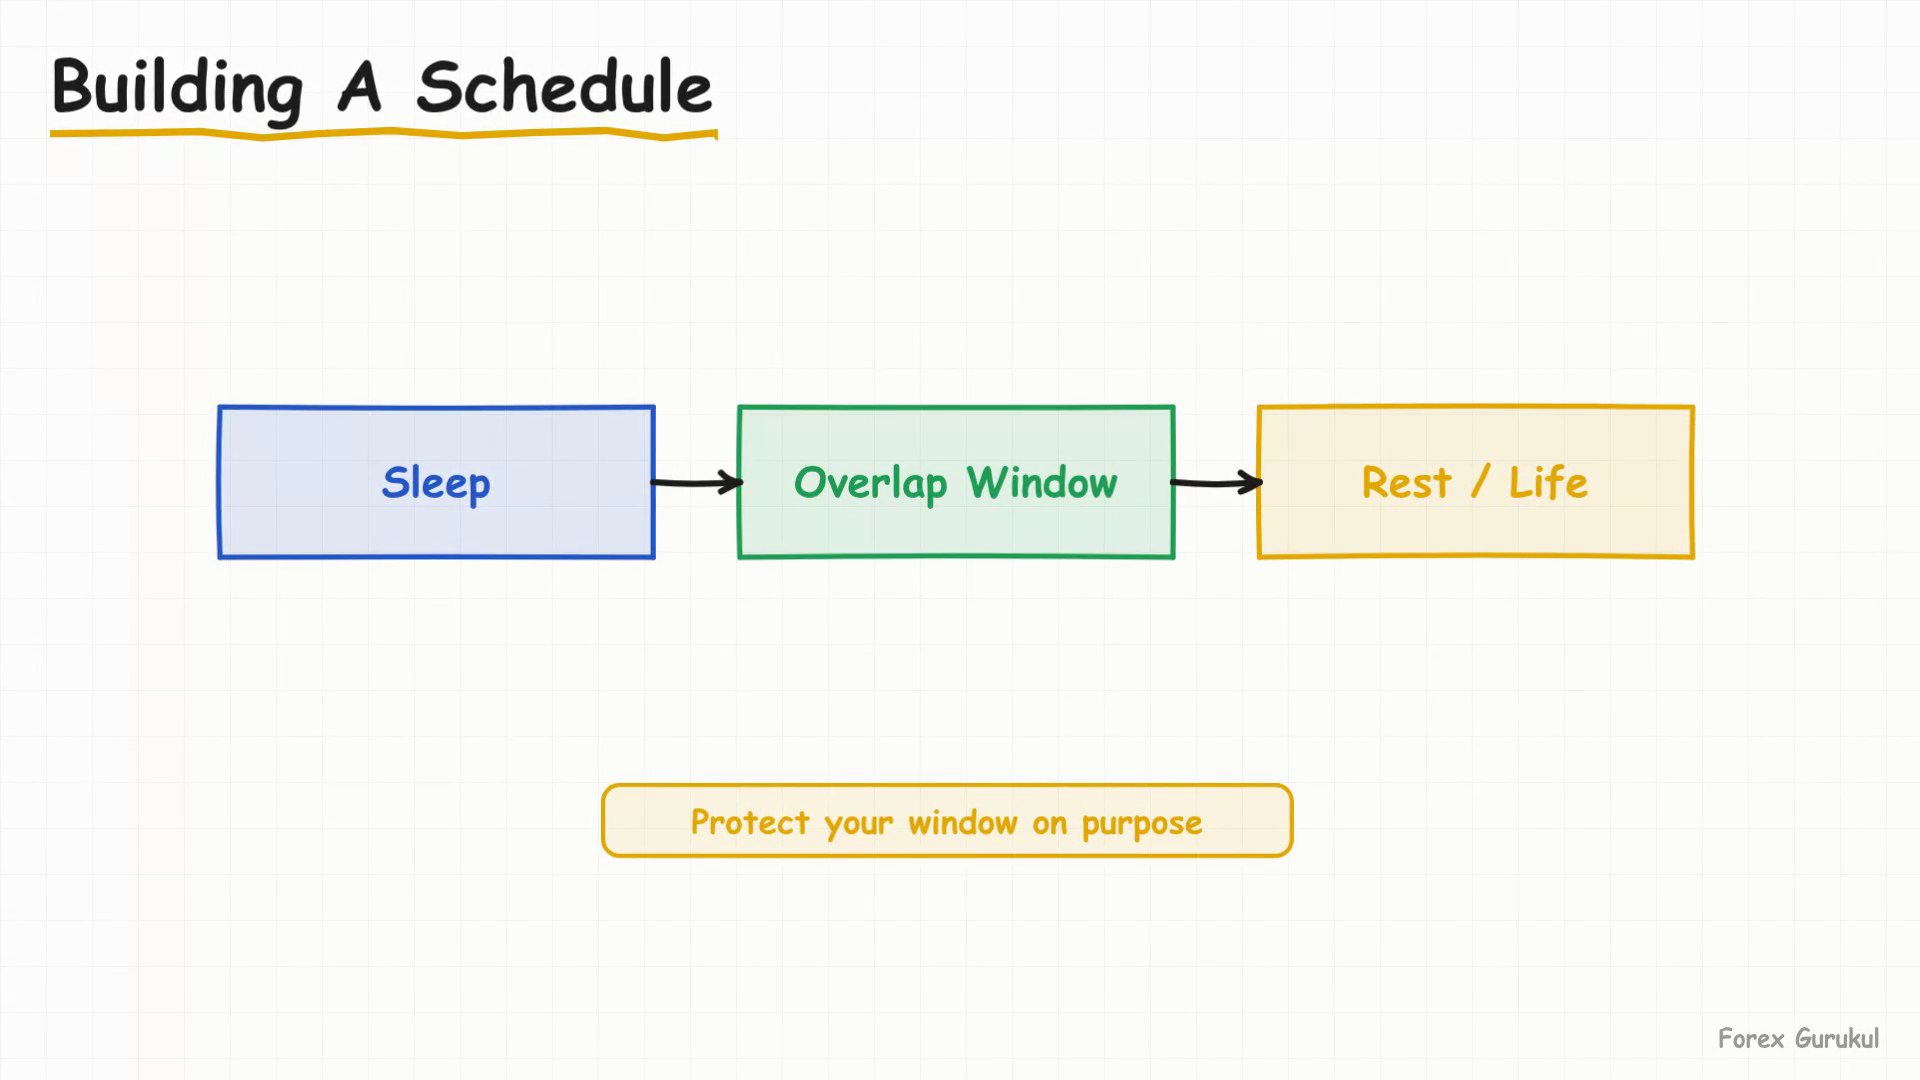
Put the data into an actual weekly routine rather than a mental note you'll forget by Wednesday:
| Day/Time (ET) | Action |
|---|---|
| Sun 5pm–10pm | No new trades — observe only |
| Mon all day | Light size, wait for range to build |
| Tue–Thu, 8am–noon | Primary trading window — highest average range, most reliable overlap |
| Fri, 8am–noon | Trade normally, tighten stops |
| Fri, after noon | Flat or defensive only — no new positions |
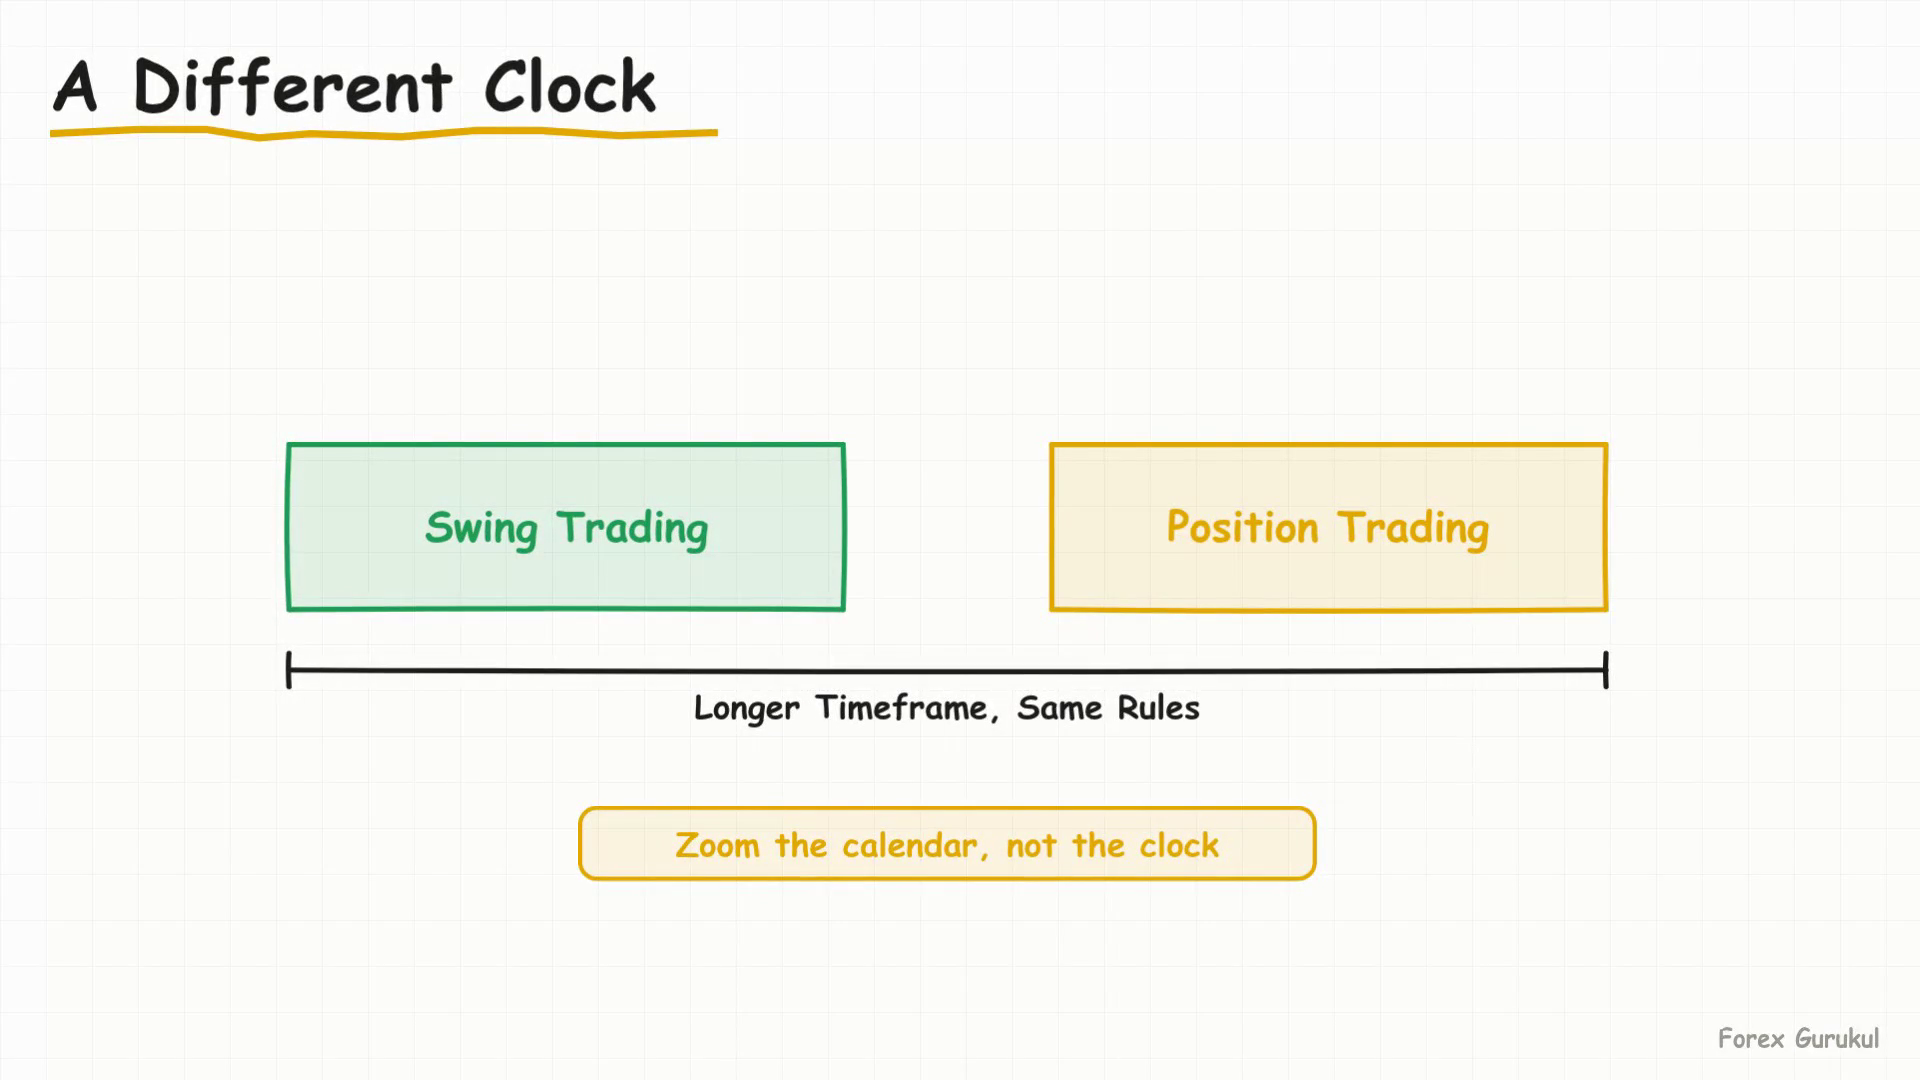
The forex week runs on a different clock than your kitchen calendar: it opens 5pm Eastern Sunday (Monday morning in Sydney/Tokyo) and closes 5pm Eastern Friday, when banks reconcile books and liquidity evaporates fast. If you're trading from outside the U.S., convert the 8am–noon Eastern overlap to your local time and anchor your schedule to that window, not to your own morning or evening habits.
The Weekly Trading Map
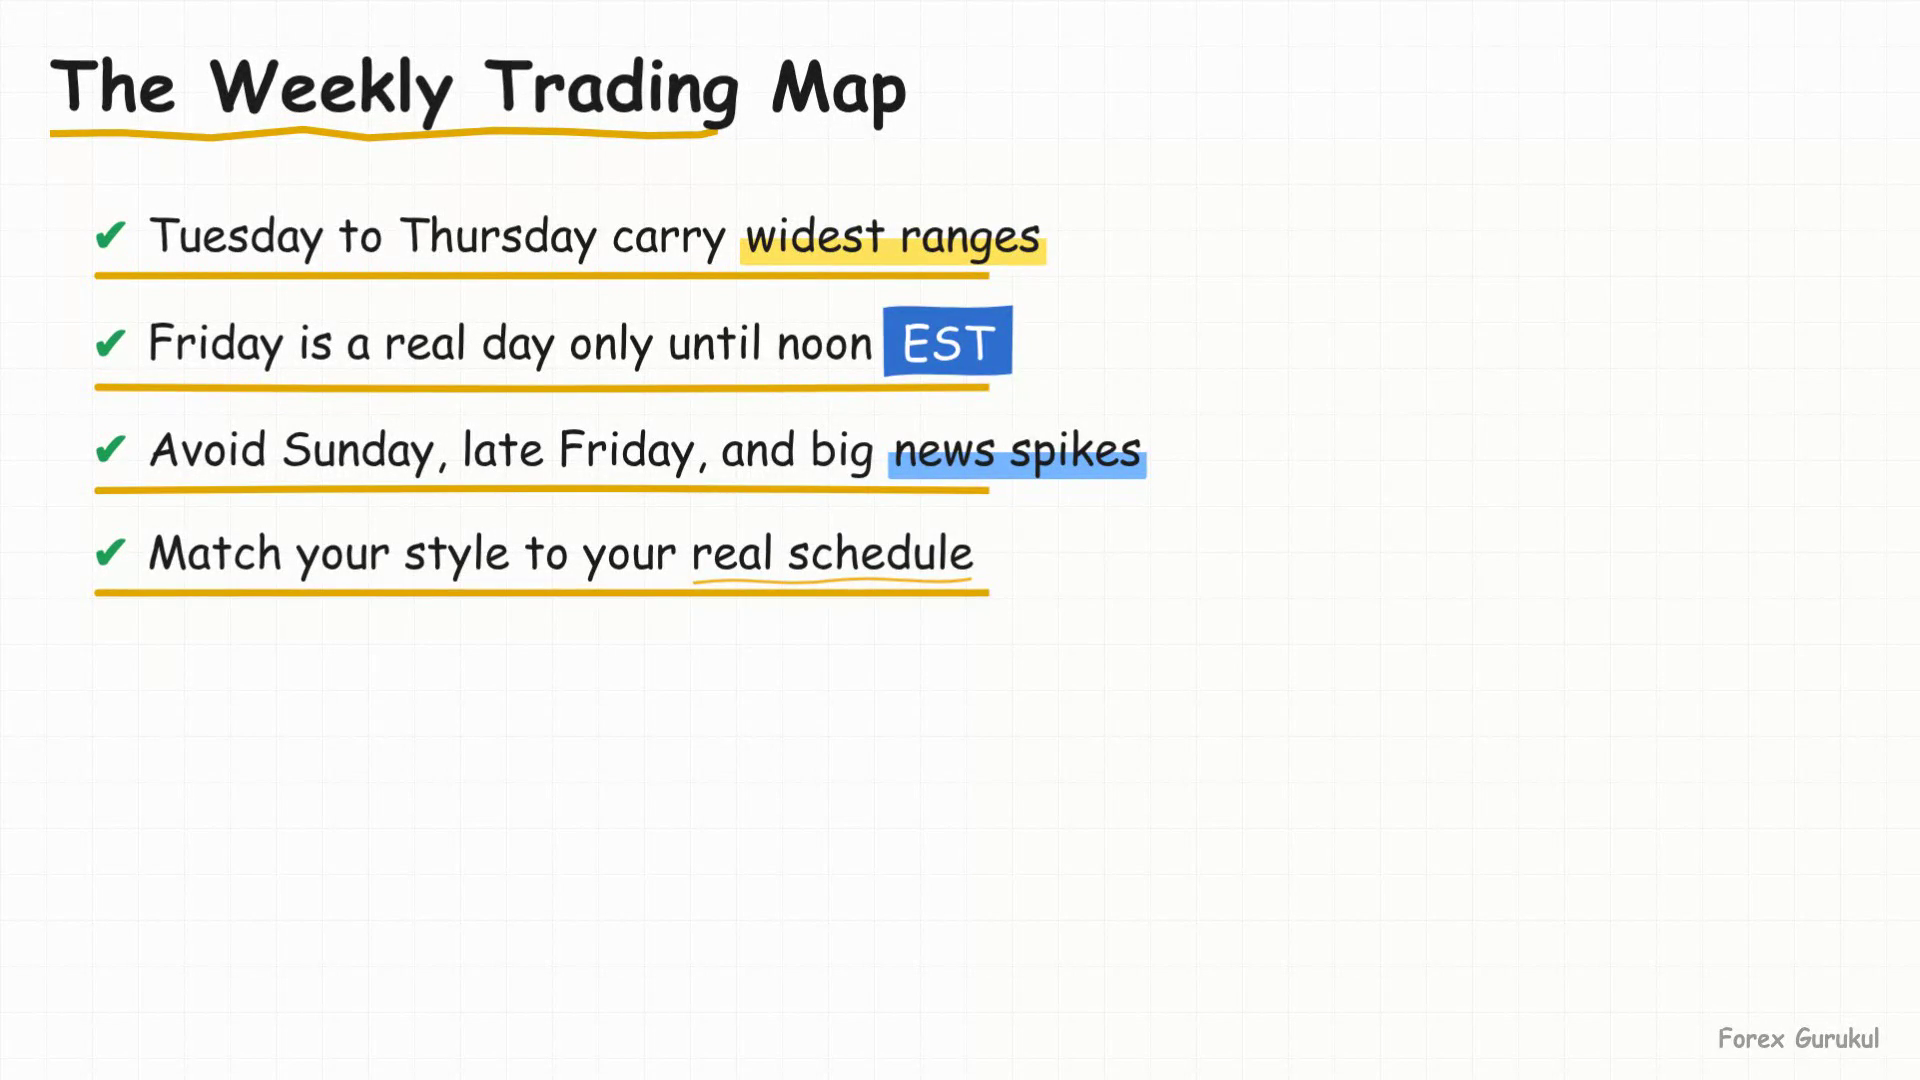
Put it all together and the map is simple. Skip Sunday evening. Ease into Monday. Hunt hardest Tuesday through Thursday inside the London/New York overlap. Trade Friday morning like a normal day and treat Friday afternoon like the market is already closed — because for practical purposes, it is.
None of this requires a better indicator. It requires respecting that liquidity, not price, is what actually makes a setup tradeable — and EUR/USD's own volatility data, sitting near 1.1516 with a compressed but still workable 50-70 pip average daily range, proves the pattern holds even in a quieter 2026 market.
Key takeaways
- Sunday evening (5pm–10pm ET) has the thinnest liquidity of the week — moves are exaggerated and often reverse fast, tagging stops on both sides.
- The London/New York overlap (roughly 8am–noon ET) is the single busiest window in forex, with New York breaking London's high or low over 95% of the time.
- Tuesday and Thursday consistently print the widest average daily ranges for EUR/USD (63-65 pips in mid-2026 data); Monday is the quietest full session.
- Friday afternoon after the noon ET cutoff behaves like a half-day dressed up as a full one — spreads widen and moves stop meaning much.
- Context (time and volatility) should always be checked before pattern — a bull flag inside the overlap carries far more weight than the same shape at 11pm on Sunday.
Frequently asked questions
What are the best days to trade forex?
Tuesday, Wednesday and Thursday consistently show the widest average daily ranges for major pairs like EUR/USD, with Tuesday and Thursday typically leading. Monday tends to be quieter as markets re-establish rhythm.
Why is Sunday a bad time to trade forex?
The forex market technically opens Sunday at 5pm Eastern, but most major banks and funds in Asia and Europe aren't fully active yet. Thin liquidity means small orders move price disproportionately, widening spreads and producing false moves that reverse quickly.
What is the London/New York overlap and why does it matter?
It's the window, roughly 8am to noon Eastern, when both the London and New York trading sessions are simultaneously active. Since Europe handles the largest share of daily forex volume and the U.S. session runs alongside it, this window consistently produces the most reliable price movement of the day.
Is it bad to trade forex on Friday afternoon?
Yes, generally. Friday morning through the overlap trades normally, but after roughly noon Eastern, liquidity drains fast as desks book profits ahead of the weekend close, making spreads wider and price action less trustworthy.
How do I check forex volatility by day of week myself?
Free volatility tools (such as those from MarketMilk/BabyPips or historical range trackers) let you pull average pip movement for any pair broken down by day of week and hour of day, turning 'best days to trade' from a guess into a checkable chart.