Daily market analysis
Charts first. Numbers we computed ourselves.
Every piece here is the written half of a video — the same charts, the same levels, read end to end. No recycled headlines.
 ▶ Video
Margin Trading: Avoid Margin Calls With One Calculation
Margin trading can make a manageable position dangerous when traders watch balance instead of equity. Learn the one margin-level calculation that reveals how much room remains before a broker restricts or closes your trades.
Coins we track
All 14 coinsEach coin has one page that we update every day — chart analysis, Elliott Wave count and derivatives positioning, with the weekly and monthly outlook alongside it.
Latest
 ▶ Video
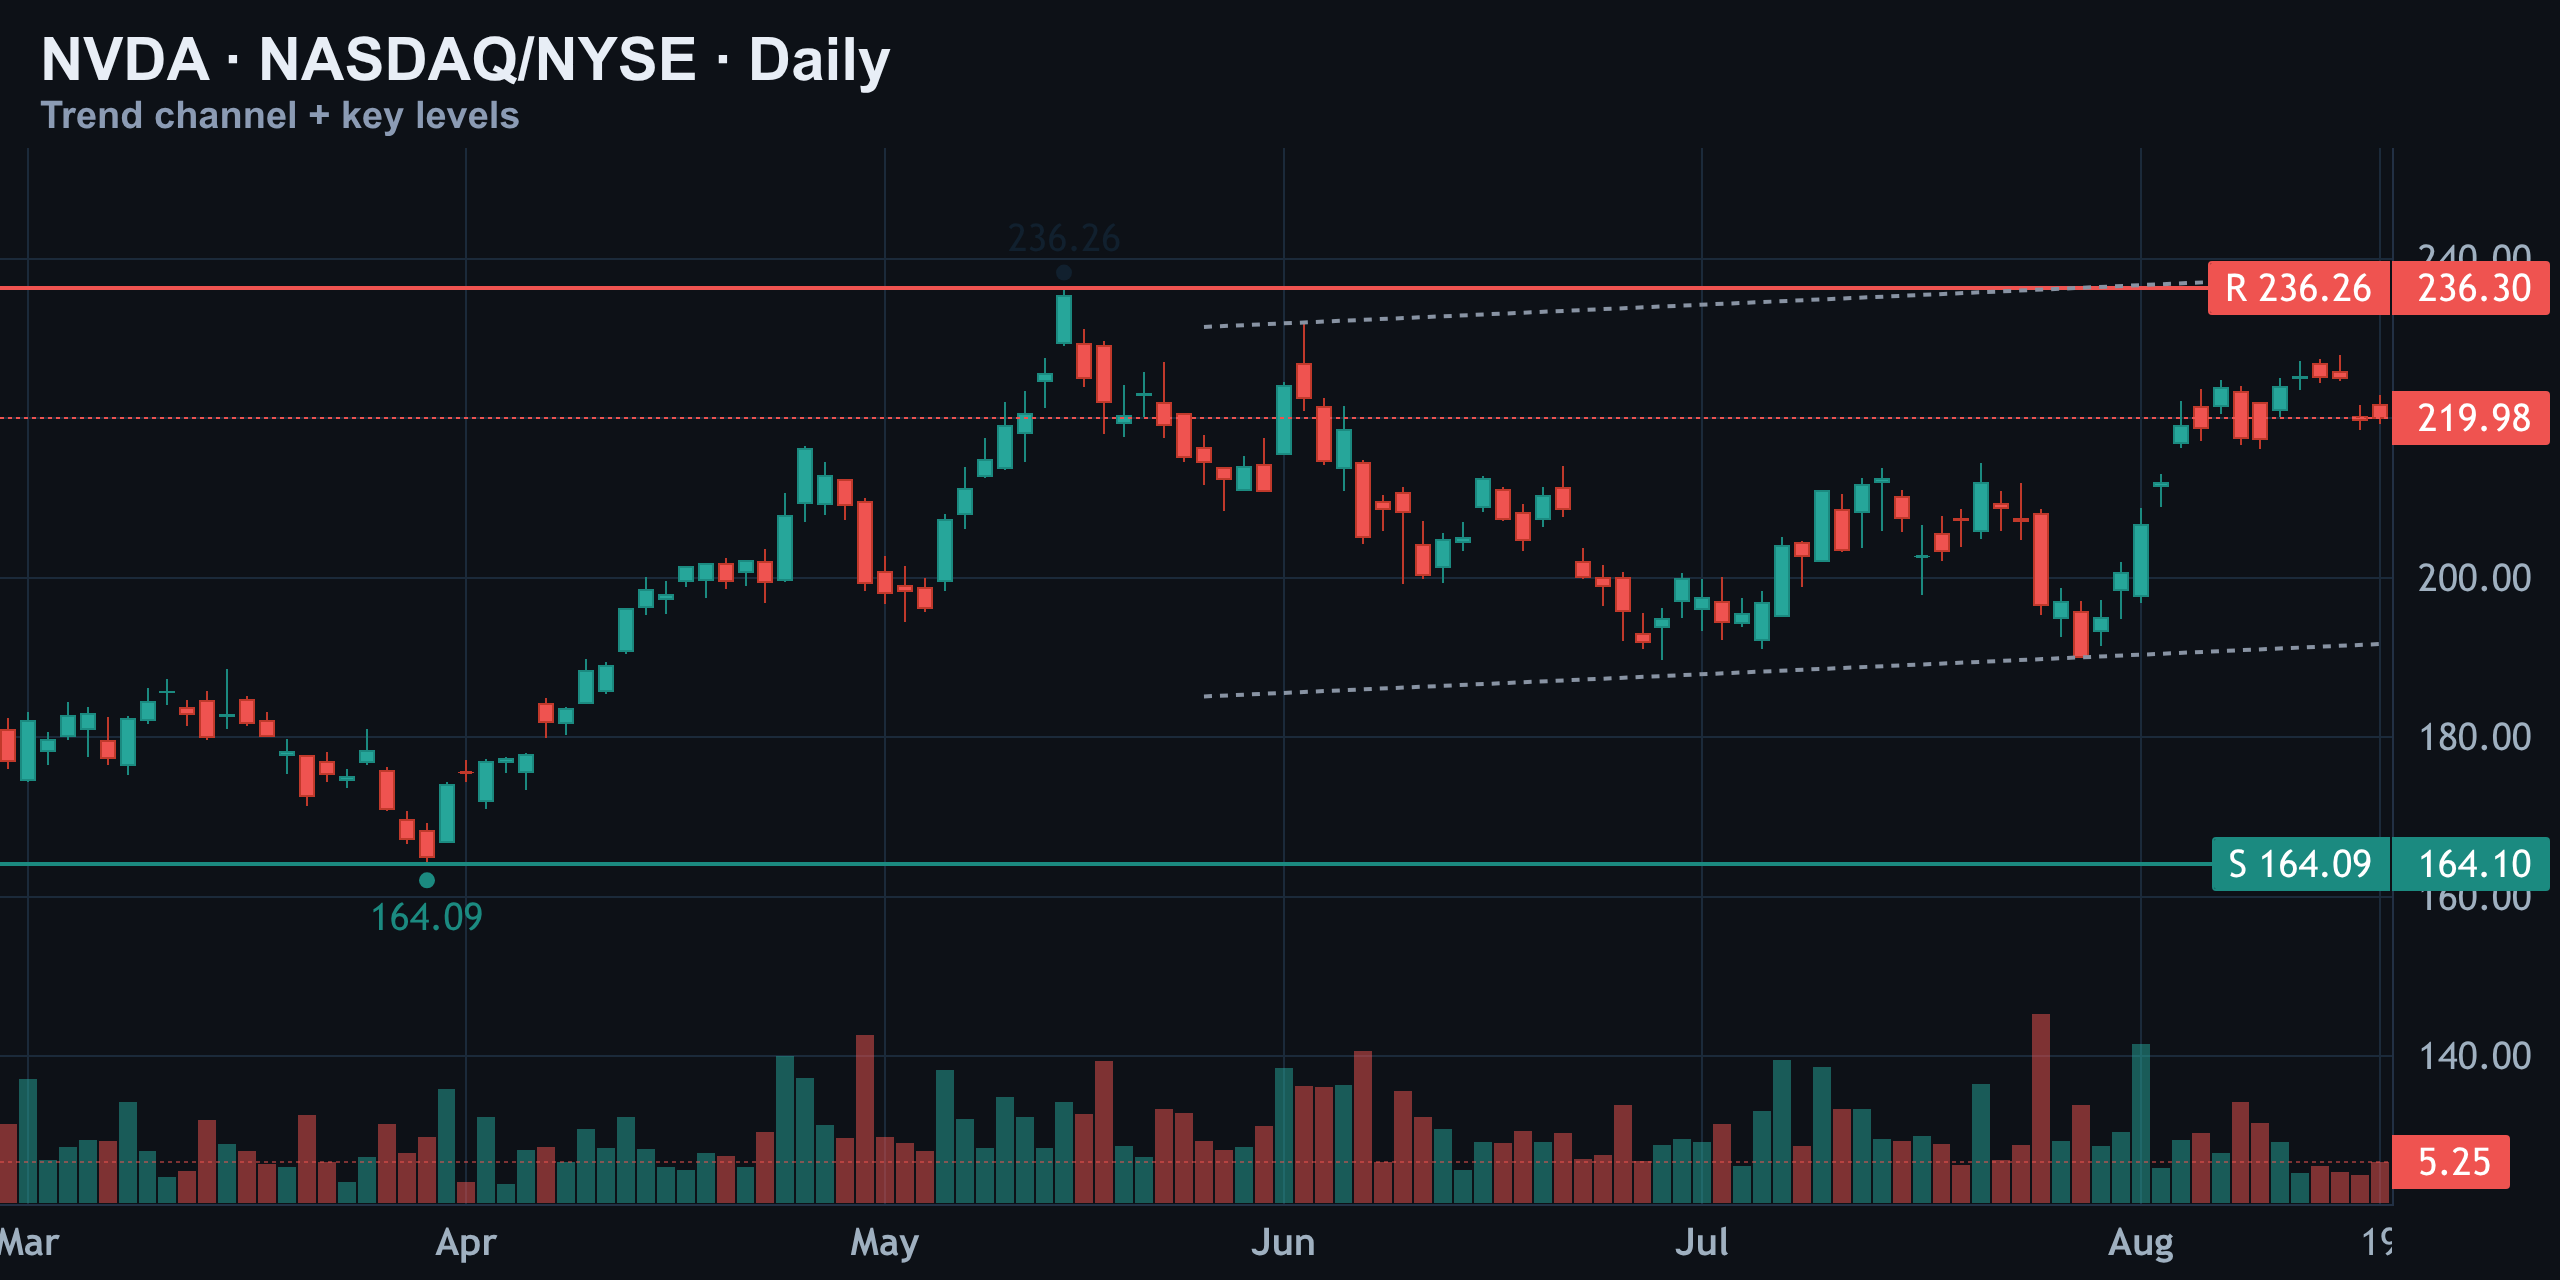
NVDA at $220: Bull Flag Breakout or Wave 5 Exhaustion?
Nvidia just kissed its all-time high near $236 and is now coiling right at the options max pain zone. We break down the daily, hourly, and weekly charts to see whether this is a bull flag setup or exhaustion before a Wave C reversal.
 ▶ Video
Free Margin Explained: Why Zero Free Margin Locks You Out
Free margin is the quiet number that decides whether your broker lets you open your next trade or locks you out mid-move. Here is exactly how it is calculated, how floating profit and loss push it up and down, and what really happens when it hits zero.
 ▶ Video
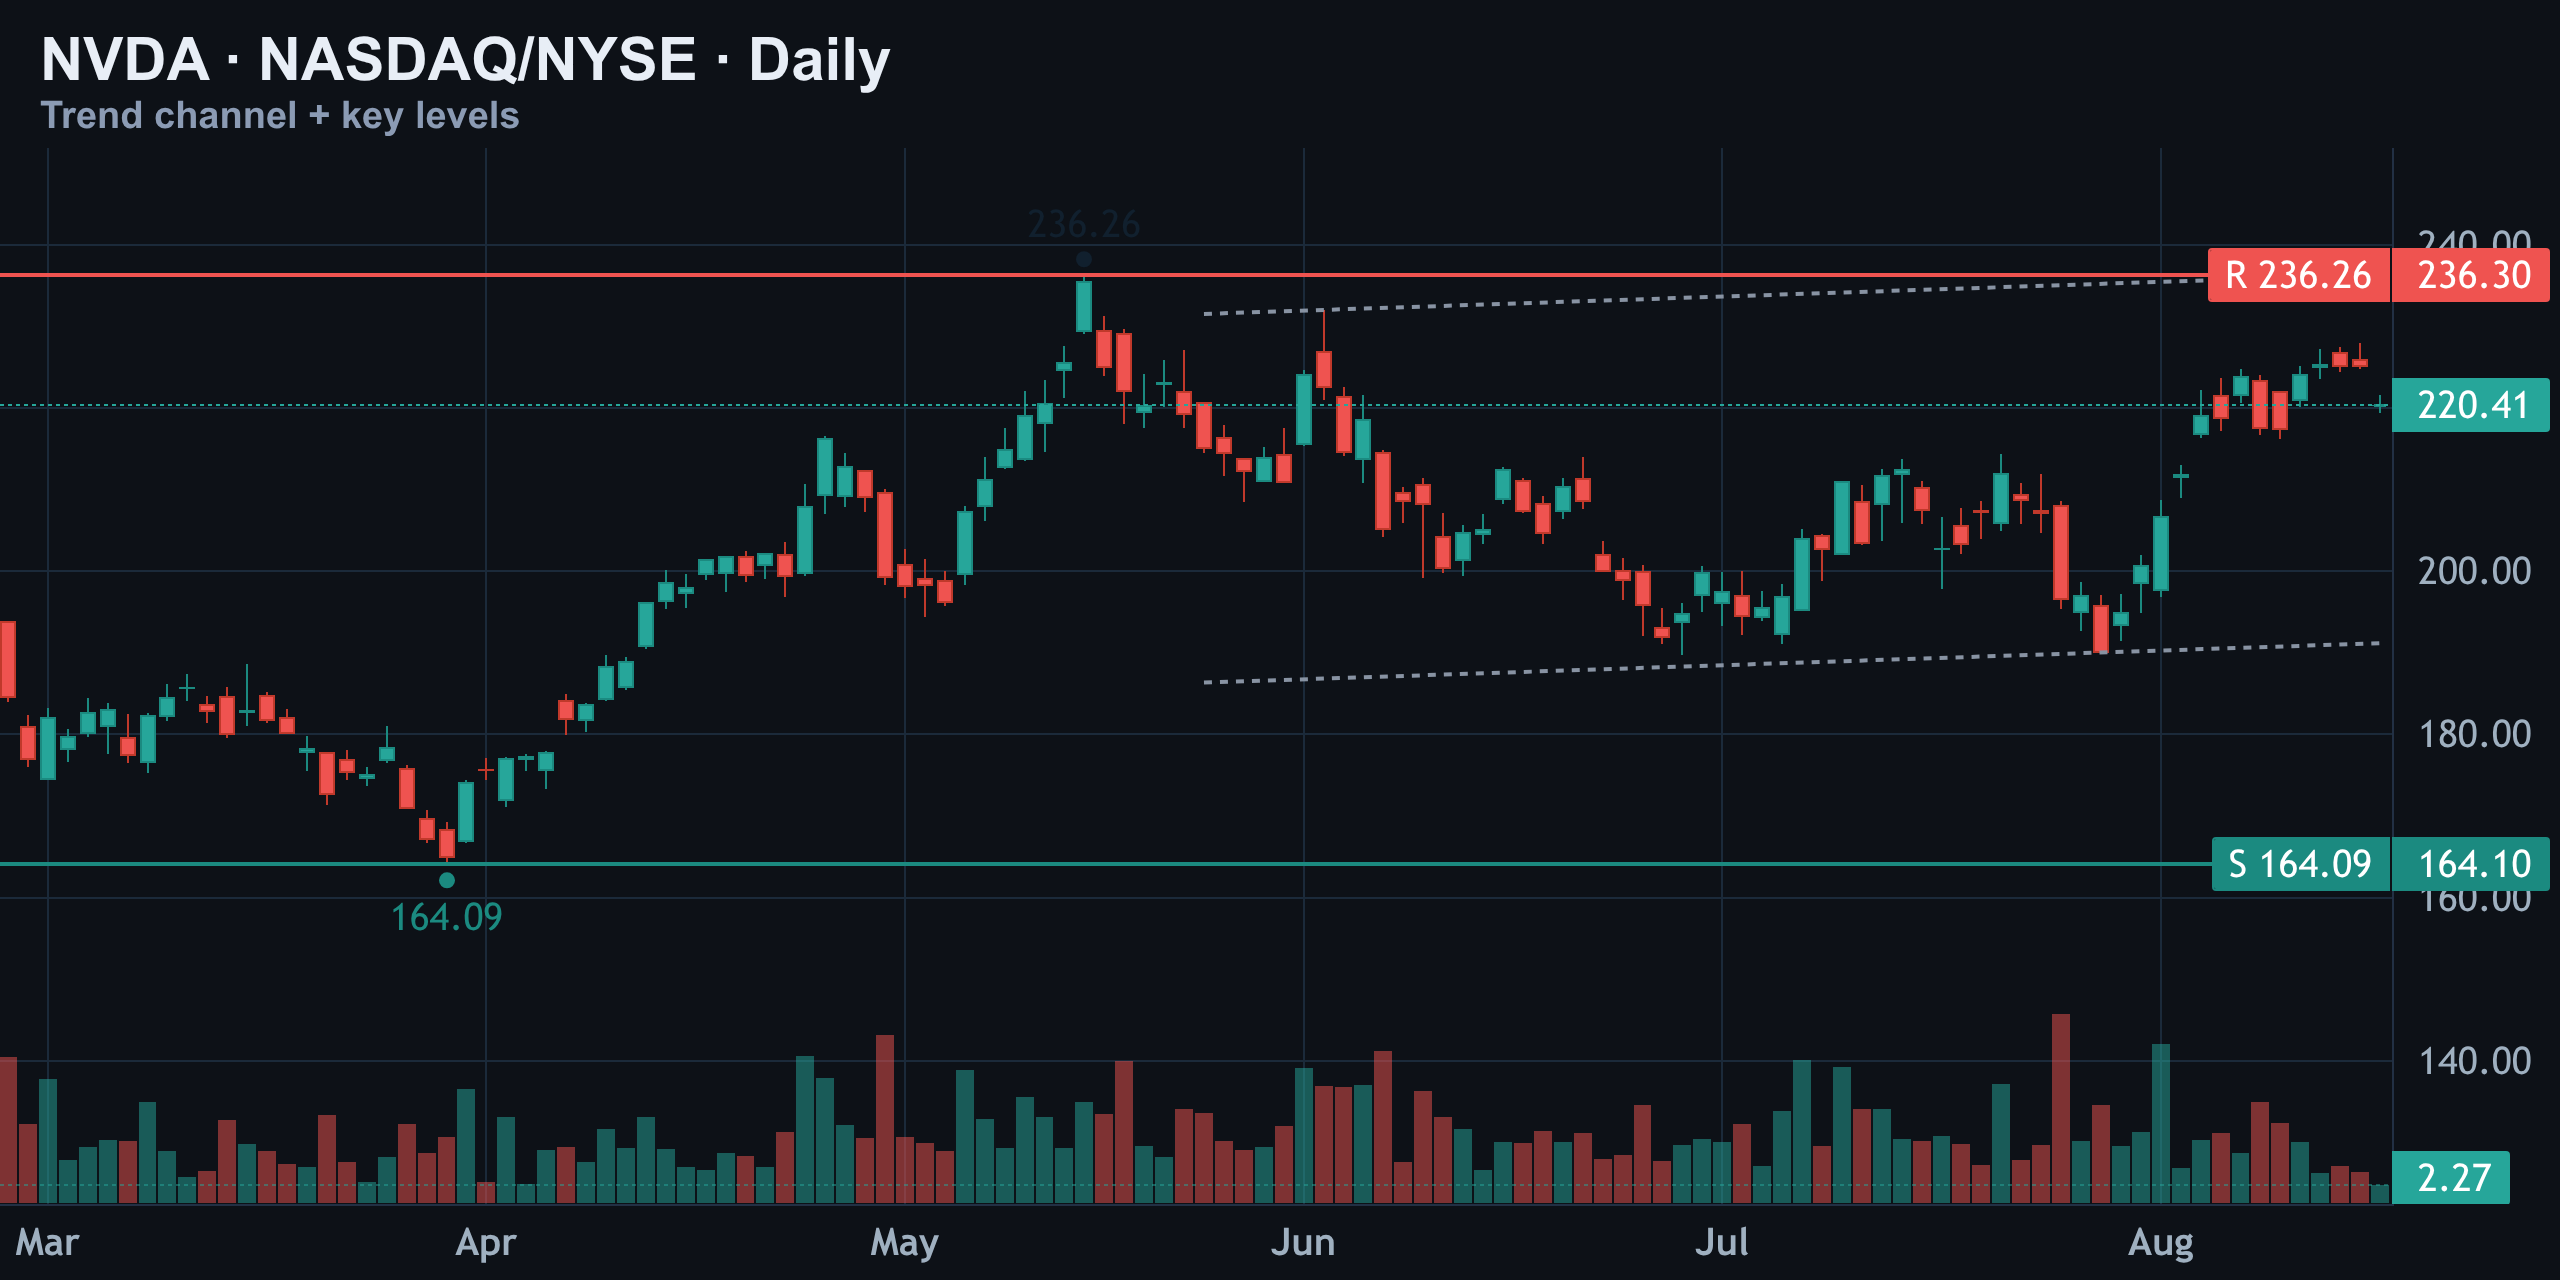
NVDA at $236: Bull Flag Breakout or Wave B Trap?
NVDA is pressing against its old $236.30 high with every short-term indicator flashing bullish — but the weekly Elliott Wave count is quietly warning this rally could be a wave B trap before a much larger wave C decline.
 ▶ Video
What Is Equity In Forex? Why Your Balance Can Lie
Your balance is a frozen number, but equity moves with every tick. Here is the exact formula behind equity, why it can sit thousands away from your balance, and how to act before that gap turns into a margin call.
 ▶ Video
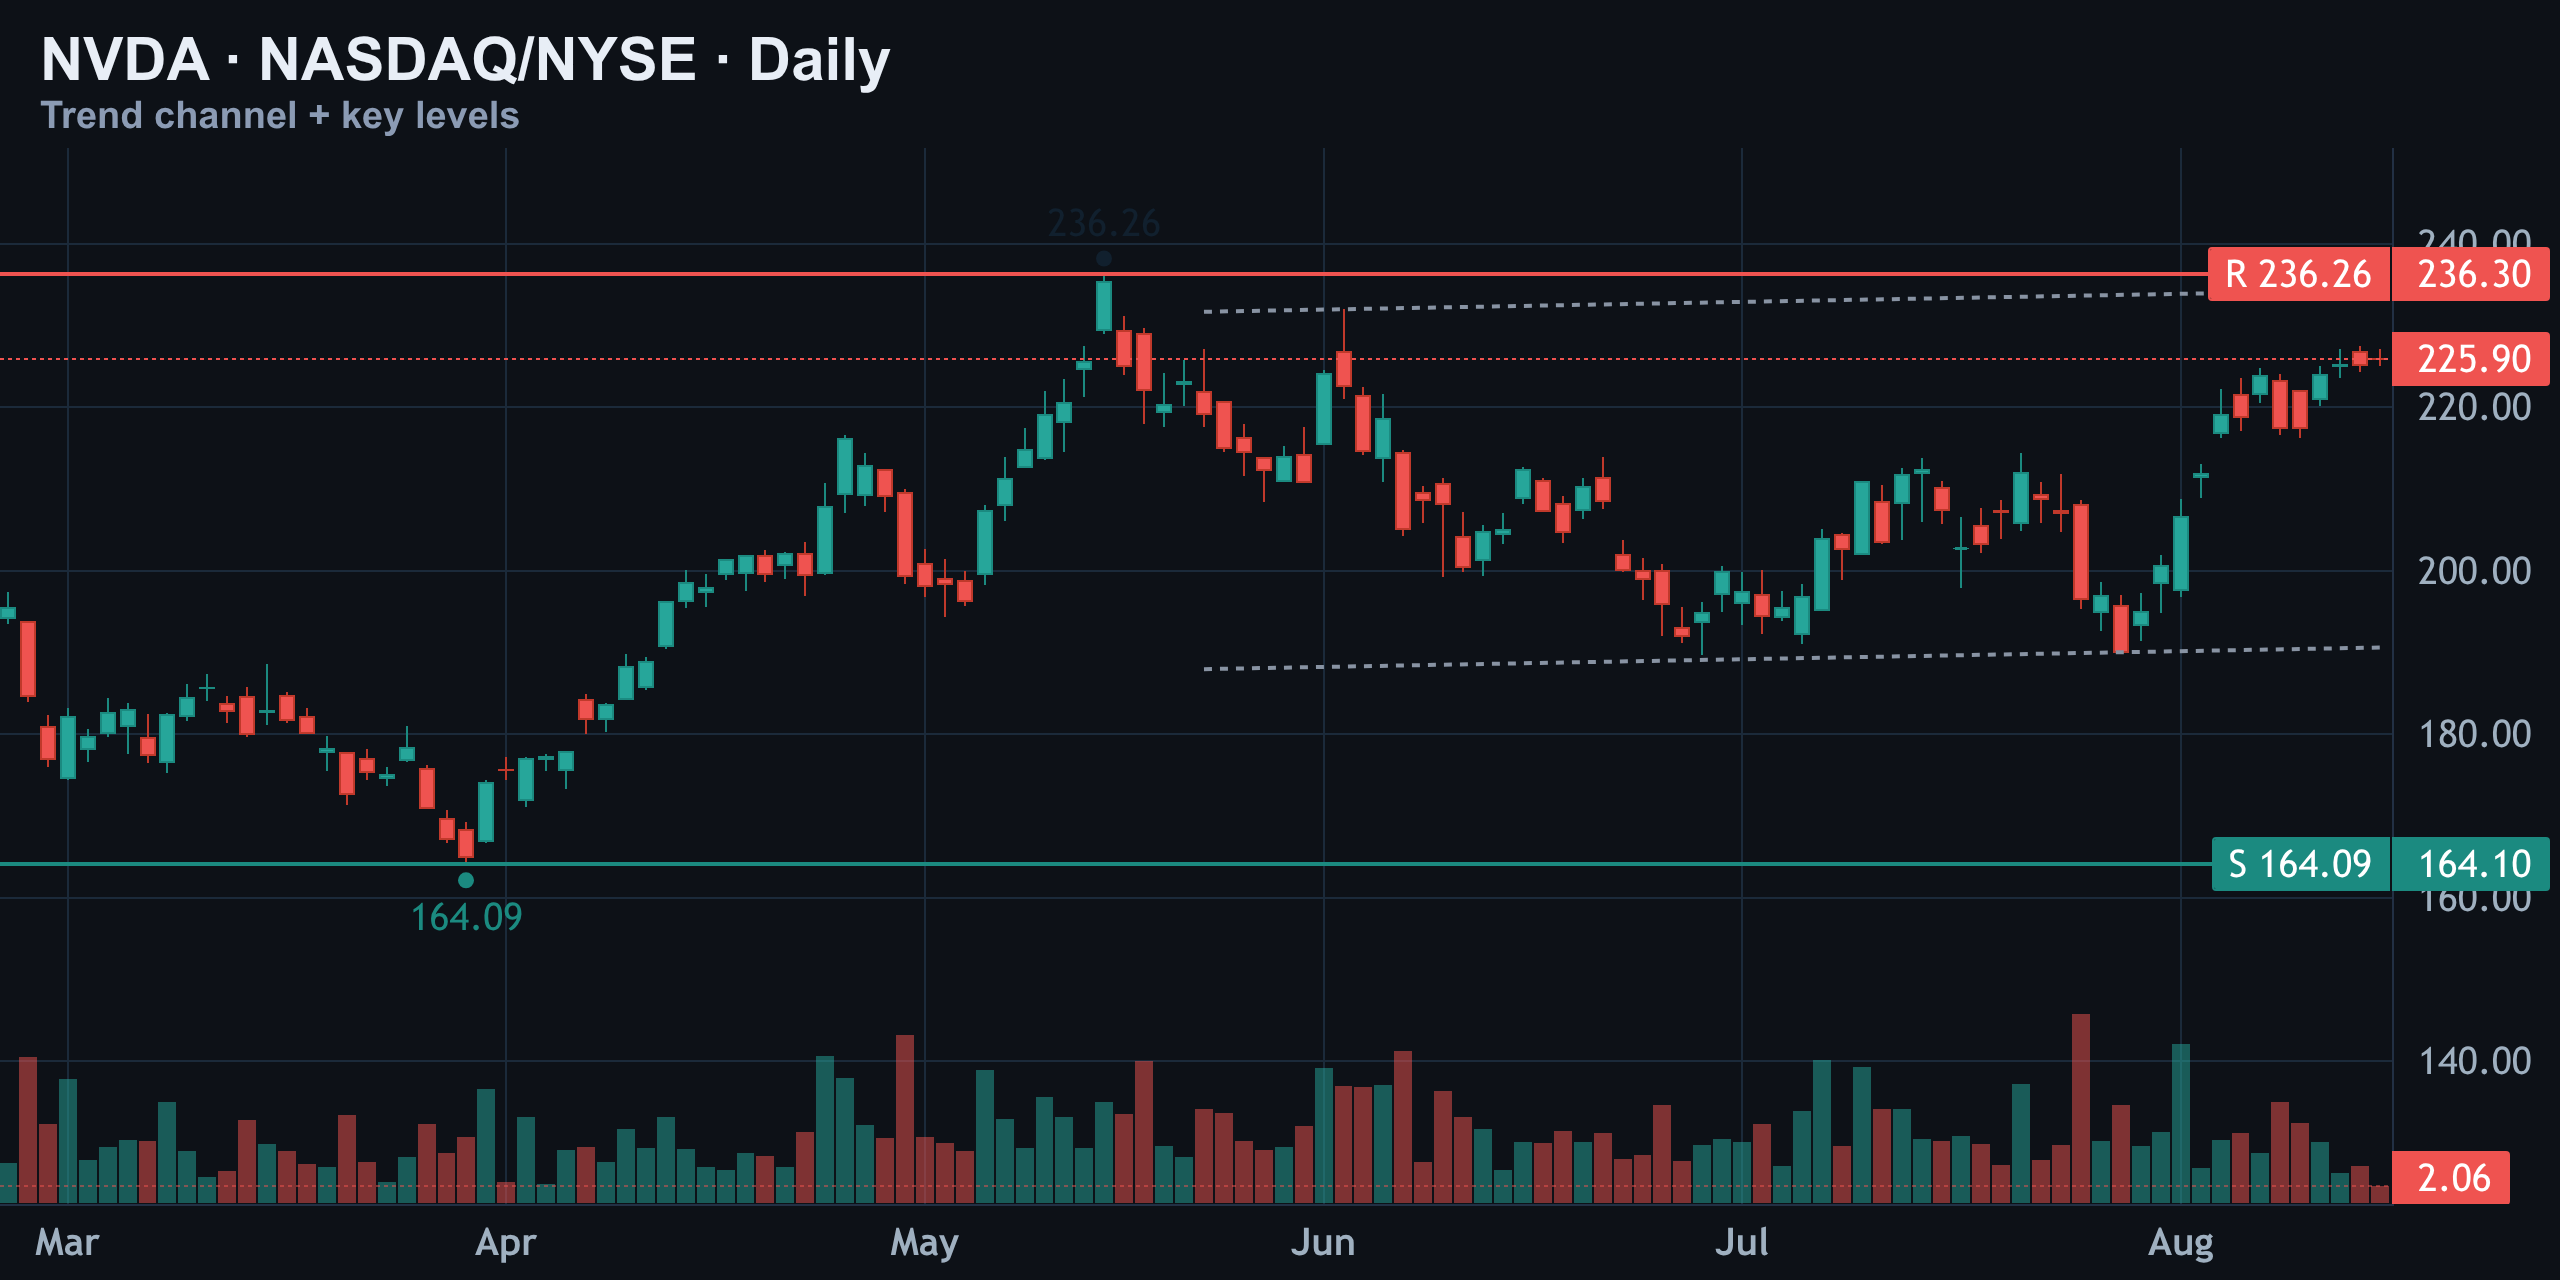
NVDA at the Gamma Wall: Breakout or Pin to $230?
Nvidia is pressing into a $230 dealer gamma wall with bullish structure intact on every timeframe. Here's the full technical, wave, and options-flow picture deciding whether NVDA breaks out or gets pinned.
 ▶ Video
Used Margin Explained: Why Your Trades Get Blocked
Your balance says you have money, but your trade still gets blocked. Here's the real reason: Used Margin, the number most traders never check until it's too late.
 ▶ Video
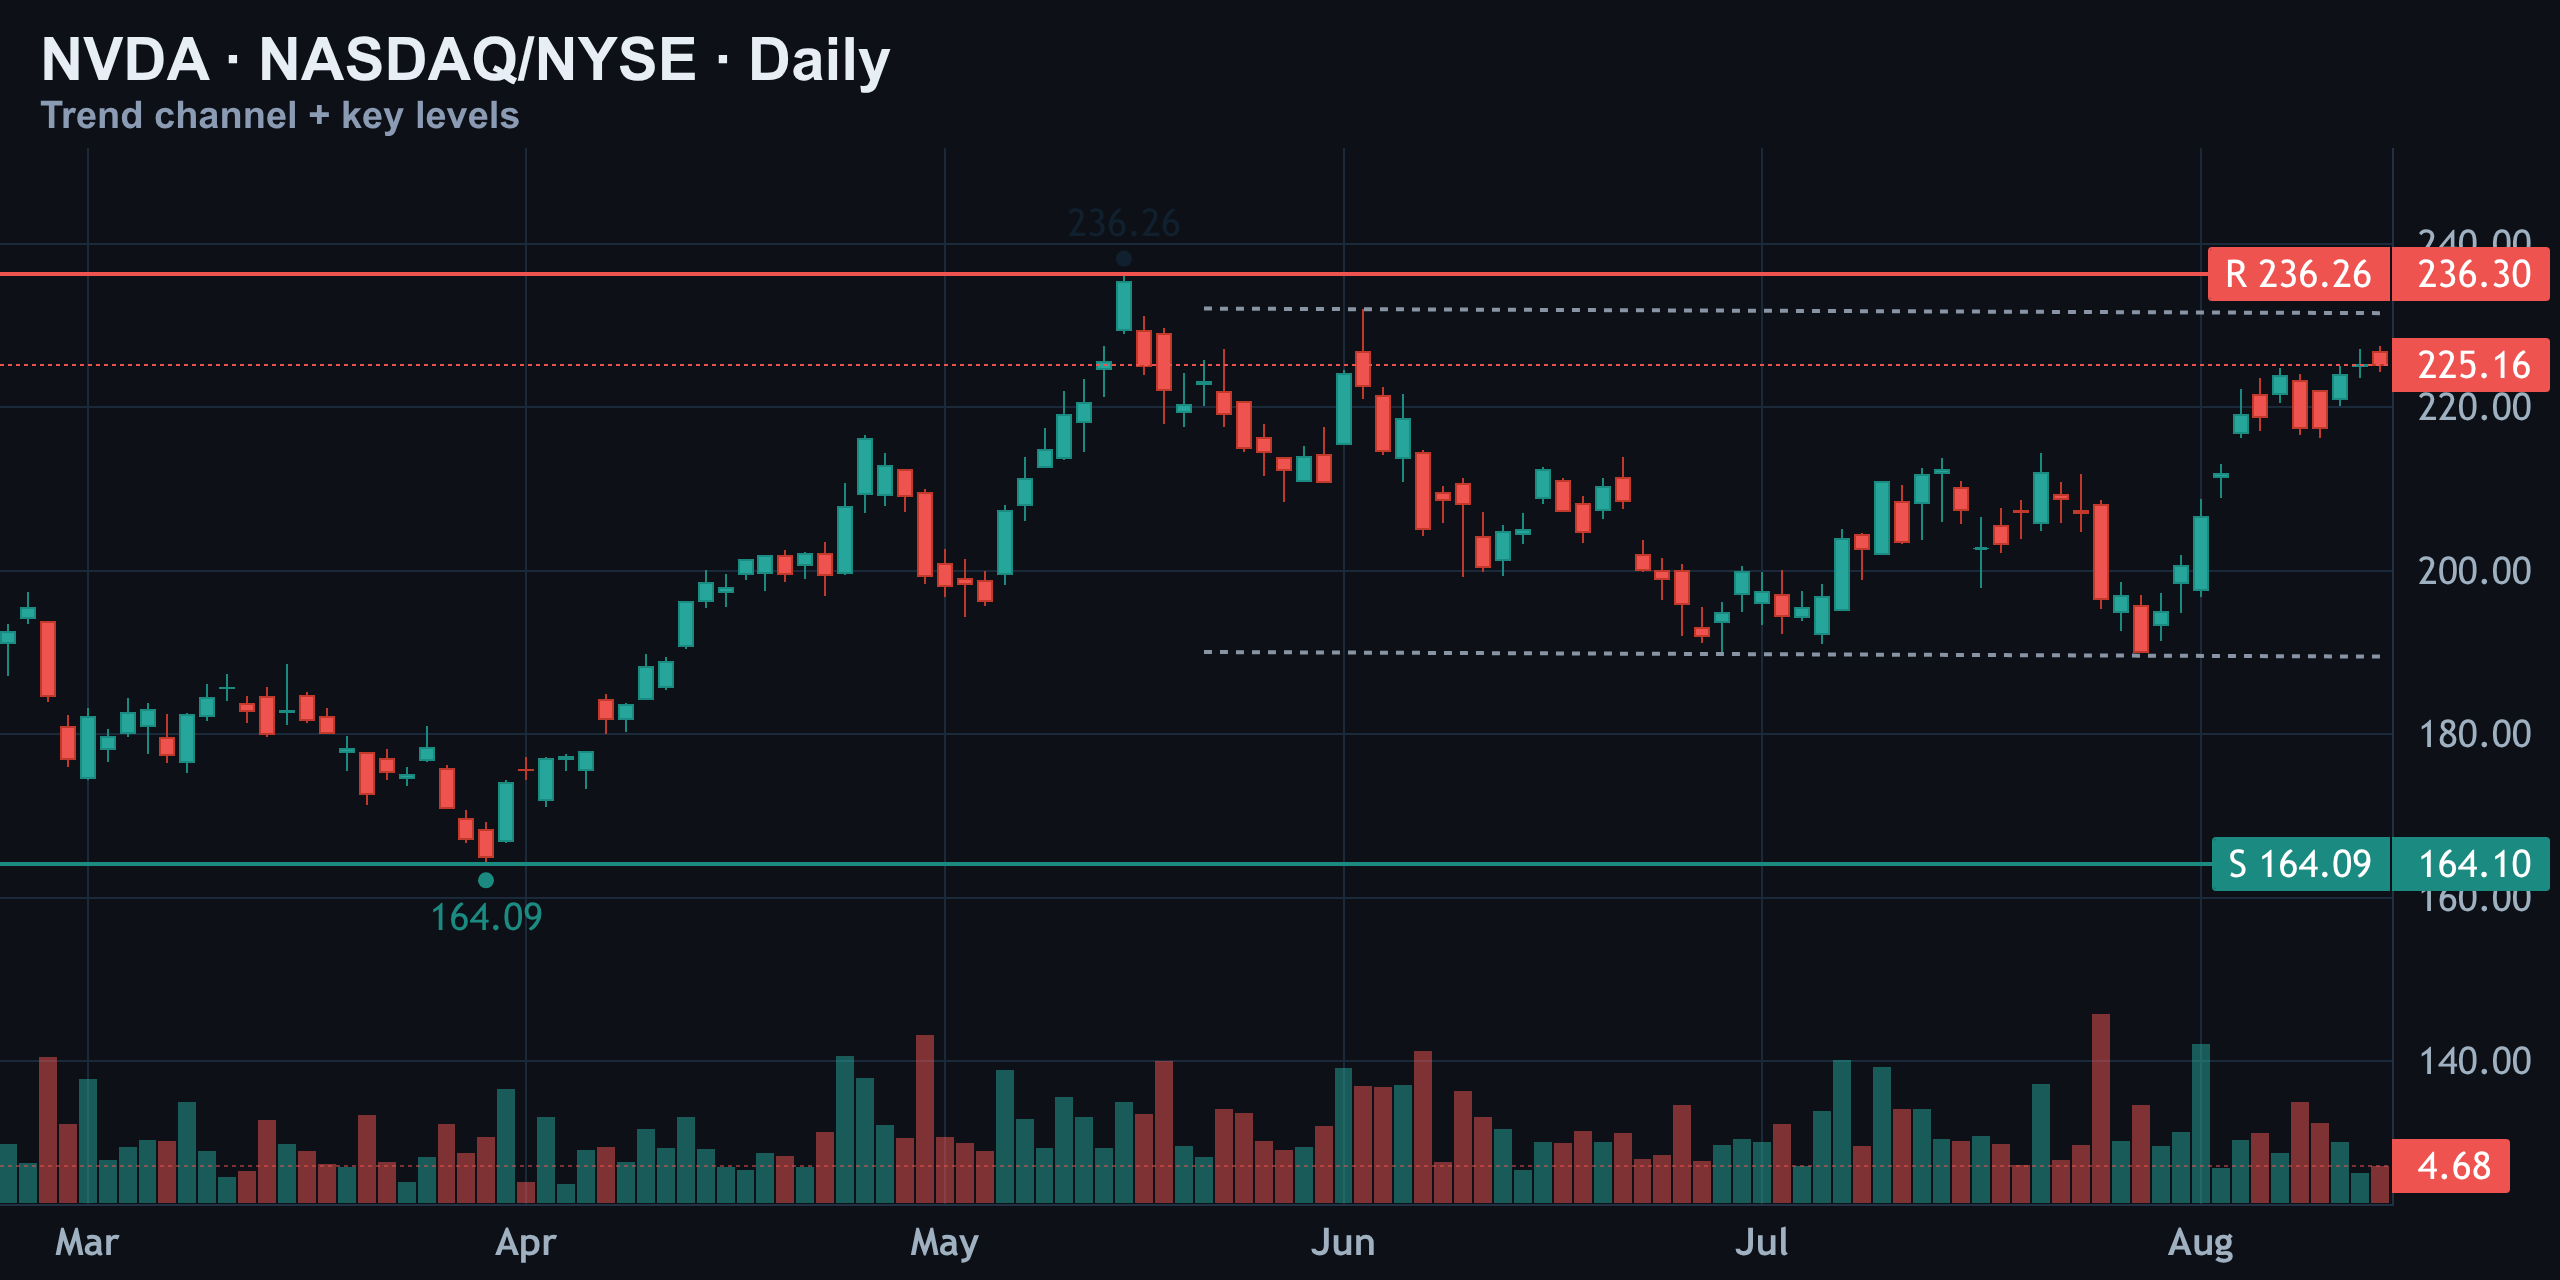
NVDA at $225: Breakout Fuel or Gamma Trap Above?
Nvidia is pressing $225 with bullish trend structure across every timeframe, but a massive dealer gamma position near $220-$230 could decide whether this becomes a breakout or a pullback trap.
 ▶ Video
Forex Margin Explained: Why $2,000 Can't Open Two Trades
Two thousand dollars in the account, one trade open, and the broker still says no. Here's the exact math behind margin, notional value, and why your balance is never the same as your buying power.
 ▶ Video
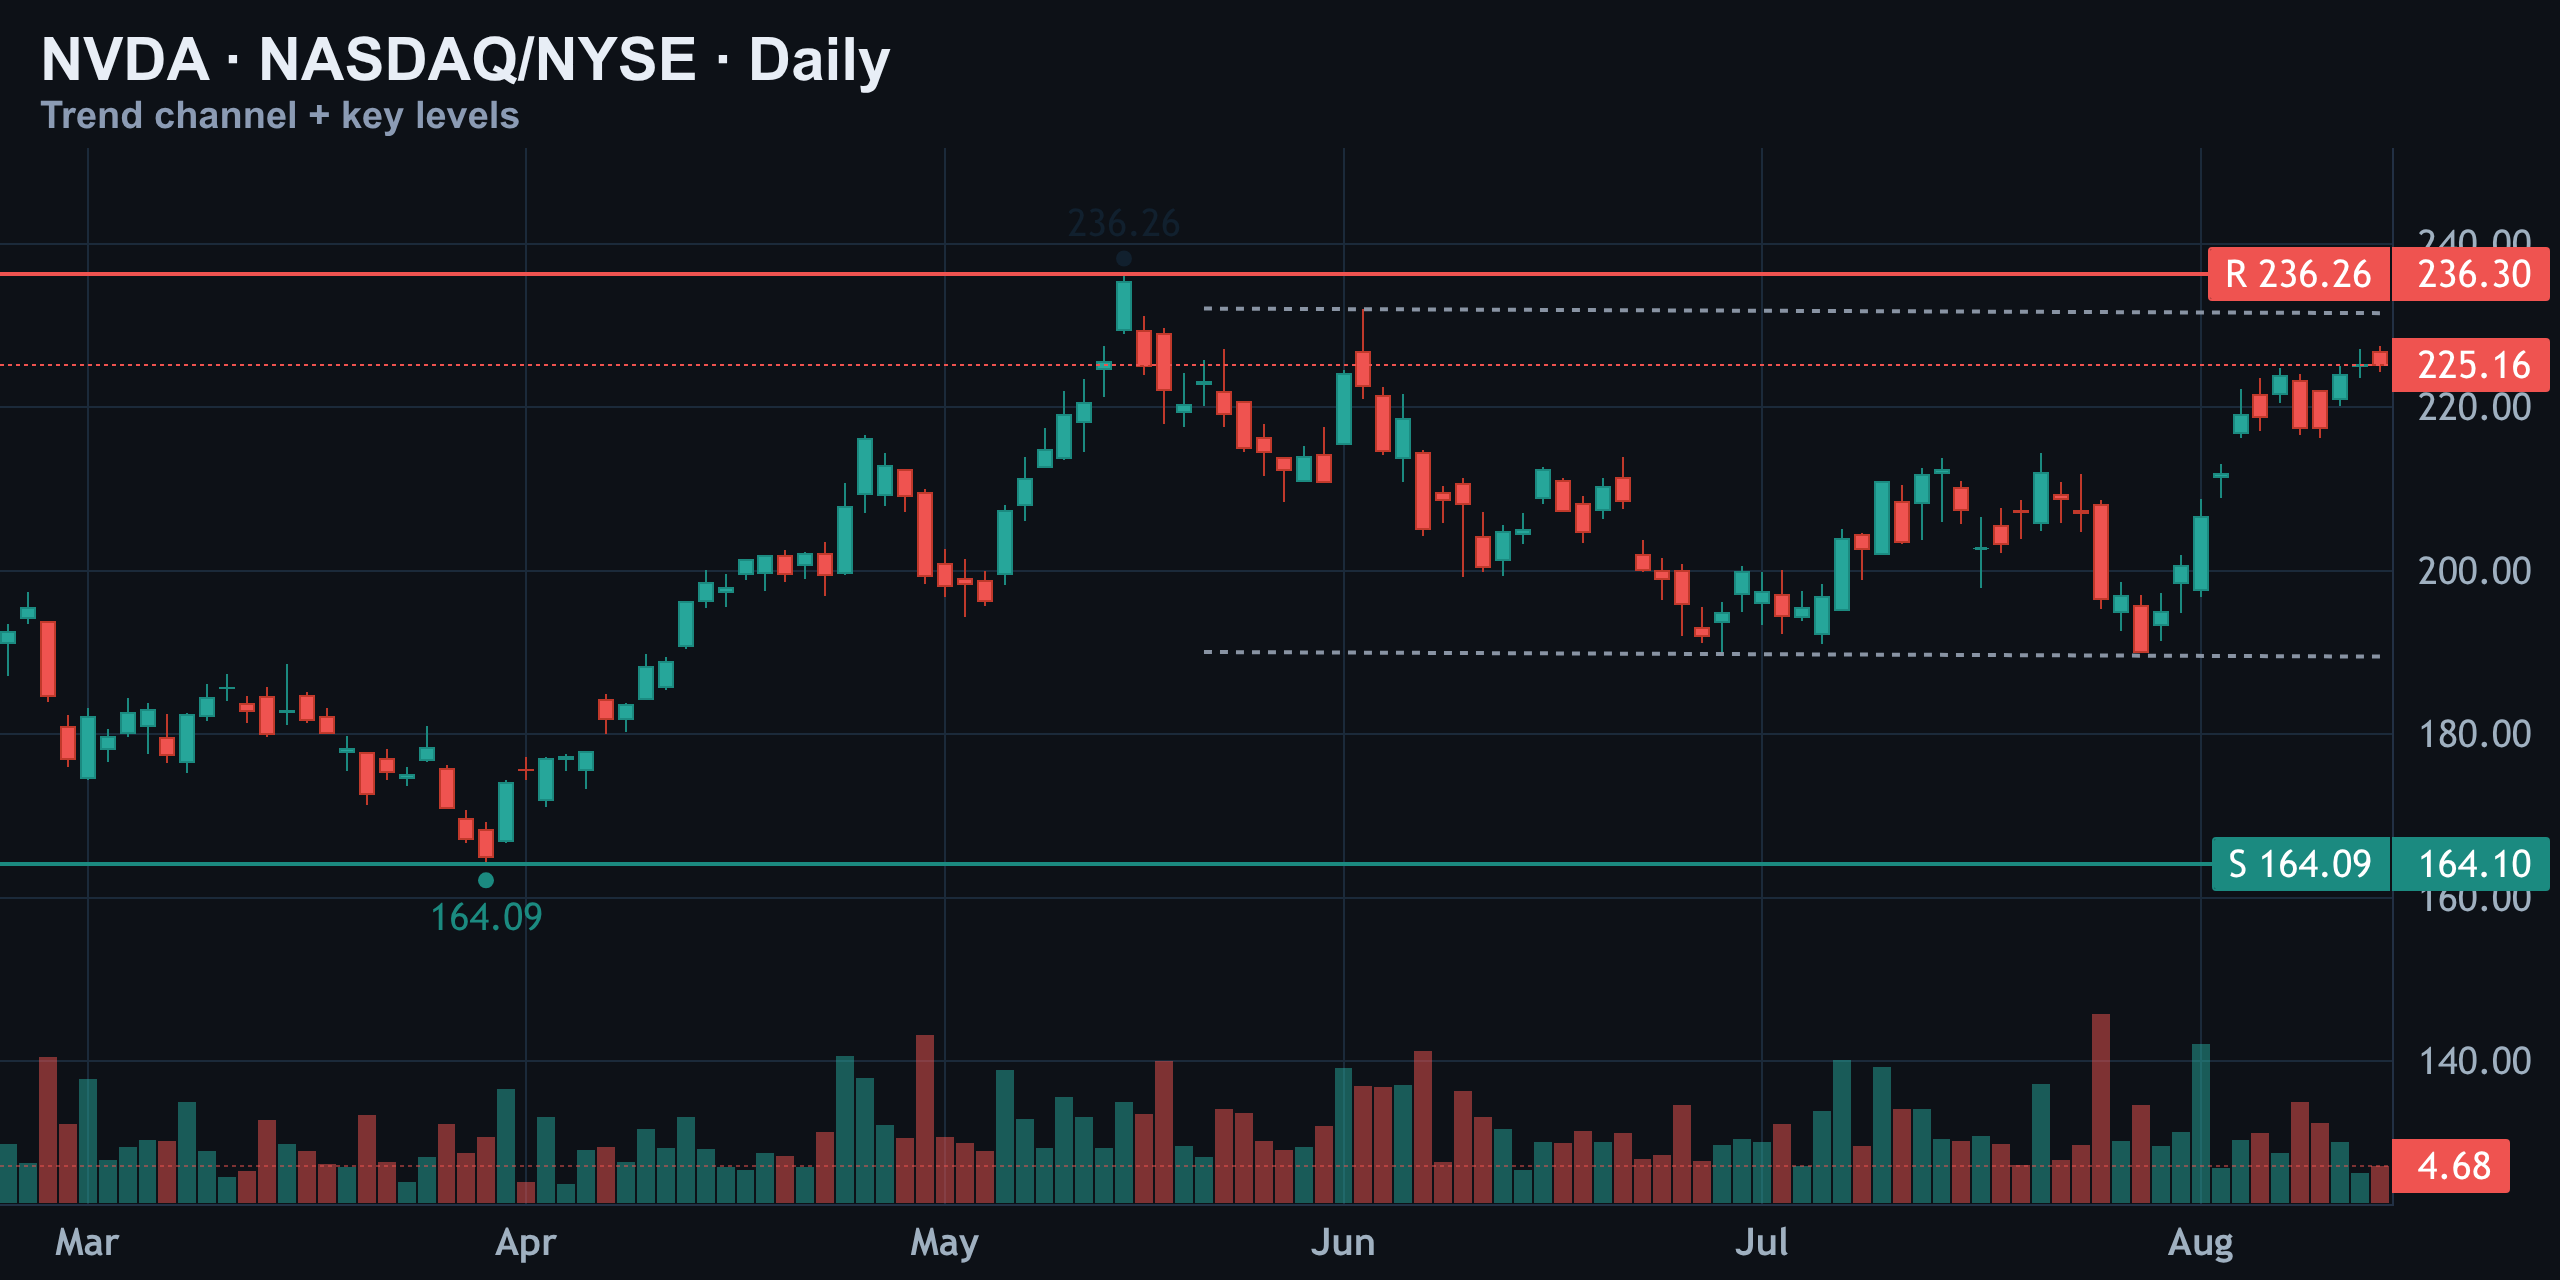
NVDA at $225: Bull Flag Breakout or Fake-Out at $230?
Nvidia is back at $225 and grinding into a wall of call resistance at $230. Here's what the daily chart, hourly channel, weekly Elliott Wave count, and dealer gamma positioning say about what happens next.
 ▶ Video
Unrealized vs Realized P/L: Why Profit Isn't Real Yet
Your platform can show plus $400 and still hand you a loss twenty minutes later. Here's the difference between unrealized (floating) P/L and realized (locked-in) P/L — and why confusing the two is the fastest way to drain a trading account.
 ▶ Video
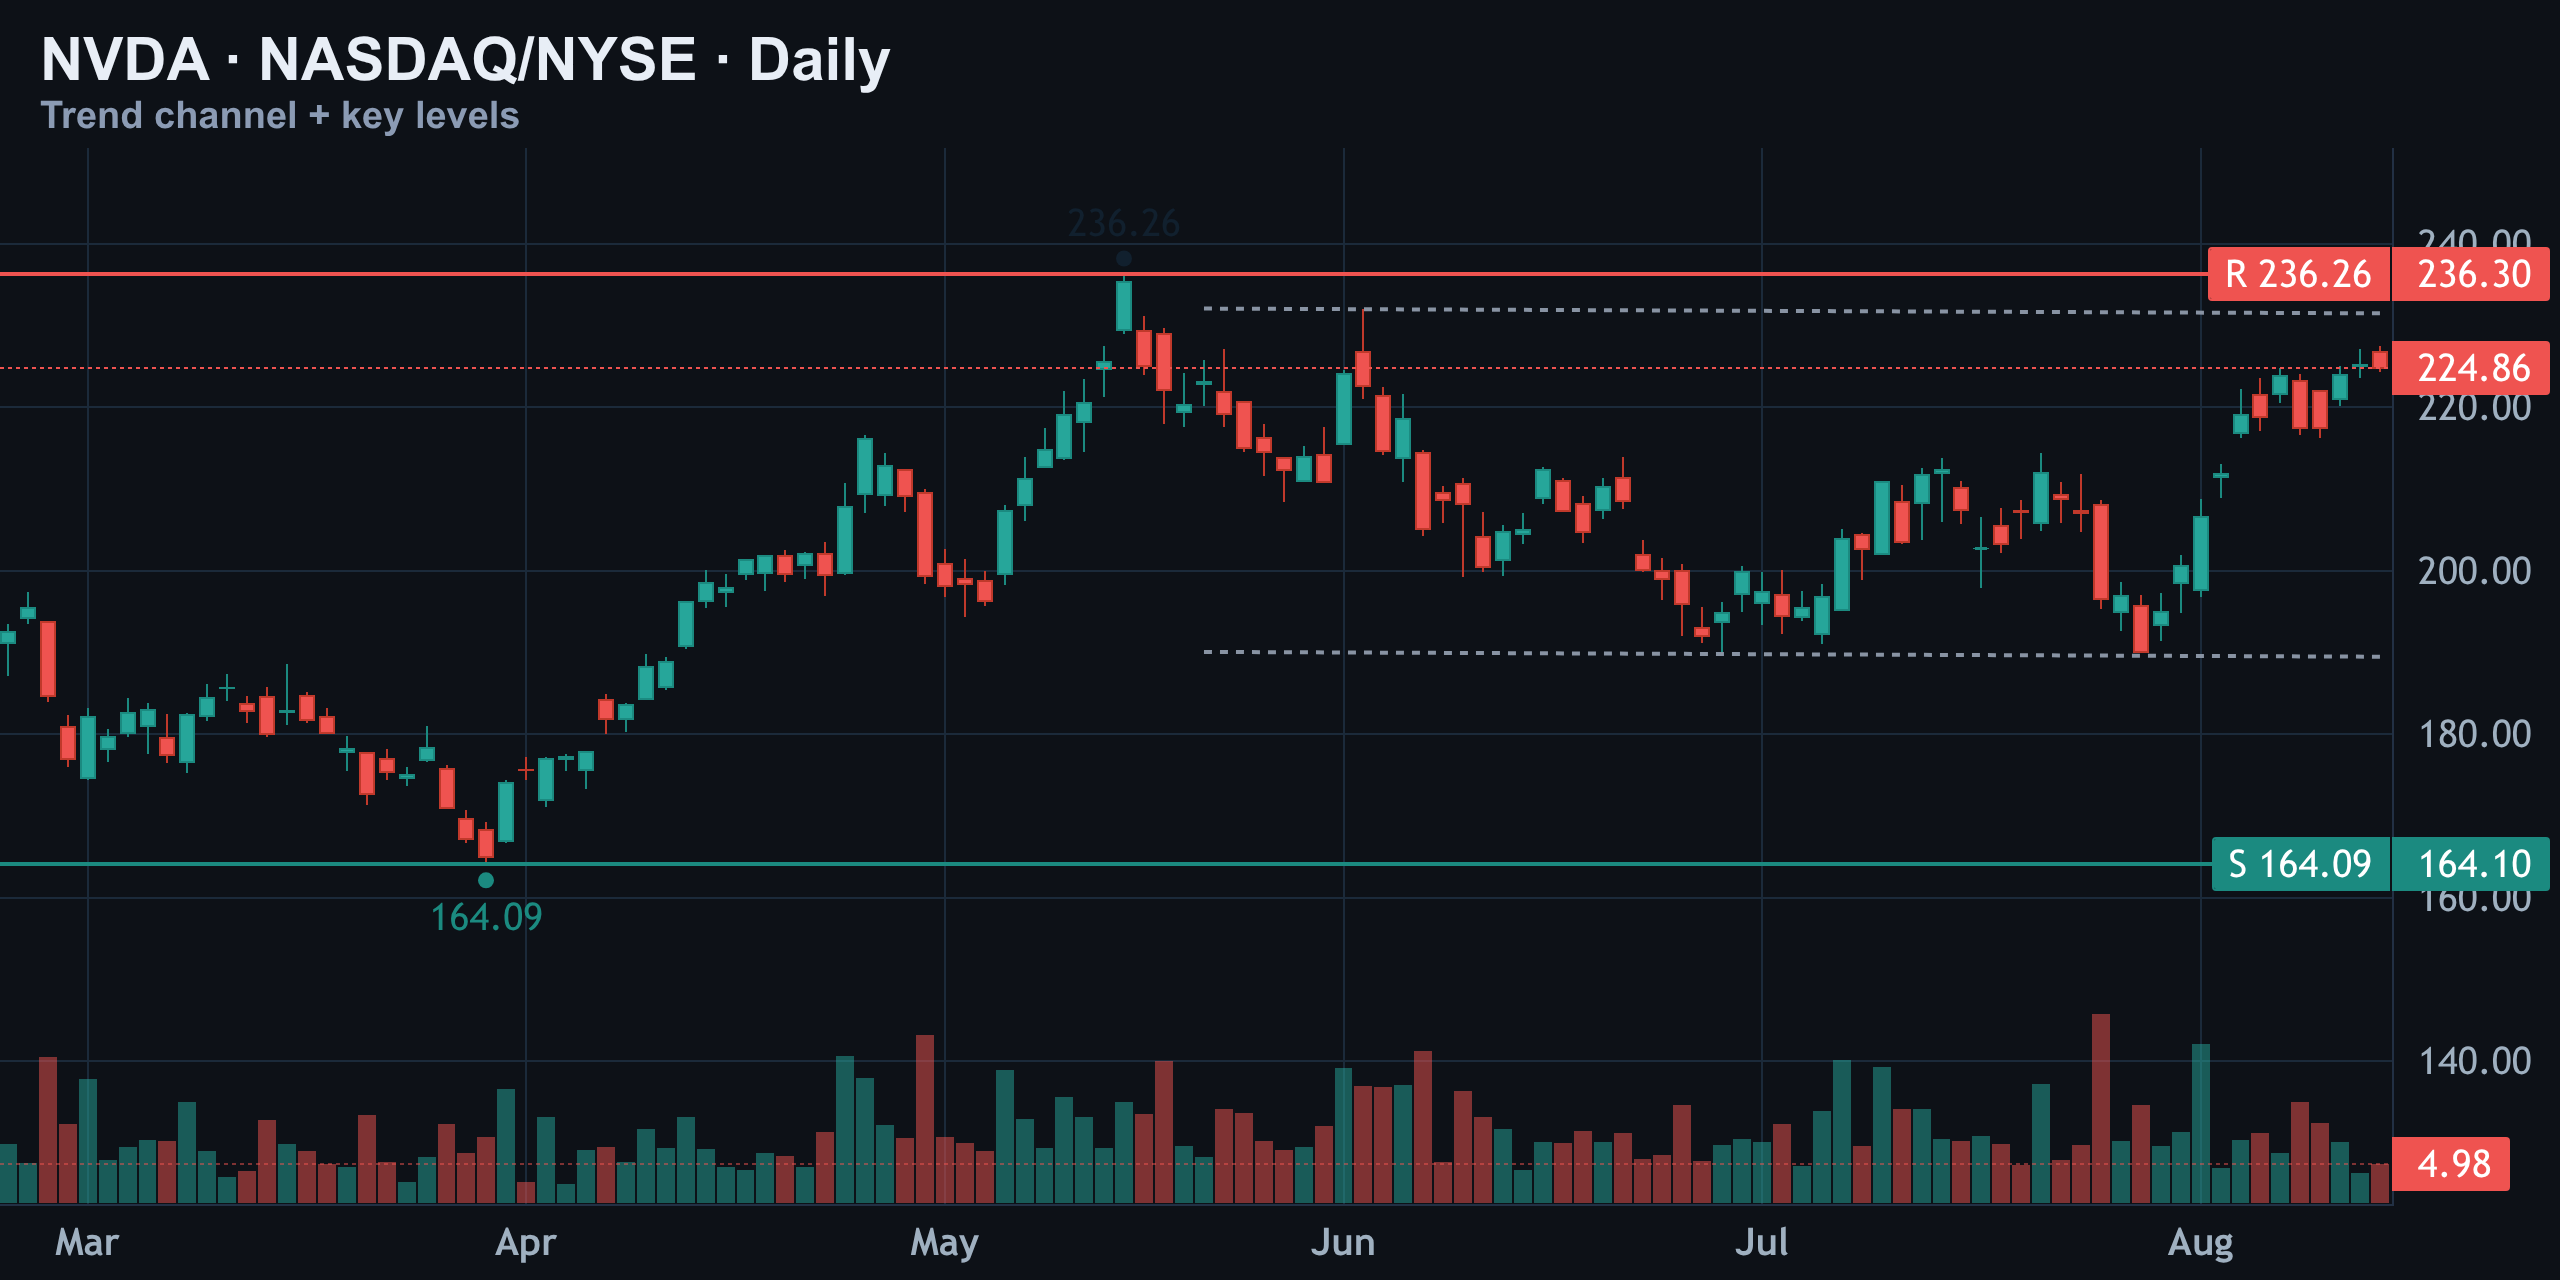
NVDA Coils Near All-Time Highs: Breakout or Fakeout?
Nvidia is coiling just below its all-time high with bullish momentum intact, but a wall of call gamma at $225 is capping every rally attempt. Here's what the charts, options flow, and Elliott Wave count say about which way this breaks.
▶ VideoNVDA Coils Near All-Time Highs: Breakout or Fakeout?
Nvidia is coiling just below its all-time high with bullish momentum intact, but a wall of call gamma at $225 is capping every rally attempt. Here's what the charts, options flow, and Elliott Wave count say about which way this breaks.