Daily market analysis
SUI (SUI) technical analysis today
Last updated
SUI Daily Pulse Aug 19: The Channel Deciding Everything
Where We Left It: Yesterday's Short Is Still Live
Let's start with the scorecard, because context matters more than a fresh headline. The prior Daily Pulse called a short from roughly $0.67, with a stop near $0.68 and a target near $0.635, for better than a 3:1 reward-to-risk setup. That call is still open right now — untouched in either direction.
Since that call went out, SUI actually moved up about 1.7%, from around $0.65 to the current $0.6518 level on major trackers. So yes, the bounce is real. But real doesn't mean the trade is invalidated — it just means price is chopping inside the same range the short was built around.
| Item | Level | Status |
|---|---|---|
| Entry (short) | ≈ $0.67 | Triggered |
| Stop-loss | ≈ $0.68 | Not hit |
| Target | ≈ $0.635 | Not hit |
| Current price | ≈ $0.6518 | Trade still open |
The 15-Minute Chart: A Flash Crash, Then a Rising Wedge
The real story of today's session started with violence. SUI opened by diving from the high-$0.60s down into the low-$0.60s in a matter of minutes — textbook stop-hunt behavior designed to flush leveraged longs before the real move plays out.
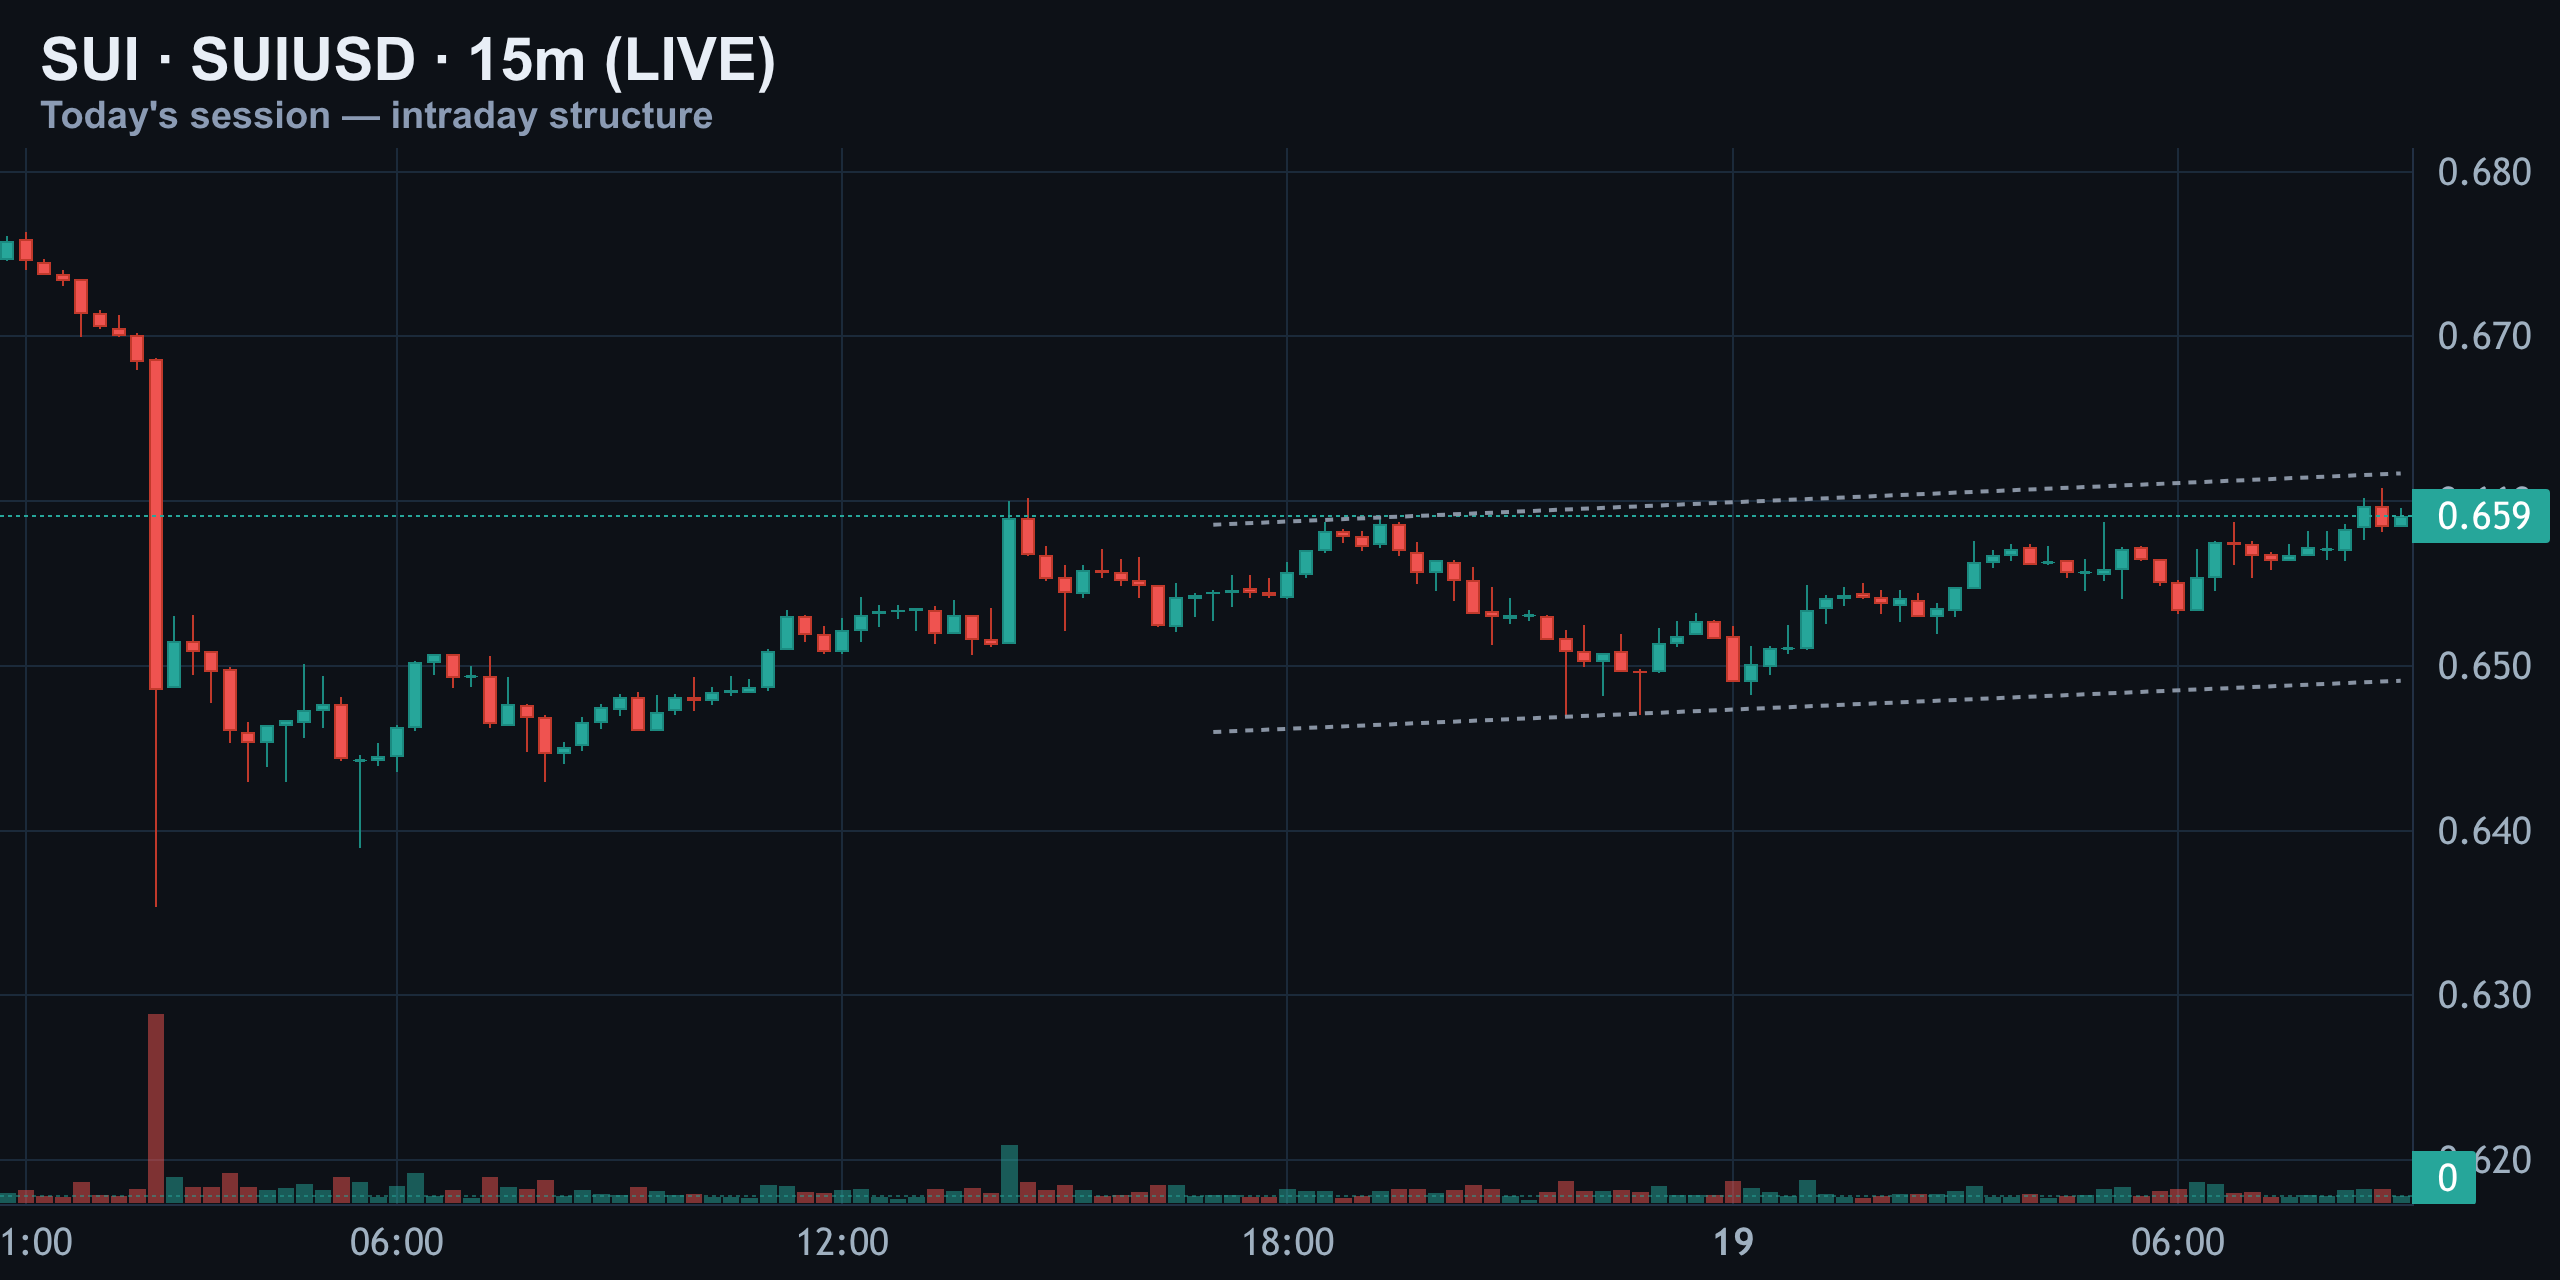
Since that crash, price has been quietly rebuilding — printing higher lows inside a narrowing ascending channel that's held since the afternoon session. Spot is sitting almost exactly on the $0.659 pivot right now, using it as a hinge point.
In plain terms: price crashed overnight, then slowly climbed back inside a narrowing rising channel. That structure is the short-term battle line — lose it, and this bounce loses its legs fast.
The 4-Hour Structure: Still Capped by the Down-Trend Line
Zoom out to the 4-hour timeframe and the bigger picture sharpens. SUI has been carving a textbook descending channel since August 9, printing lower highs and lower lows the entire way.
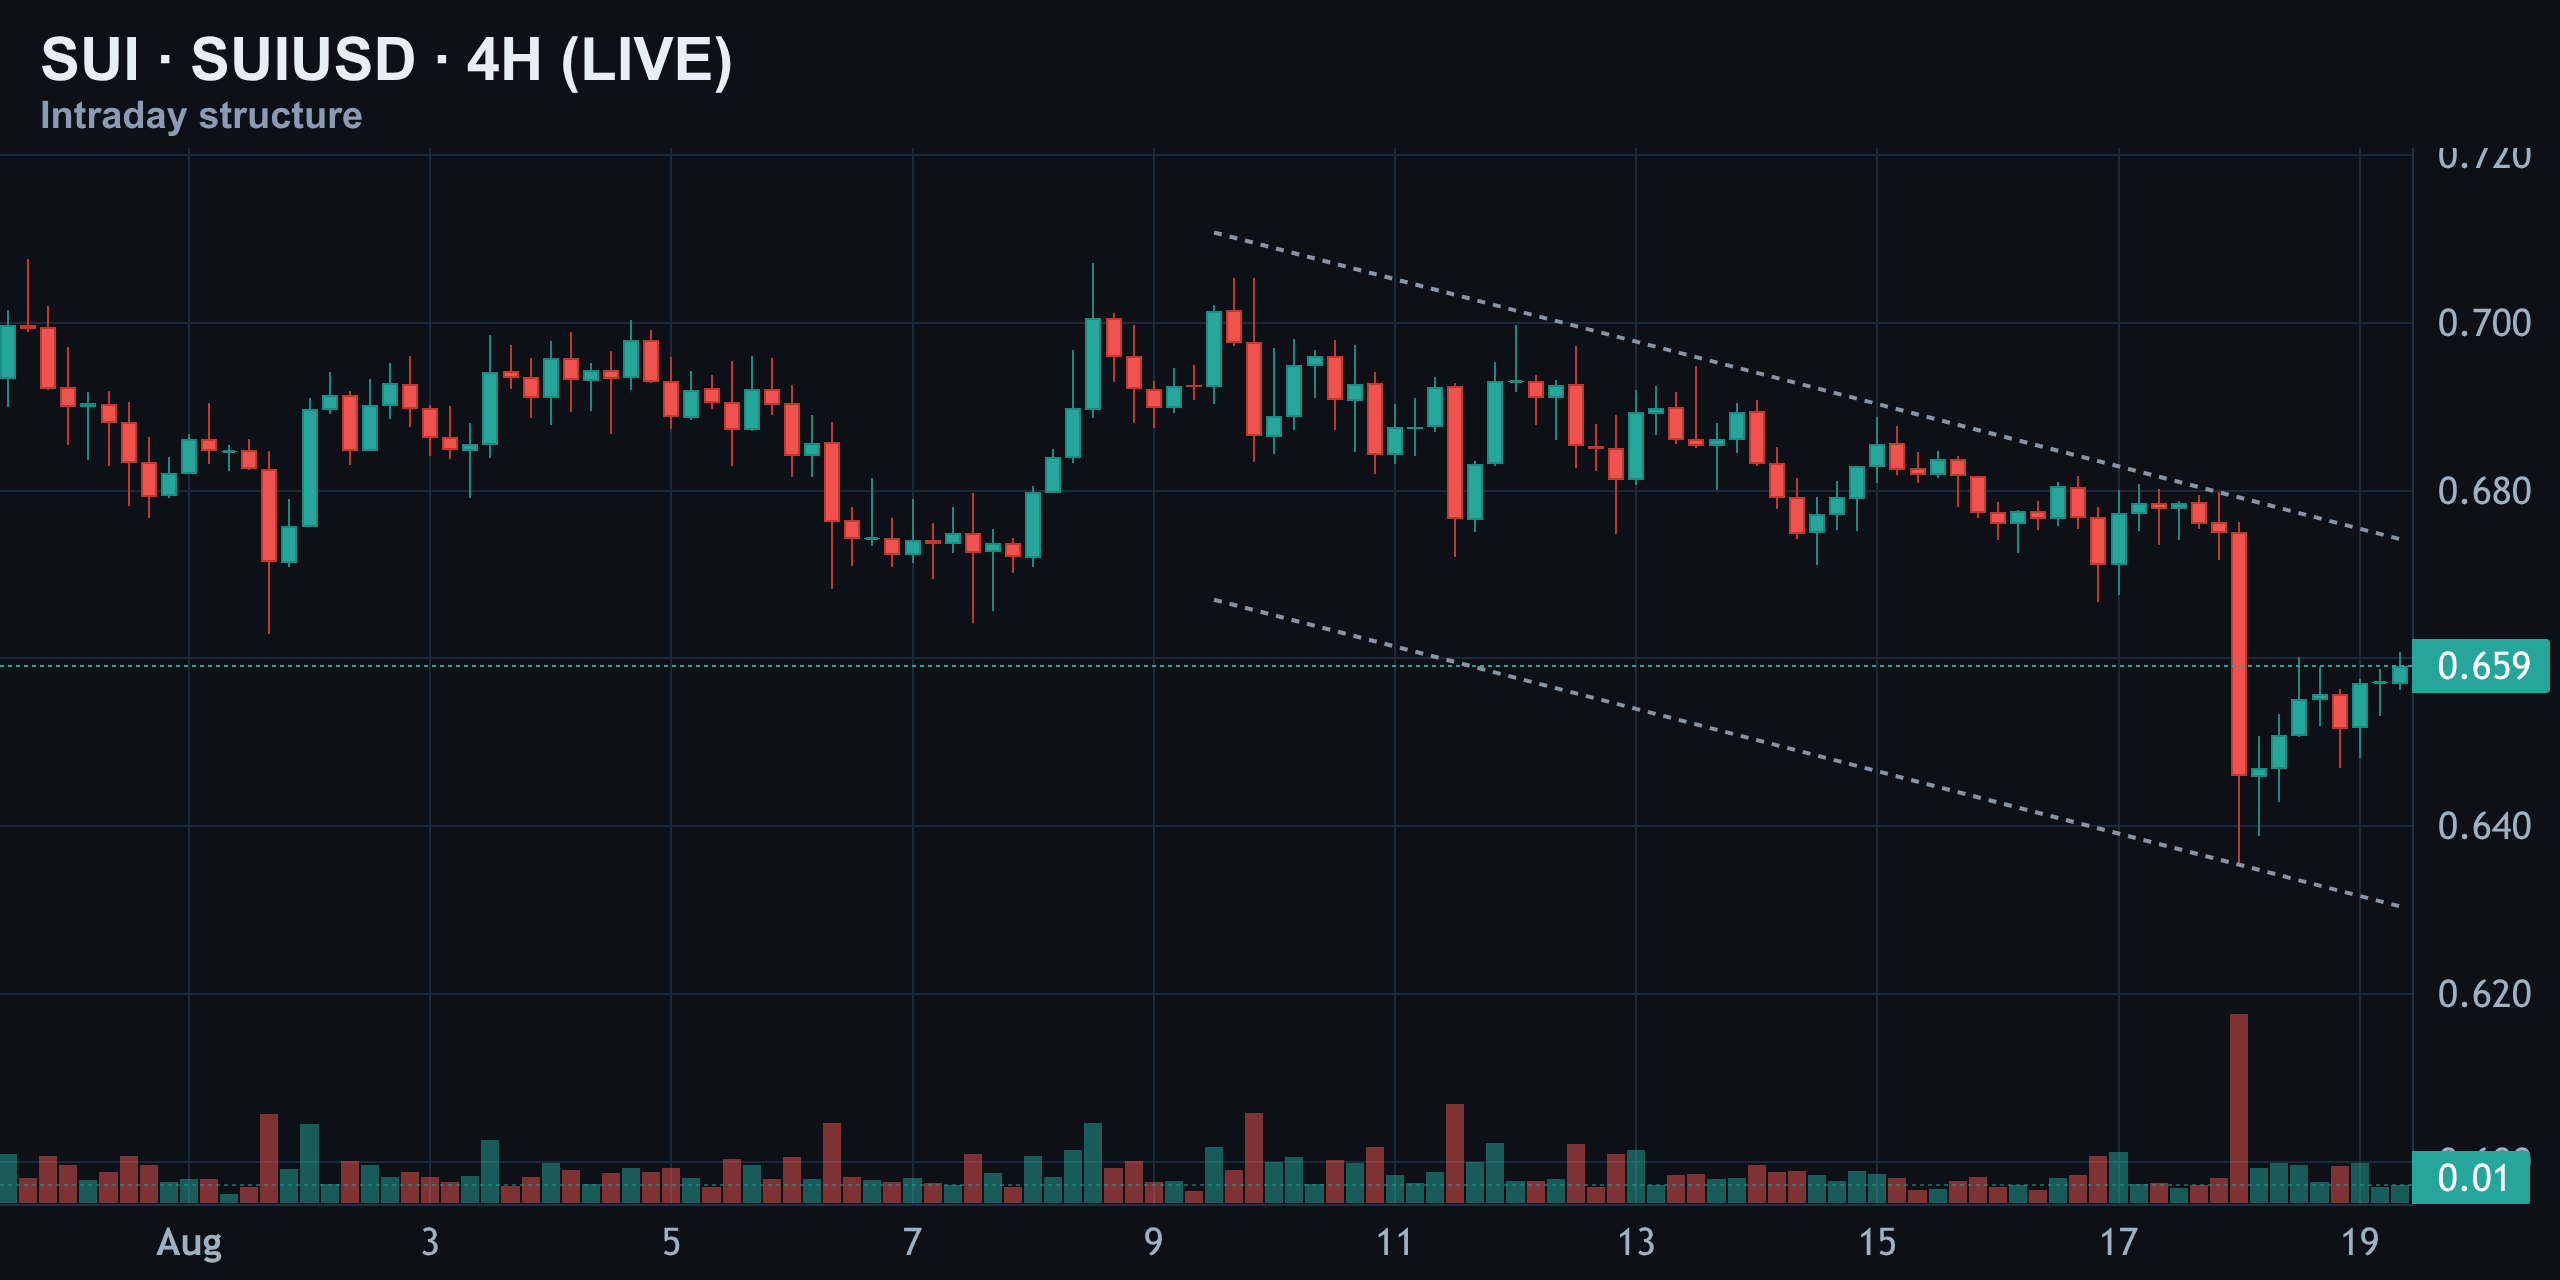
Yesterday's flush pushed price into the low-$0.60s in one of the sharpest single candles on this chart, before buyers finally stepped in. The recovery since then is genuine — but it's happening underneath that falling trendline, not above it.
The Daily Chart: Compression Toward the $0.635 Floor
On the daily timeframe, the story is compression. SUI has been sliding inside a well-defined channel since late June, and that channel has narrowed hard as it approaches current price.
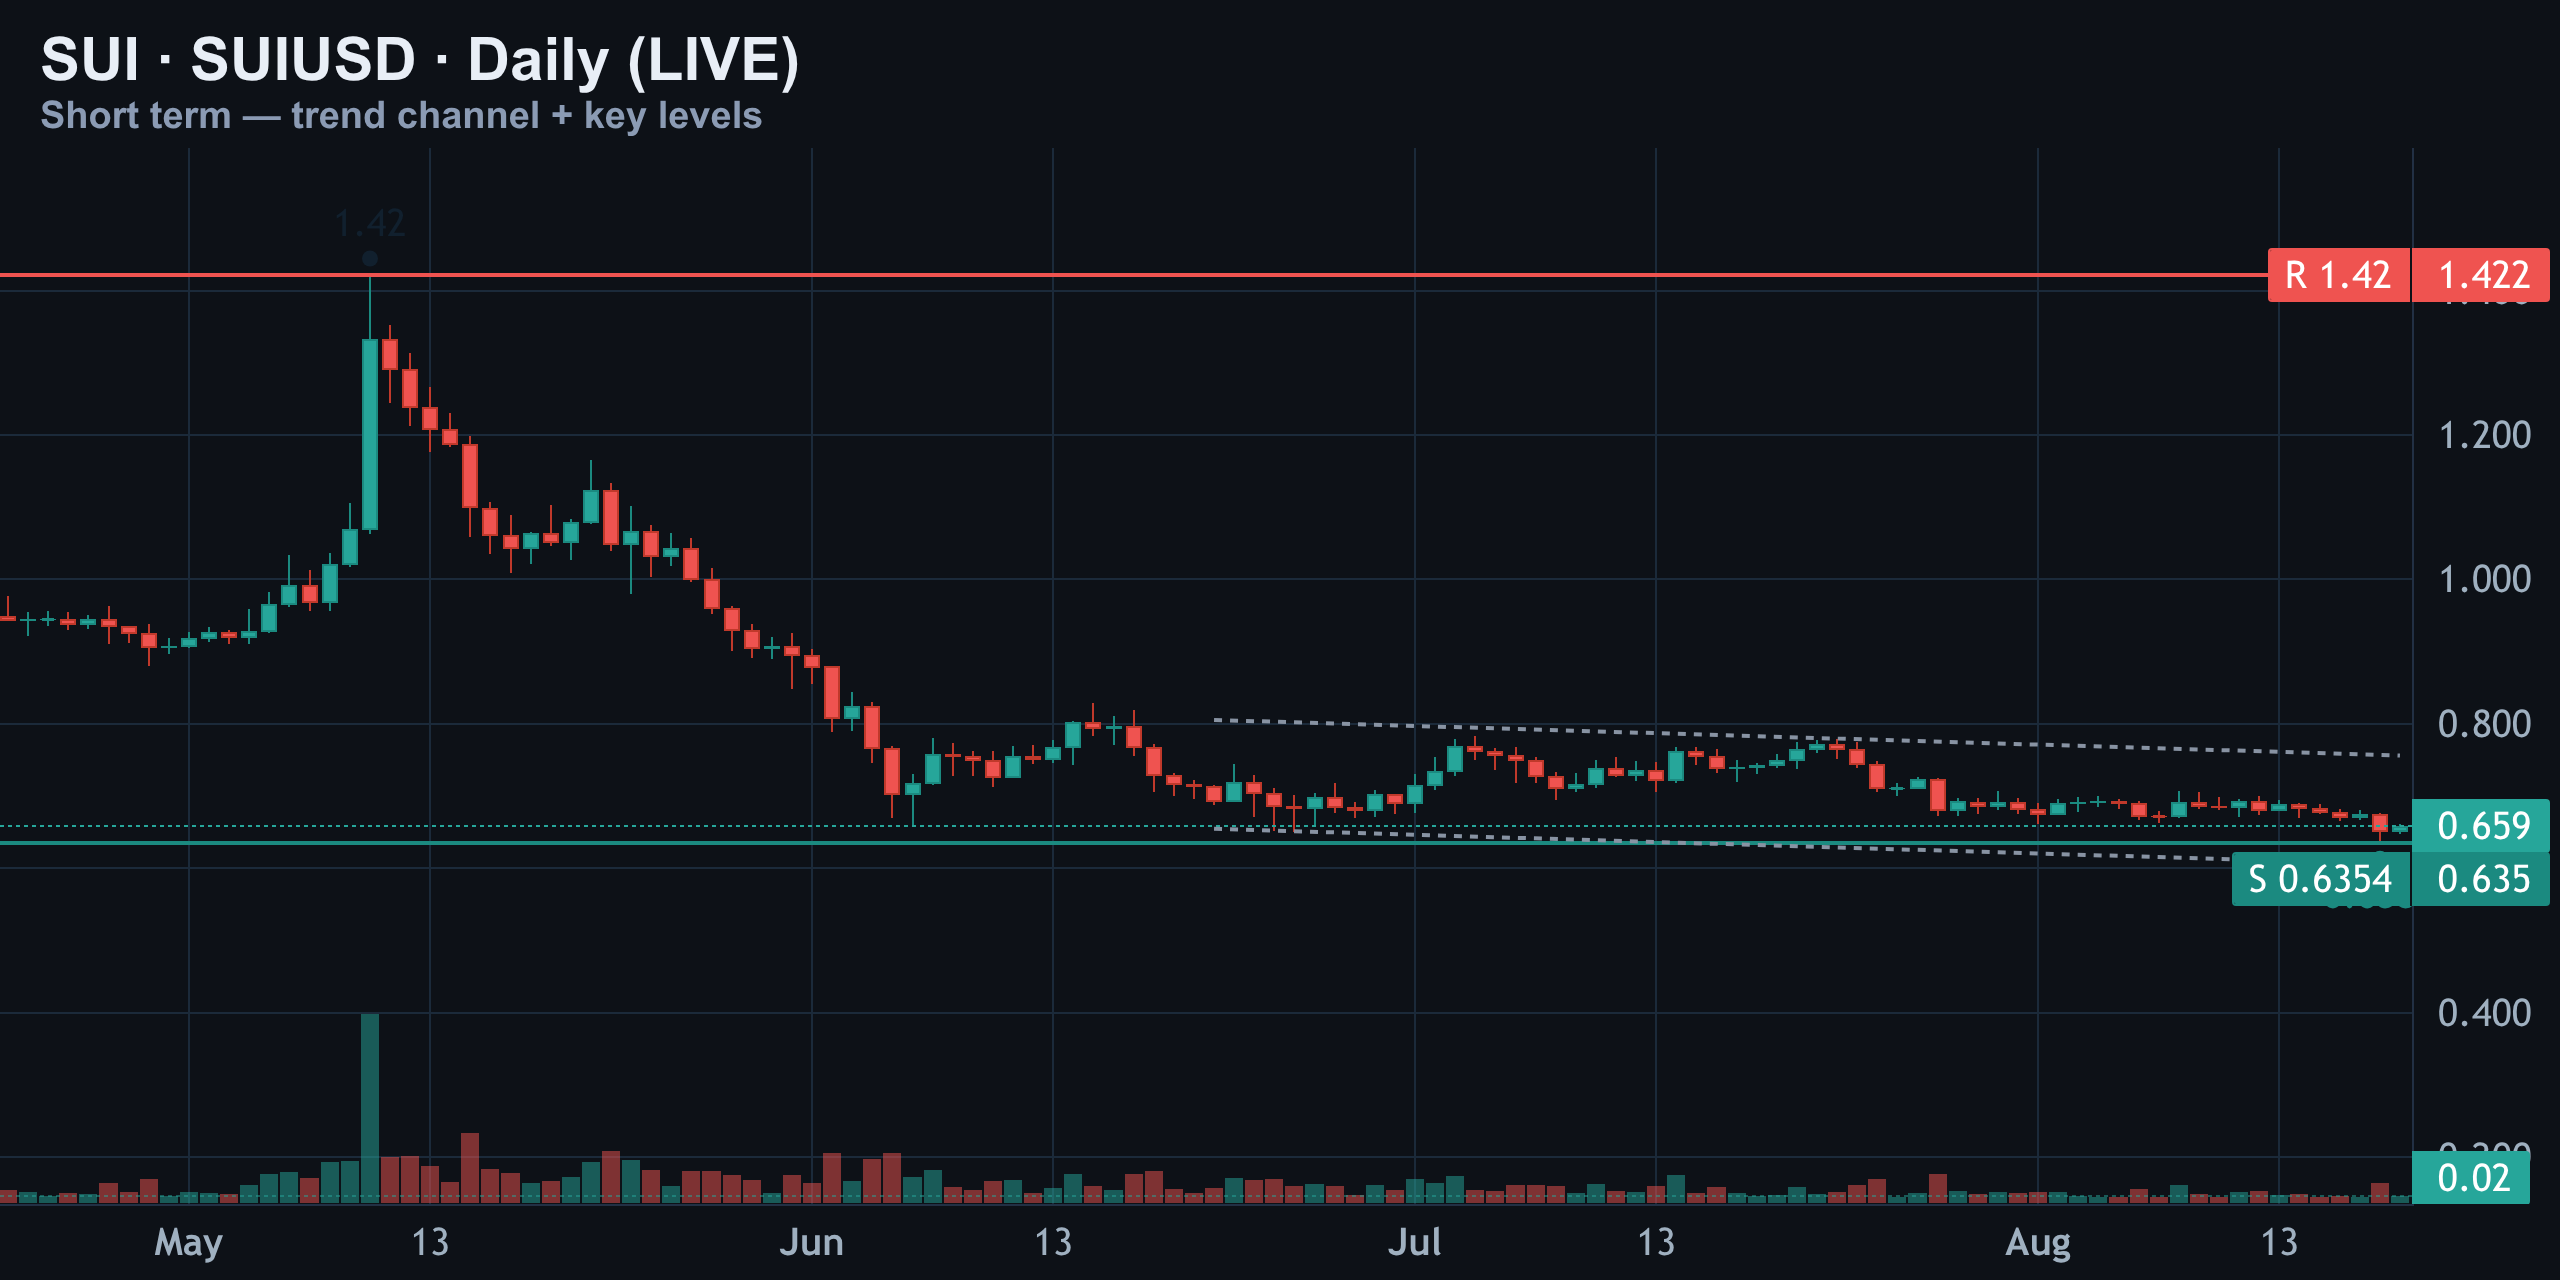
This is a market a long way from home. SUI's all-time high sits at $5.35, meaning current price is roughly 88% below that peak. Even May's local spike near $1.42 now looks like a distant memory — this is a market that's spent months giving back gains.
The level that matters most right now sits at roughly $0.635. That's the daily support the market has already tested once, and it lines up almost exactly with where today's trade plan is aiming.
Momentum Check: Neither Oversold Nor Overbought
Momentum-wise, RSI(14) is parked around 38 on the daily. That's soft, but it's nowhere near oversold — the 30 level is where June's actual bottom formed, and SUI is still a good distance above that floor.
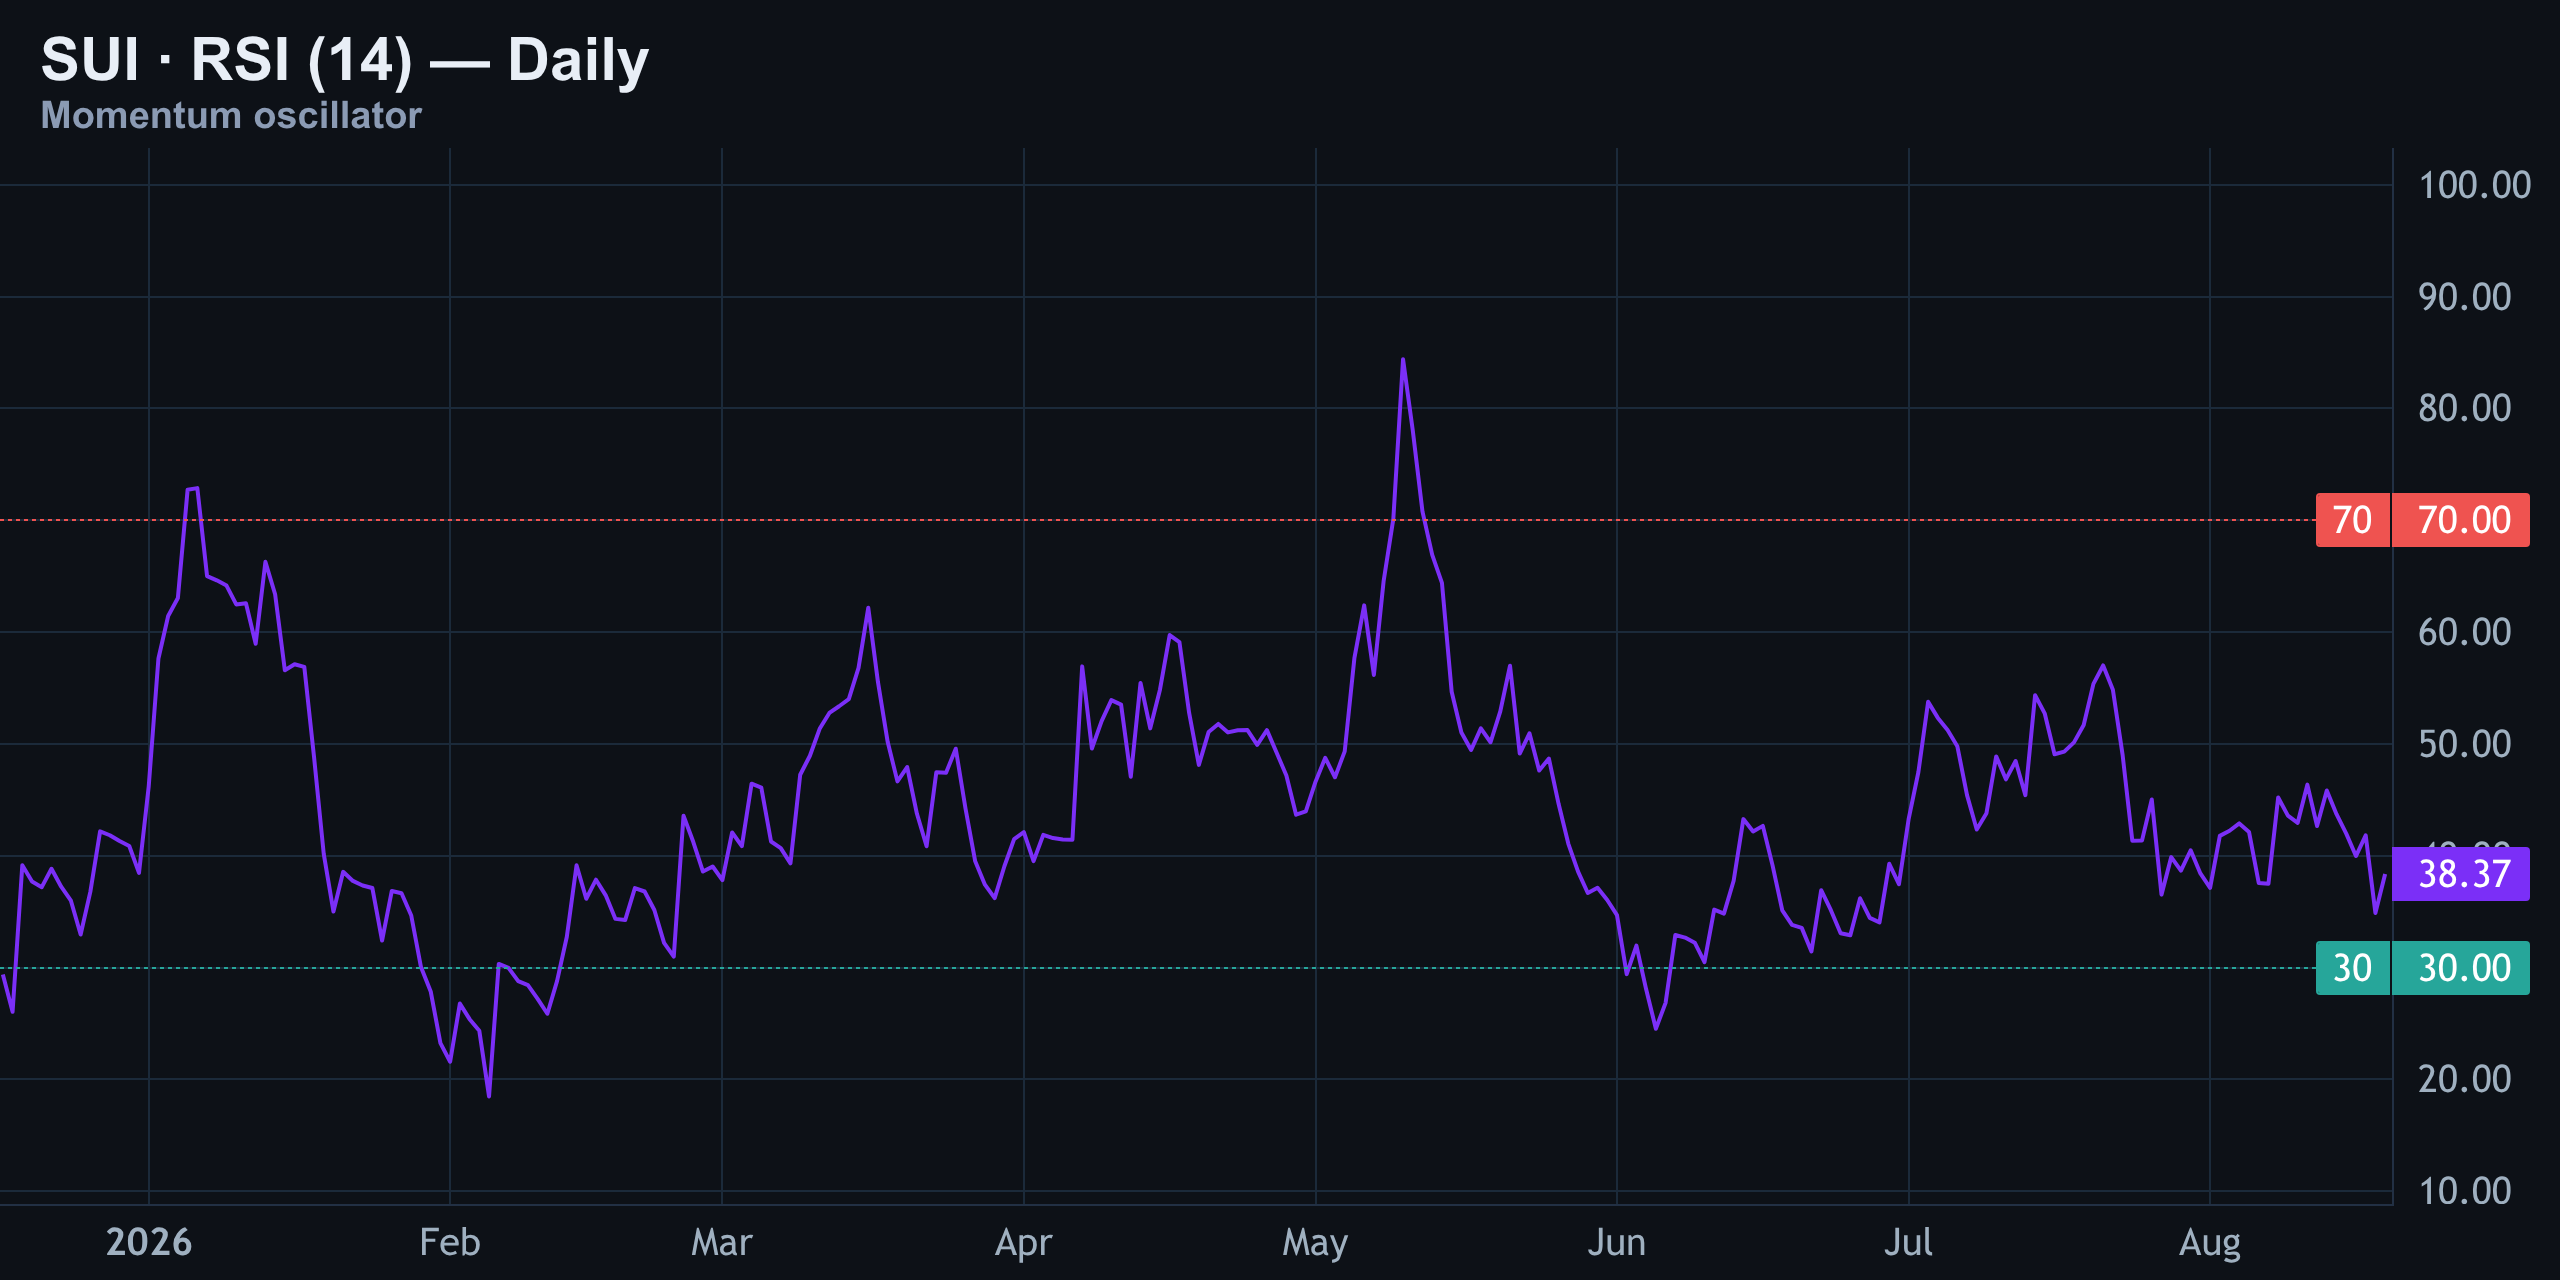
What this tells us is simple: sellers still have control, but they haven't exhausted themselves yet. There's no coiled-spring oversold bounce brewing here, and there's no overbought blow-off risk either. This is a market drifting with the trend, not screaming for a reversal in either direction.
MACD confirms what price action is showing. The MACD line sits below its signal line, and both remain below the zero line — keeping the medium-term bias bearish.
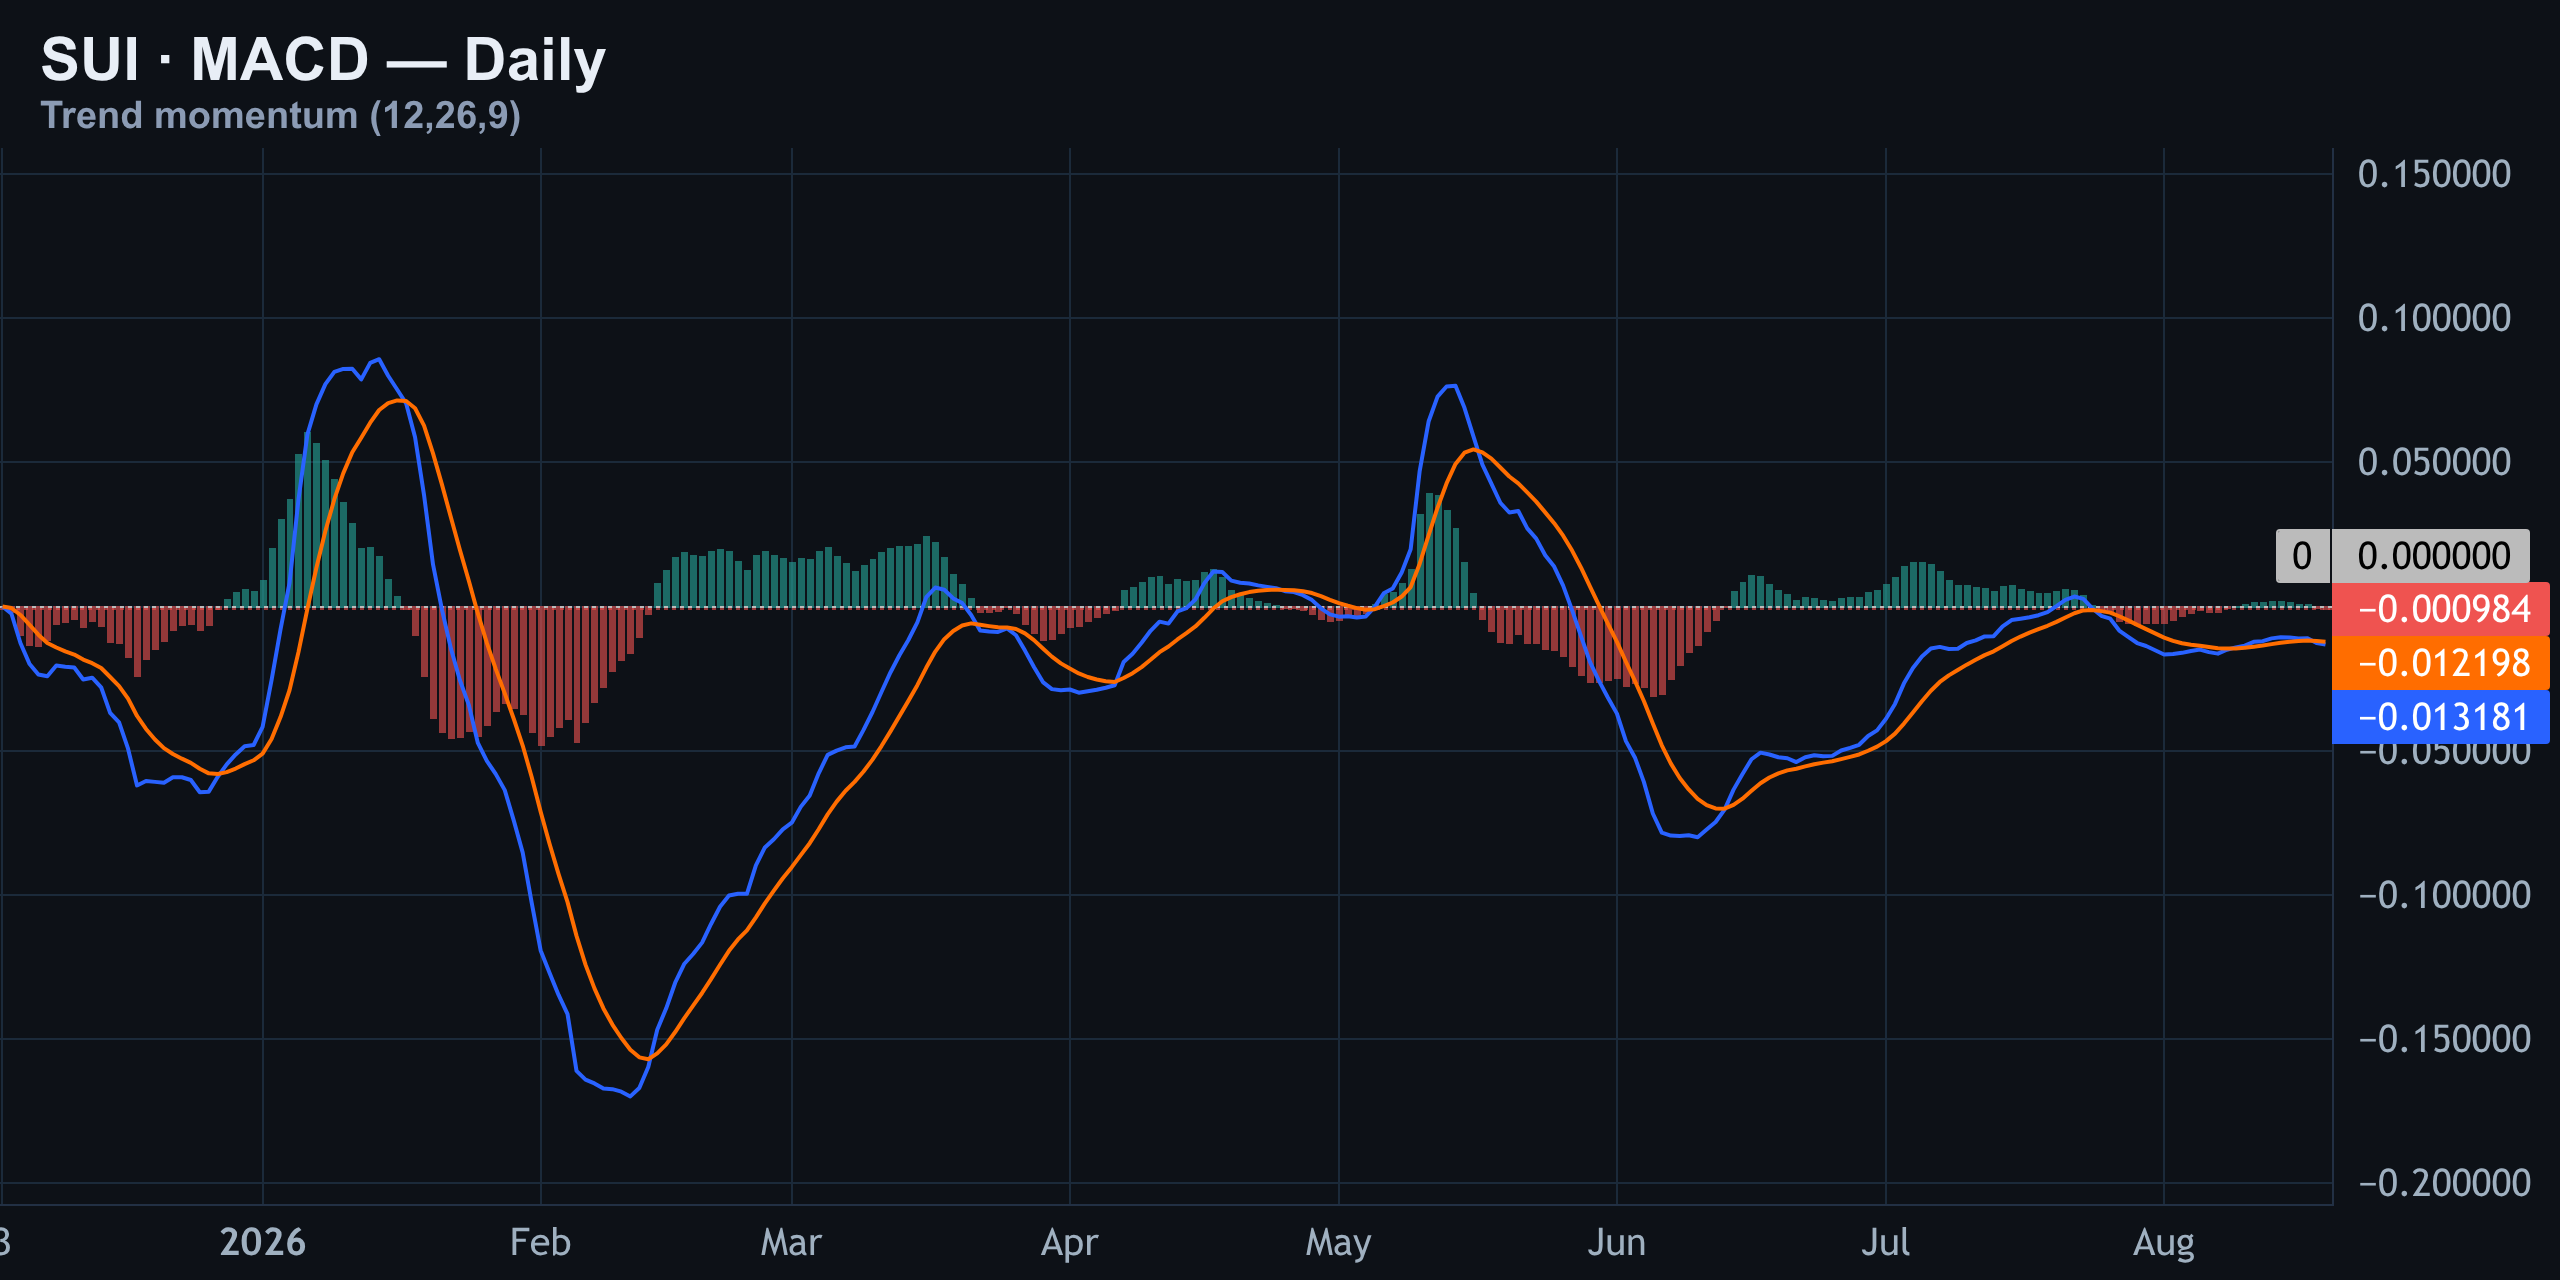
But look closely at the histogram: those red bars are shrinking, not expanding. That's downside momentum losing steam, not reversing outright. Sellers are still nominally in charge, but they're not pressing the advantage the way they were a few days ago.
The Liquidation Map: A Trap Sitting Just Below Spot
Here's the map traders should have open right now. Spot sits just under $0.66. The heaviest liquidation cluster is below, near $0.6513, where almost $4.7 million in leverage has already been cleared out. Smaller clusters sit above at roughly $0.6705, $0.6845, and $0.6915.
| Level | Price | Liquidation Size | Note |
|---|---|---|---|
| Resistance cluster | $0.6915 | $635K | Upper flush zone |
| Resistance cluster | $0.6845 | $749K | Mid flush zone |
| Resistance cluster | $0.6705 | $1.0M | Nearest overhead cluster |
| Spot price | ≈ $0.6600 | — | Current |
| Support / densest zone | $0.6513 | $4.7M | Already fought over once |
| Daily support | ≈ $0.6350 | — | Key floor, aligns with target |
| Old May high | ≈ $1.42 | — | Not threatened anytime soon |
Desk Snapshot: Who's Actually Buying This Bounce?
Coinbase is trading at roughly -0.061% versus Binance right now — a discount, not a premium. That matters because a persistent positive premium is the fingerprint of US spot demand stepping in, while a discount means American holders are the ones selling into strength.
In other words: US-side flow is quietly net-selling into this bounce, even as the headline price ticks higher. That's a meaningful tell for anyone tempted to chase the recovery off the flash-crash lows.
Live pricing across trackers puts SUI in the $0.65–$0.66 band as of today, with modest 24-hour movement on the day, and Yahoo Finance's SUI-USD feed showing a similar level with a recent daily decline of roughly 3.4%. CoinGecko data confirms the token remains nearly 88% below its all-time high of $5.35, set well before this year's grind lower.
Today's headlines are macro and regulatory rather than SUI-specific — the SEC continues pushing forward new crypto asset rules that are shaping sentiment across the broader altcoin complex, and longer-range forecasters remain split, with some outlets still floating scenarios where SUI could multiply several times over in a future bull cycle. None of that changes the intraday technical picture, but it's the backdrop this chart is trading against.
The Setup: Entry, Stop, and the Level That Kills It
Layering in on top of yesterday's still-open short, today's tighter setup respects the same bias: bearish until proven otherwise.
| Parameter | Level | Reward:Risk |
|---|---|---|
| Bias | Bearish | — |
| Entry zone | ≈ $0.659–$0.670 (rejection at 4H down-trend line) | — |
| Stop-loss | Above $0.6845 | — |
| Target 1 | $0.6513 (densest liquidation zone) | — |
| Target 2 (stretch) | $0.635 (daily support floor) | ≈ 1:2.5 |
| Invalidation | 4H close above the descending trend line / above $0.6915 | Bias flips bullish |
The setup works out to roughly 1:2.5 reward-to-risk from the described entry zone to the primary target. If price instead closes a 4-hour candle above the down-trend line and clears $0.6915, the whole bearish thesis is off the table — that's the level that kills it, and the one to watch above everything else on this chart.
Summary: SUI clawed back into the mid-$0.60s after a violent flash crash, but the bigger structures — the 4-hour down-trend line, the daily compression channel, and a Coinbase discount showing US sellers, not buyers — all argue the bounce is more bait than base. RSI and MACD are softening on the sell side without flashing a reversal signal, and the $4.7M liquidity cluster at $0.6513 remains the level the market is most likely to revisit before anything changes. Until $0.6915 breaks and holds, the lean stays down.
Previous days
08/18/2026 — SUI Daily Pulse Aug 18, 2026: Flush Under $0.65
SUI Daily Pulse Aug 18, 2026: Flush Under $0.65
Where We Left It — Two for Two on the Channel Breakdown
Since yesterday's call, SUI dropped another 4.1%, sliding from around $0.675 down to roughly $0.65. Yesterday's short thesis — entry near $0.68, stop at $0.685 — hit its $0.66 target clean. That's two for two now on this channel breakdown thesis, and the trend that kicked off this Daily Pulse series is still doing exactly what it said it would do.
As of writing, SUI is changing hands around $0.65–$0.68 depending on the venue, down roughly 1.6%–4% on the day, with intraday lows near $0.646 and highs near $0.68 on major exchanges. Yahoo Finance data pegs the pair at $0.6734, down 1.61%, while Investing.com shows a slightly higher print of $0.6785 against a previous close of $0.6829 — the spread between venues itself is a tell we'll come back to later.
The Setup: Bearish Below the Mid-Sixties
SUI is trading around $0.65 right now, down over four percent on the day after sweeping through last week's support. Structure on both the fifteen-minute and four-hour charts is still making lower highs inside a descending channel. Momentum is neutral-to-soft — not oversold — which means there's room left to fall before this gets stretched.
Bias stays bearish below the mid-sixties unless buyers reclaim and hold that broken structure. In plain terms: the trend that started this pulse series is still intact, and nothing on the tape today has flipped it.
15-Minute Intraday — The Flush and the Fade
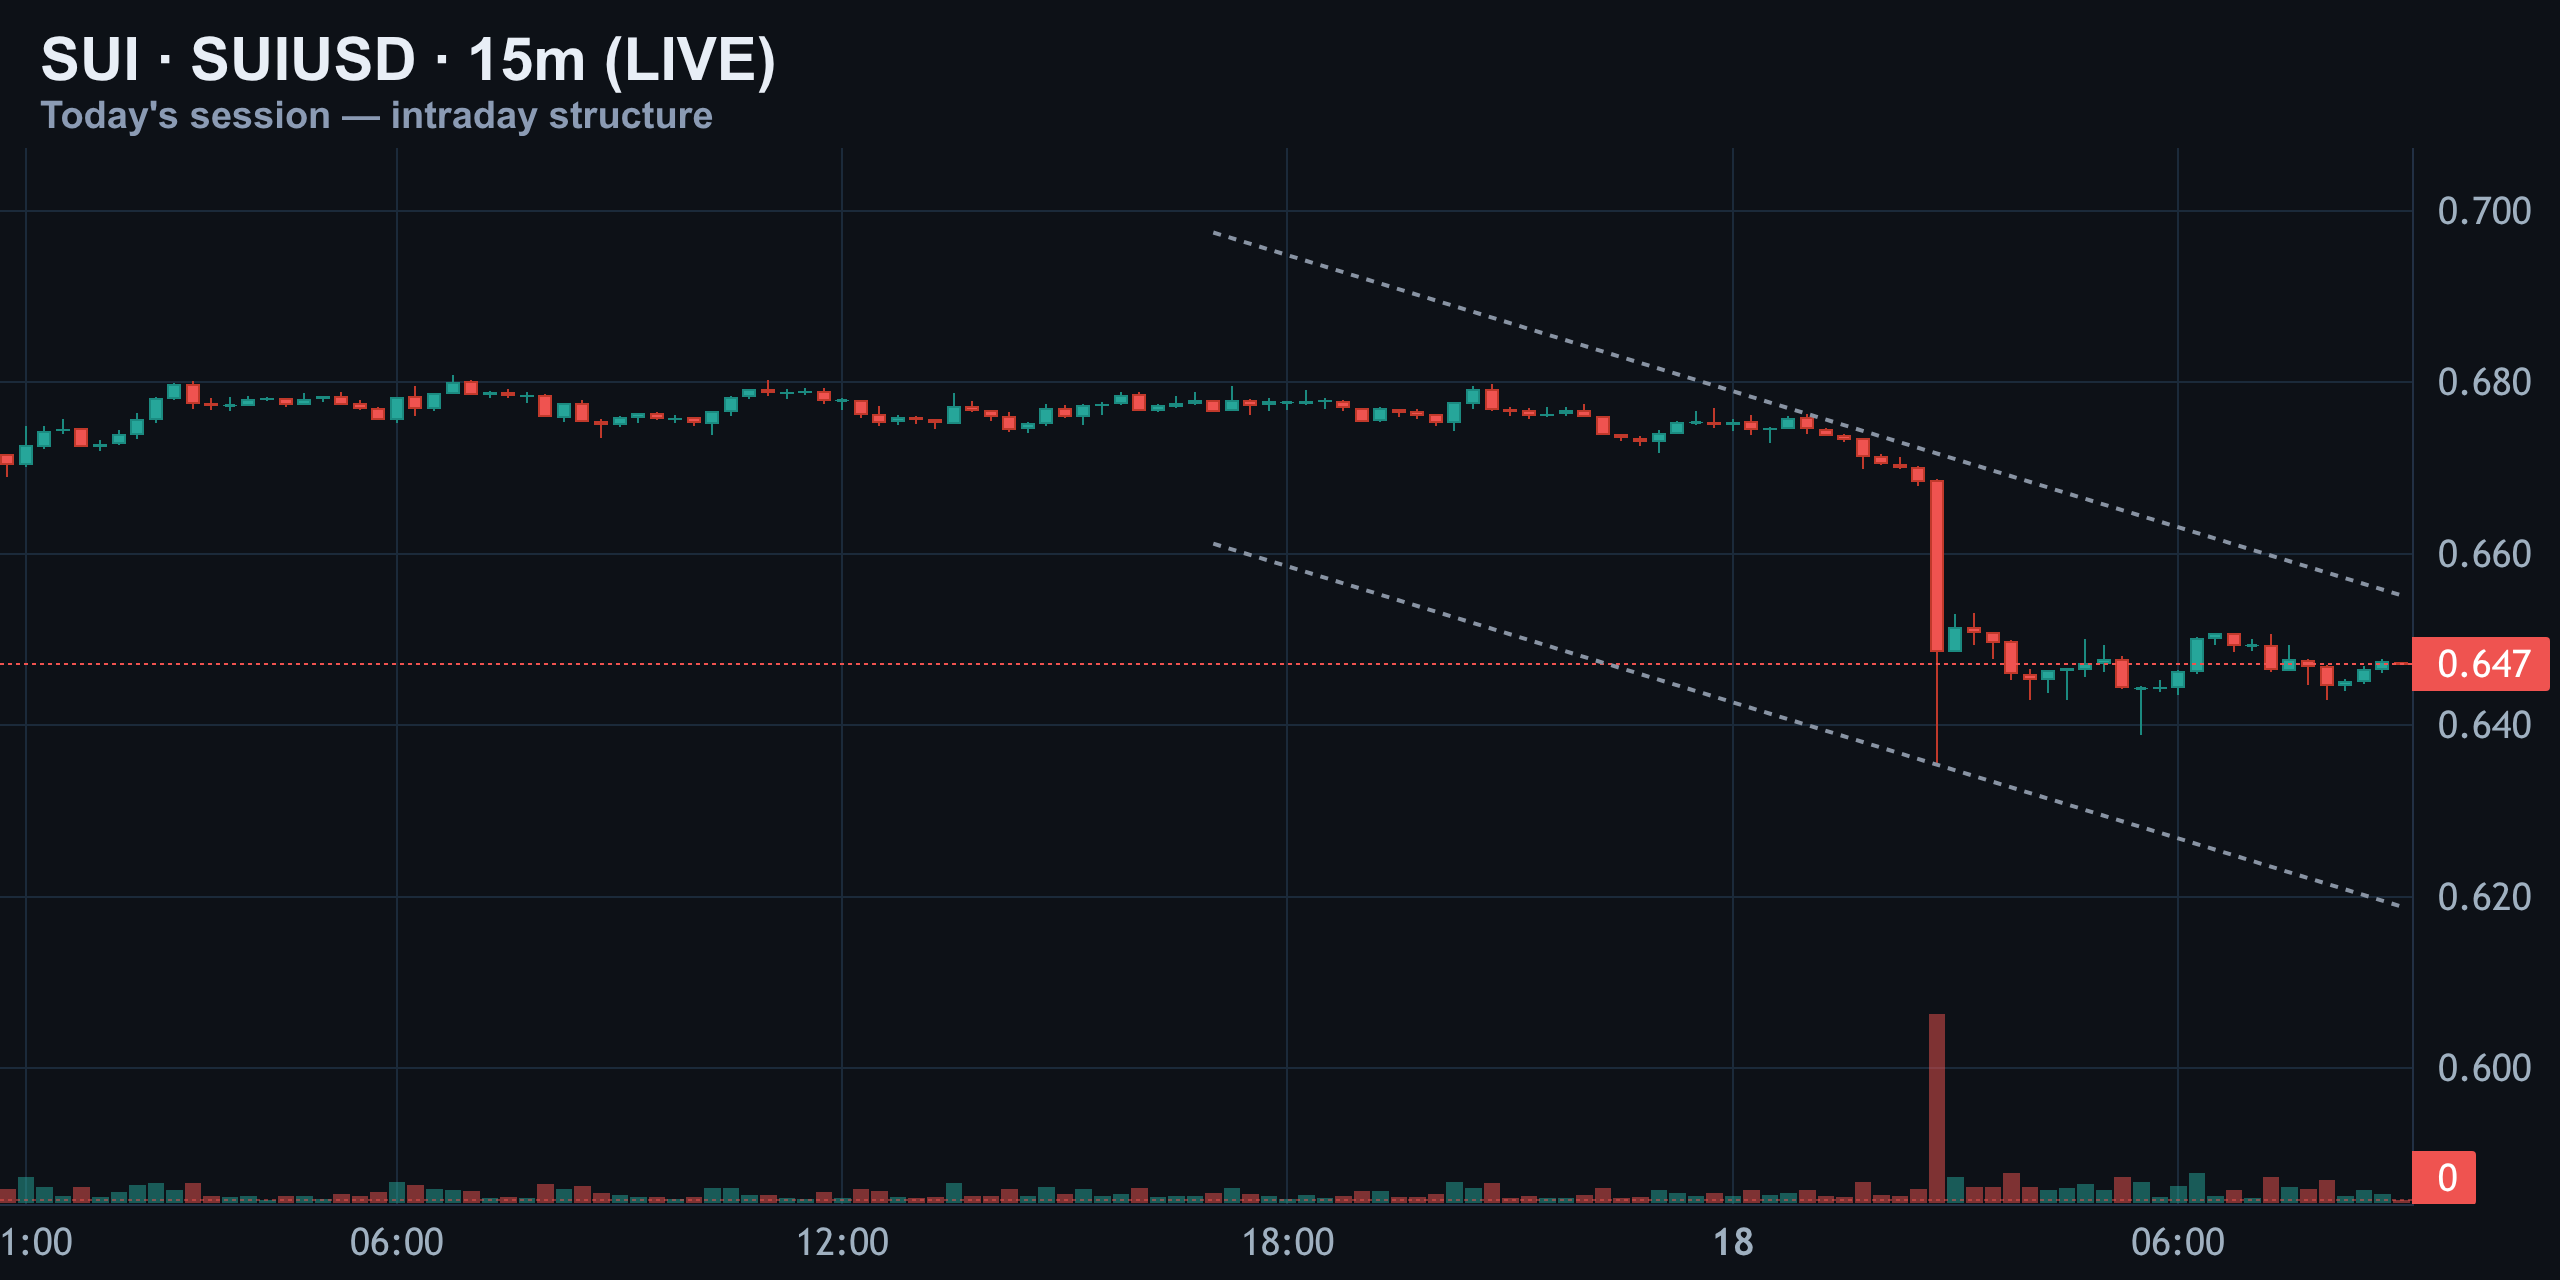
Zoom into today's session and you can see exactly where the pain happened — a single 15-minute candle wicked from around $0.67 down through $0.60 before buyers stepped back in. Since then, SUI's been chopping sideways right at the $0.65 mark, pinned under a descending trendline.
That wick is a liquidity grab, not a reversal signal yet — the structure above is still lower highs, lower lows. In plain terms: SUI crashed fast then went flat, and the trend is still pointing down.
4-Hour Structure — Channel Breakdown Confirmed
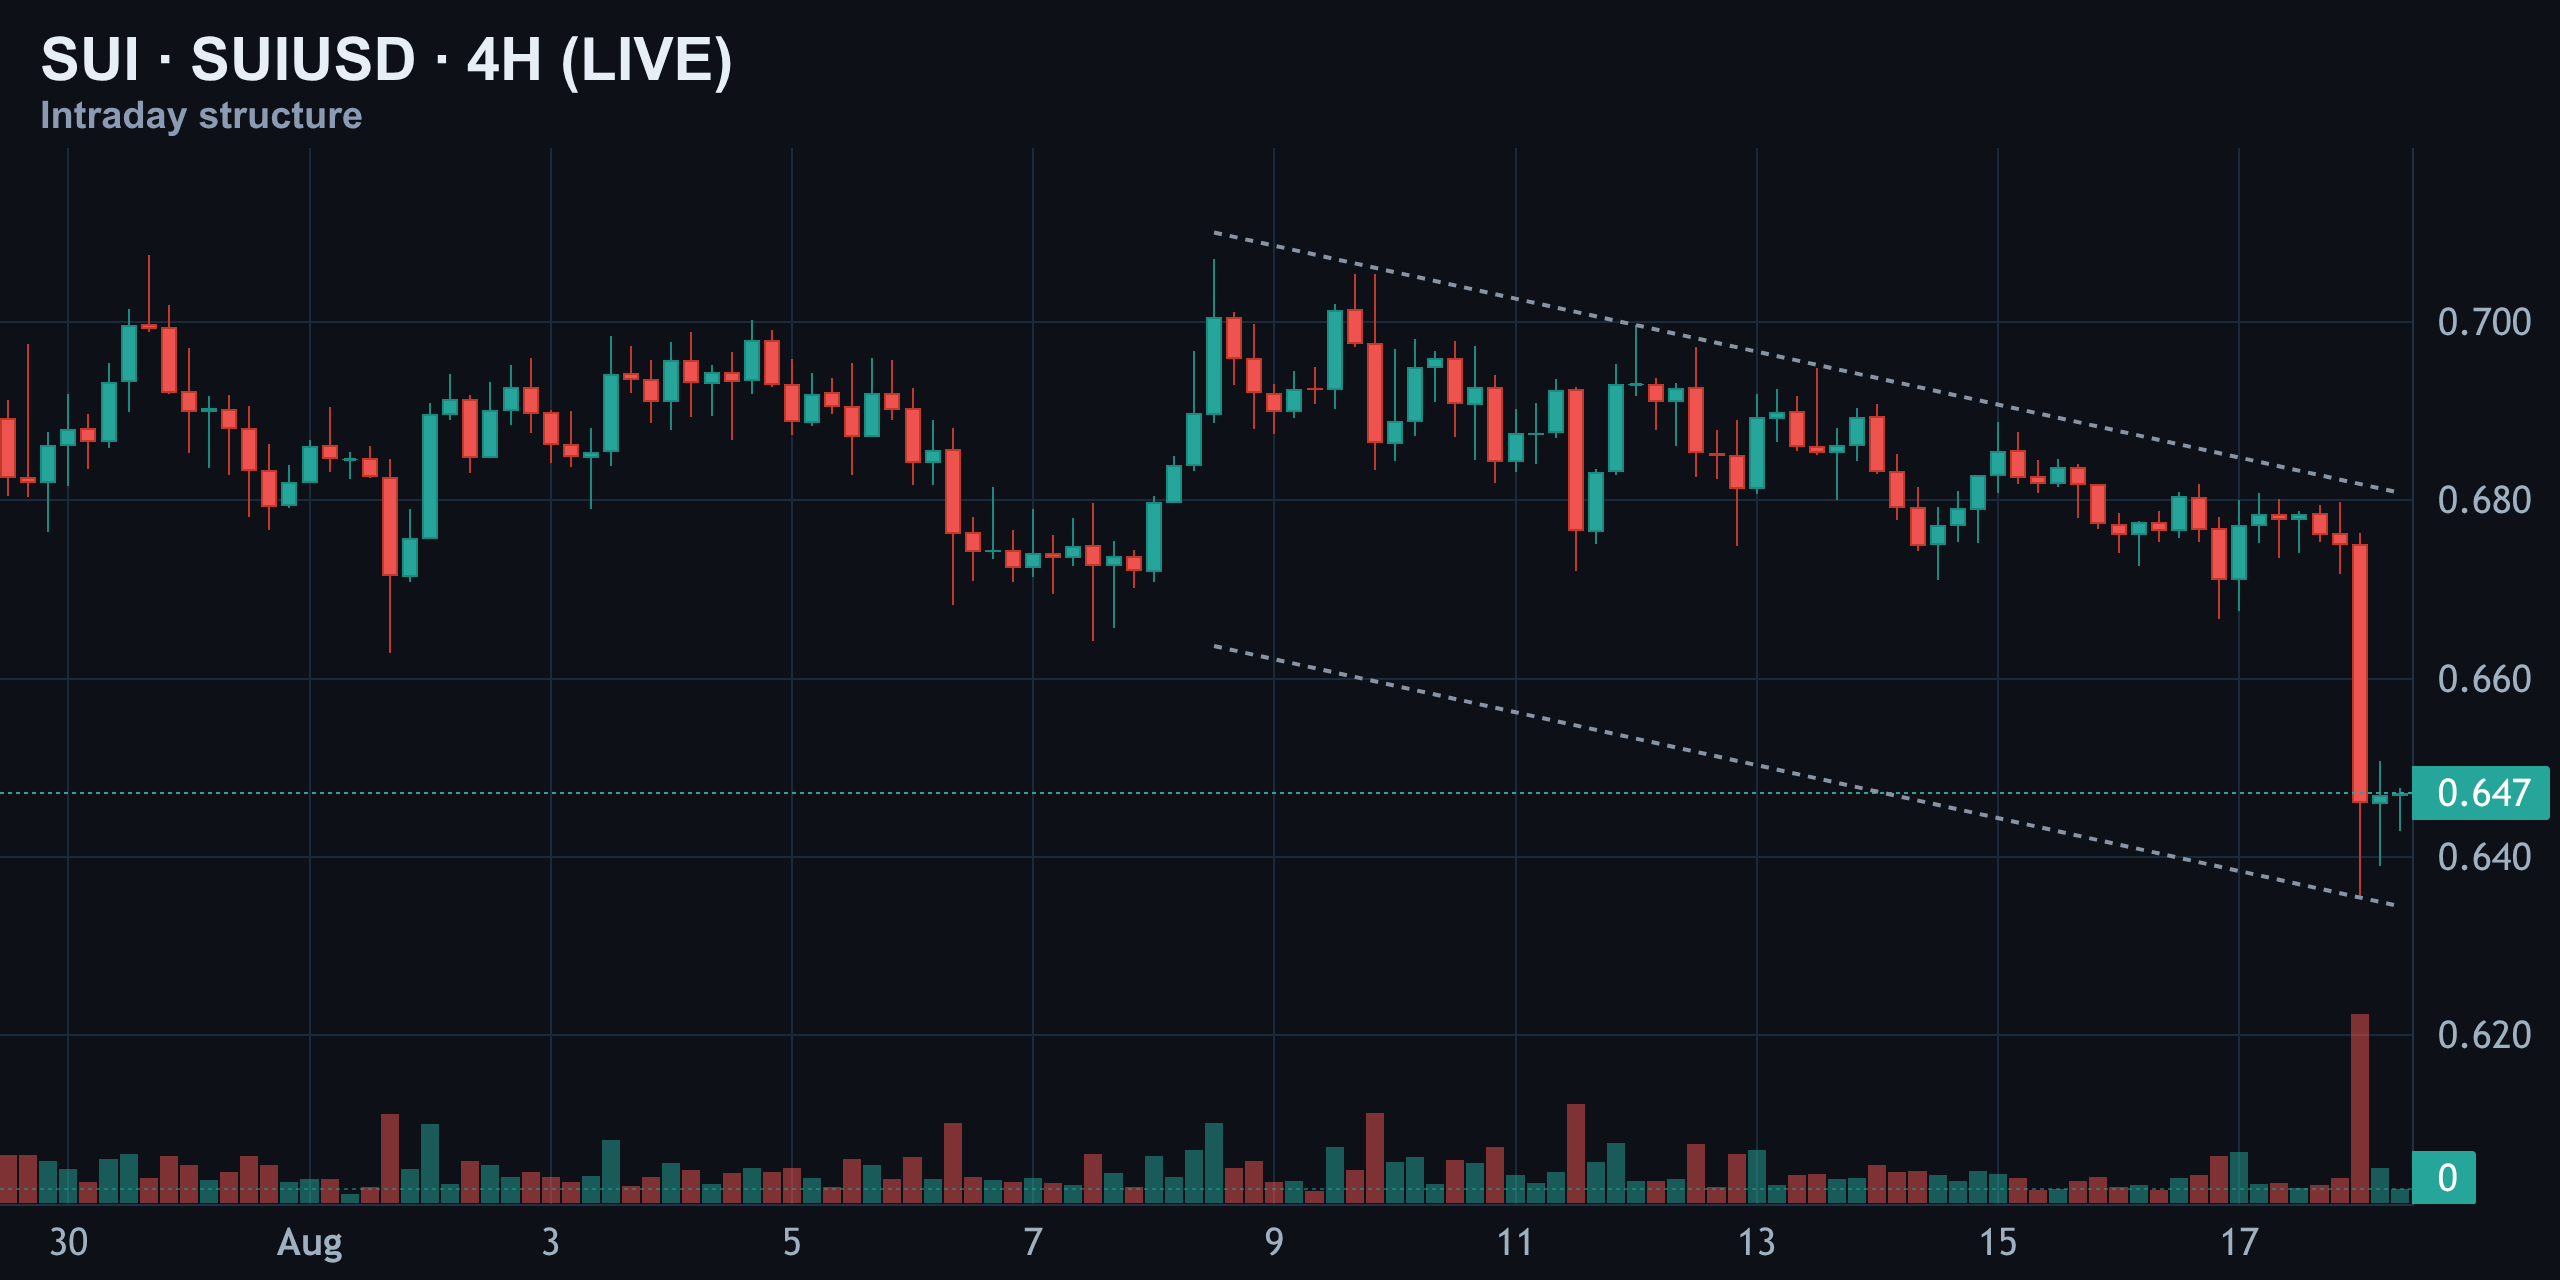
The four-hour view is the real story of the day. SUI had been grinding inside a tight descending channel since around August 9, and today it broke straight through the bottom of that channel on the heaviest volume bar we've seen in over two weeks. That's not a random wick — that's structural.
Until price reclaims back above roughly $0.68, this breakdown stays confirmed and the path of least resistance points lower. In plain terms: the price broke down through its trend channel on heavy volume today.
Short-Term Daily — Boxed In Between Two Walls
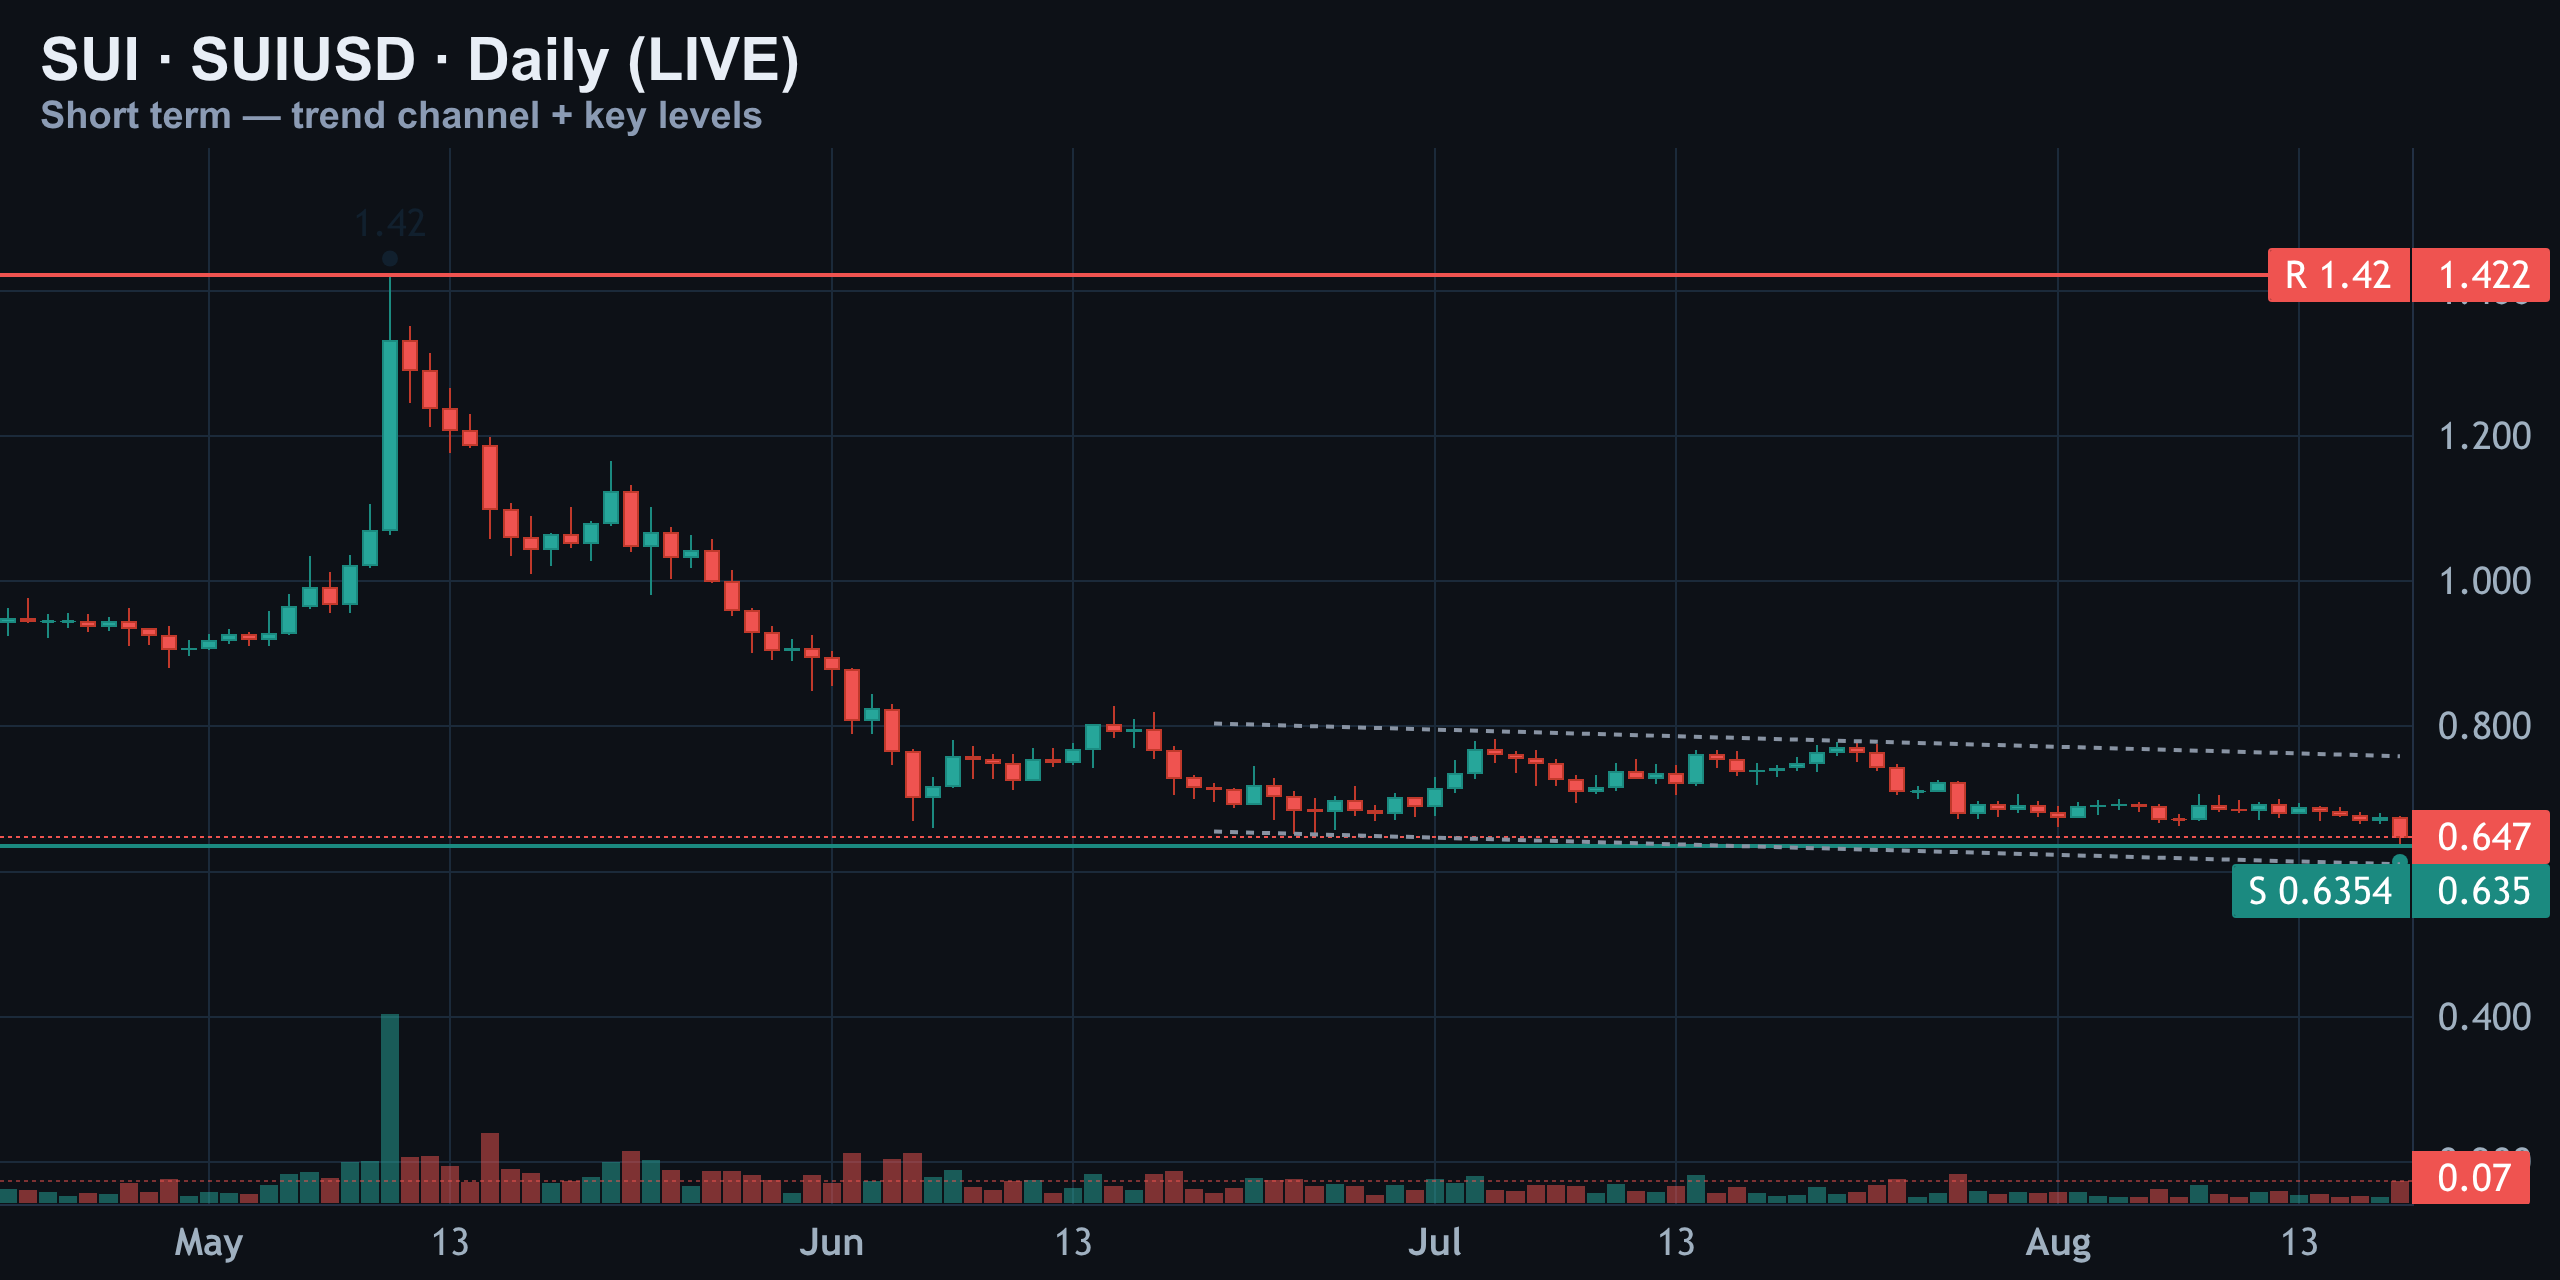
Pulling back to the daily chart, SUI's summer story is simple — a spike to $1.42 back in May, then a long, grinding bleed all the way back down. We're now testing the lower boundary of that multi-week range, with the $0.635 zone as the next real shelf of support.
Everything above that, back toward $0.70, is now acting as resistance instead of a floor. In plain terms: SUI gave back its summer bounce and sits near this range's bottom.
| Level | Price | Role |
|---|---|---|
| Major resistance | $0.70 | Old floor, now ceiling |
| Overhead liquidation cluster | $0.67 – $0.68 | Two weeks of piled-up shorts/longs |
| Current spot | ~$0.65 | Pinned under trendline |
| Below-spot liquidation cluster | ~$0.65 ($4.6M) | Already fought over, not a target |
| Next shelf | $0.635 | Range floor |
| Heavy bid wall | $0.60 | ~494k SUI, biggest support shelf |
RSI (14) — Neutral, Not Oversold Yet
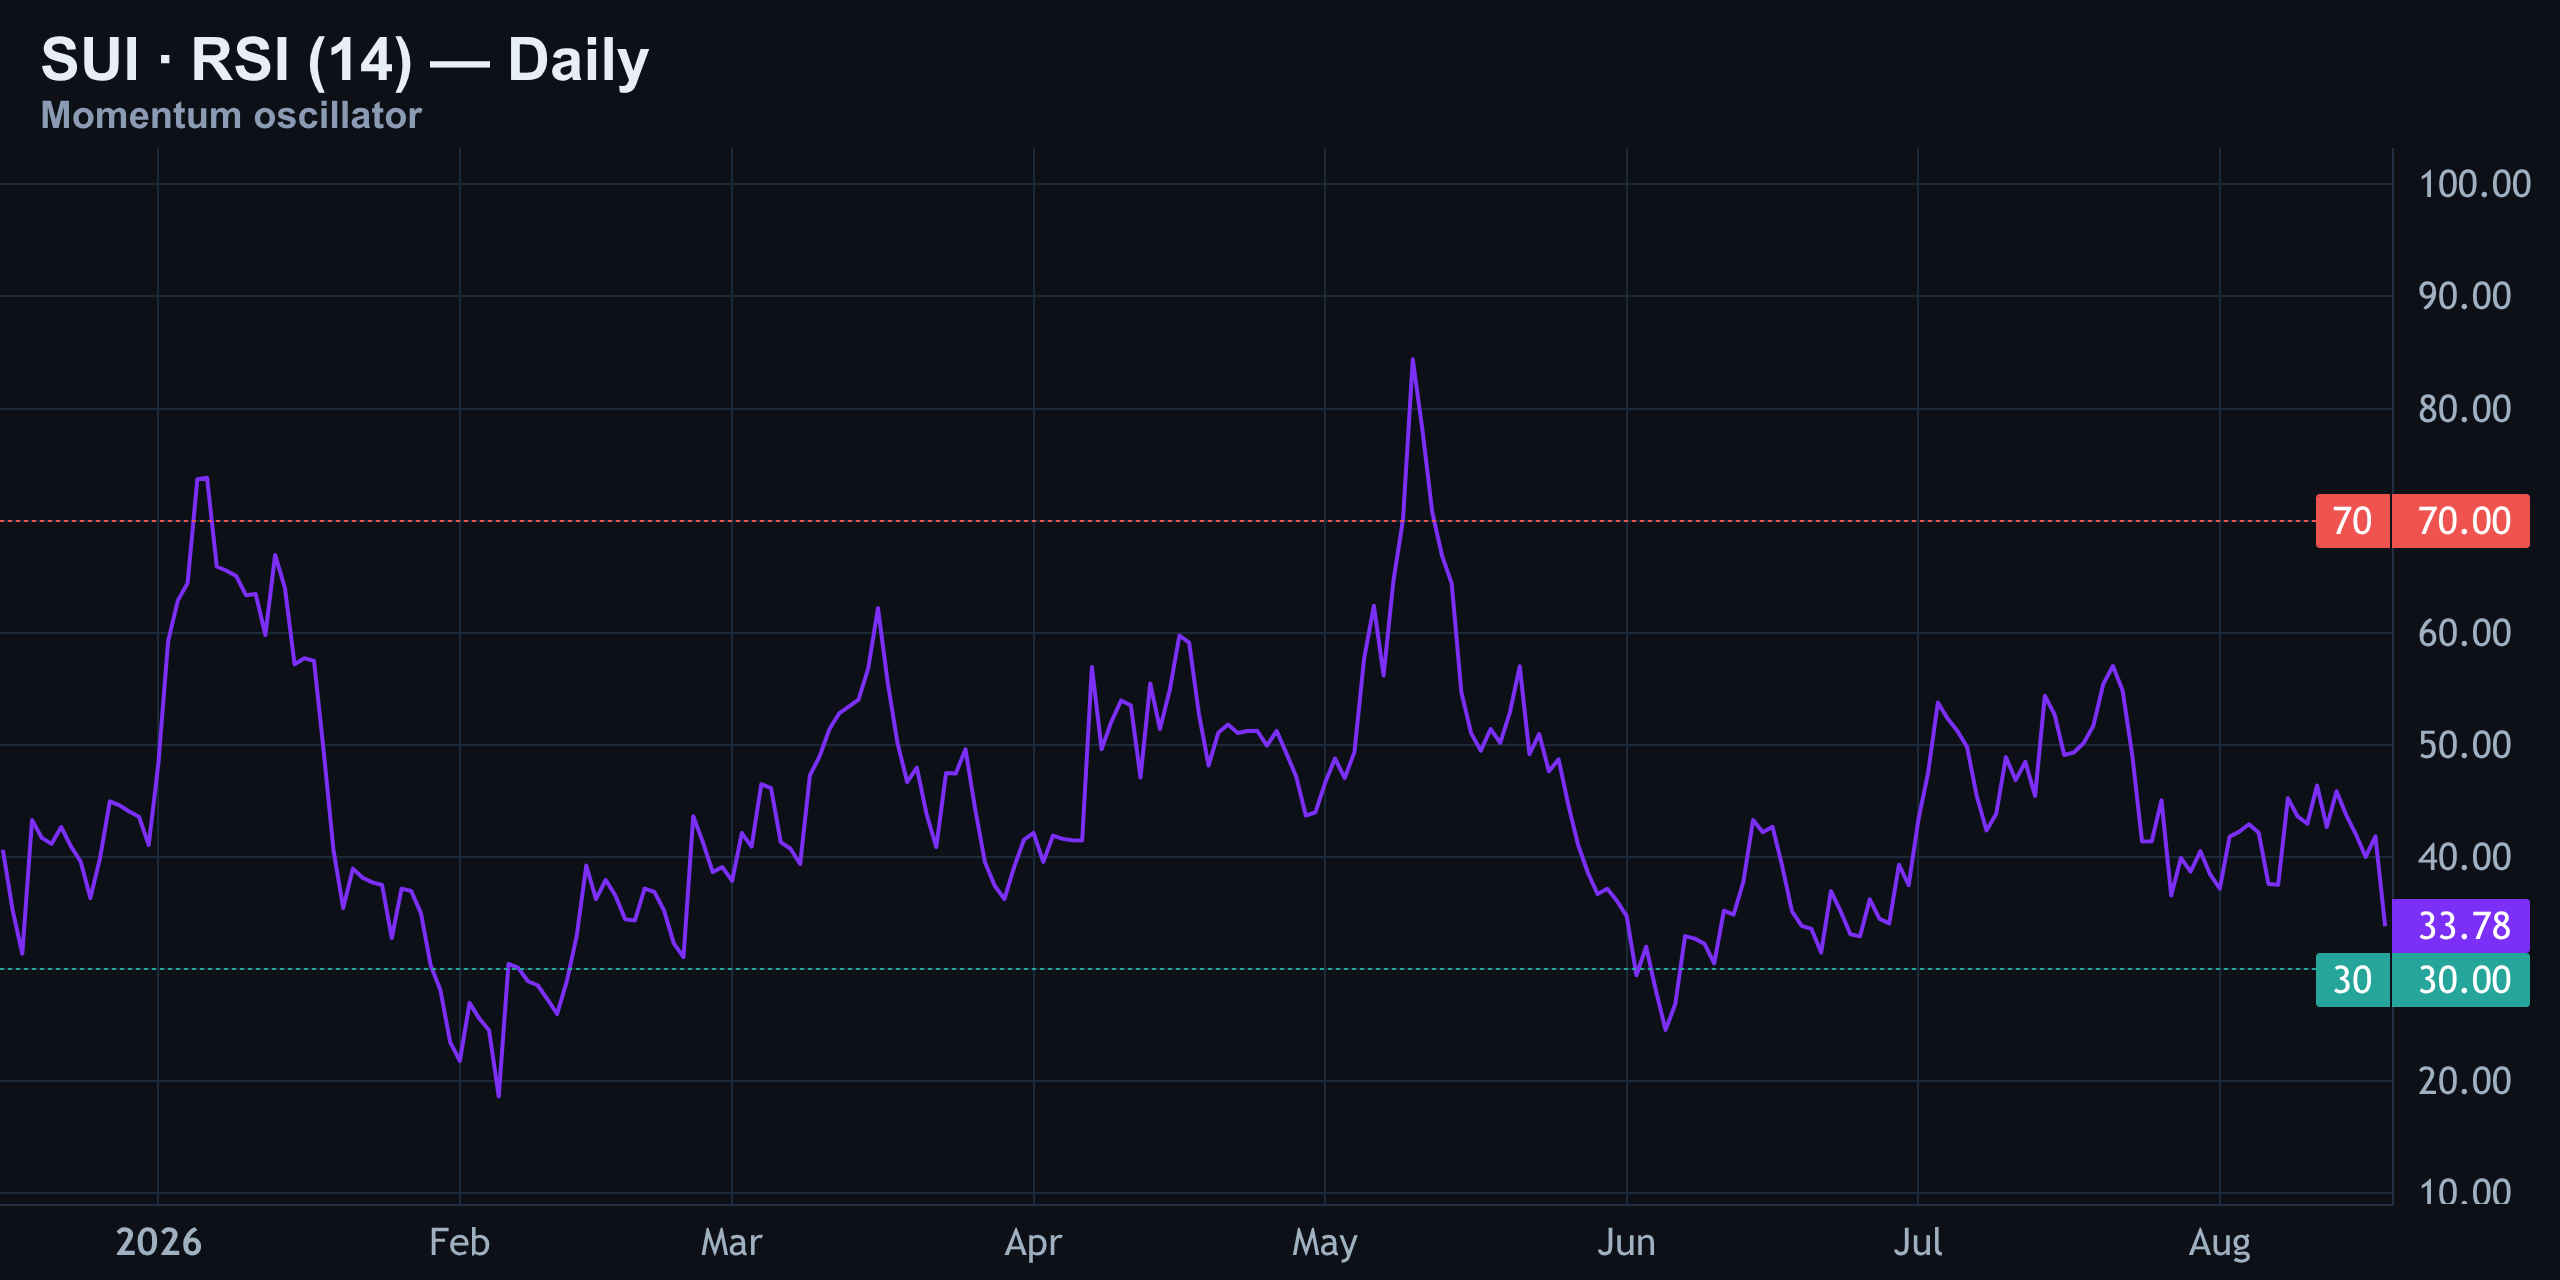
The daily RSI sits at 34 right now — that's the 14-period reading, and it's telling us momentum is weak but not yet exhausted. Thirty is the line most traders watch for oversold, and we're still six points above it.
No divergence has shown up yet either, meaning price and momentum are falling together, in sync. That's a sign this move could still have legs before buyers get a real edge. In plain terms: momentum is weak but not extreme — SUI could still fall further.
MACD — Bearish Cross Holding
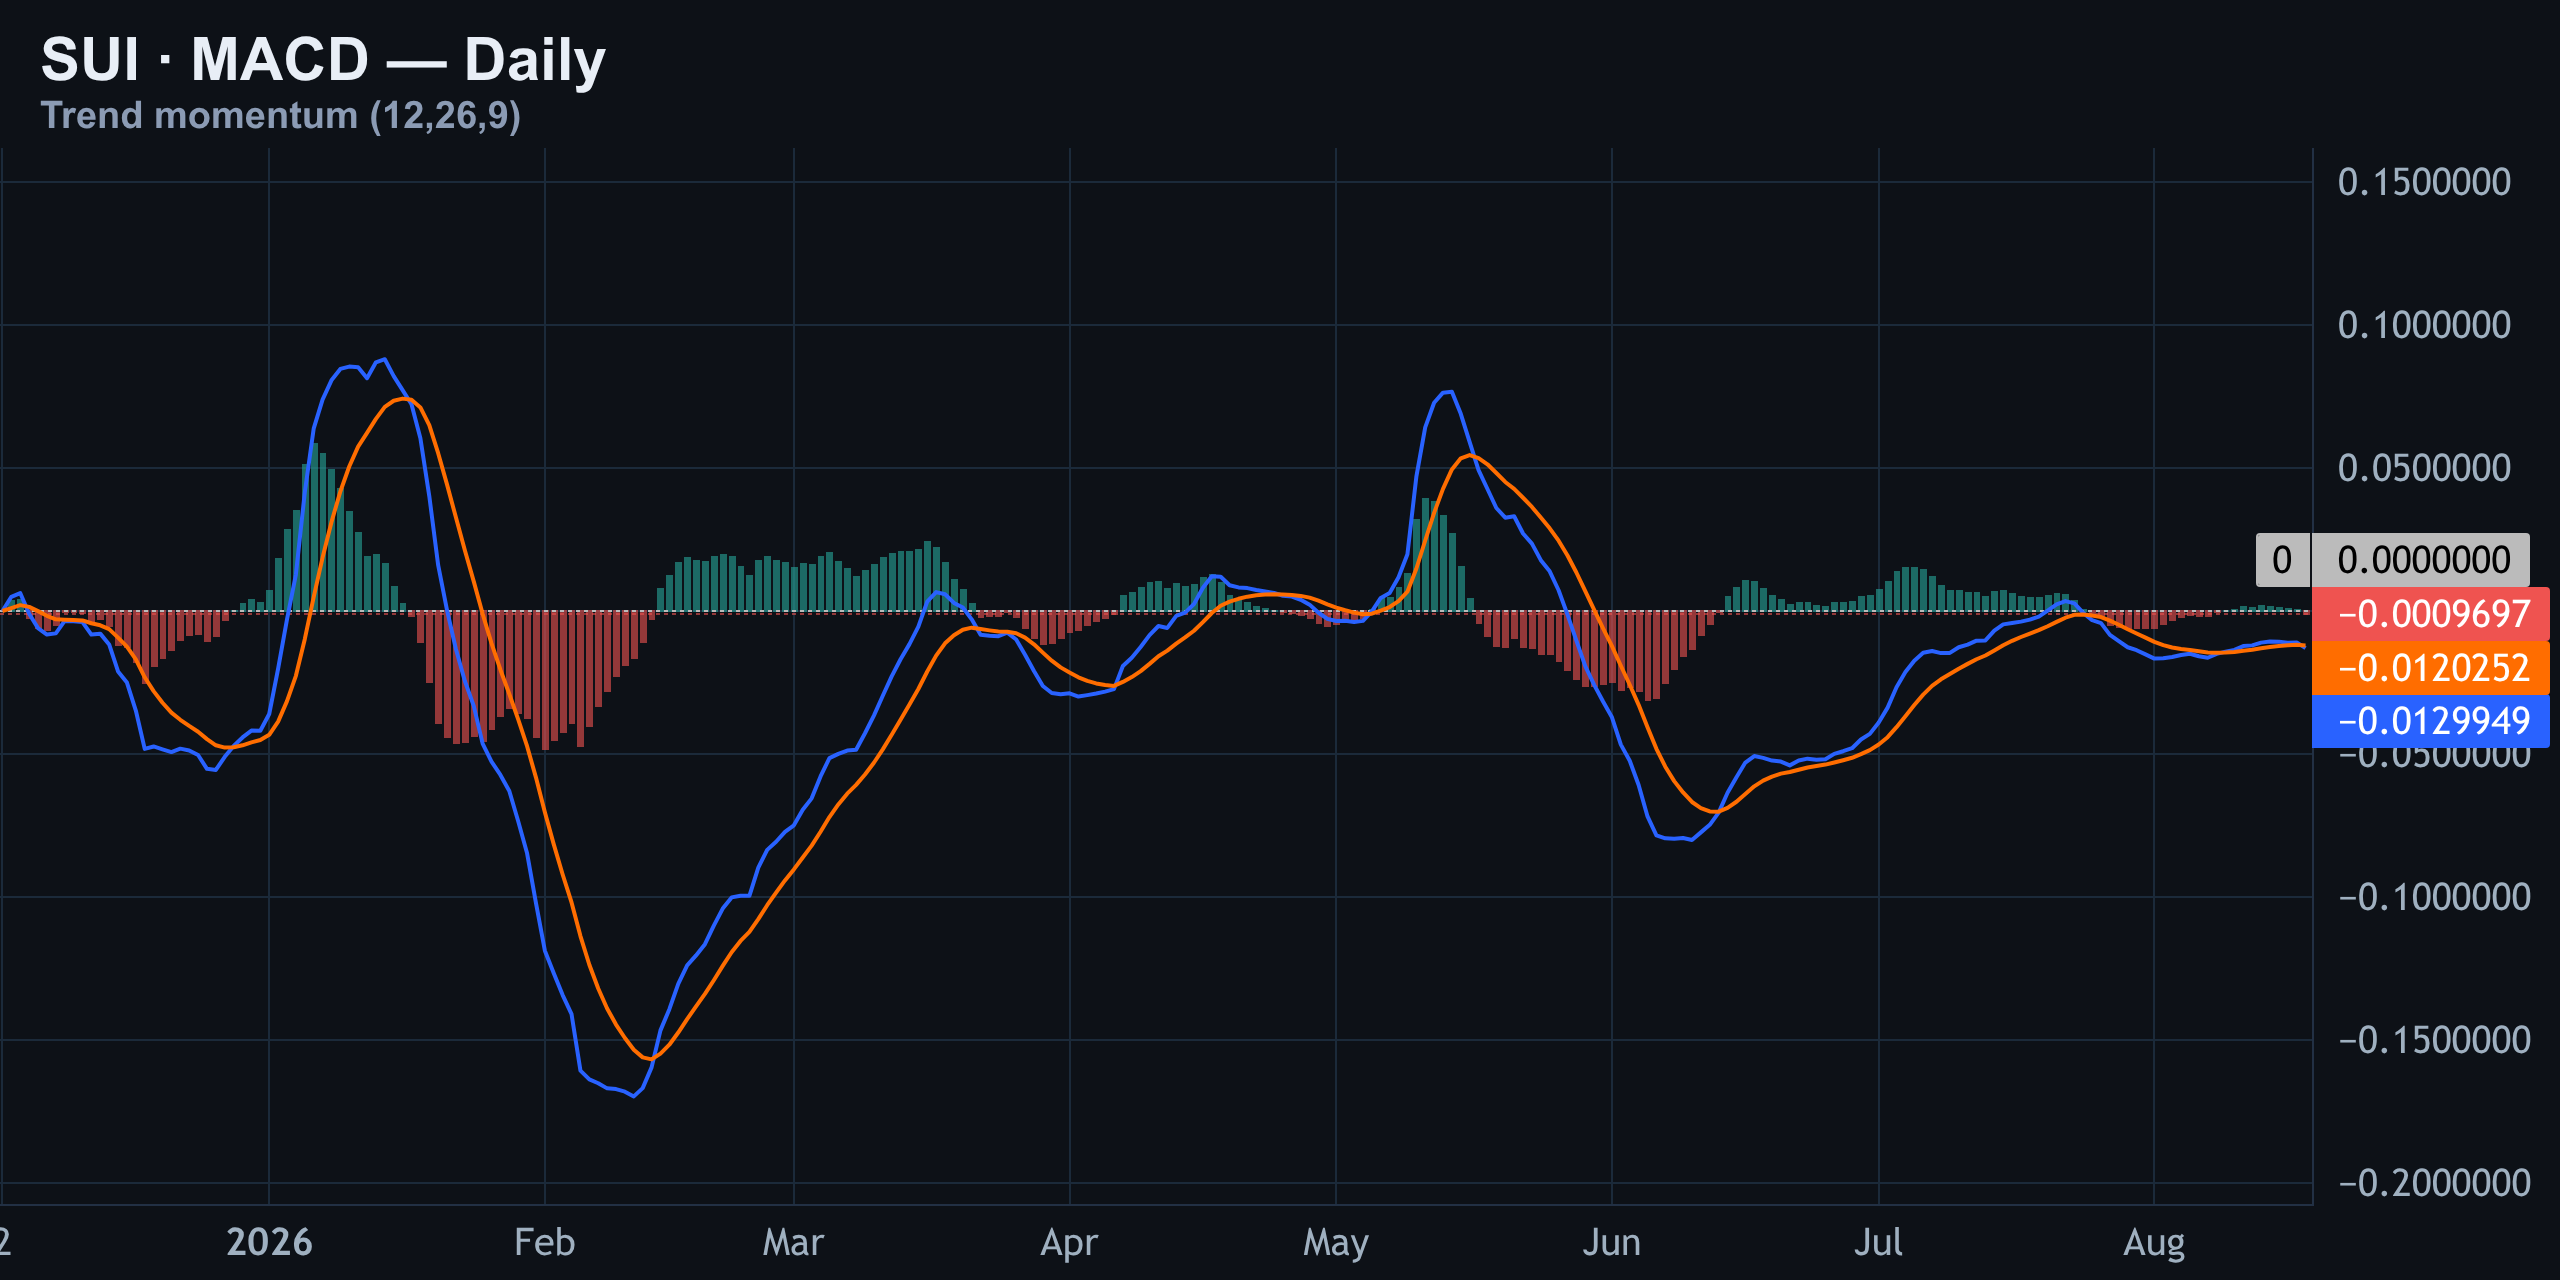
The daily MACD confirms what the RSI is hinting at. The MACD line is under its signal line, both sitting below the zero line, and the histogram bars are red and growing — that's negative momentum building, not fading. There's no crossover forming yet that would flag a shift back toward buyers.
This lines up cleanly with the channel breakdown on the four-hour chart — momentum and structure are telling the same story today. In plain terms: the trend indicator confirms sellers are still in control right now.
Liquidation Heatmap & Positioning — Who's Actually Selling?
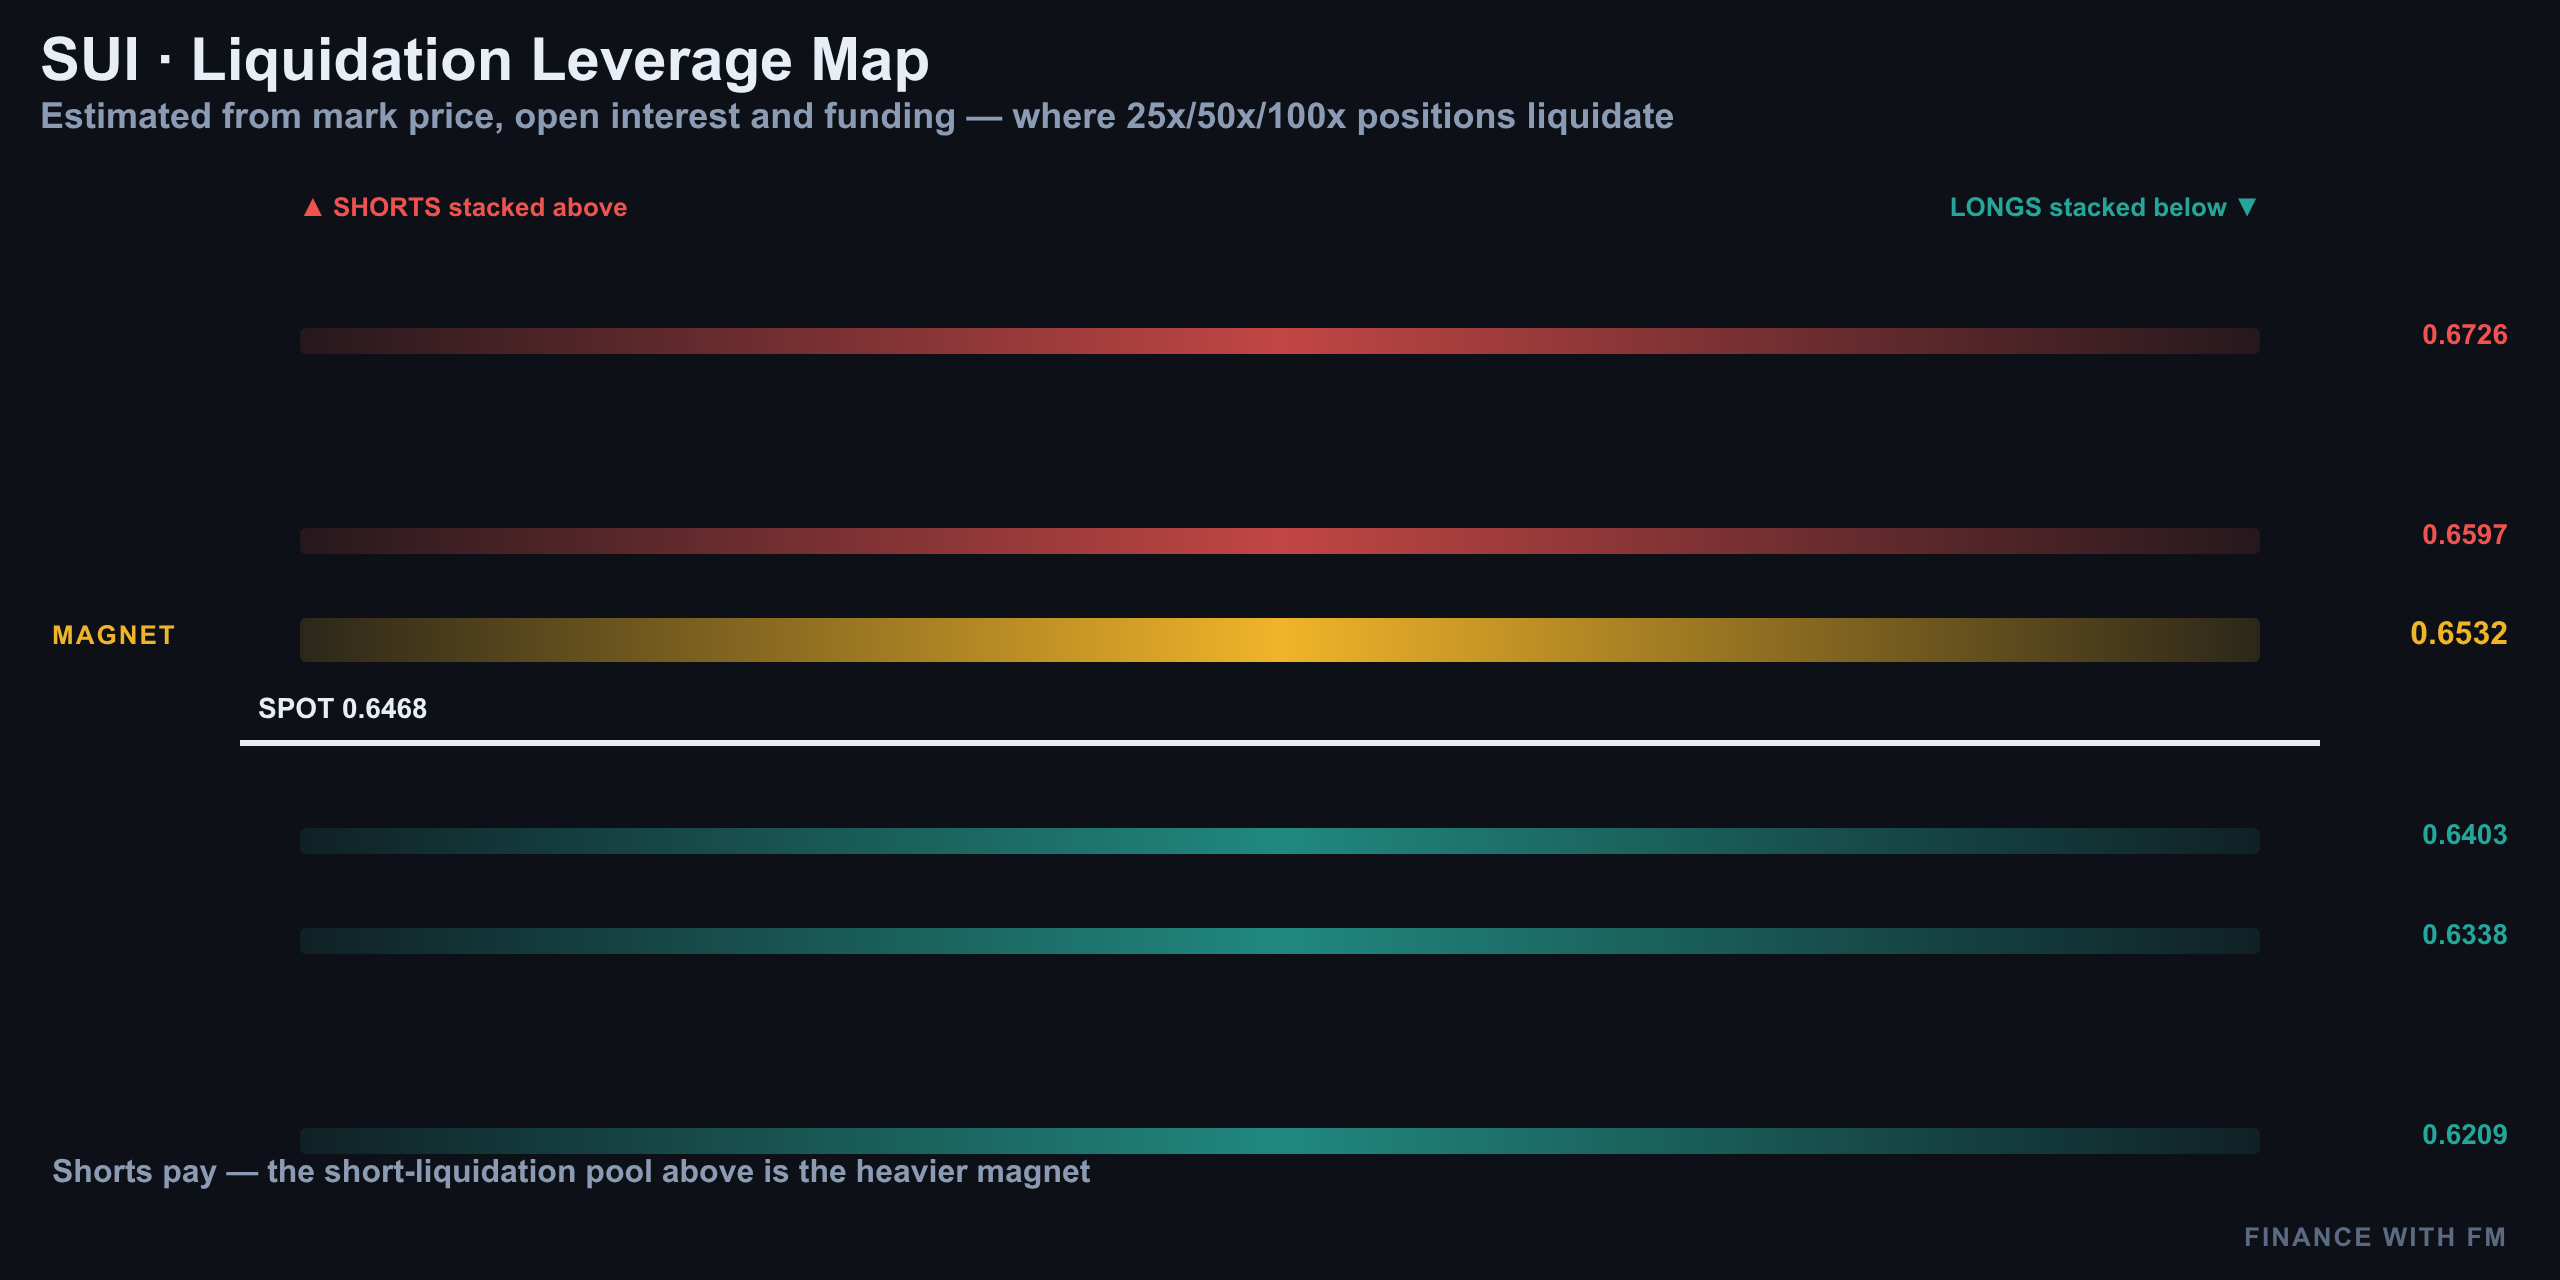
The key map today: a heavy bid wall of roughly 494,000 SUI sits at $0.60, the biggest support shelf on the book. Overhead, a much thinner ask wall of under 100,000 SUI sits at $0.70. In between, the last two weeks of liquidations have piled up right around $0.67–$0.68 above, and a dense $4.6 million cluster just below spot near $0.65 — that's a level that's already been fought over, not a target.
Funding, Positioning & Order Flow
| Metric | Reading | What it means |
|---|---|---|
| Funding rate | Shorts paying ~9% APR | Crowded shorts — squeeze-up fuel |
| Open interest (7d) | +6%+ | Leverage building into the drop, not fading |
| Retail positioning | 2.04x long | Retail is aligned long, not fading the move |
| Top trader positioning | 2.38x long | Smart money is even longer than retail — no edge fade |
| Taker flow | 0.83 | Sellers hitting bids aggressively |
| Coinbase vs Binance premium | -0.077% (discount) | US spot side is selling, not buying |
A persistent positive premium is normally the fingerprint of US spot/ETF buying; a discount, like we're seeing now, means American holders are the sellers today. With retail and top traders both net long and aligned, positioning gives no obvious edge to fade right now.
Today's Drivers & The Desk's Trade Plan
Put it all together and today's tape is a genuine tug-of-war. Structure and momentum (RSI, MACD, the 4-hour channel break) all point down. But funding flipping negative, a crowded short base, and a magnet of short liquidations sitting just overhead argue for a sharp squeeze before any real breakdown continues. That's the layered setup this Pulse opened with.
| Scenario | Trigger | Target/Stop |
|---|---|---|
| Bearish continuation | Rejection below $0.68 wall | Target $0.635, then $0.60 bid wall |
| Short-squeeze bounce | Reclaim and hold above $0.68 | Target $0.70 ask wall |
| Invalidation | Sustained close above $0.68 mid-sixties reclaim | Kills the short thesis |
The desk's read: risk/reward on the short side into the $4.6M liquidation cluster near $0.65 is roughly 1:3.1 — favorable, but not without teeth. The one level that kills the trade is a sustained reclaim of the $0.68 mid-sixties zone; above that, the crowded-short setup starts feeding a squeeze toward $0.70 instead of a continuation lower.
Summary
SUI got flushed nearly 5% overnight, structure remains broken on the 4-hour and daily, and RSI/MACD both confirm sellers are still in control — yet funding, open interest, and a discount on Coinbase versus Binance hint that the next sharp move could be a squeeze through the crowded short base above $0.68.
With SUI's market cap near $2.65B and price still miles above its $0.3648 all-time low, the mid-sixties remain the pivot that decides whether this is a healthy pullback or the start of a deeper leg down.
08/17/2026 — SUI Daily Pulse Aug 17: Bounce Fades Under $0.68
SUI Daily Pulse Aug 17: Bounce Fades Under $0.68
Where We Left It: The Prior Call Is Still Live
Yesterday's Daily Pulse flagged a short from $0.682, targeting $0.664. Since then, SUI hasn't moved much at all — it slipped roughly half a percent, drifting from around $0.678 down to about $0.675. That's not a victory lap, but it's not damage either.
As of writing, SUI is quoted at $0.6779 on CoinMarketCap, up a marginal 0.24% on the day, while CoinGecko shows a nearly identical $0.6767. Coinbase data via Yahoo Finance had SUI slightly higher at $0.6814 in its most recent daily close — small cross-venue gaps like this are normal and, as we'll see later, actually tell a story of their own.
Today's Bias: Fade the Bounce, Don't Chase the Breakout
SUI is trading around $0.675 right now, down slightly on the day after tagging a high near $0.68 overnight. The bigger picture still favors sellers. Price is capped under a descending trendline on the 4-hour chart, and the daily chart remains stuck inside a downward channel that's been intact since July.
Momentum indicators are trying to turn — more on that below — but market structure hasn't confirmed a reversal. That combination is what makes this a fade-the-bounce environment rather than a breakout setup, at least for now.
- Spot: ~$0.675, down modestly on the day
- Overnight high: ~$0.68 (rejected twice)
- 4H structure: capped by falling ceiling
- Daily structure: inside downtrend channel since July peak near $0.80
Chart Breakdown: 15-Minute Squeeze Meets a Falling Ceiling
15-Minute Intraday — Ascending Channel, Losing the Top
Zoom into the 15-minute chart and you can see today's whole story play out. SUI pushed up inside a rising channel, tapped resistance near $0.68 twice, and got turned away both times. It's now drifting back down toward the $0.675 line, which has acted as a magnet for price all session.
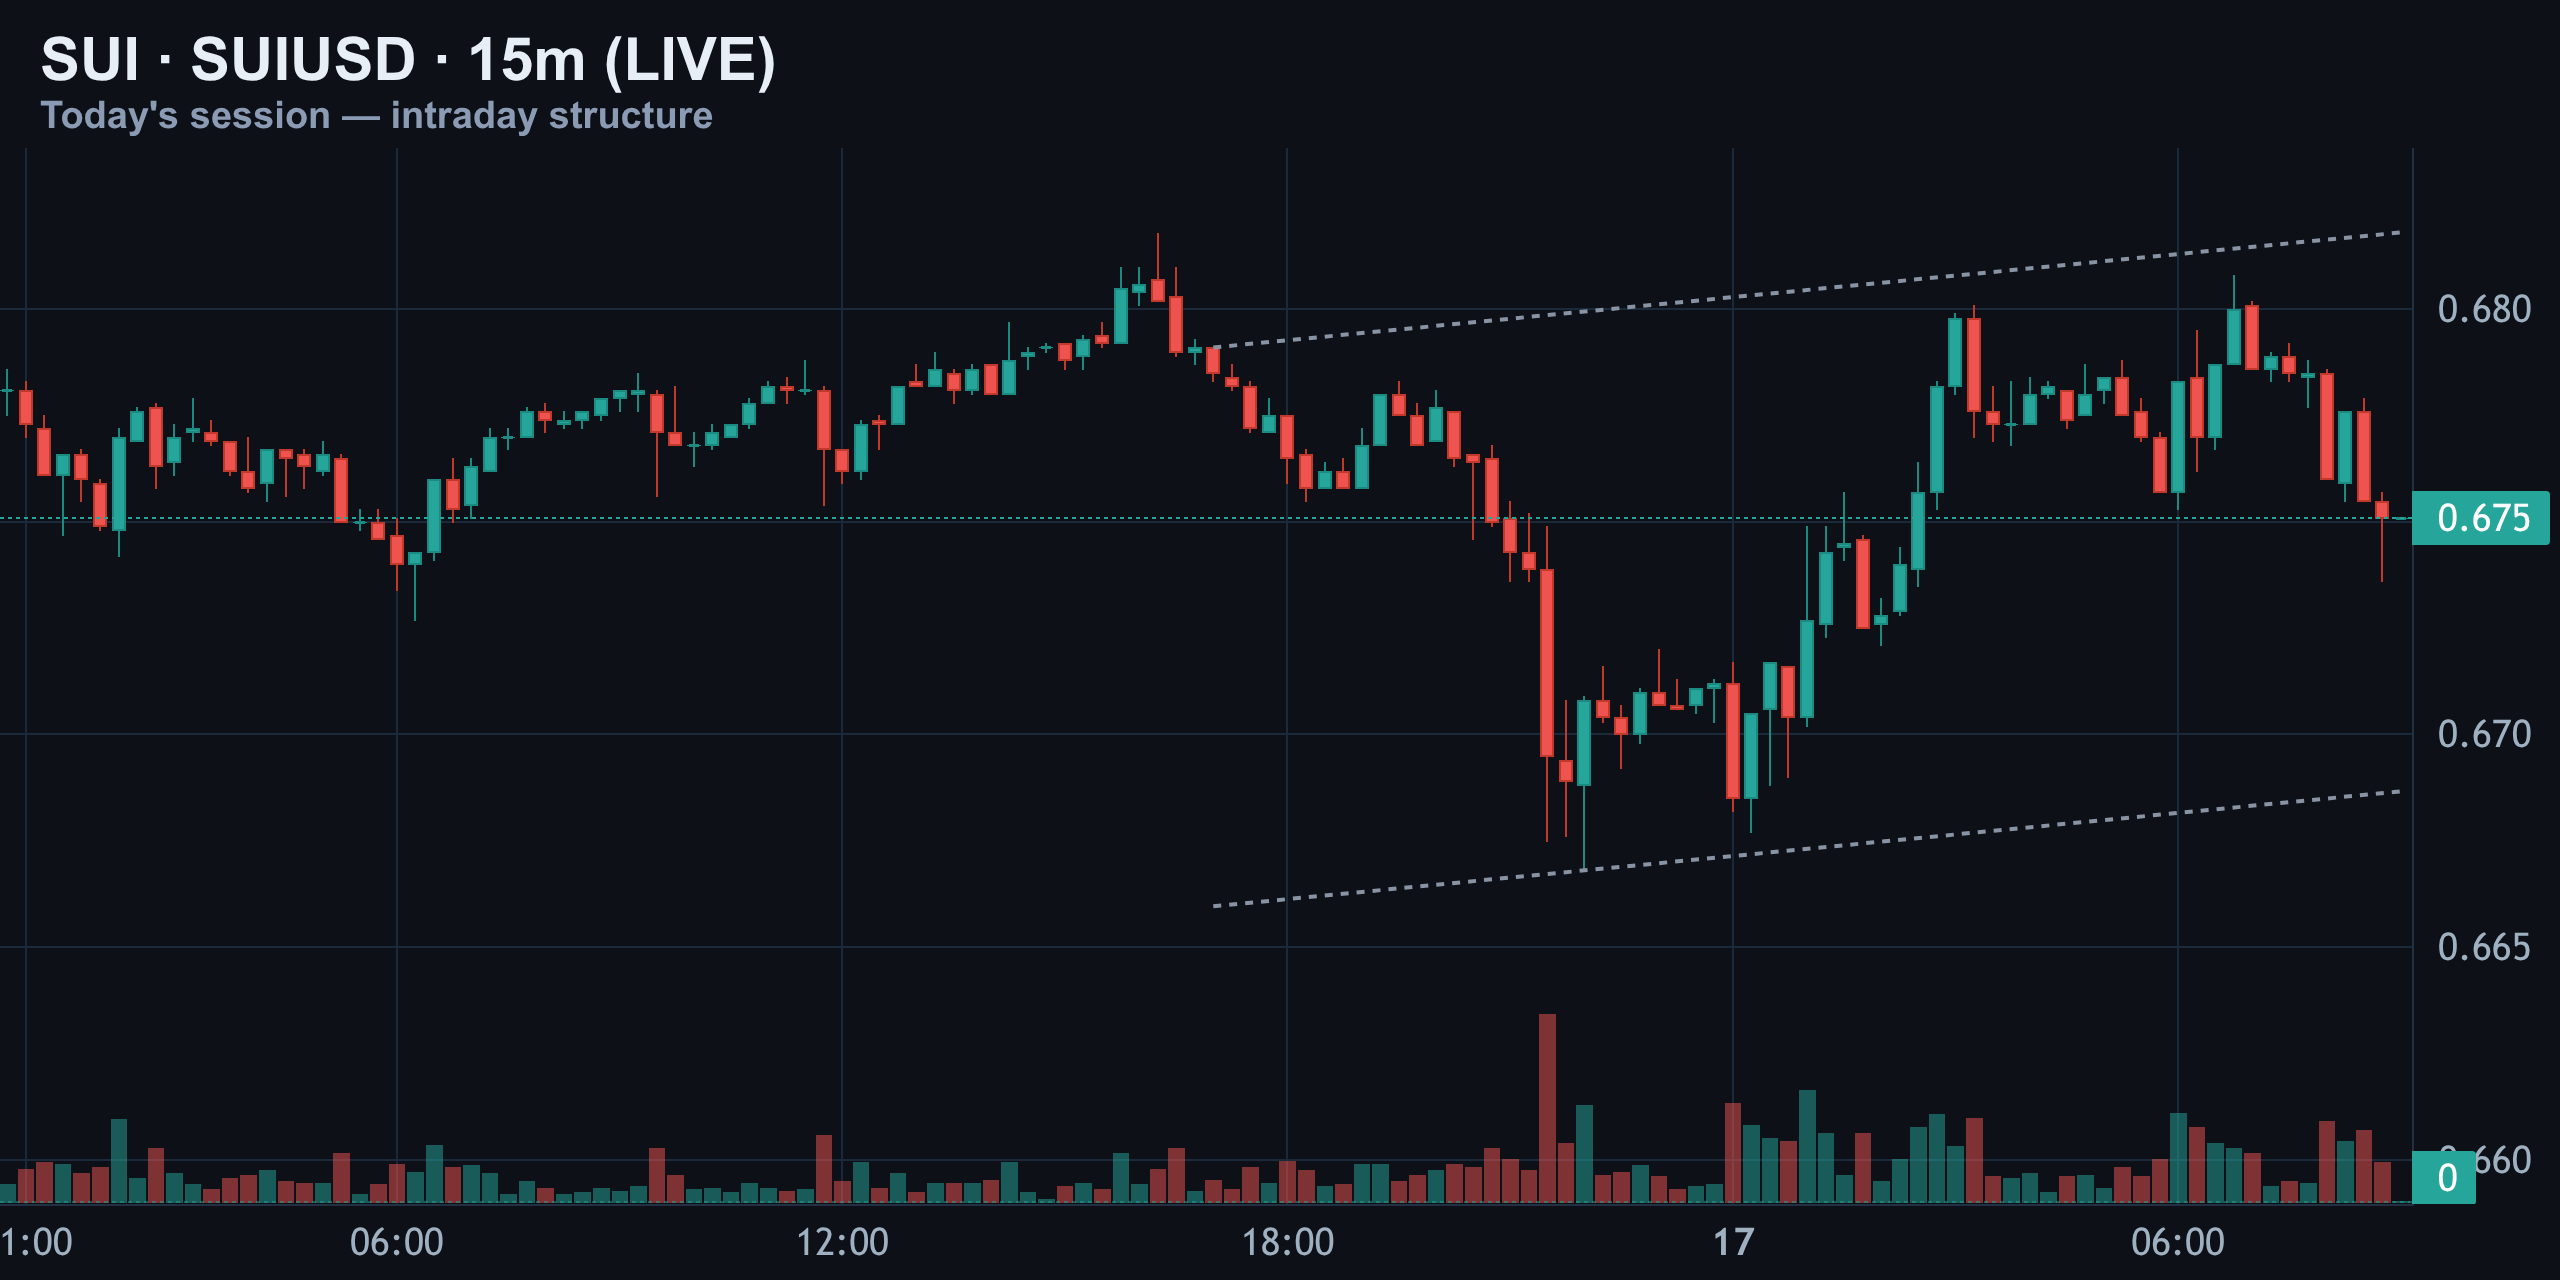
The channel is technically still rising, but the swings inside it are getting tighter. That kind of compression usually snaps hard in one direction — and the double rejection at the top is the first tell to watch.
4-Hour Structure — Capped by a Falling Ceiling
The 4-hour chart shows a wedge that's been building since August 9. Every rally since then has run into the same falling trendline, and every dip has found buyers along a rising support line underneath — classic compression where the market can't decide, so it keeps squeezing tighter.
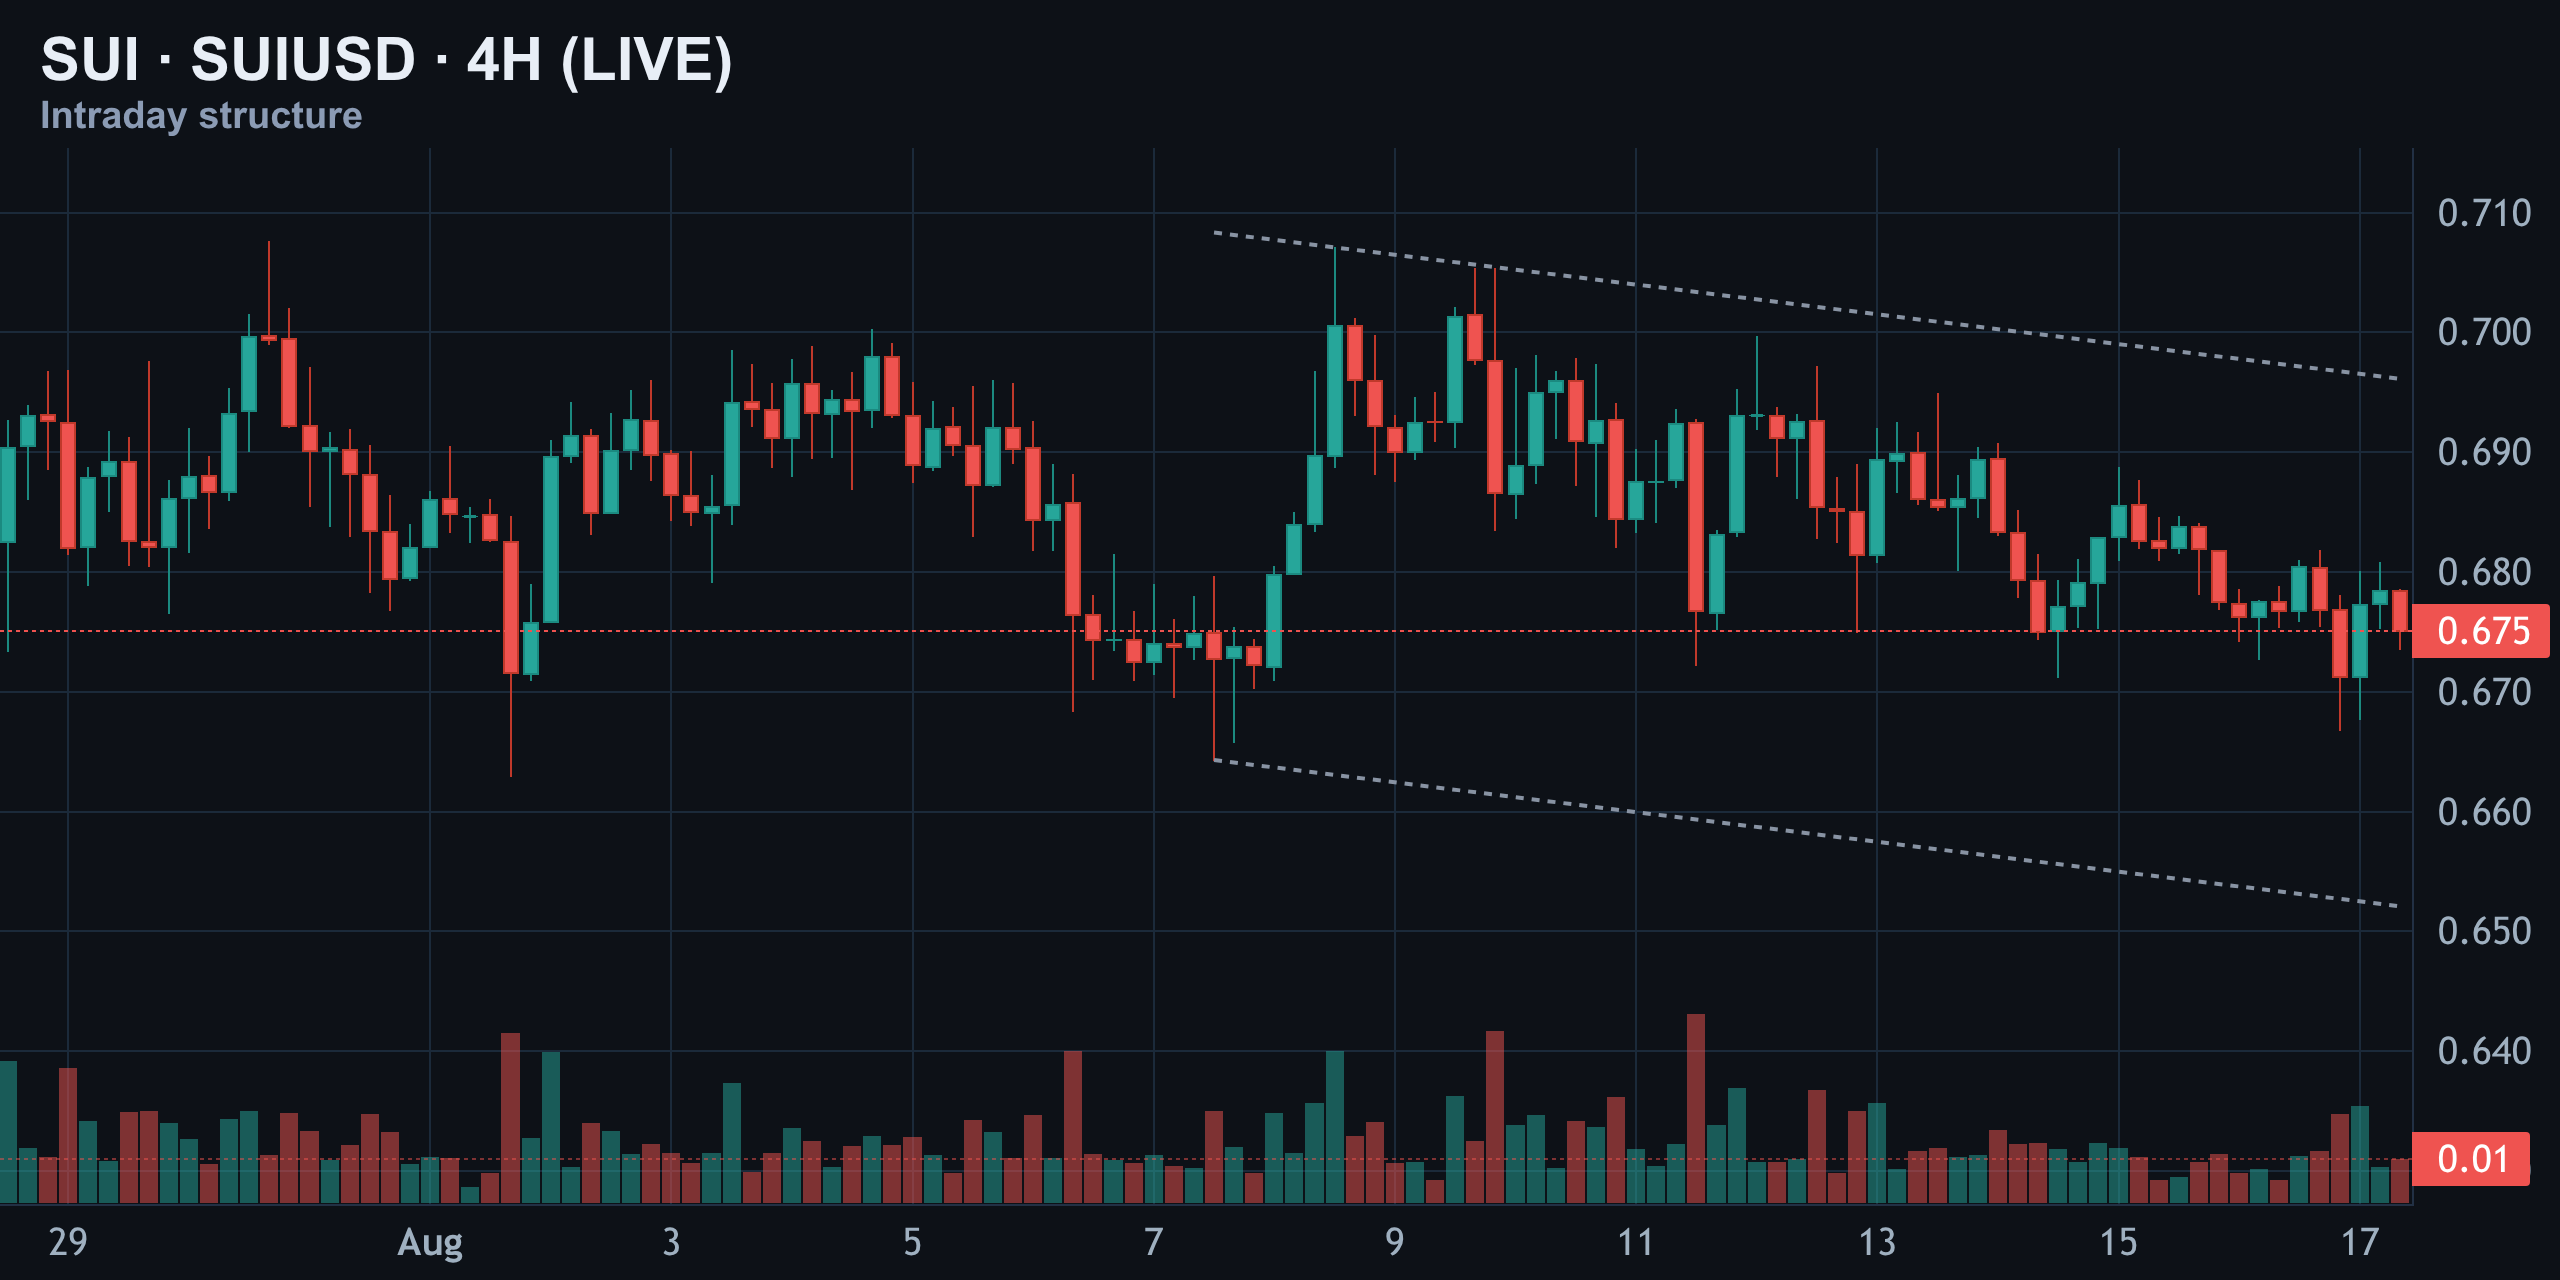
Right now price sits in the middle of that wedge, closer to the lower half. That tells you sellers still hold the last word until the descending line is actually reclaimed.
Short-Term Daily — Still Inside the Downtrend Channel
Stepping back to the daily, SUI has been grinding lower inside a clean channel since the July peak near $0.80. The support zone around $0.65 has been tested and held multiple times, making it the line in the sand for bulls.
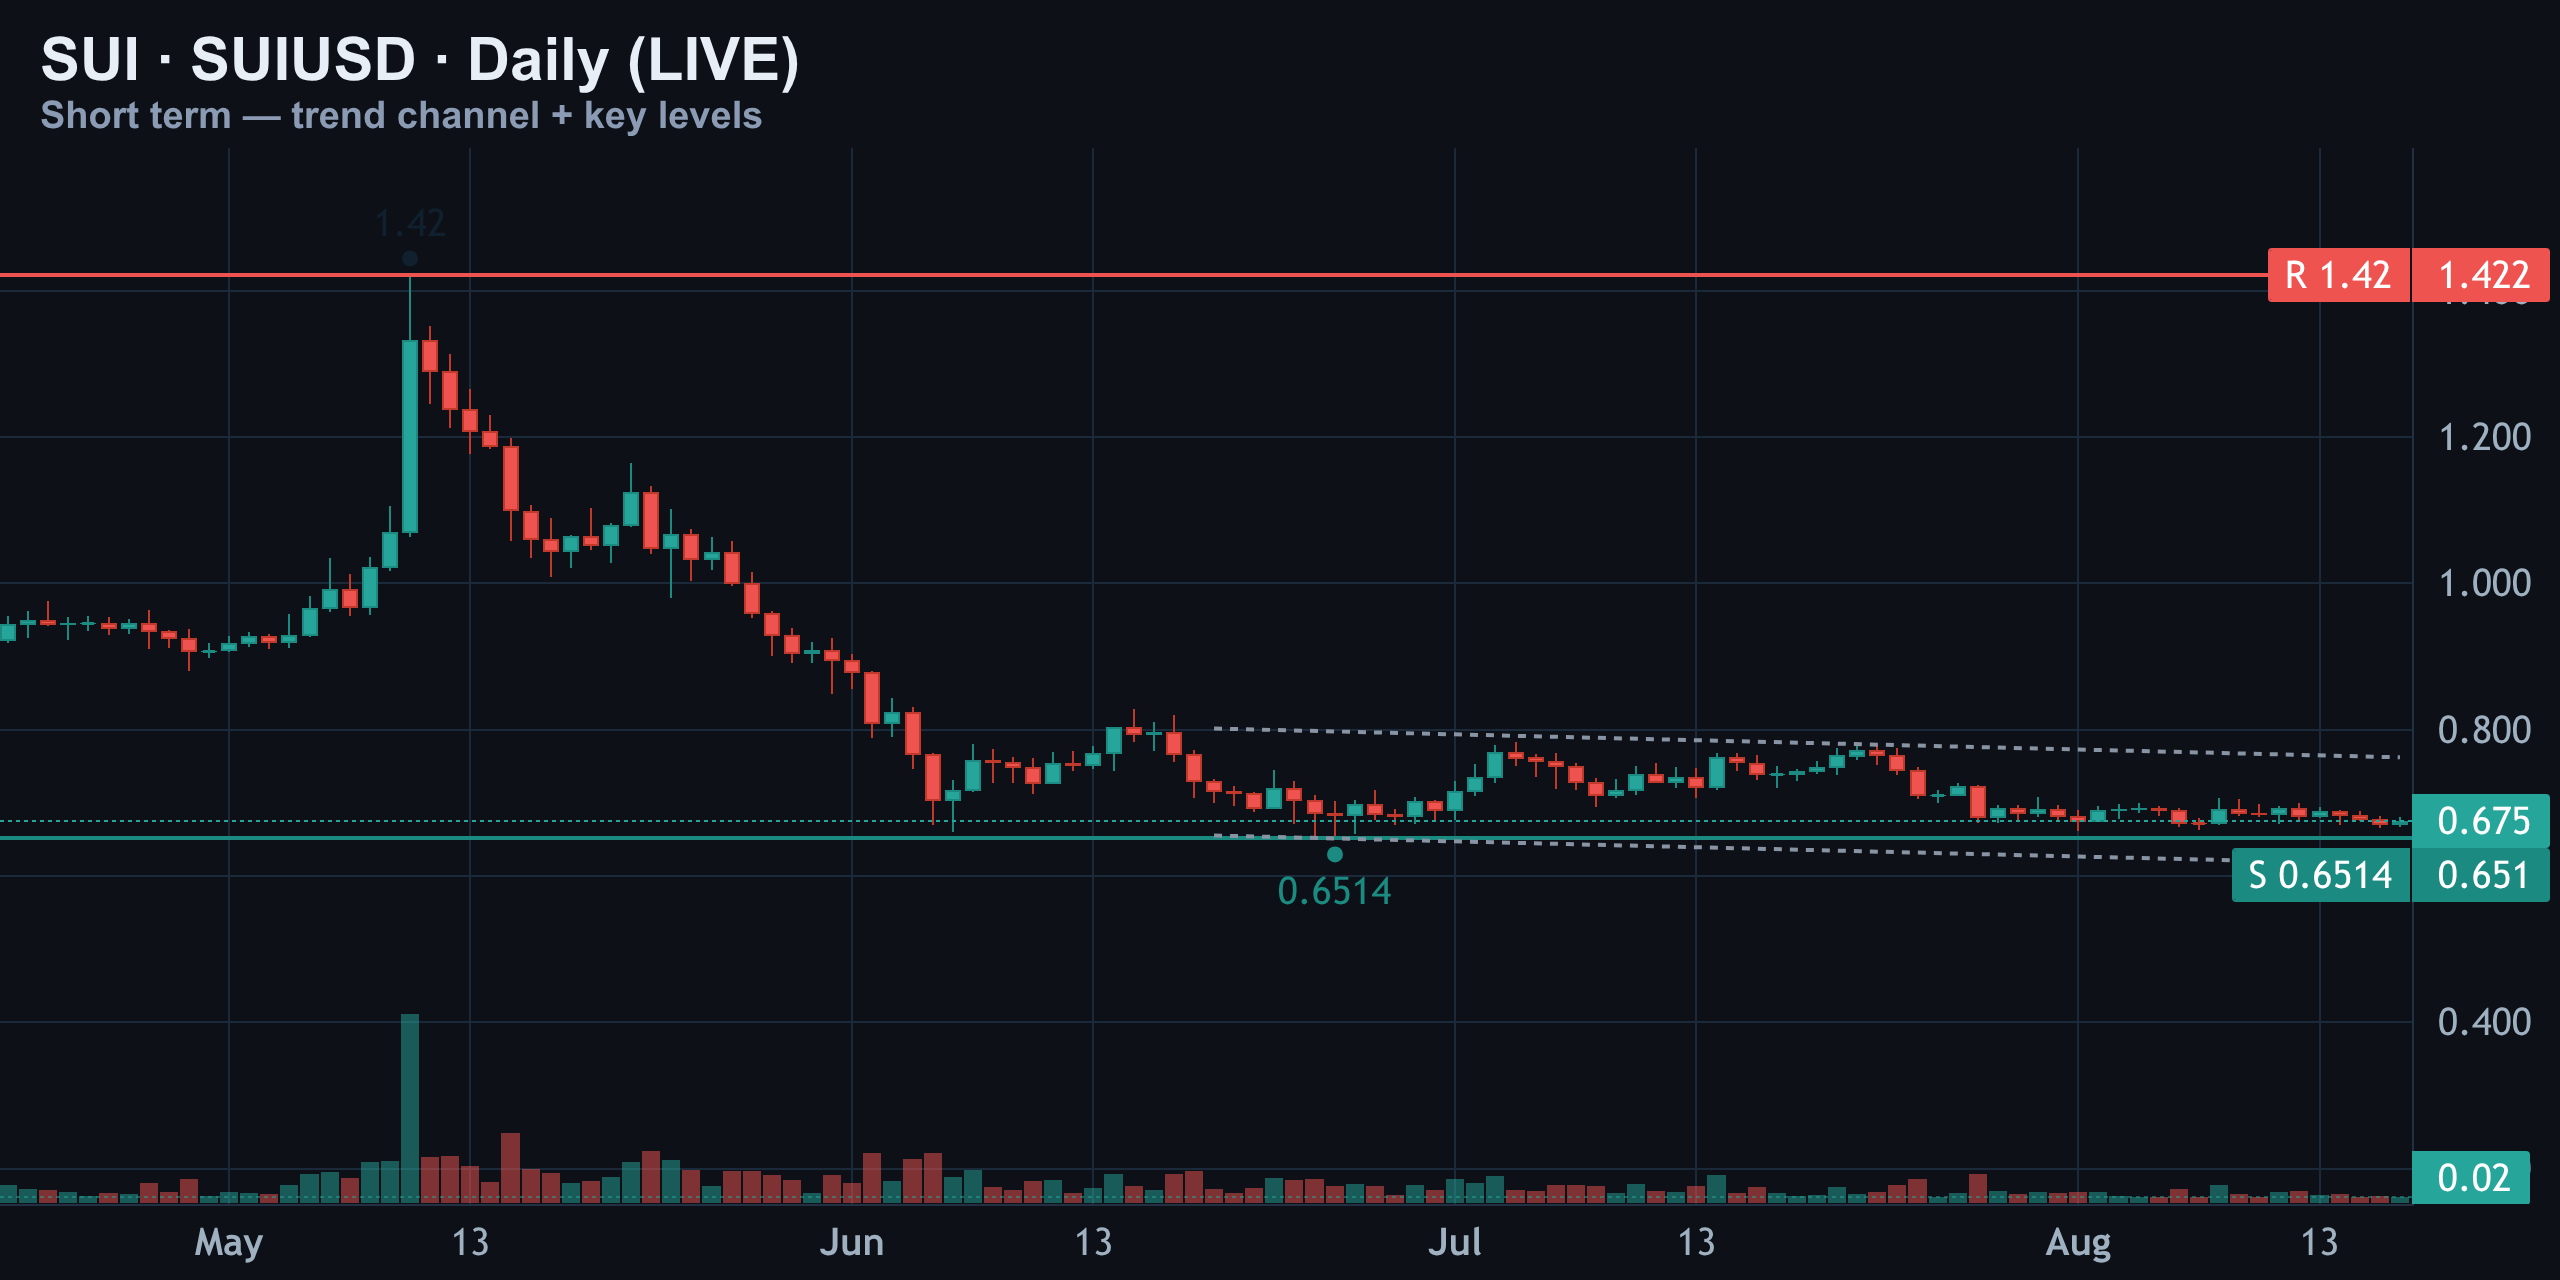
Today's price near $0.675 sits comfortably above that floor but still trapped under the channel's falling ceiling. Nothing's broken yet — this is consolidation inside a downtrend, and that distinction matters for how you size any trade.
Momentum Check: RSI Cooling, MACD Flickers Bullish
RSI (14) — Cooling, Not Crashing
The daily RSI sits at 42 — dead-center neutral, neither overbought nor oversold. It's cooled off from the mid-50s back in July, which lines up with price grinding lower, but it hasn't crashed into the 30-zone the way it did in June when SUI truly capitulated.
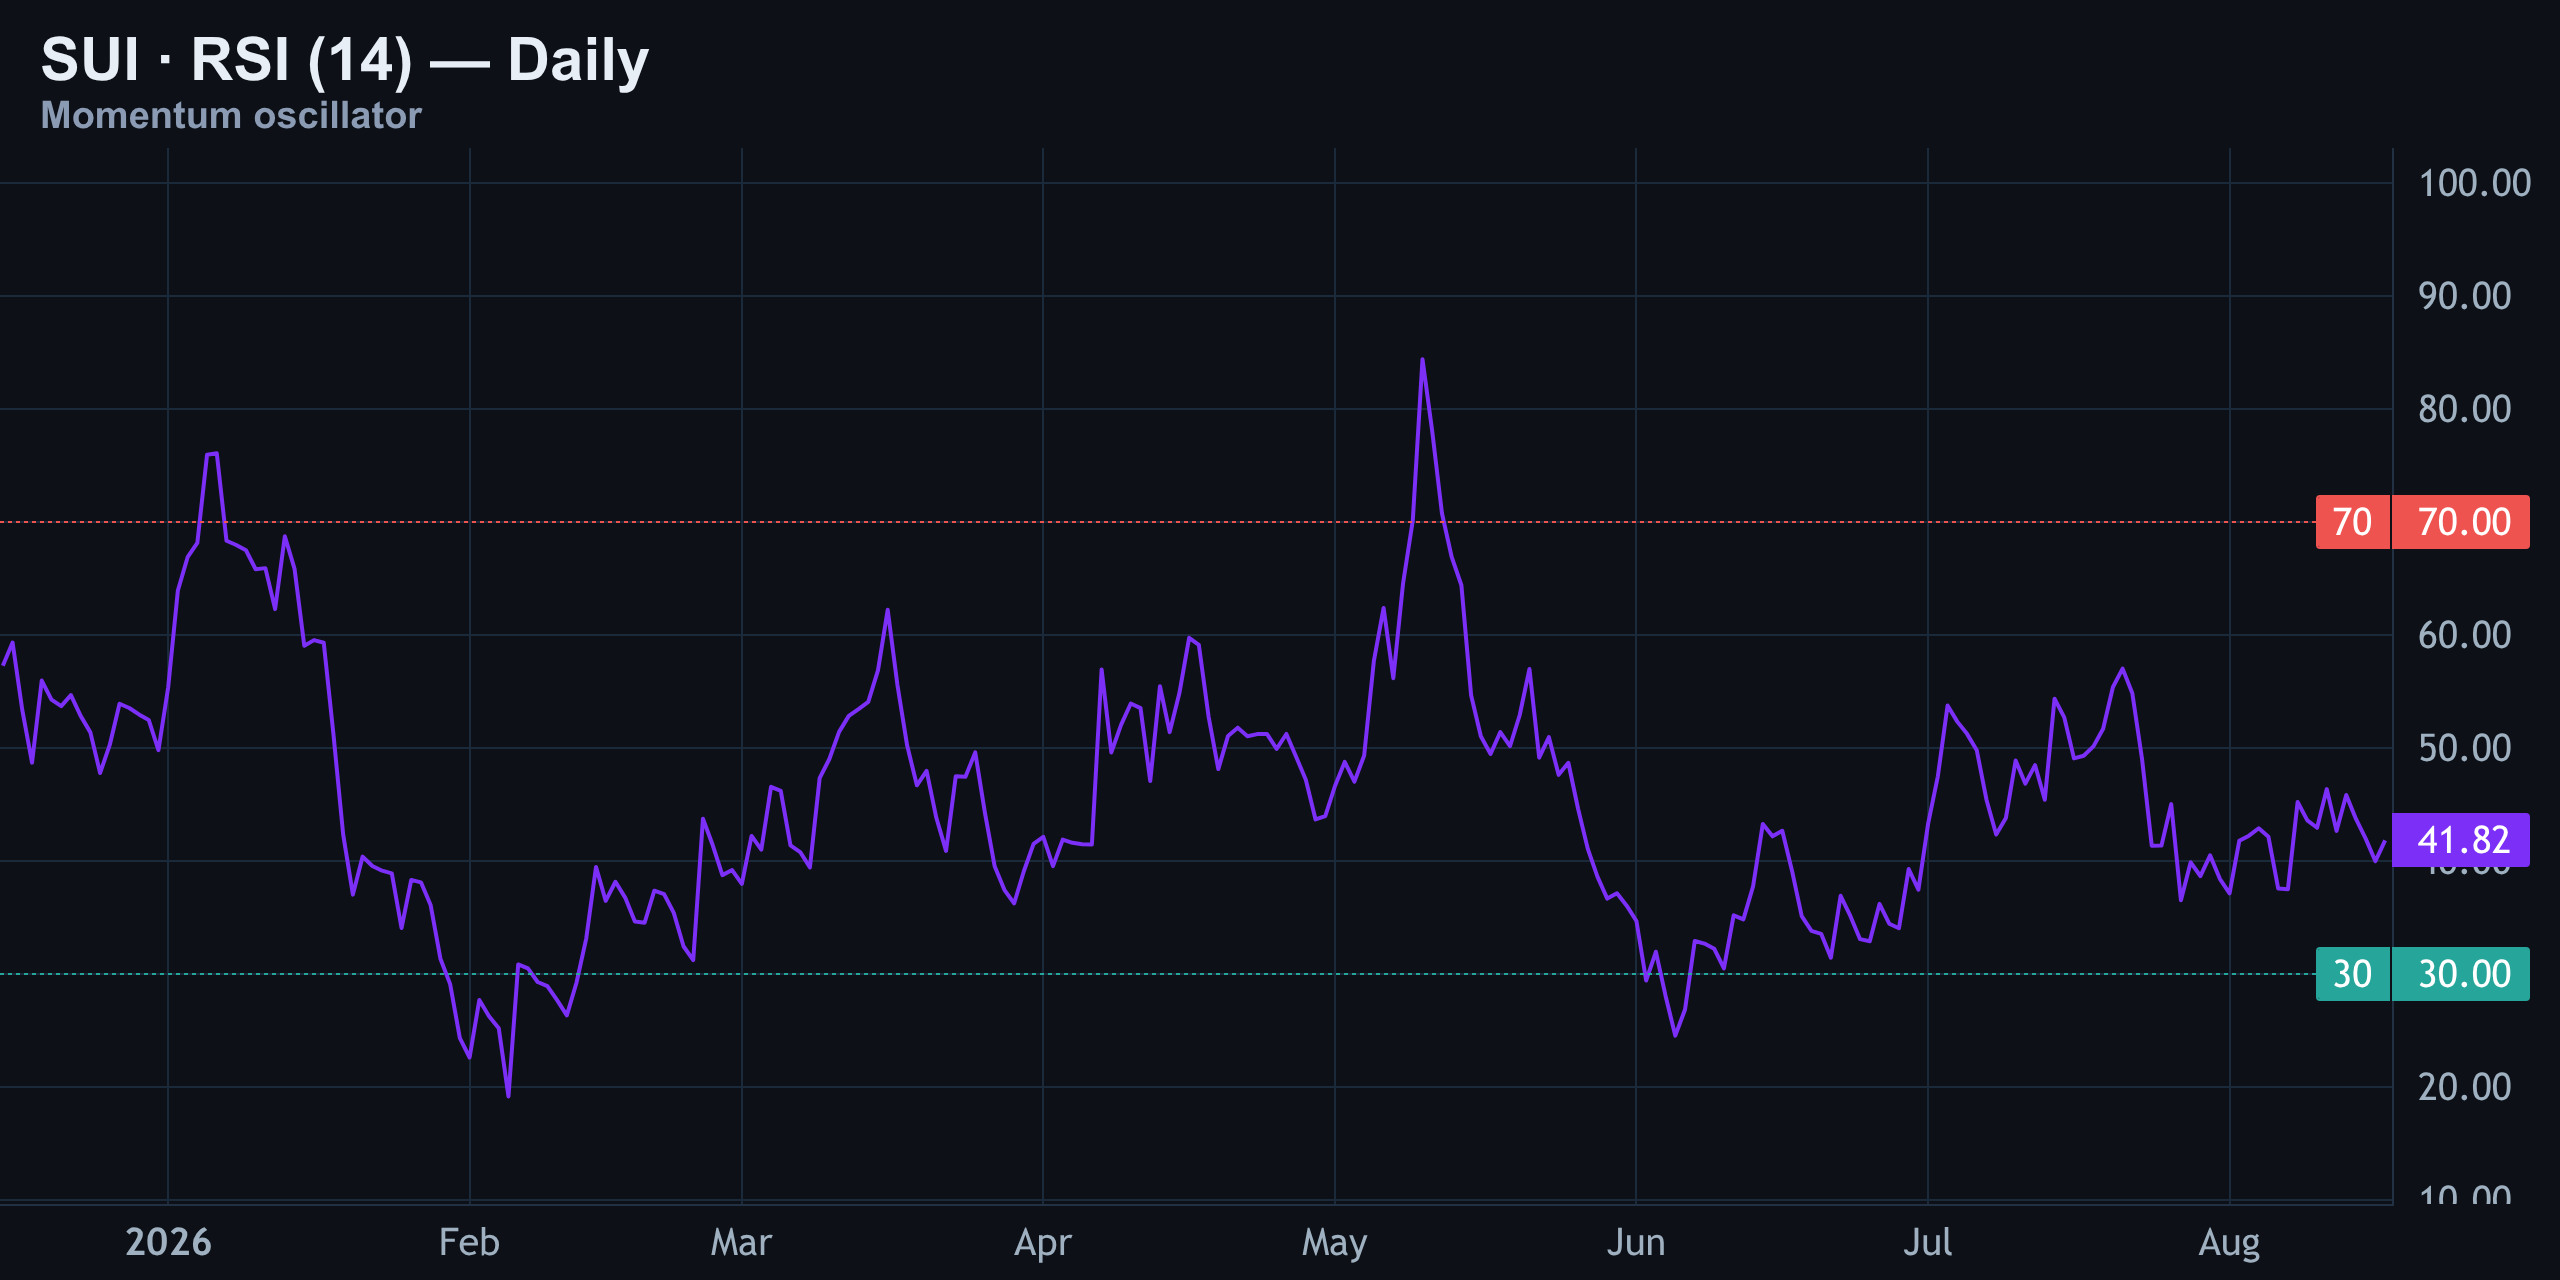
In plain terms: momentum is calm, not panicked. That leaves the next few candles to decide direction rather than any single indicator.
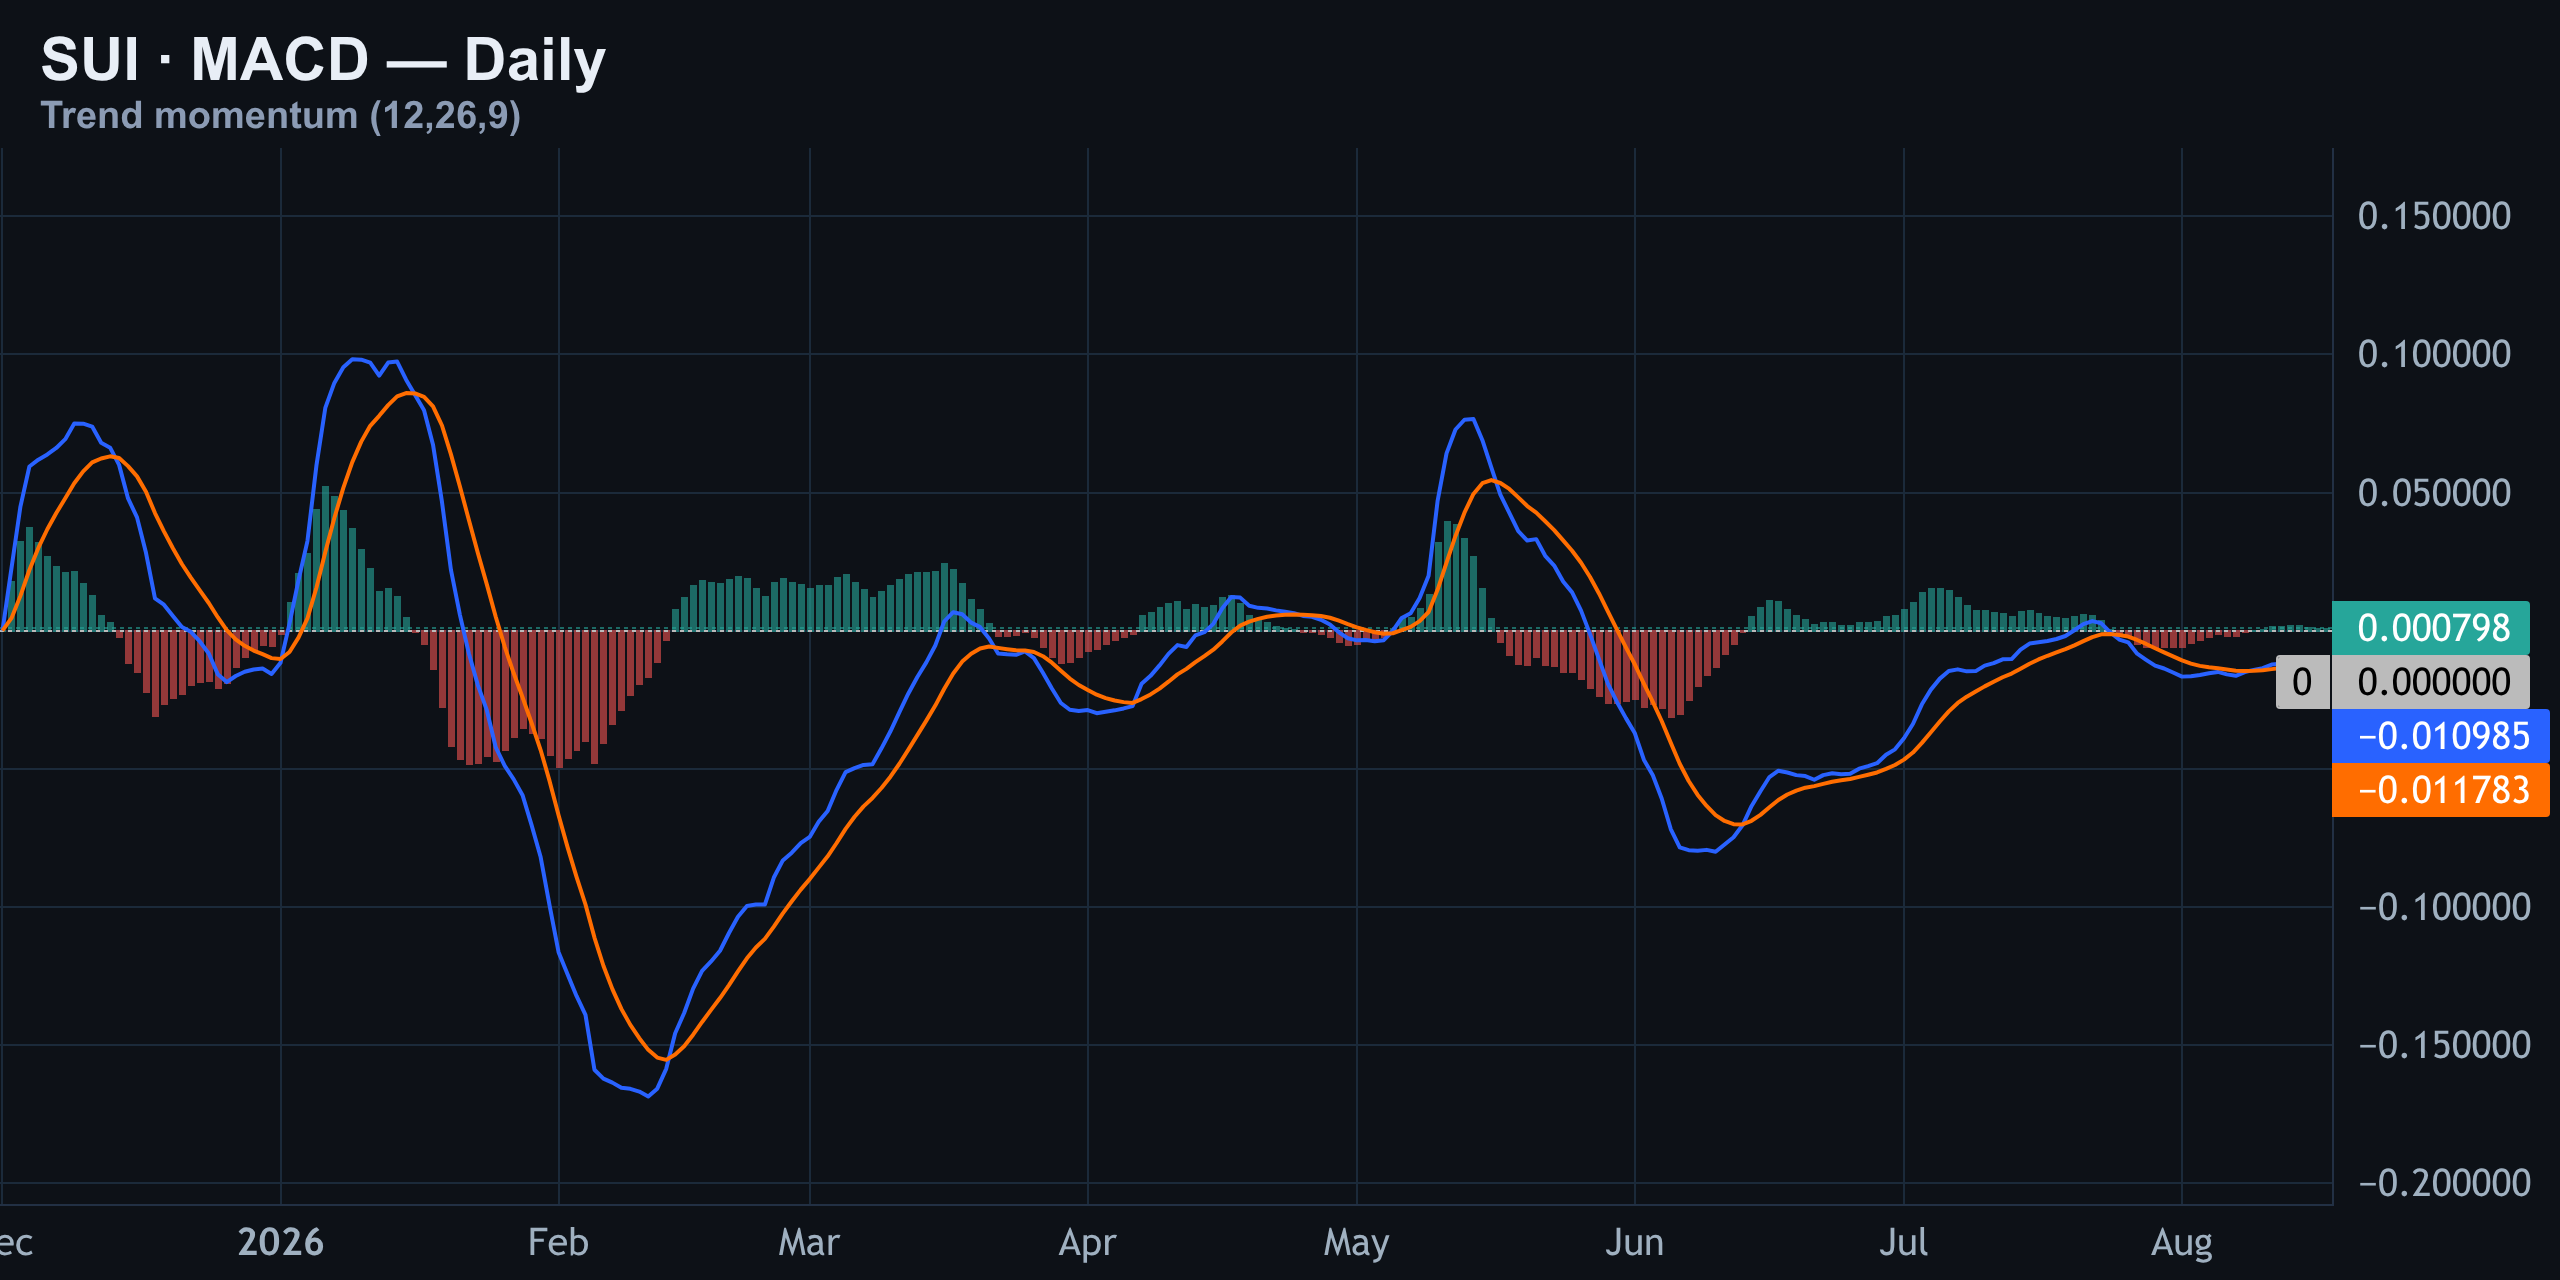
MACD — A Quiet Bullish Cross, Still Below Zero
Here's the one real divergence today. The daily MACD just flipped bullish — the MACD line crossed above its signal line, and the histogram turned green. Normally that's a green light for bulls.
Liquidation Heatmap and the Levels That Actually Matter
The map above spot shows an ask wall at $0.72 and a dense liquidation pocket near $0.693 — that's the ceiling. Below, the order book's biggest bid wall sits at $0.65, backed by daily support at $0.651, with a liquidation cluster at $0.671 sitting in between.
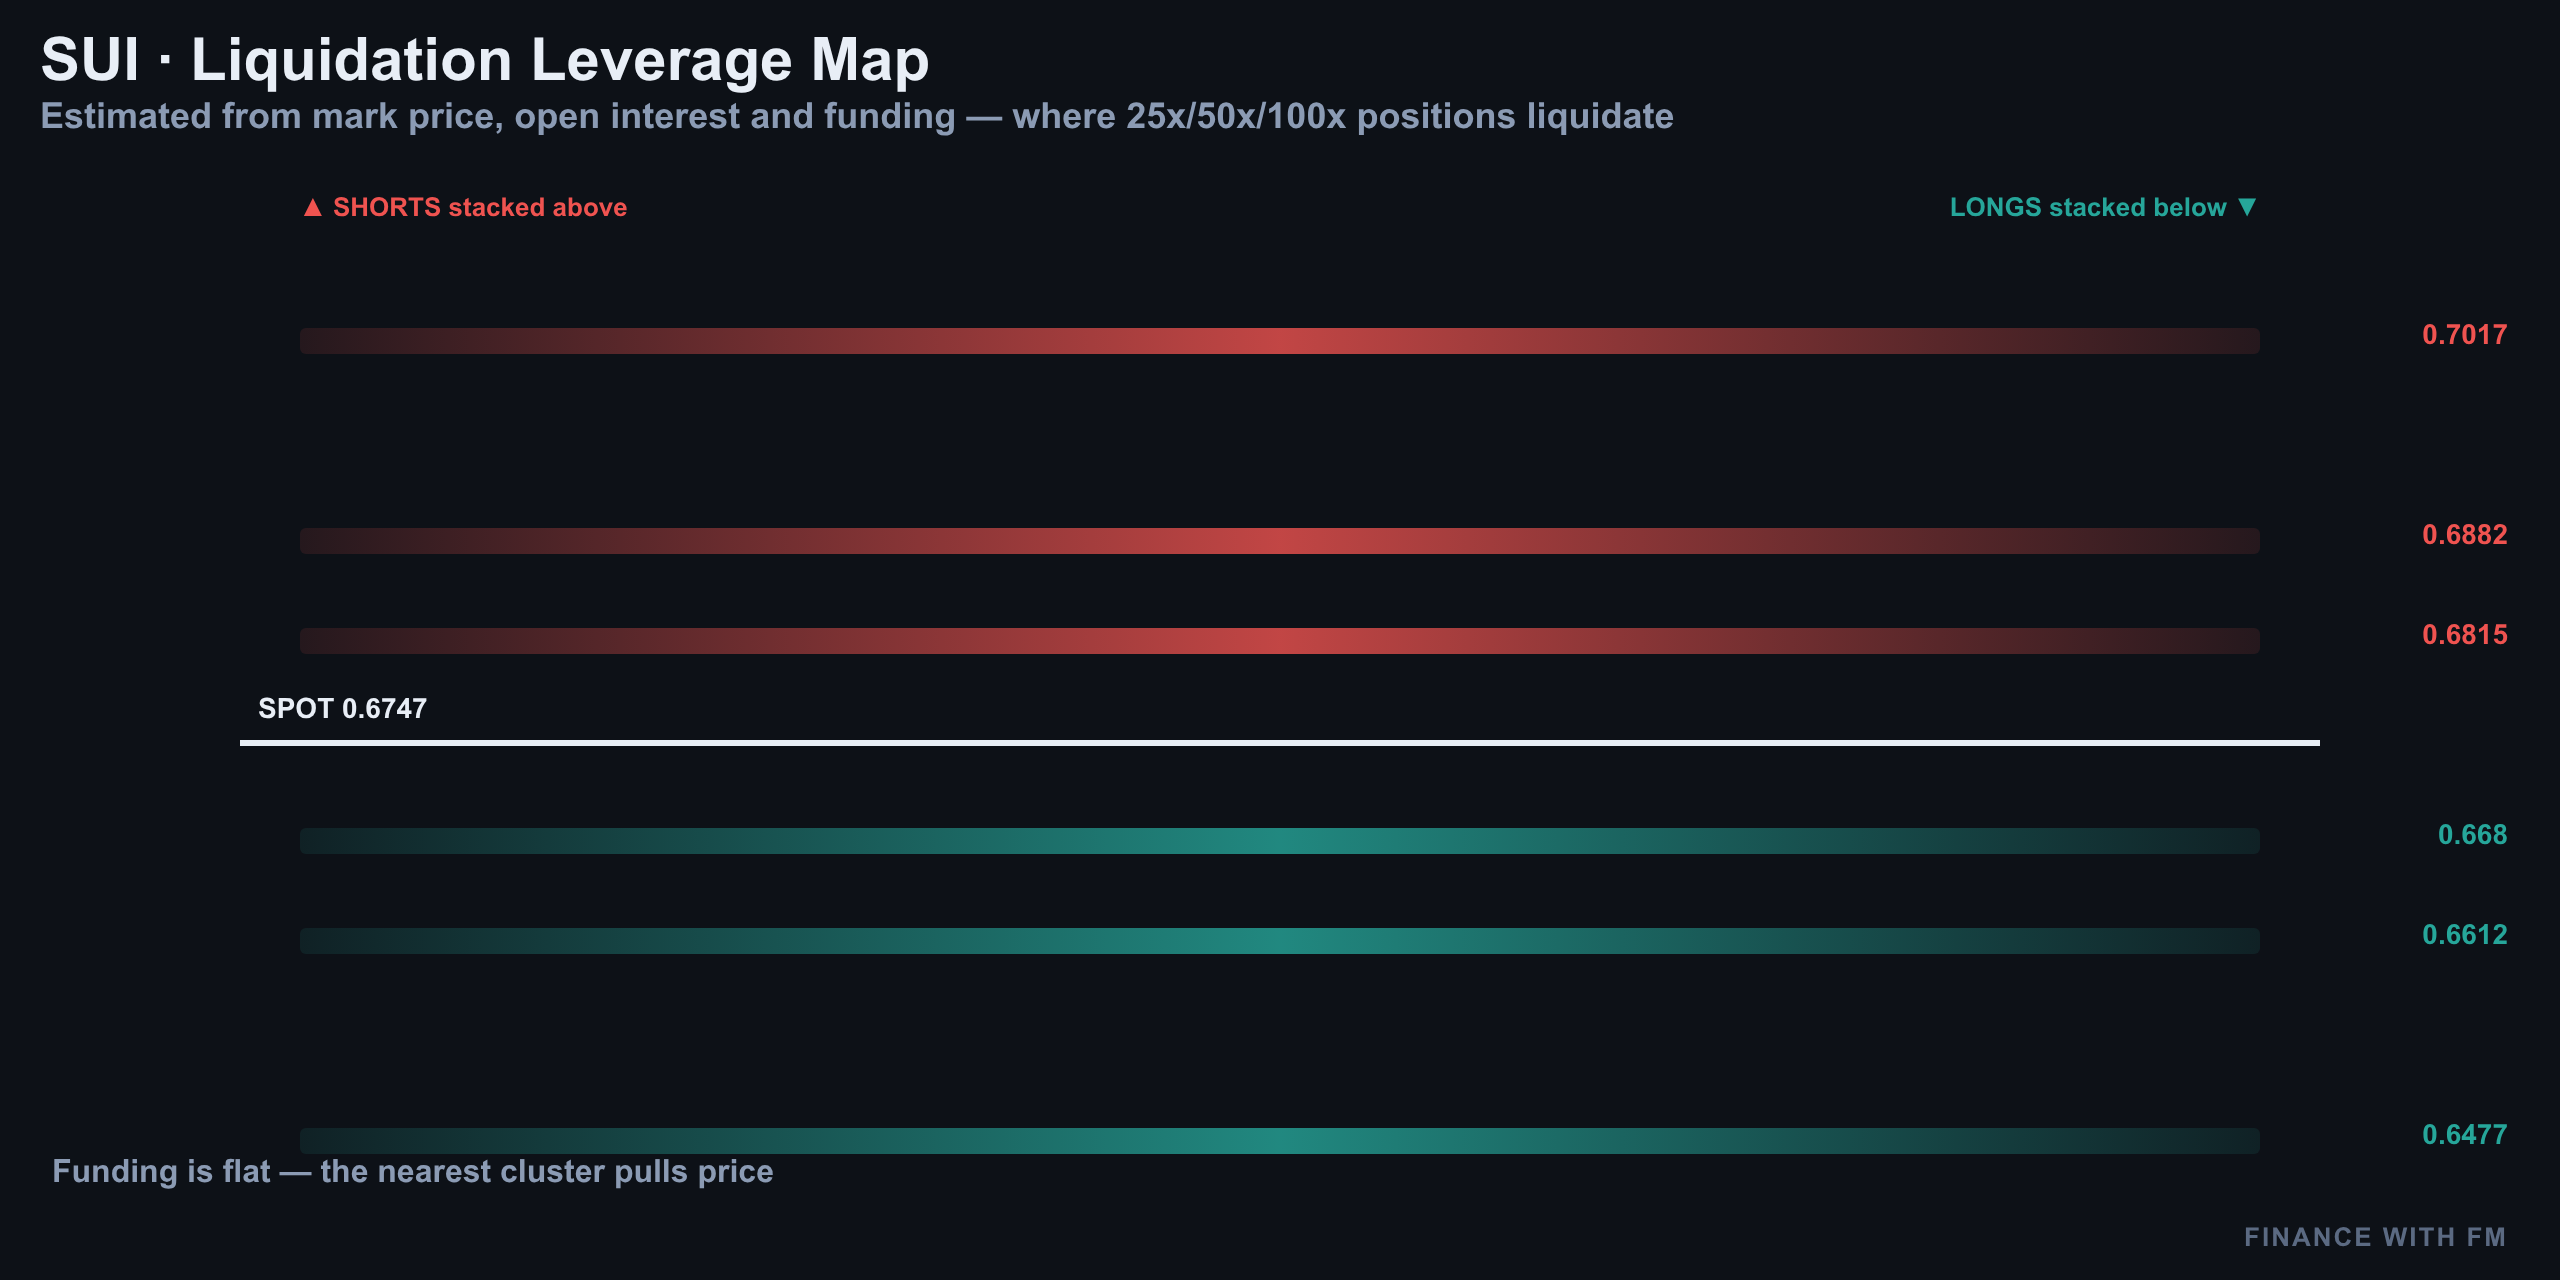
Spot right now, around $0.675, is sandwiched almost exactly between those two liquidation pools — which is exactly why it's chopping instead of trending.
| Level | Price | Type |
|---|---|---|
| Ask wall | $0.72 | Resistance / supply |
| Liquidation pocket | $0.693 | Short squeeze fuel |
| Overnight high | $0.68 | Intraday resistance |
| Spot (current) | $0.675 | — |
| Liquidation cluster | $0.671 | Mixed |
| Prior short target | $0.664 | Downside objective |
| Bid wall | $0.65 | Support / demand |
| Daily support | $0.651 | Structural floor |
Positioning, Order Flow, and the Desk Snapshot
Funding is near neutral at roughly +4% annualized — no real skew paying either side. Open interest sits around 116.7 million SUI tokens, basically flat over the week.
Here's the catch: retail accounts are net long at 2.11, and so-called top traders are even longer at 2.53. They're aligned, not fighting each other — which means there's no obvious crowded-short or crowded-long squeeze to fade right now.
| Metric | Reading | Read |
|---|---|---|
| Funding rate | +4% APR | Neutral |
| Open interest | ~116.7M SUI | Flat on the week |
| Retail long/short ratio | 2.11 | Net long |
| Top-trader long/short ratio | 2.53 | Net long |
| Order book bid lean | 54% | Slightly bid-heavy |
| Coinbase vs Binance premium | -0.104% | US side selling |
Taker flow is balanced near even, and the order book leans 54% bids, with that heavy $0.65 wall doing the real support work. Because retail and top traders are pointed the same direction, positioning alone doesn't hand either side a clean edge today.
The Trade Setup — A 1:2.5 Plan
Putting the structure, momentum, and liquidation map together: SUI is boxed between a $0.693 liquidation pocket above and a $0.671 cluster just below spot, inside a daily downtrend that hasn't been broken since July. The bullish MACD cross is real but unconfirmed — and history (April, July) says these flicker-crosses inside a downtrend tend to fade rather than run.
| Parameter | Level |
|---|---|
| Bias | Bearish / fade the bounce |
| Entry | ~$0.68 (rejection zone) |
| Stop | Above $0.693 liquidation pocket |
| Target | $0.664 – $0.651 |
| Risk:Reward | ≈1:2.5 |
Summary: What Would Actually Flip This Bearish Bias
SUI's momentum just turned green on the daily MACD, but price is still red on the day, still under the $0.68 ceiling, and still inside a channel that's been falling since July. Retail and top traders are both leaning long, funding is neutral, and the Coinbase-Binance spread shows US-side selling — none of that screams reversal yet.
- Bias flips bullish only on a clean daily close above the falling channel ceiling and a reclaim of $0.693
- Bias stays bearish while price holds under $0.68 with RSI capped near 42-45
- $0.65 remains the line in the sand — a break there opens the door to a deeper leg down
Analysis and education, not investment advice. See our editorial policy.