Daily market analysis
Hype (HYPE) technical analysis today
Last updated
HYPE Daily Pulse: Stuck at $58.77, Trap Under Spot
Where We Left It: Yesterday's Range Call Just Got Confirmed
Yesterday's call on HYPE was simple: sit tight. Price was pinned between its 50-day and 200-day moving averages with no clean setup on either side, so we stood aside rather than force a trade. That patience just paid off — not with profit, but with proof.
Since that call, HYPE slipped about 1.8%, dropping from roughly $59.86 down to today's $58.77. That's not a breakout. It's not a breakdown either. It's chop — exactly what the range-bound thesis predicted.
Desk Snapshot: $58.77, Negative Gamma, No Clear Trend
HYPE is trading around $58.77 right now, down roughly 1.8% on the day. The broader 4-hour uptrend is technically still alive, RSI is neutral at 55, and MACD just flipped mildly positive. None of that, on its own, is enough to call a breakout.
The bigger story is under the hood: dealers are sitting in negative gamma, with the zero-gamma flip sitting up at $60. That means whichever way this breaks — up or down — the move has room to accelerate rather than get absorbed.
| Metric | Reading |
|---|---|
| Spot Price | $58.77 |
| 24h Change | -1.8% |
| RSI (14, Daily) | 55 (Neutral) |
| MACD Histogram | +0.76 (Fresh, early bullish) |
| Dealer Gamma Regime | Negative (moves amplified) |
| Zero-Gamma Flip | $60.00 |
Intraday Read: Coiled Inside a Falling Channel
On the 15-minute chart, HYPE has been carving a descending channel since this morning's local high just above $59. Price has tapped the lower rail near $58.20 twice without breaking it, then bounced back toward $58.80, roughly where it's trading now.
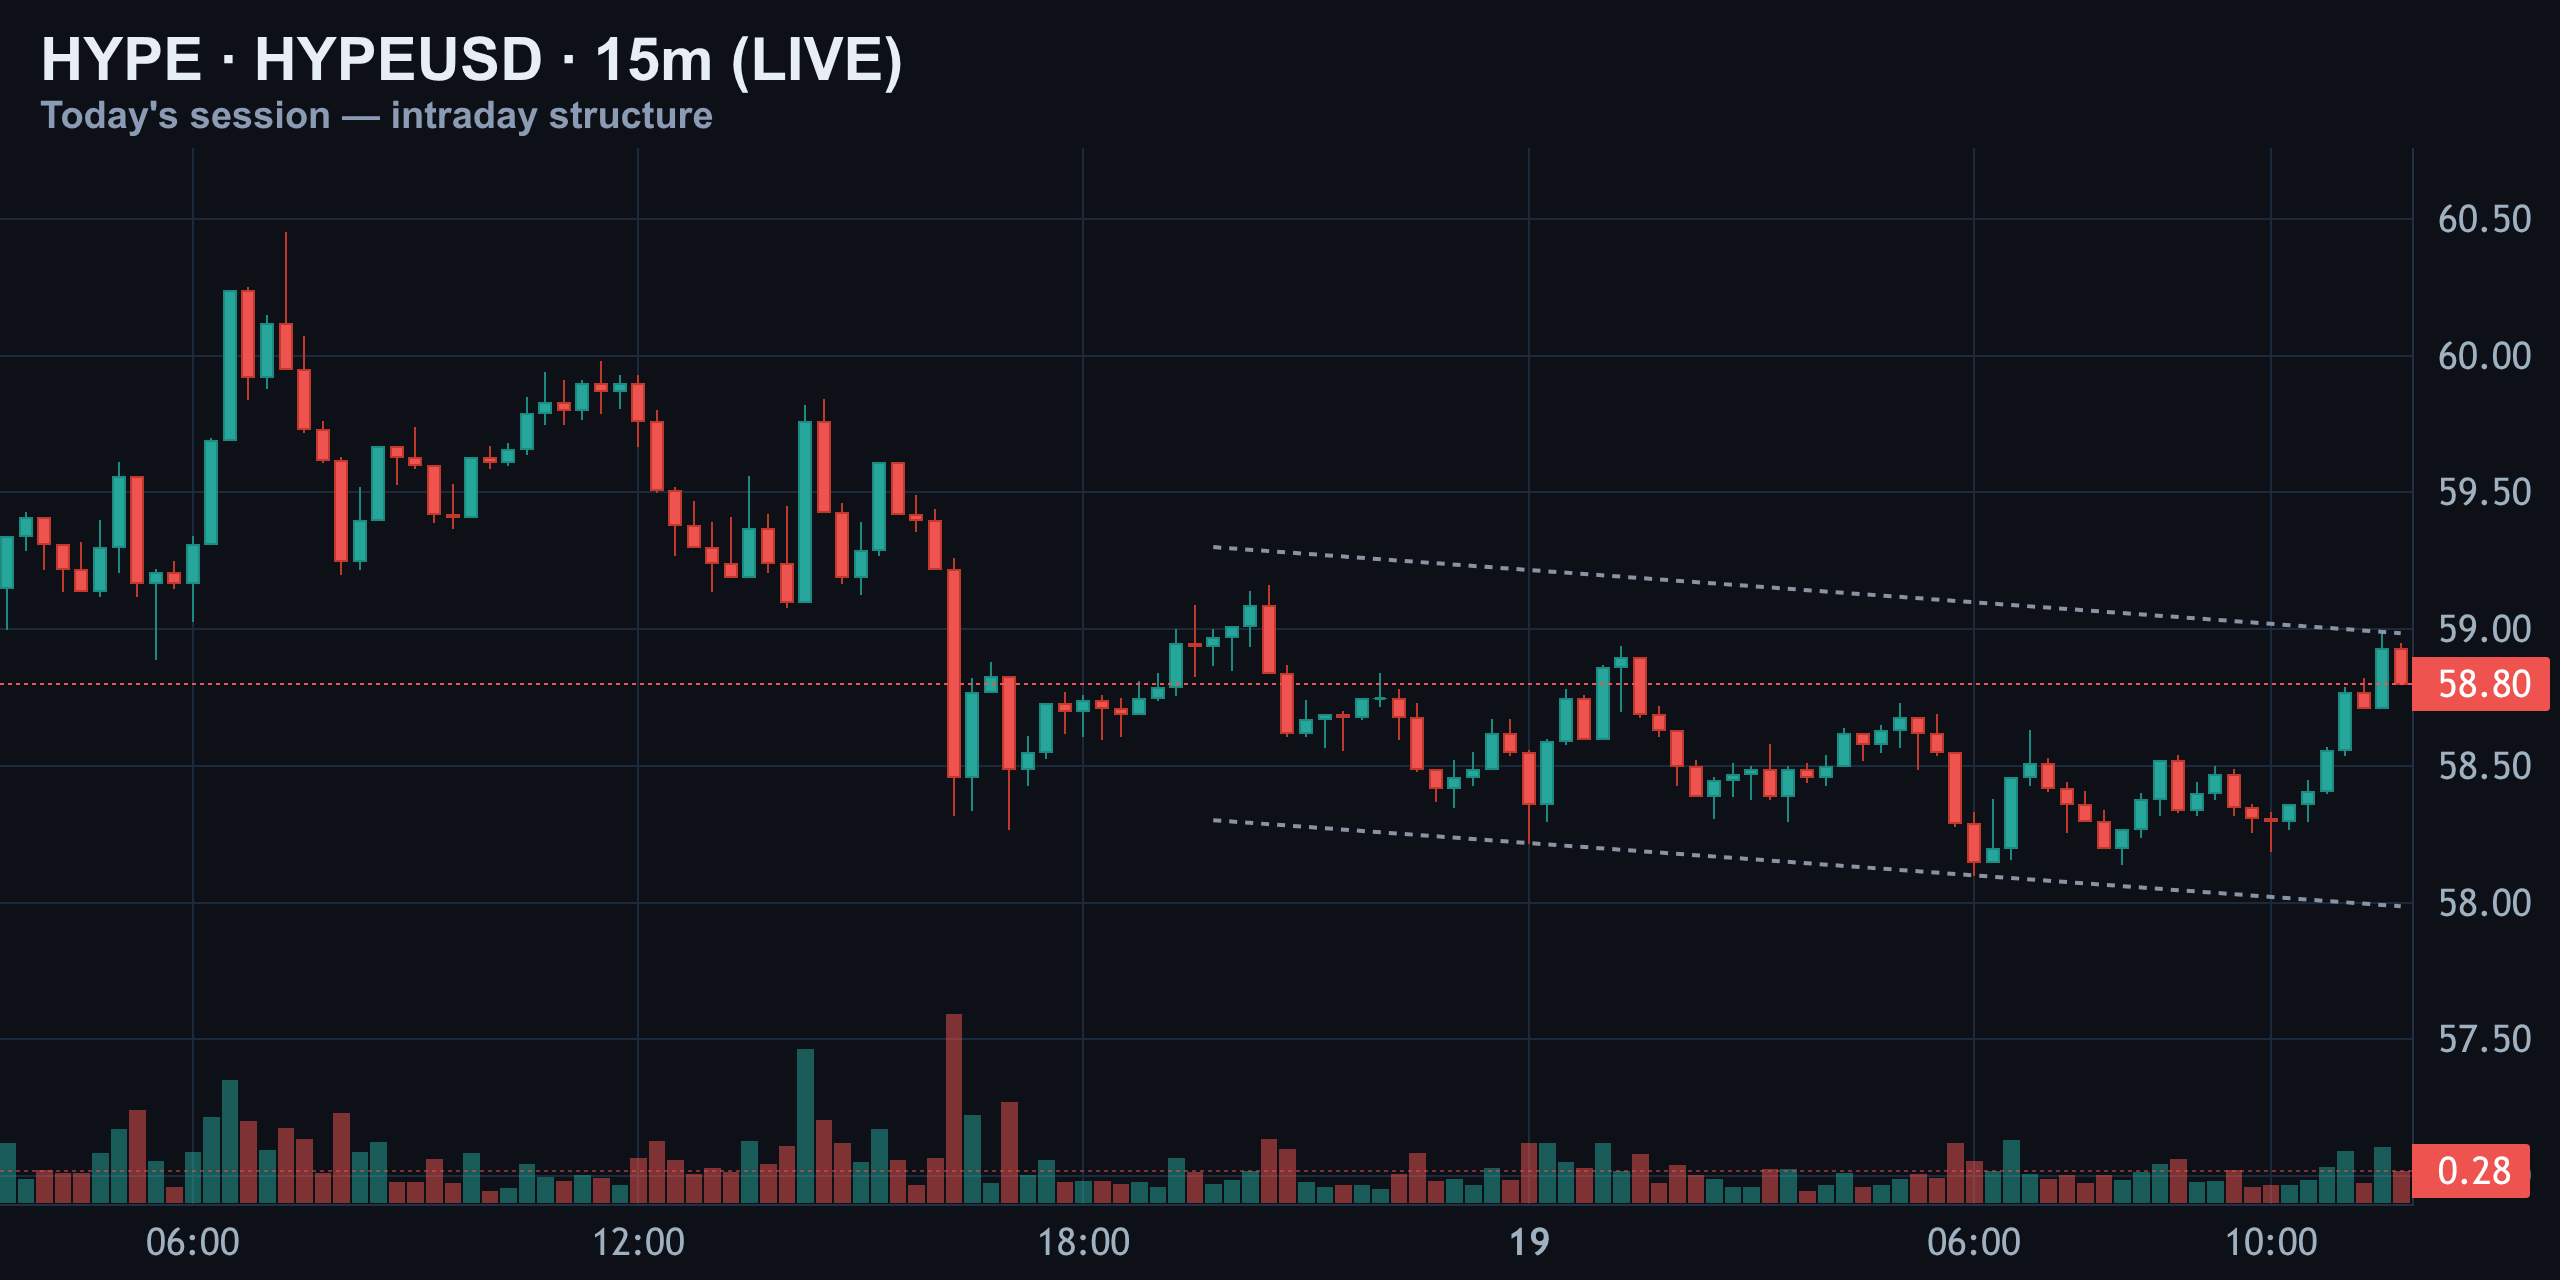
Volume on these pullbacks has been thin, and thin volume on a retest usually means the move isn't finished. Either buyers step up and reclaim the top of the channel, or sellers finally push through the $58.20 floor. Right now it's a coiled spring — squeezed, but not yet decided.
The Bigger Picture: Rising Channel Under Pressure
Zoom out to the 4-hour chart and the broader uptrend from the August lows near $52 is still intact. HYPE has been printing higher lows inside a rising channel for over two weeks. Today's pullback has price testing the lower rail of that channel, currently sitting near $58.88.
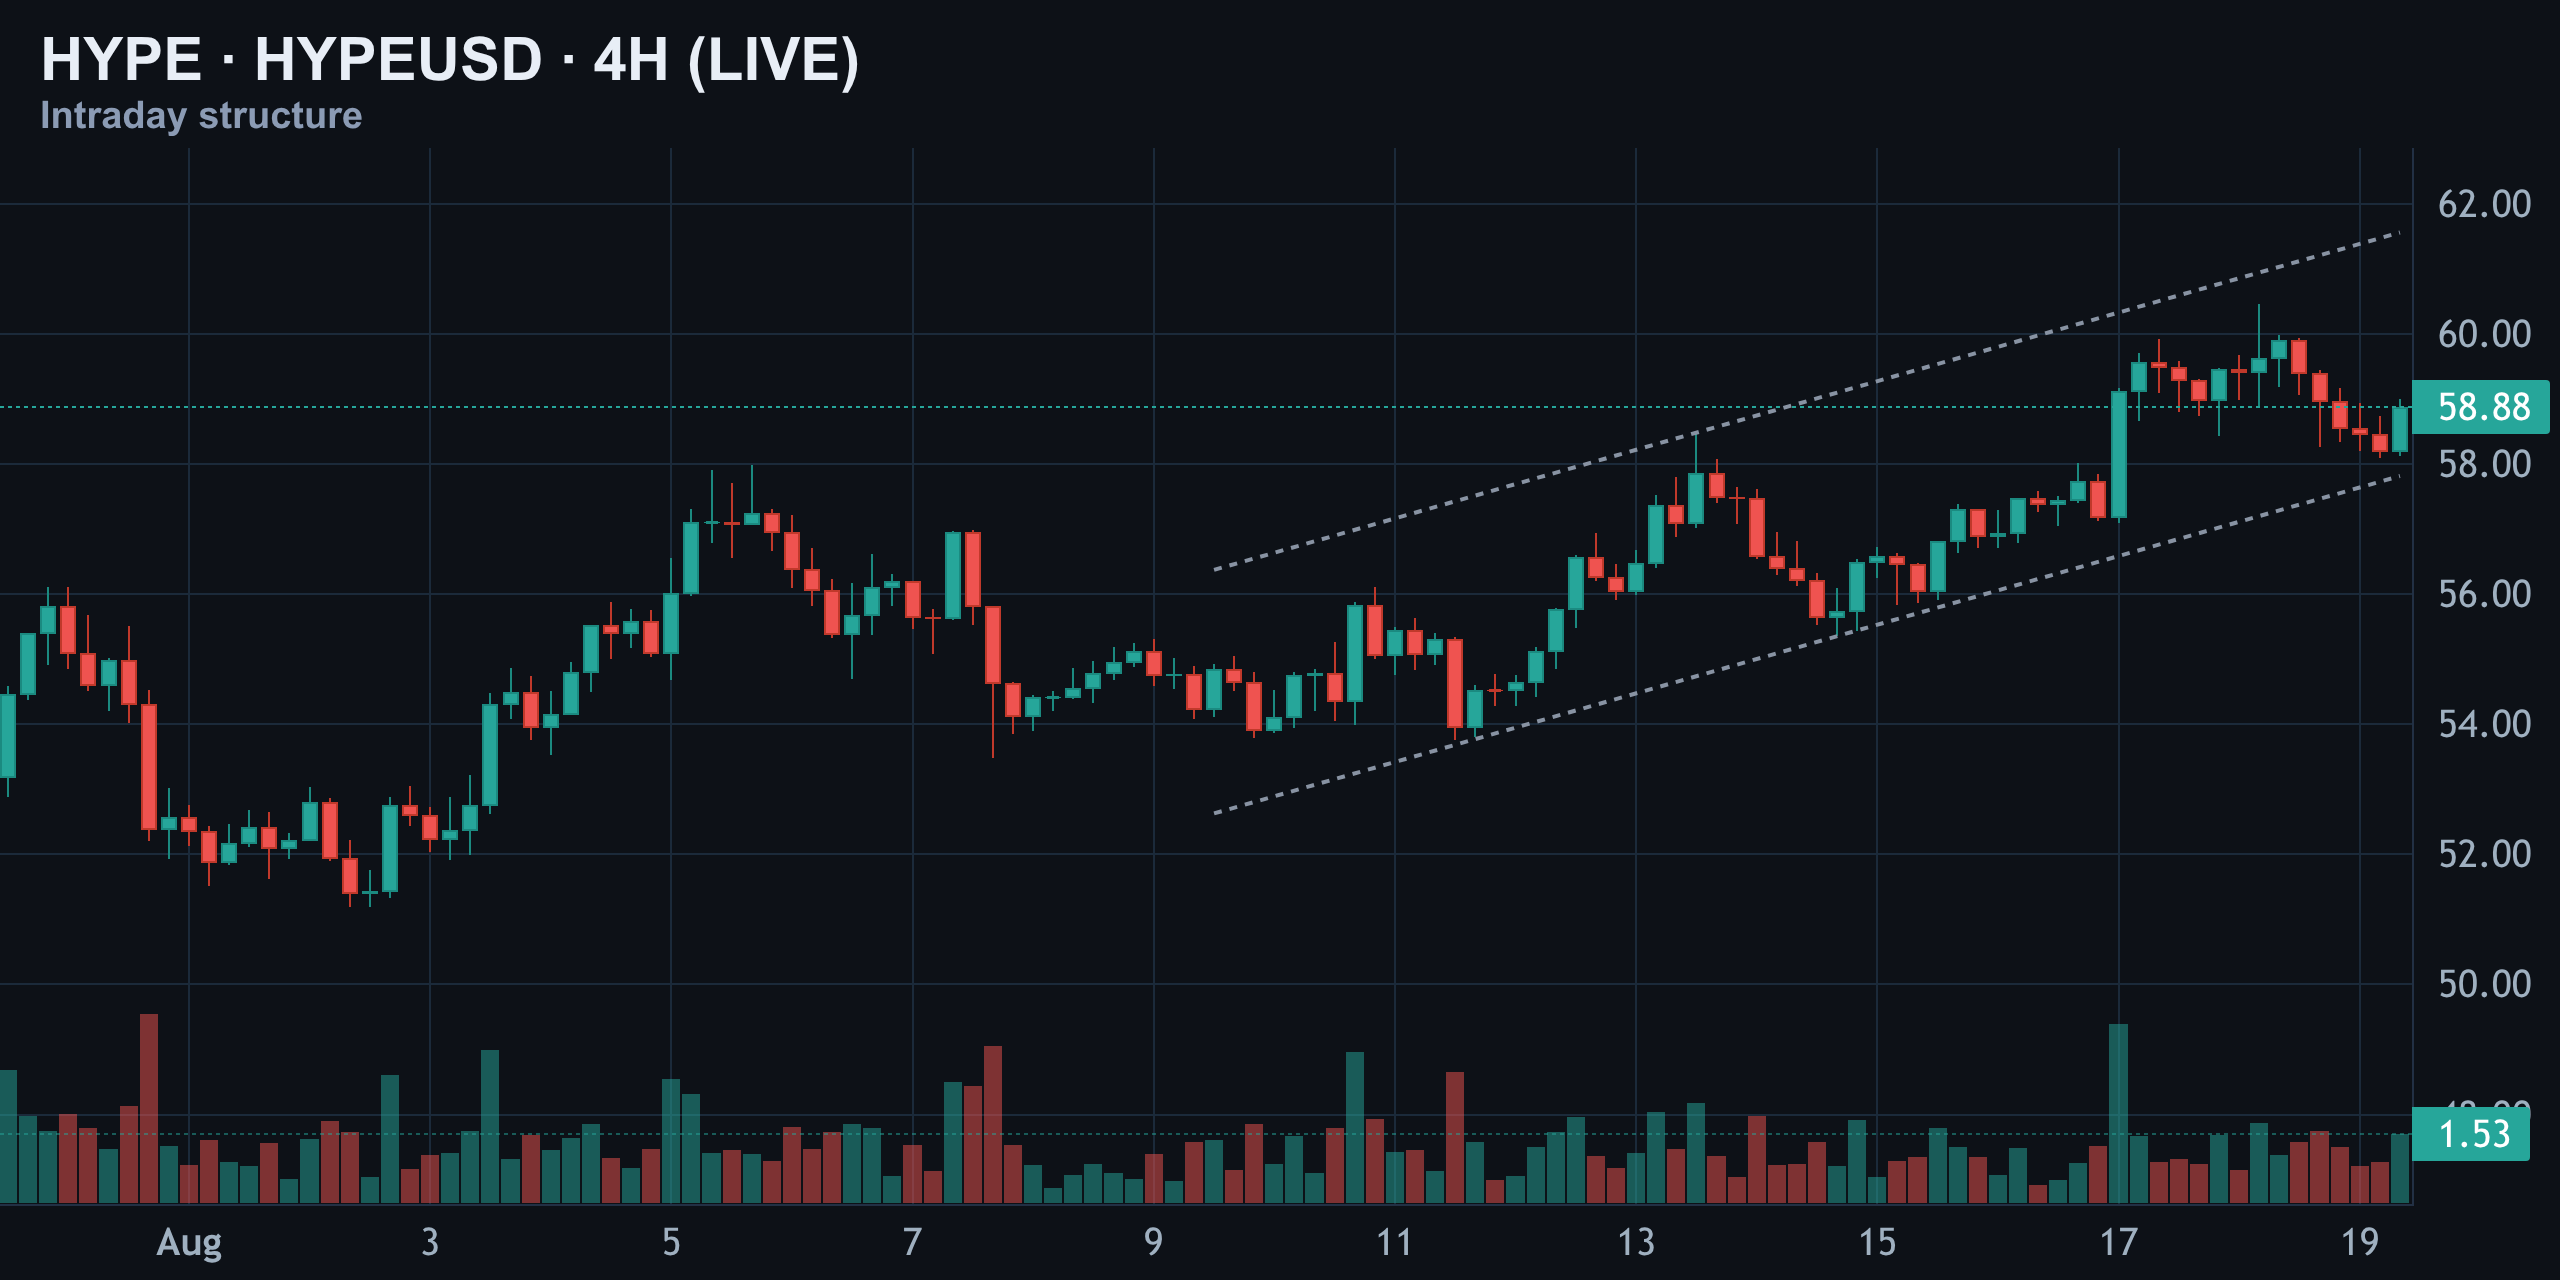
Structure stays bullish while price holds above that rising floor. Lose it, and the channel that's carried the entire rally starts to look broken — which is exactly why today's daily close matters more than most.
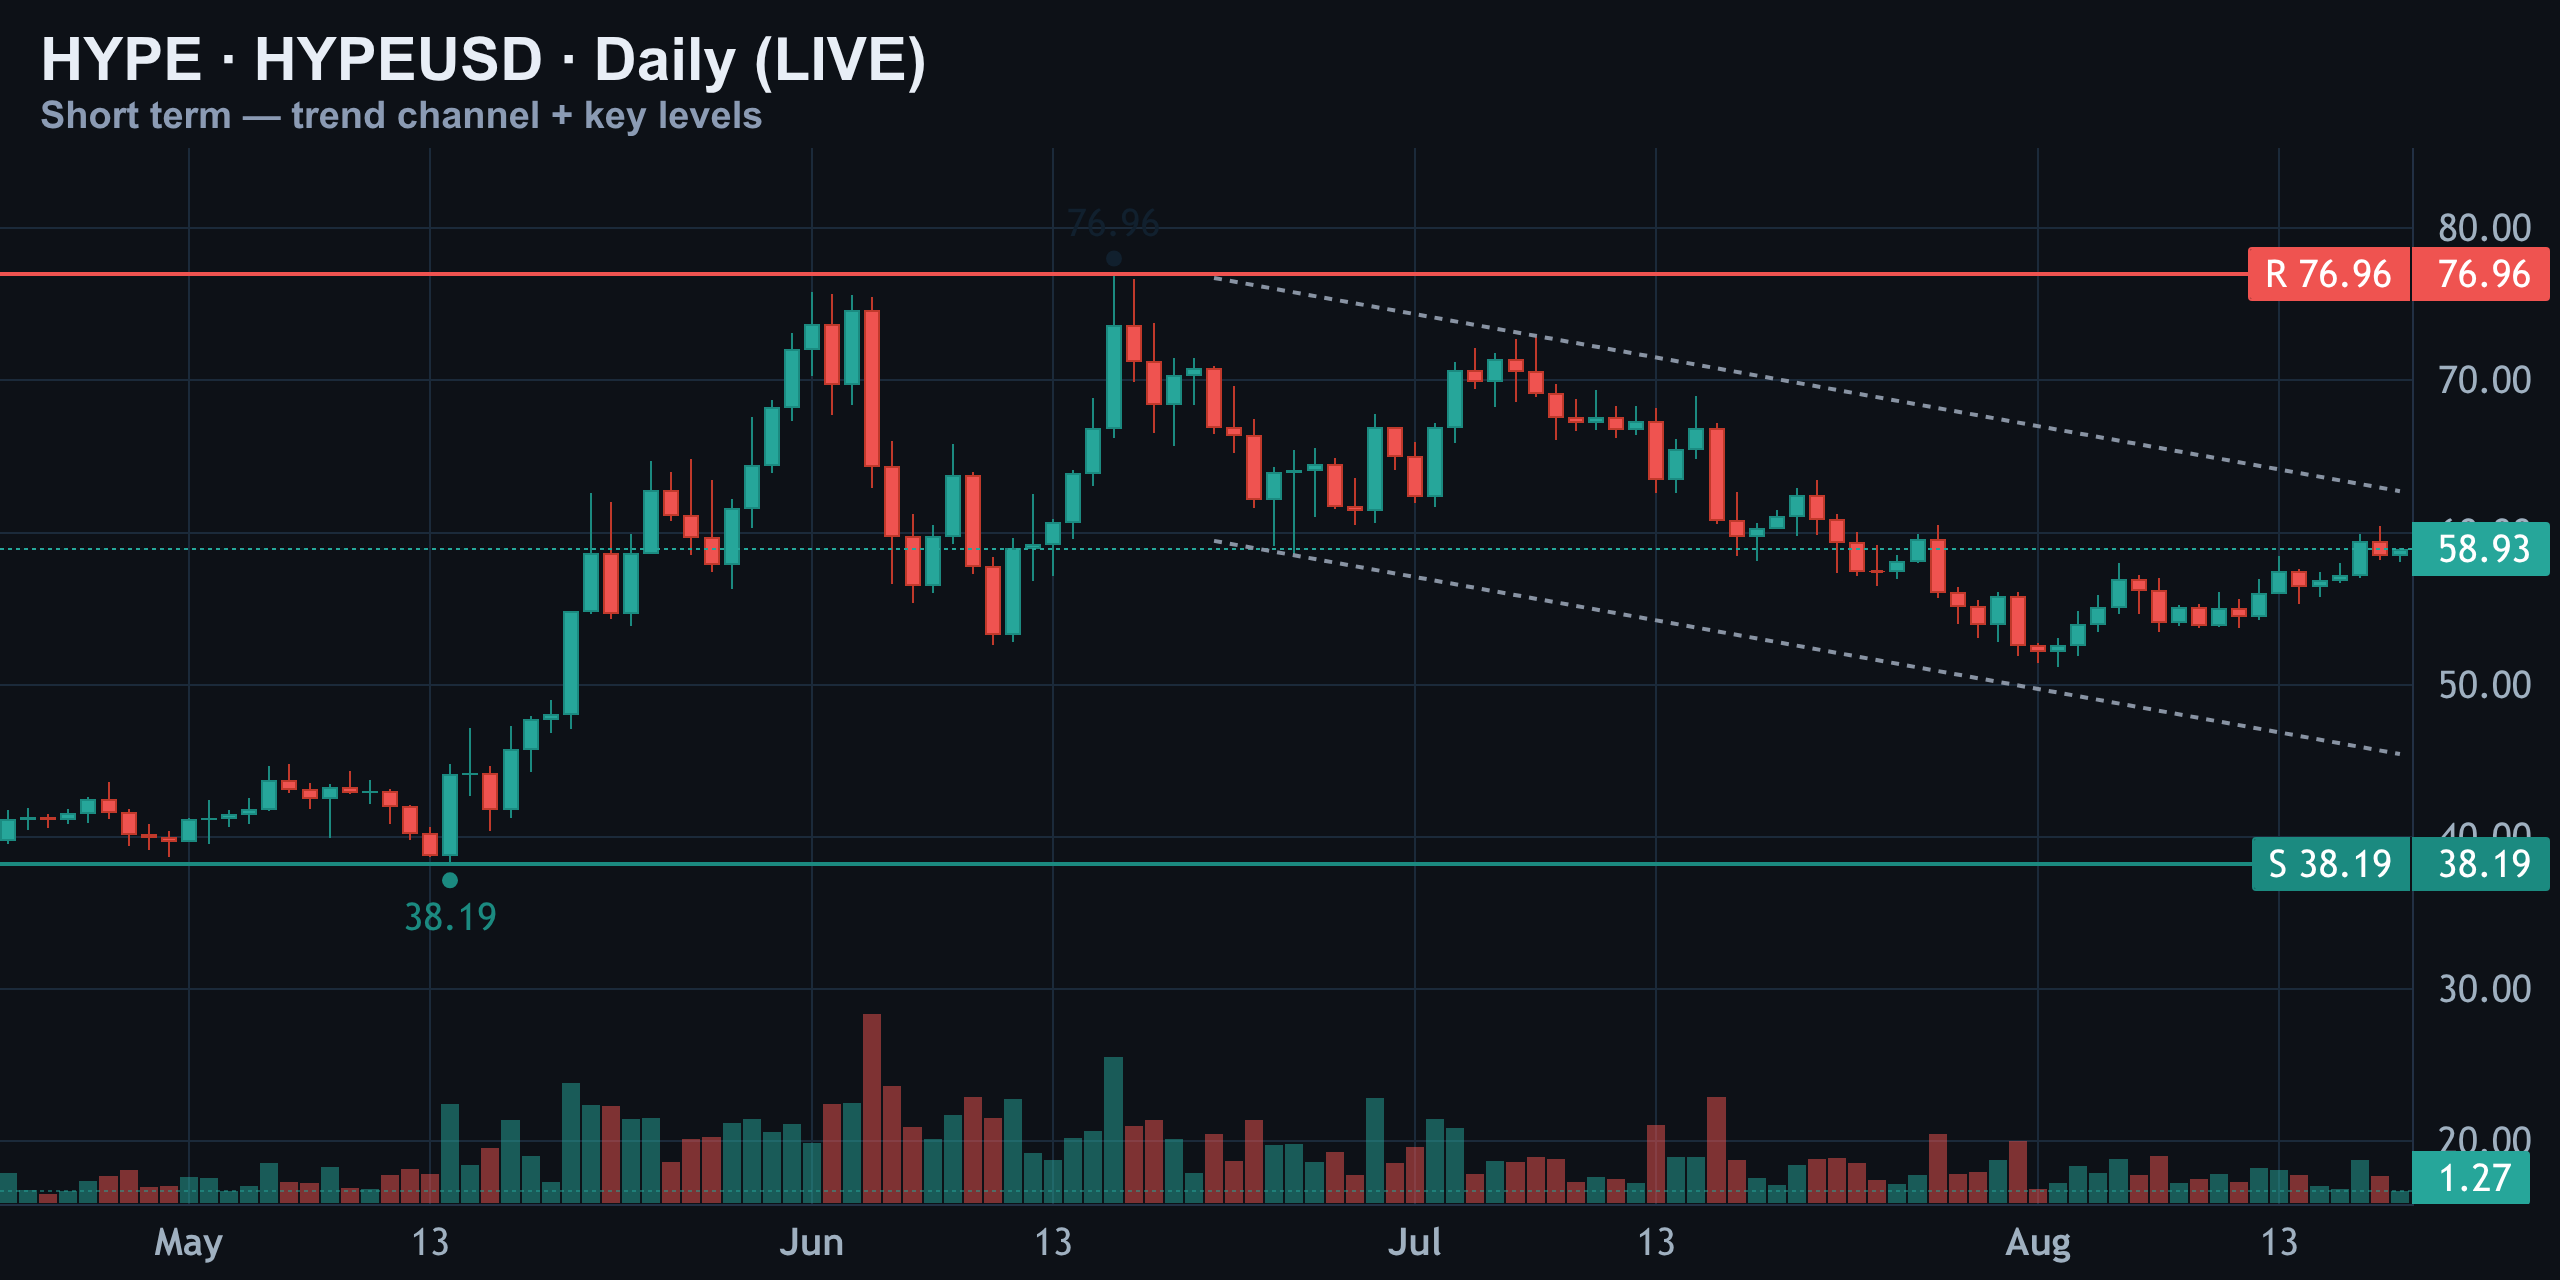
Pulling back further to the daily chart, HYPE sits inside a much wider channel, with resistance near $77 overhead and major support all the way down near $38 from May. Neither level matters today. What matters is that spot, at $58.93, is resting almost exactly on the rising trendline that has supported every dip since the August low.
Momentum Check: RSI Neutral, MACD's Early Bullish Tick
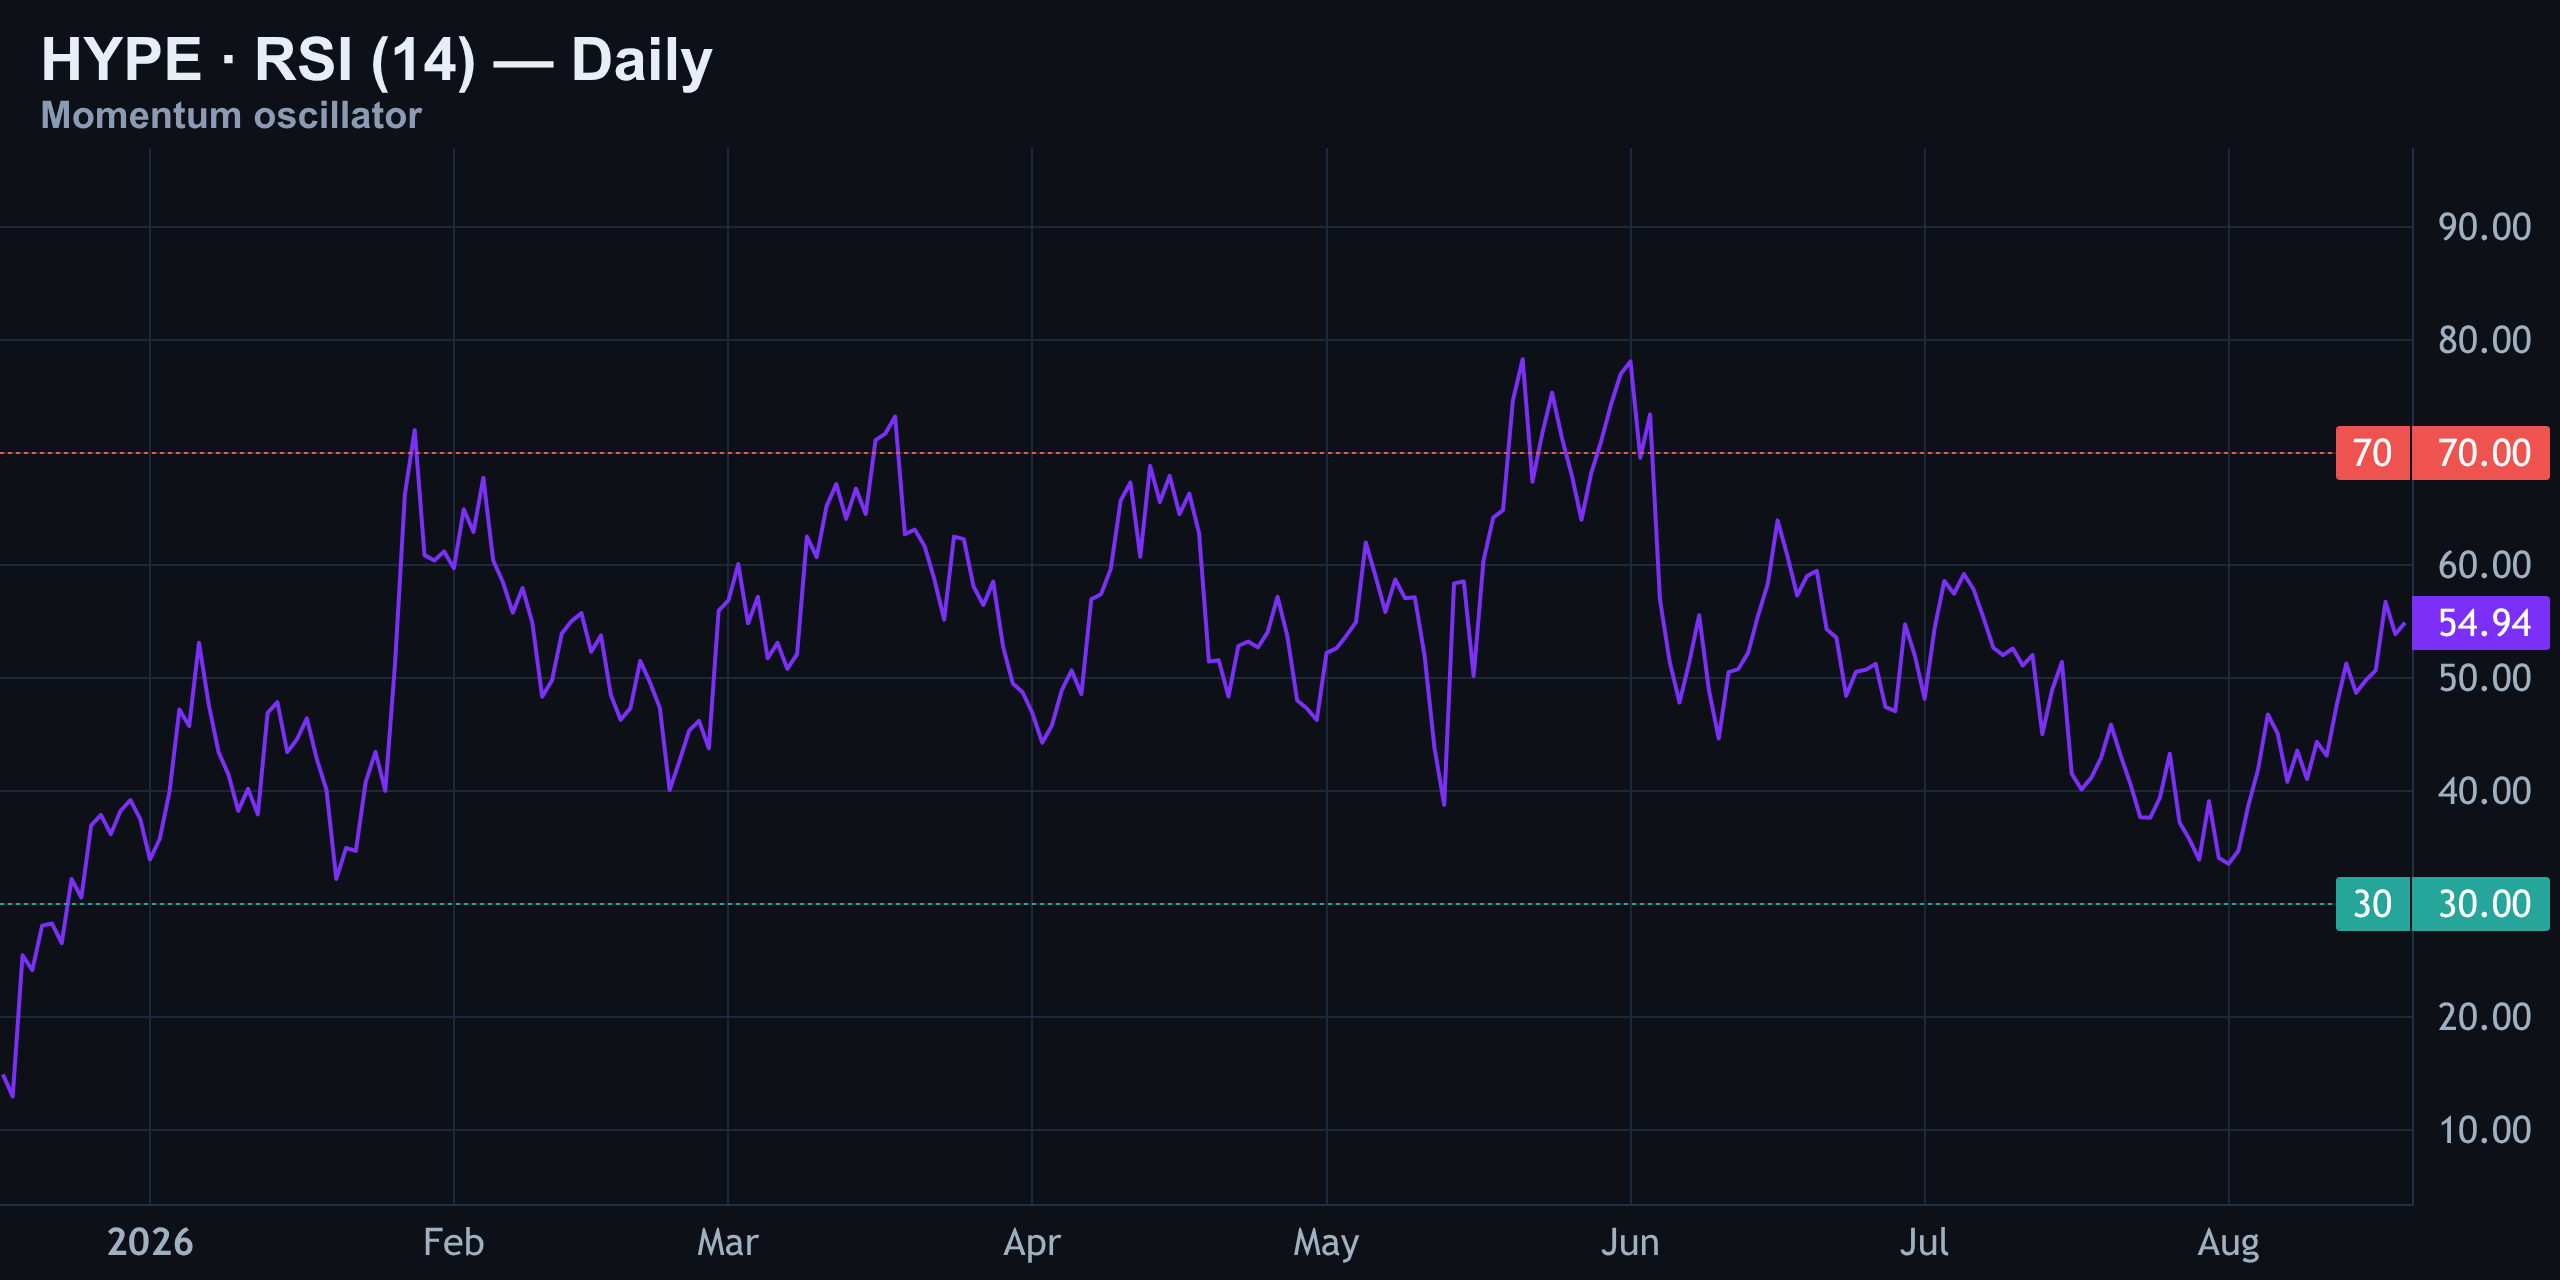
RSI on the daily is reading 55 — dead center of the 0-to-100 range, nowhere near the 70 overbought line or the 30 oversold line. That's a neutral momentum reading, consistent with a price that's been chopping sideways rather than trending hard in either direction. There's no divergence here either; RSI and price have been moving together.
MACD just crossed back above its signal line, with the histogram flipping positive at +0.76. That's a fresh, early bullish tick — not the extended, overheated reading seen back in June when the histogram spiked well above 2. Both MACD lines remain below zero, meaning the broader momentum trend hasn't fully turned yet.
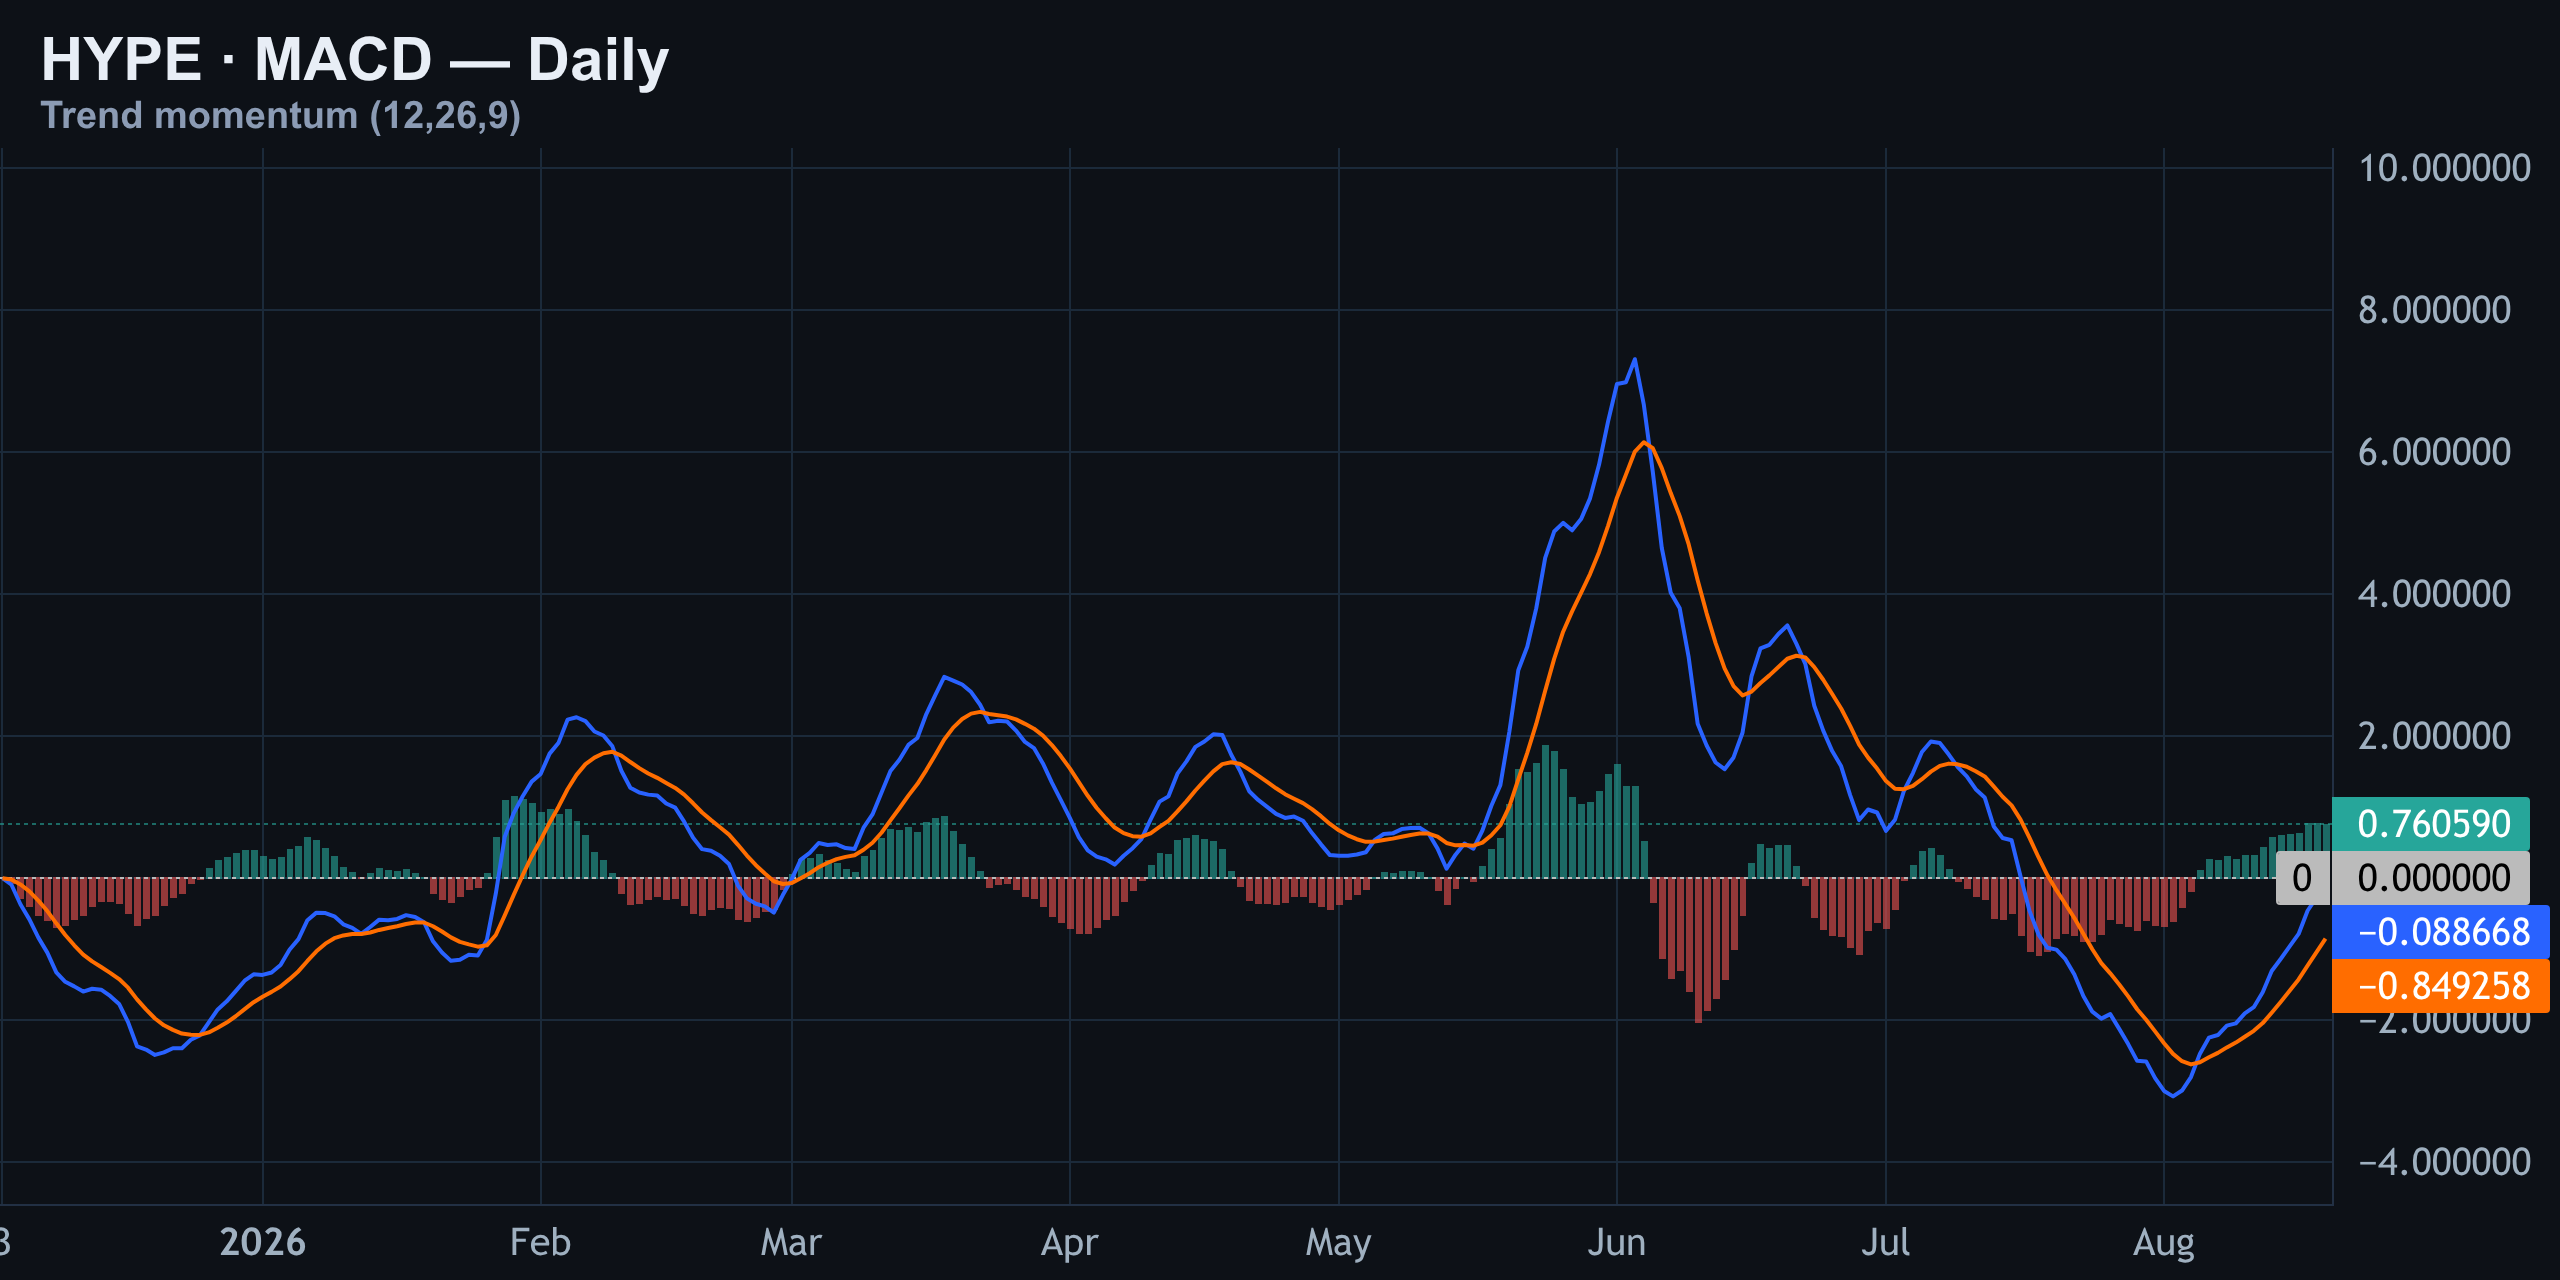
Put together, this looks like a stabilizing bounce inside a bigger consolidation — not a confirmed new leg higher. Momentum just turned slightly positive, but it's still early days.
The Levels That Decide It: Gamma Exposure and the Trap Below Spot
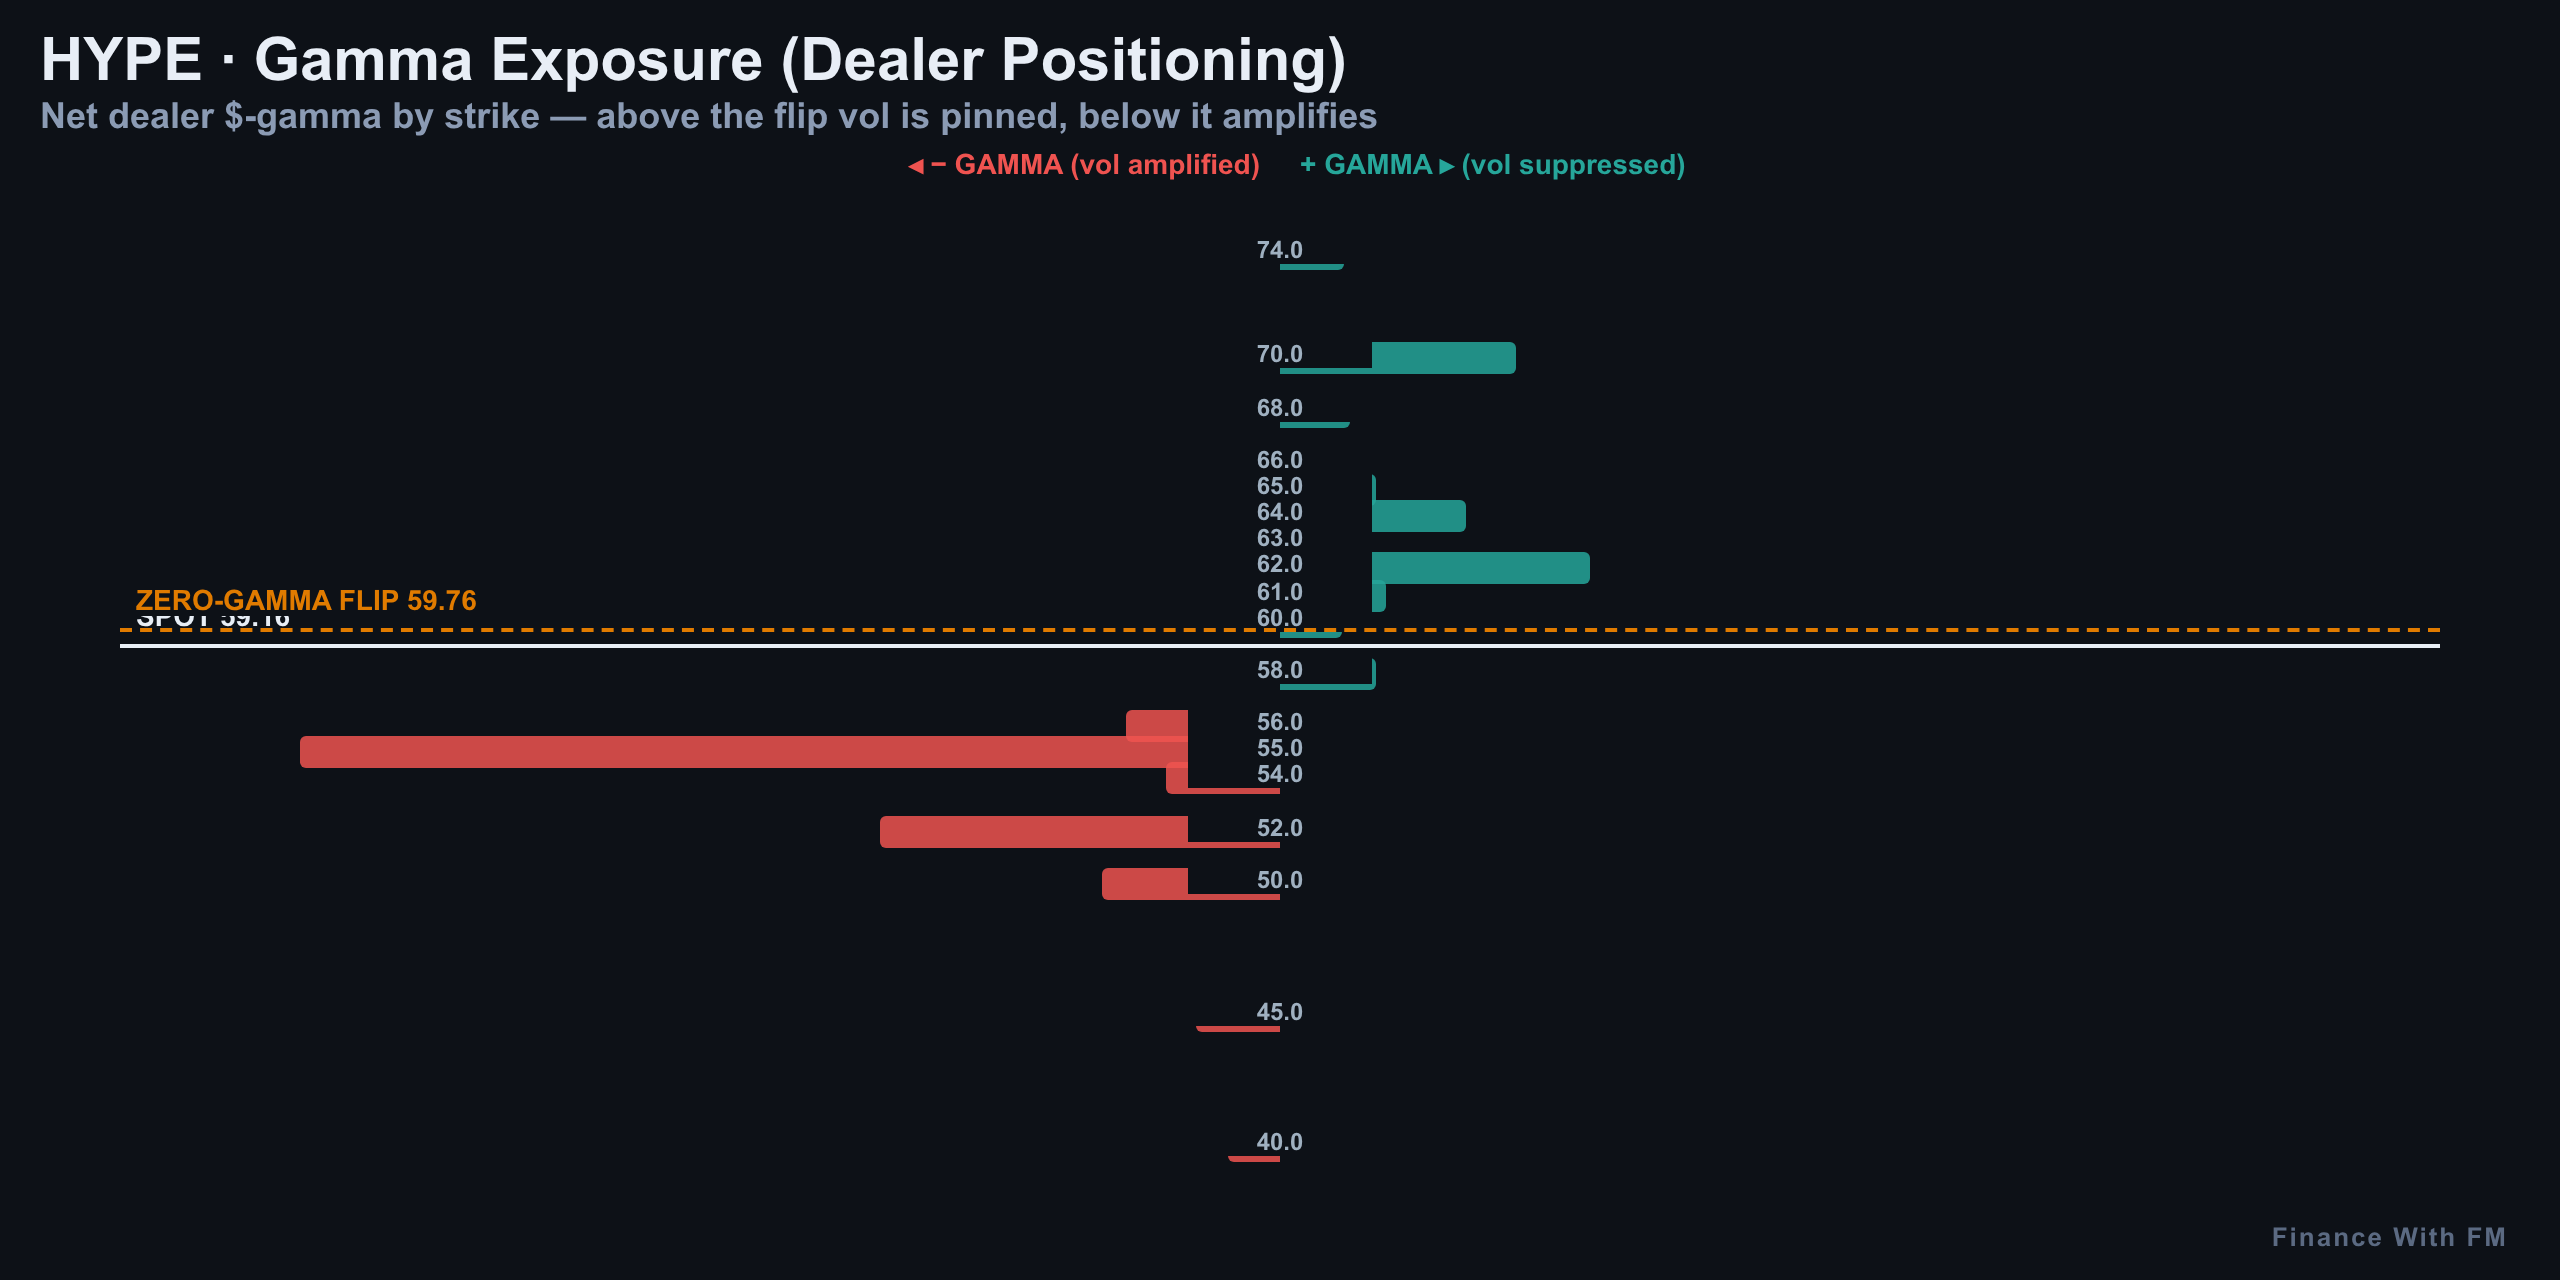
The number that matters most today is $57.34 — lose it, and the range-bound thesis breaks down. Above spot, dealers have a gamma wall at $62 and a zero-gamma flip at $60, where volatility could suddenly accelerate.
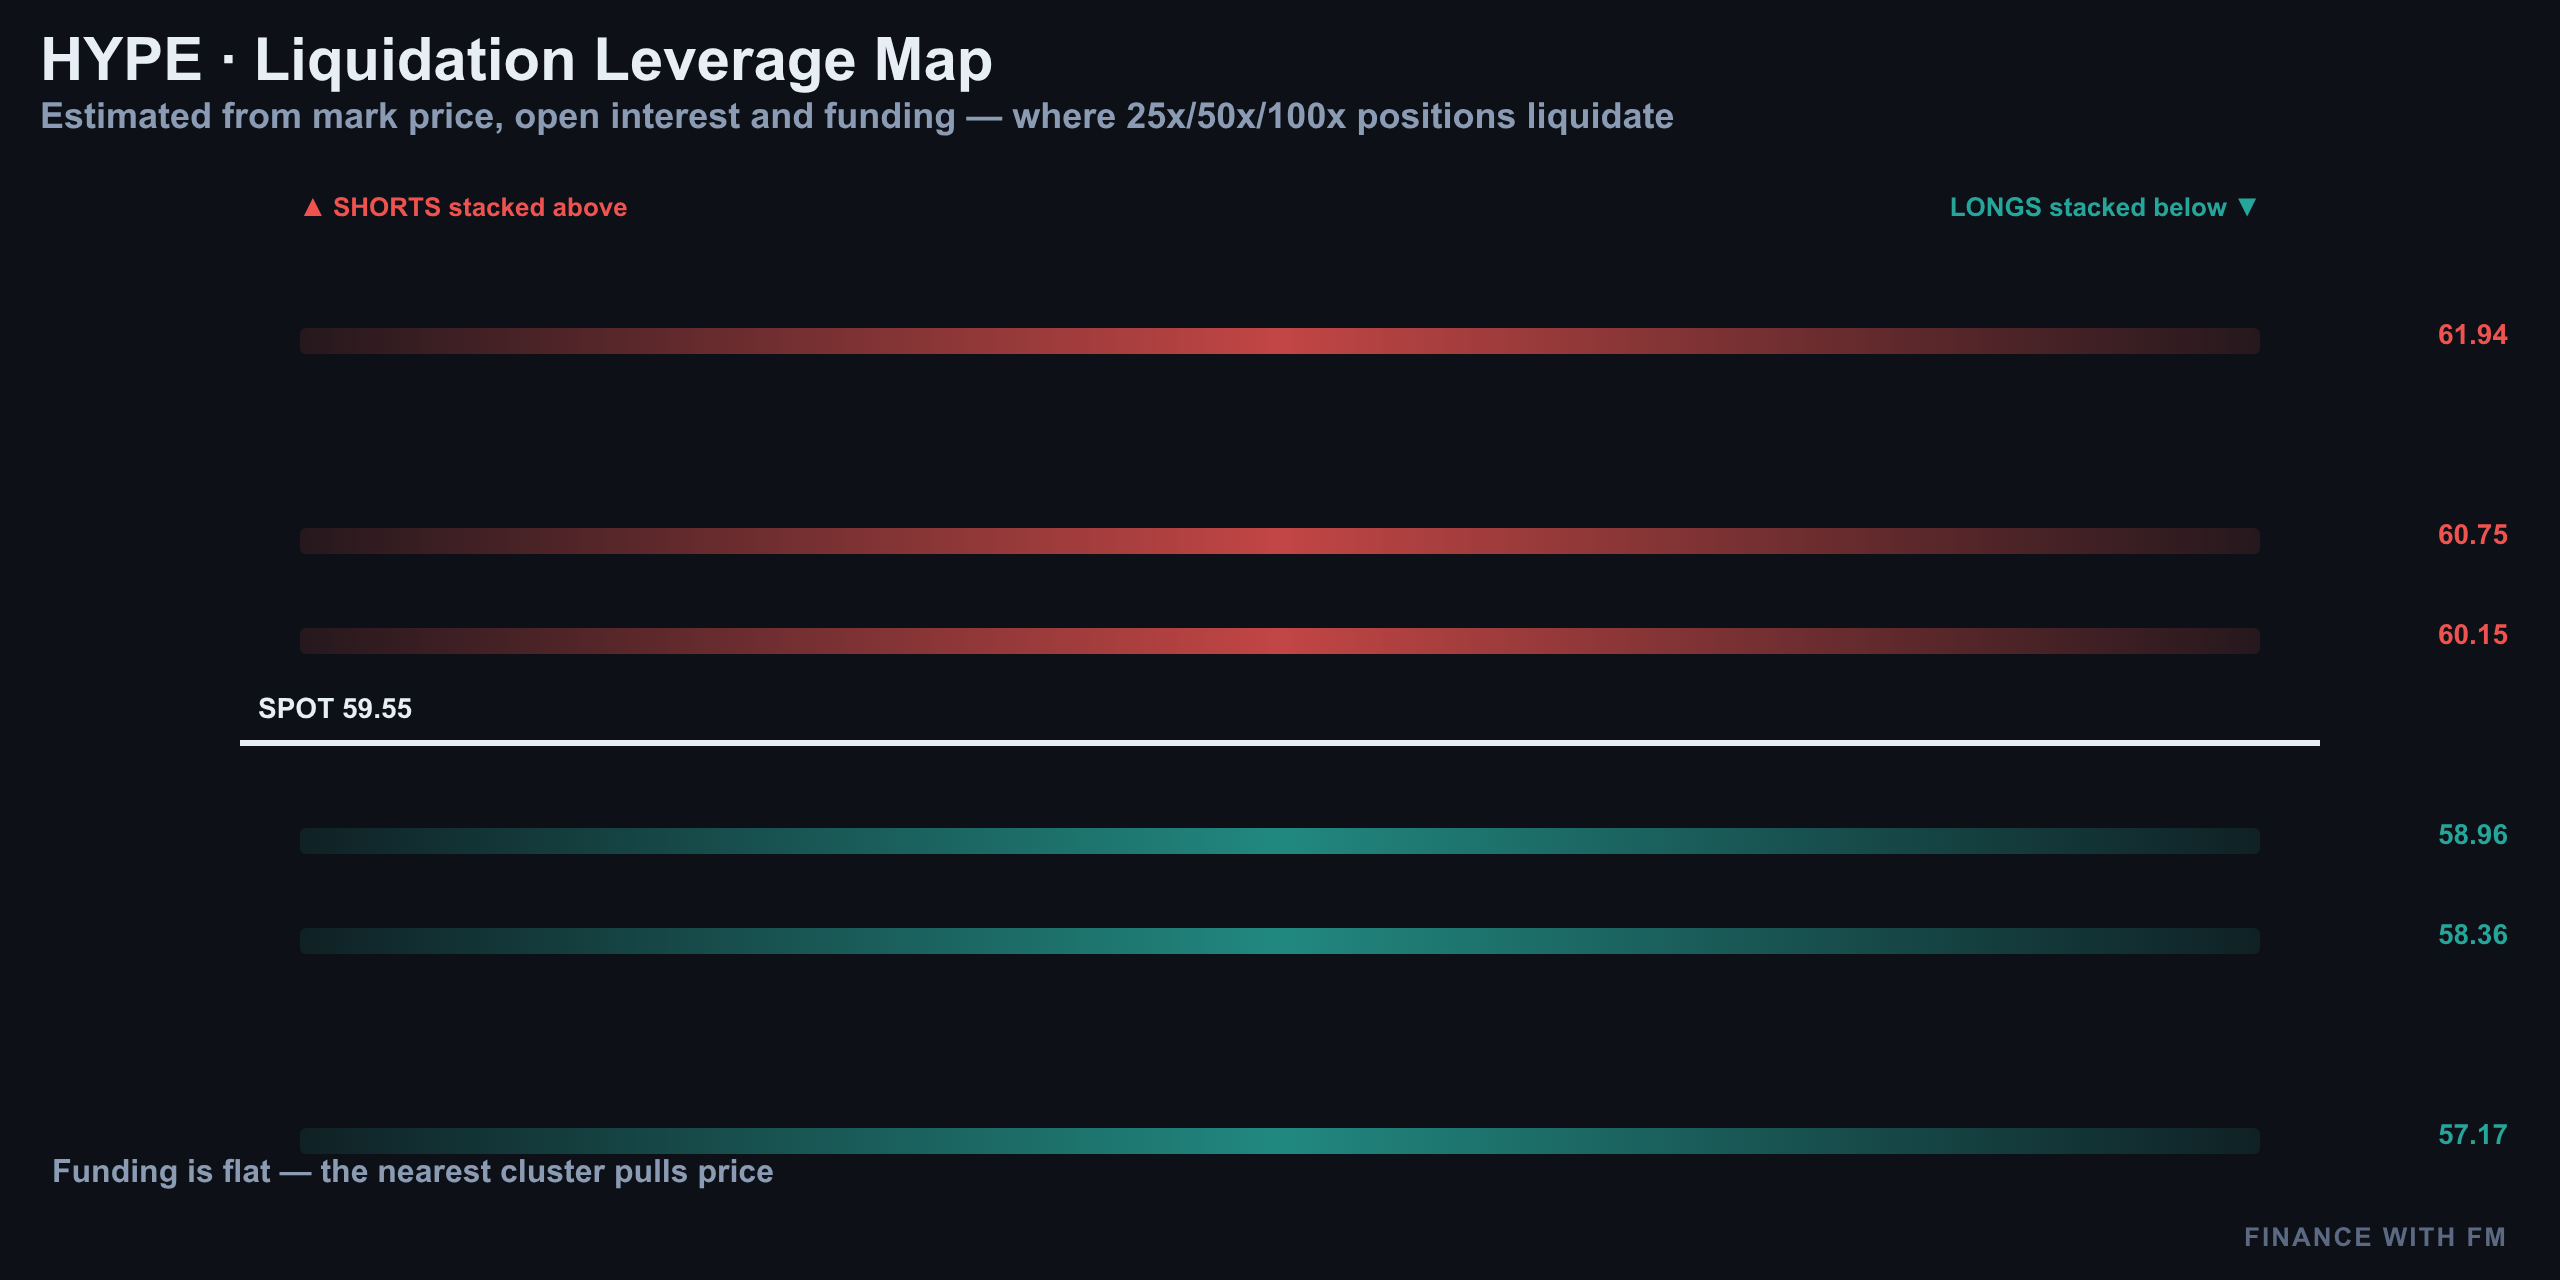
Below spot, liquidation heatmaps show clusters at $58.50, $56.19, and a dense pocket at $53.88. These aren't levels the market is aiming for — they're prices leverage has already fought over. That's the trap: a dip toward those clusters can look like a breakdown when it's really just stop-hunting through thin liquidity.
| Level | Price | Significance |
|---|---|---|
| Gamma Wall (Resistance) | $62.00 | Heaviest overhead dealer hedging |
| Zero-Gamma Flip | $60.00 | Vol stays pinned above, gets violent below |
| Spot | $58.77 | Current price |
| Liquidation Cluster | $58.50 | Leverage already cleared |
| Key Trendline / Range Floor | $57.34 | Range-bound thesis breaks below here |
| Support Gamma | $55.00 | Strongest dealer support |
| Liquidation Cluster | $56.19 | Leverage already cleared |
| Dense Liquidation Pocket | $53.88 | Leverage already cleared |
Expected Move: What the Options Market Is Pricing
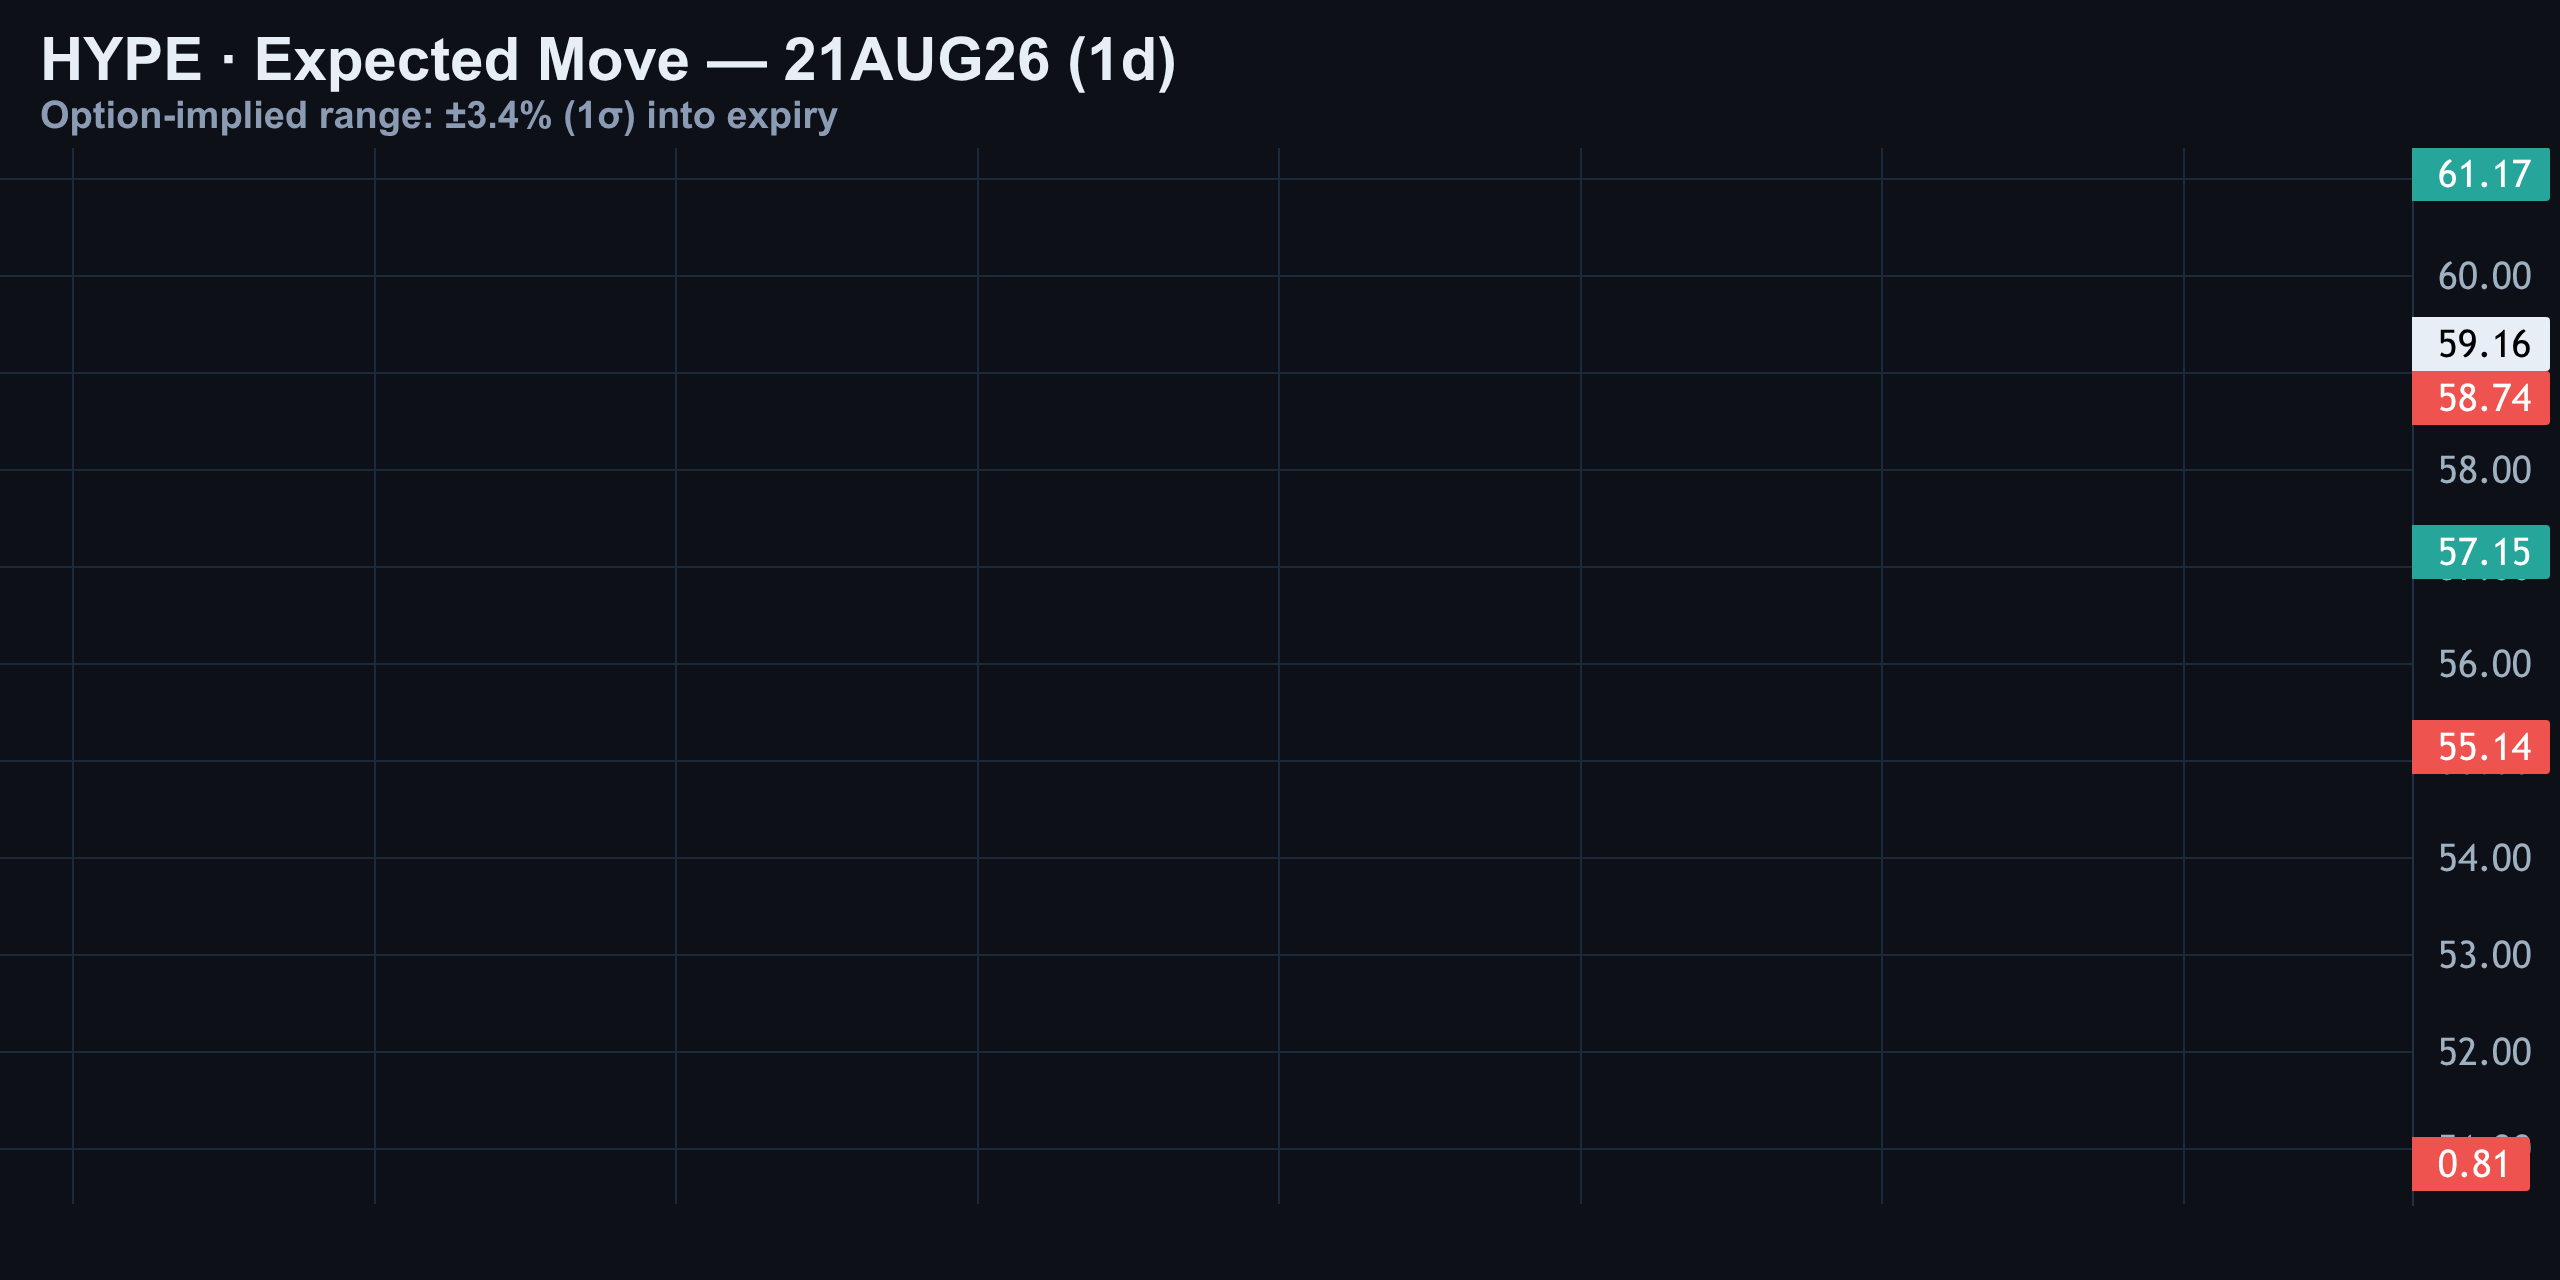
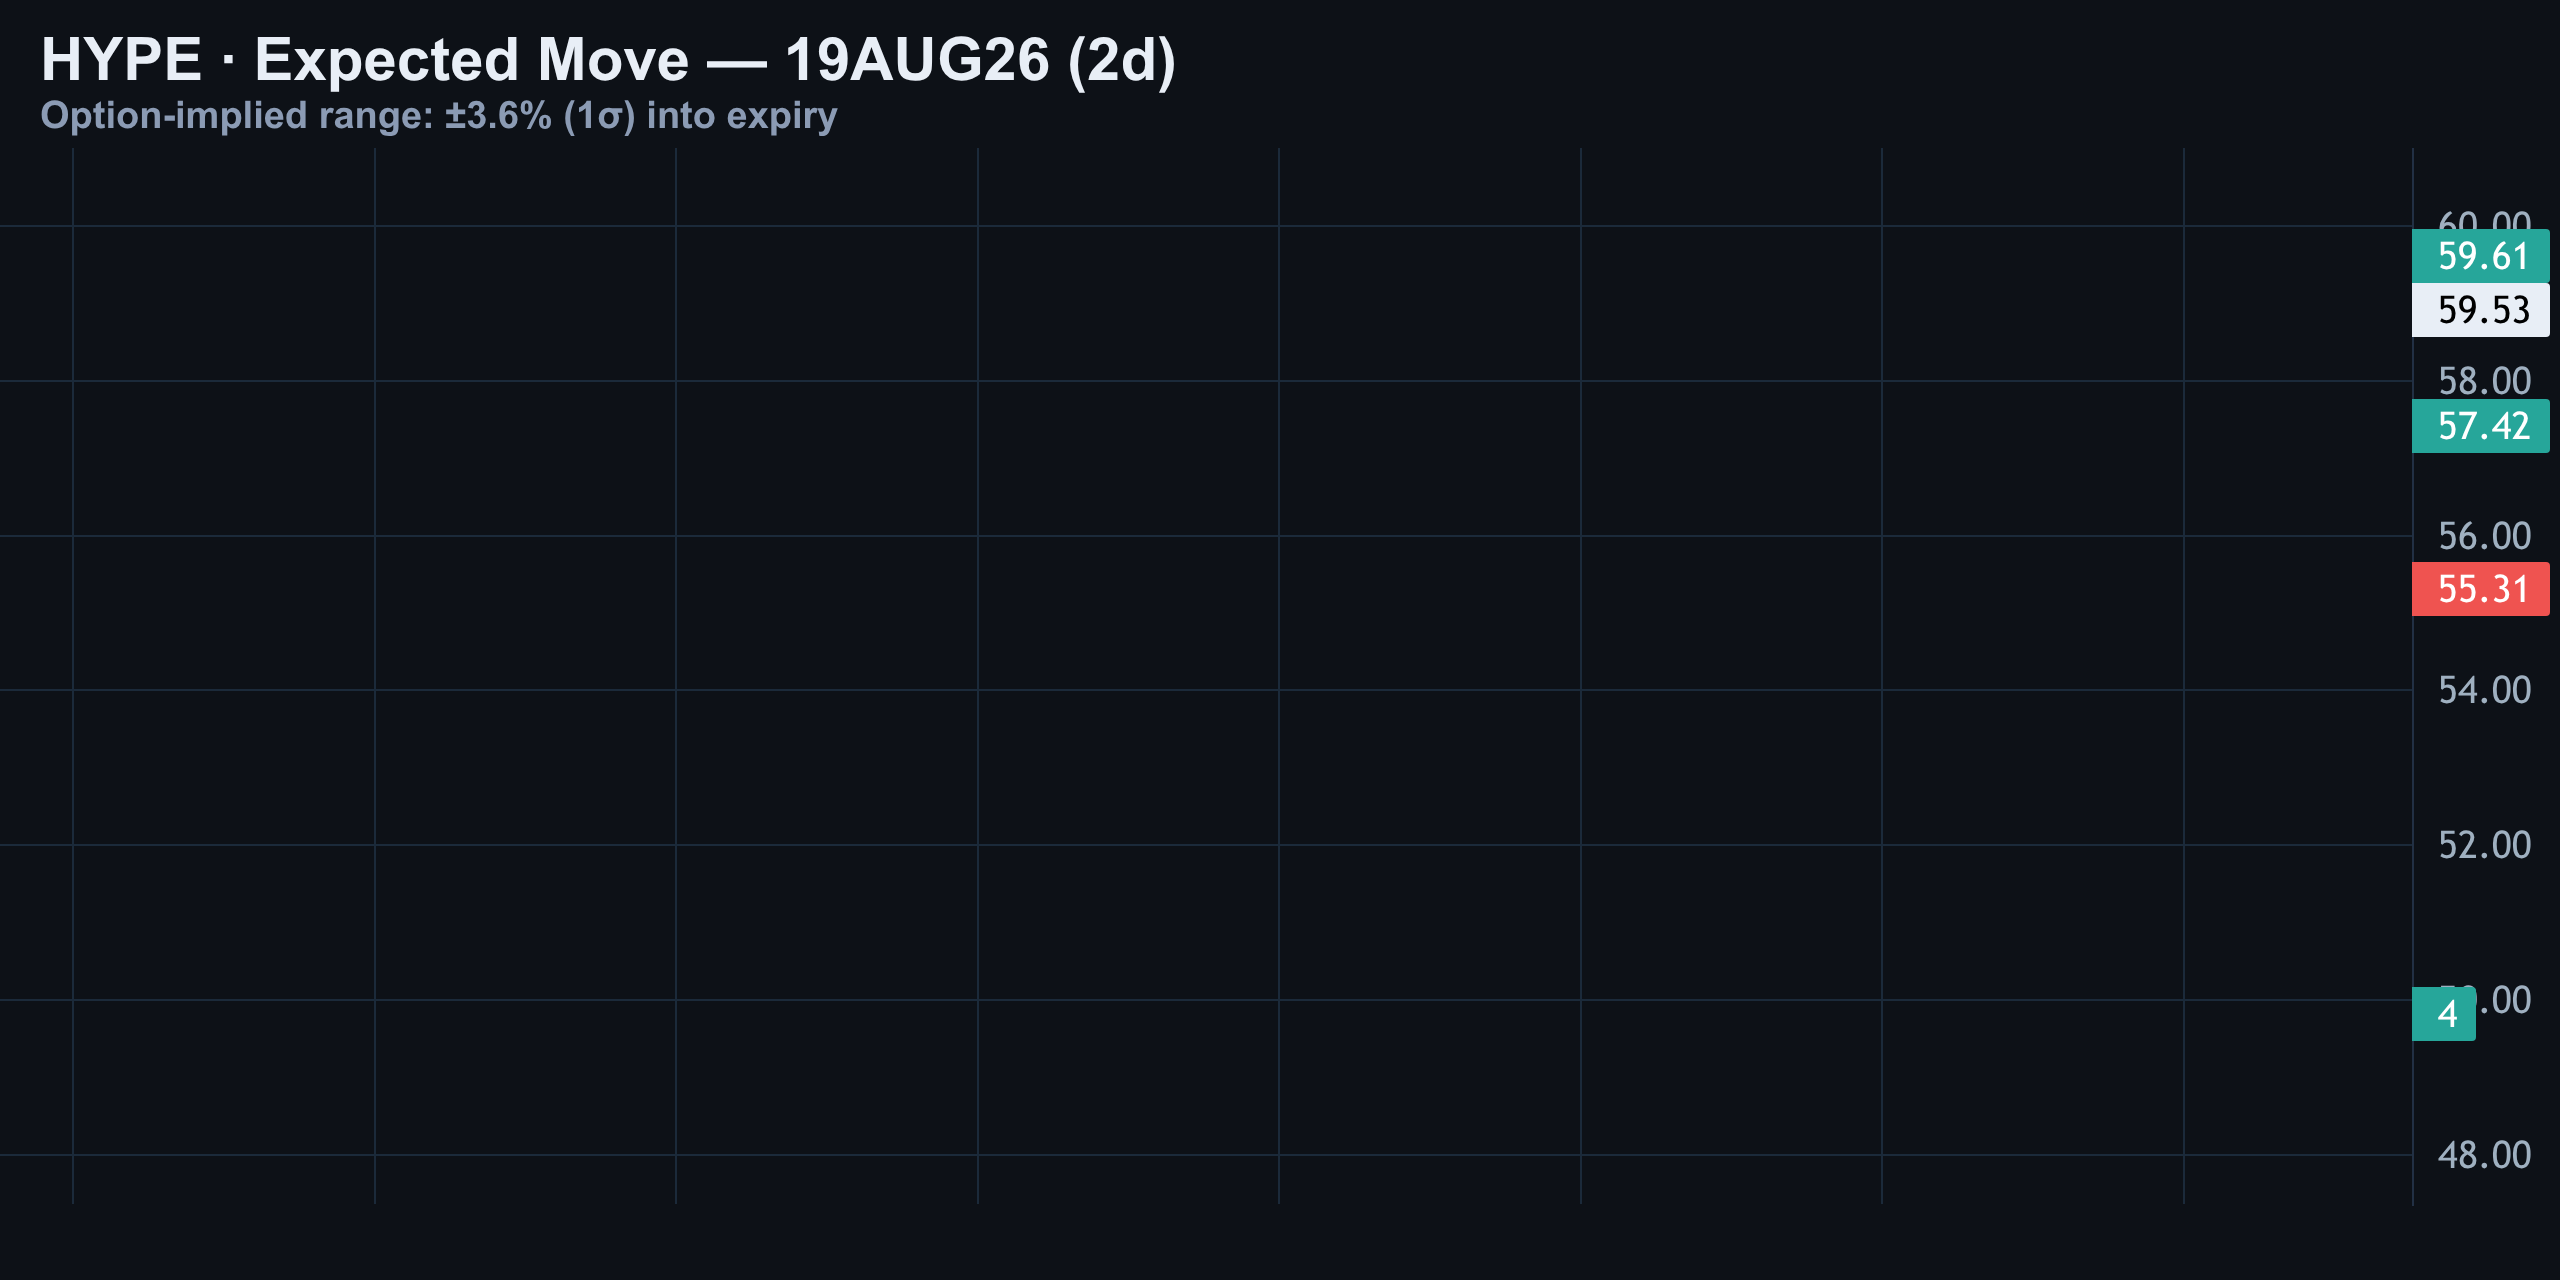
The options market is pricing a one-sigma move of about ±3.4% — a range of roughly $57 to $61 — with the two-sigma band, covering about 95% of outcomes, spanning $55 to $63.
| Confidence Band | Range |
|---|---|
| 1-Sigma (~68% odds) | $57.00 – $61.00 |
| 2-Sigma (~95% odds) | $55.00 – $63.00 |
ATM implied volatility sits at 53%. Trades that target inside the one-sigma band are the high-probability plays; betting on a break beyond the two-sigma tail is a low-odds bet dressed up as conviction.
The volatility curve is in contango — near-term (1-day) implied vol is 59% versus 64% at 127 days out. An upward-sloping curve like this signals a calm, complacent regime: the market isn't pricing panic today, but it is pricing more uncertainty further out.
Today's Drivers, Why There's No Trade, and the Bottom Line
Every signal today points to the same conclusion: this is a market gathering information, not one making a decision. RSI is neutral. MACD just flipped positive but stays below zero. The 4-hour channel is under pressure but not broken. The daily trendline is being tested but hasn't given way. And dealers sitting in negative gamma mean the eventual resolution — whichever direction it comes from — should move fast once it starts.
- No clean 1:2.5 risk-reward setup exists today — reward doesn't justify the risk on either side of the trade.
- Upside is capped by structure: the $60 zero-gamma flip and $62 gamma wall sit close overhead, limiting how far a bounce can run before dealer hedging pushes back.
- Downside carries a trap: liquidation clusters at $58.50, $56.19, and $53.88 can create sharp, fast wicks that look like breakdowns but are really leverage flushes.
- The one level that changes everything is $57.34 — a daily close below it breaks the range-bound thesis that's held since the August low.
Summary: HYPE is stuck at $58.77, sitting right on the trendline that's carried its August rally, with RSI neutral, MACD only just turning positive, and dealers in negative gamma above spot. Hold $57.34 and the range holds with it. Lose it, and the coiled spring on the 15-minute chart, the pressured rising channel on the 4-hour, and the trendline test on the daily all point the same way — down, and fast. Until that level breaks or the price reclaims $60, this stays a wait-and-see market.
Previous days
08/18/2026 — HYPE Daily Pulse Aug 18, 2026: The $60 Flip Guarding the Range
HYPE Daily Pulse Aug 18, 2026: The $60 Flip Guarding the Range
Where We Left It: Yesterday's Stand-Aside Call Played Out Exactly Right
Yesterday on Finance With FM, the call was simple: stand aside. HYPE was trapped between its 50-day and 200-day moving averages, and there was no clean setup worth risking capital on. That patience paid off — HYPE drifted roughly 0.4% higher since then, from about $59.60 to $59.86, going absolutely nowhere fast.
Today, HYPE is trading right around $59.91, according to on-chain and exchange data, with CoinGecko pricing it at $59.43 and a 24-hour volume near $268 million against a market cap of roughly $13 billion. Robinhood's feed shows HYPE closer to $57.69, a reminder that cross-venue spreads on this name can run wider than blue-chip crypto during choppy sessions. Either way, spot is boxed tightly beneath the psychological $60 mark that's about to become the entire story of this piece.
The Big Picture: A Calm Market Sitting on a Trigger
HYPE is modestly higher on the day but still boxed between its 50-day and 200-day moving averages — the same range that kept us sidelined yesterday. What's changed is the texture underneath: momentum is quietly improving. RSI sits at 58, MACD just turned positive, and neither indicator is anywhere close to stretched.
Dealer positioning and the options market are telling the same story from two different angles: this is a calm market sitting just under the $60 level that decides whether that calm holds or breaks. Some price-forecast models had HYPE pegged around $58.84 for August 2026, and recent daily readings near $59.26 confirm the token is tracking close to that projected path. Longer-term bulls like Arthur Hayes have floated far more aggressive targets — as high as $150 by this point in the cycle — but that thesis remains a distant tail scenario, not today's trade.
15-Minute Intraday: The Rising Channel Buyers Keep Defending
Zoom into the 15-minute chart and today's session is grinding higher inside a clean rising channel. Every dip gets bought before it can break structure — a series of higher lows stepping up from around $58.50 toward $60 and change.
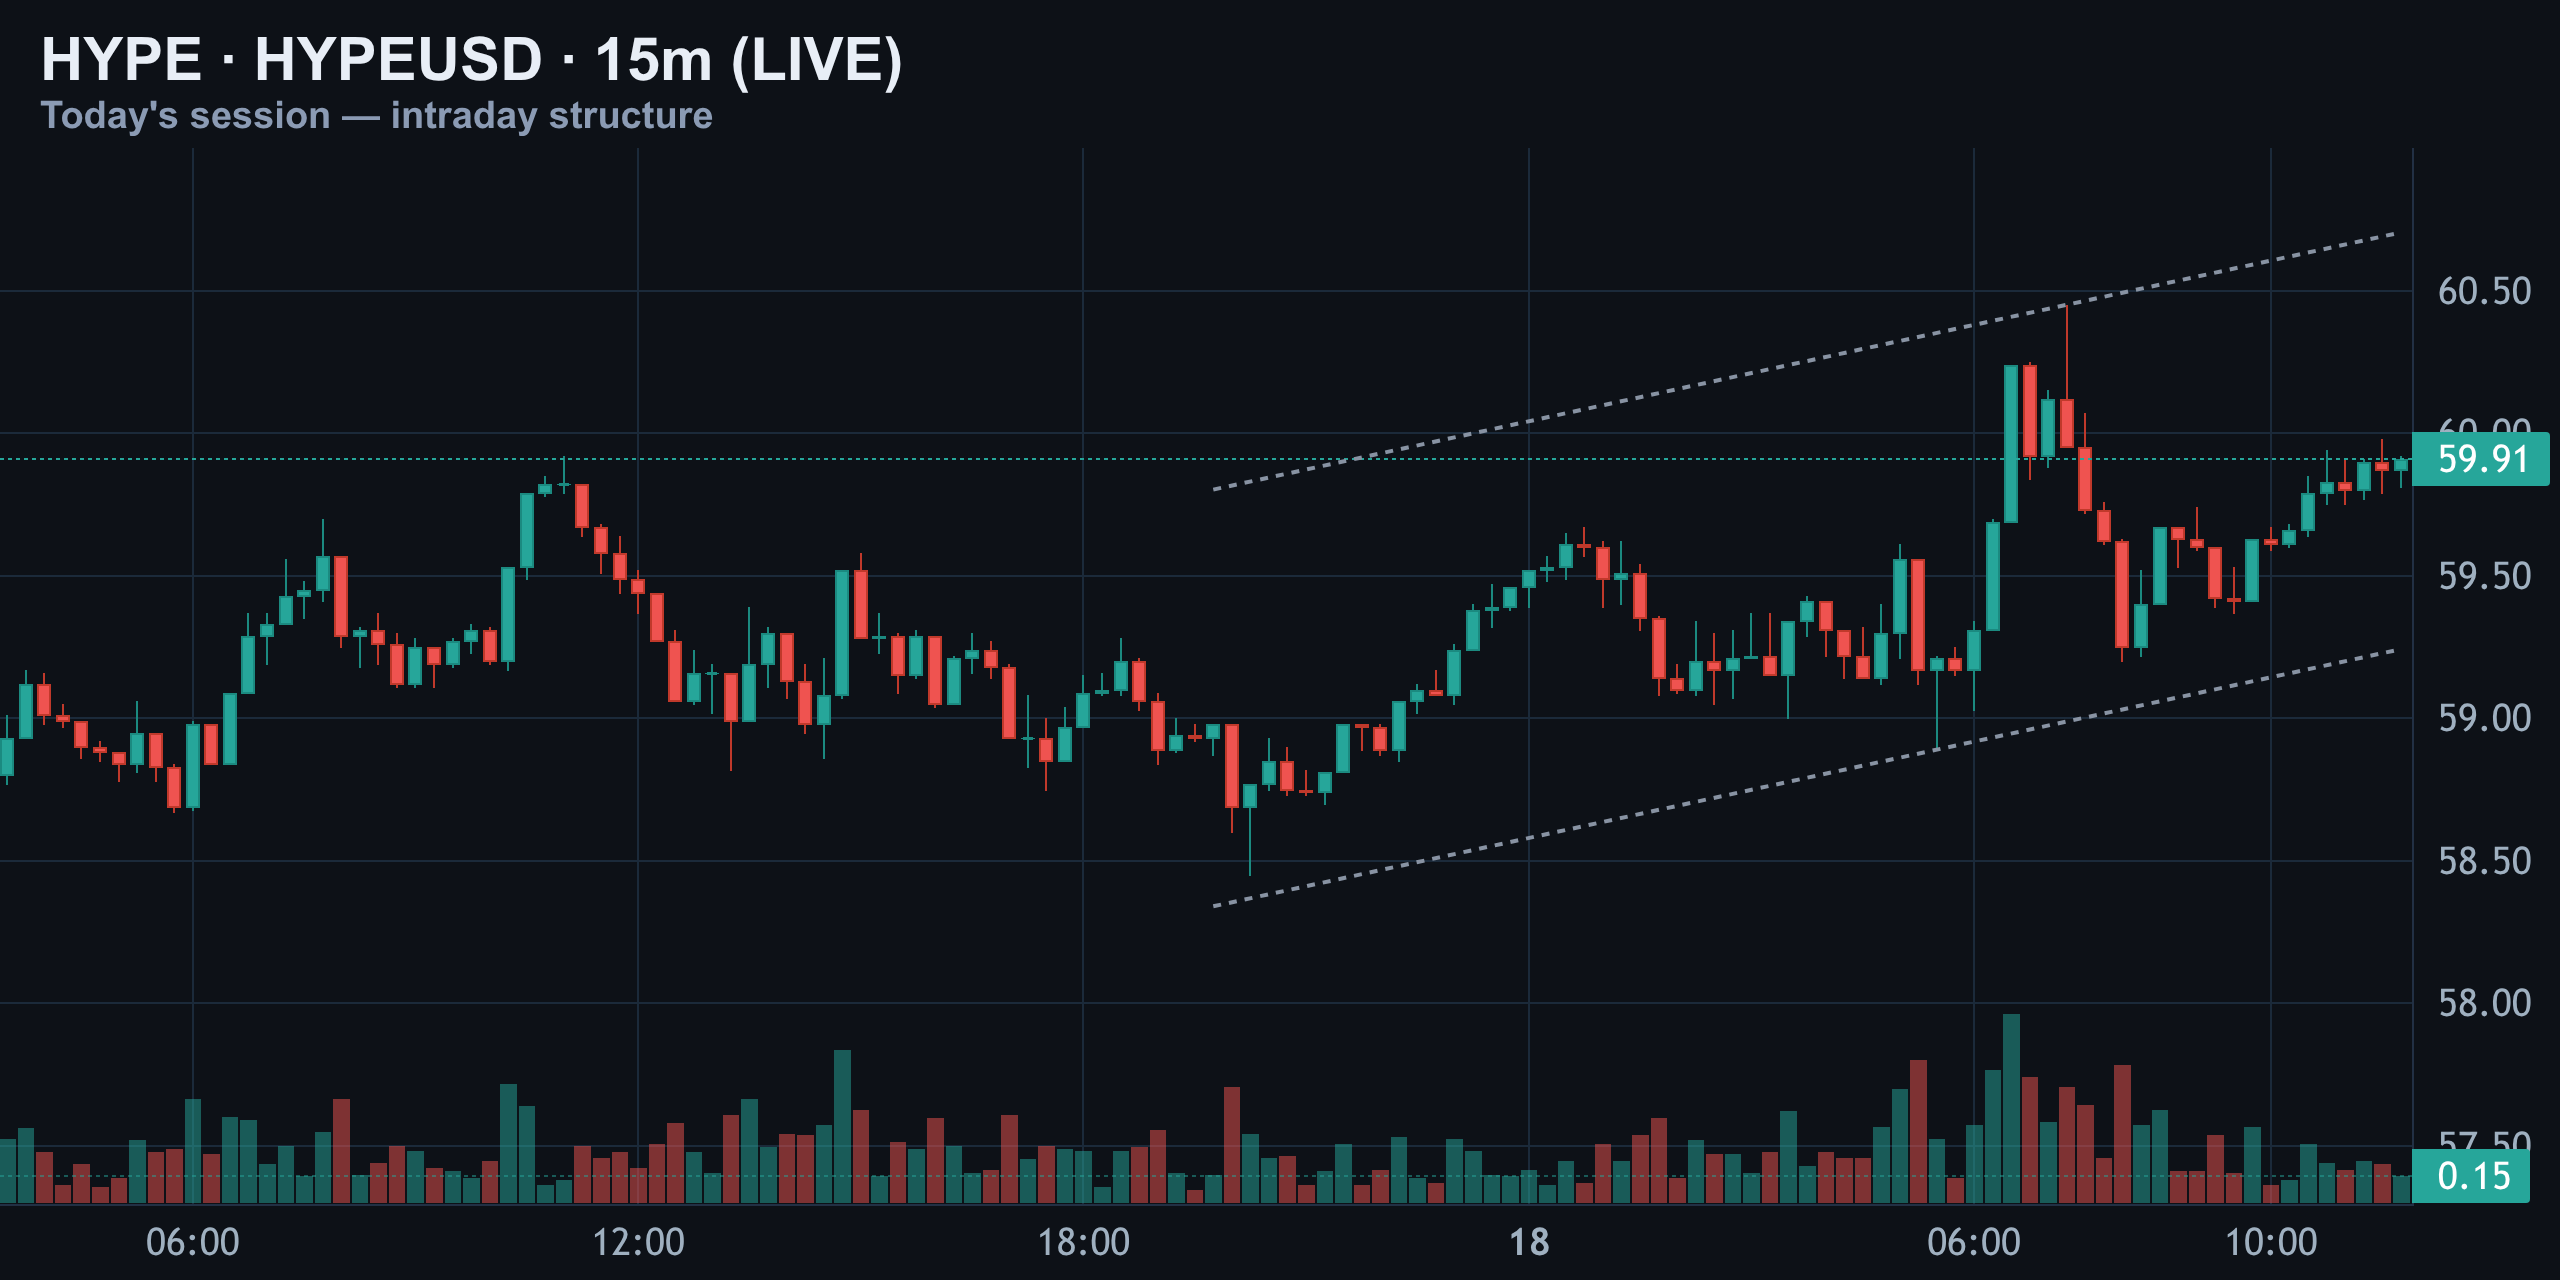
There was a sharp spike above $60.06 earlier in the session, followed by a fade back to $59.91, where price sits right now. As long as that channel floor holds, intraday buyers are still in control. Lose the bottom rail, and this short-term structure breaks first — and it would break before any of the bigger timeframes even notice.
4-Hour and Daily Structure: The Staircase Higher Meets a Descending Ceiling
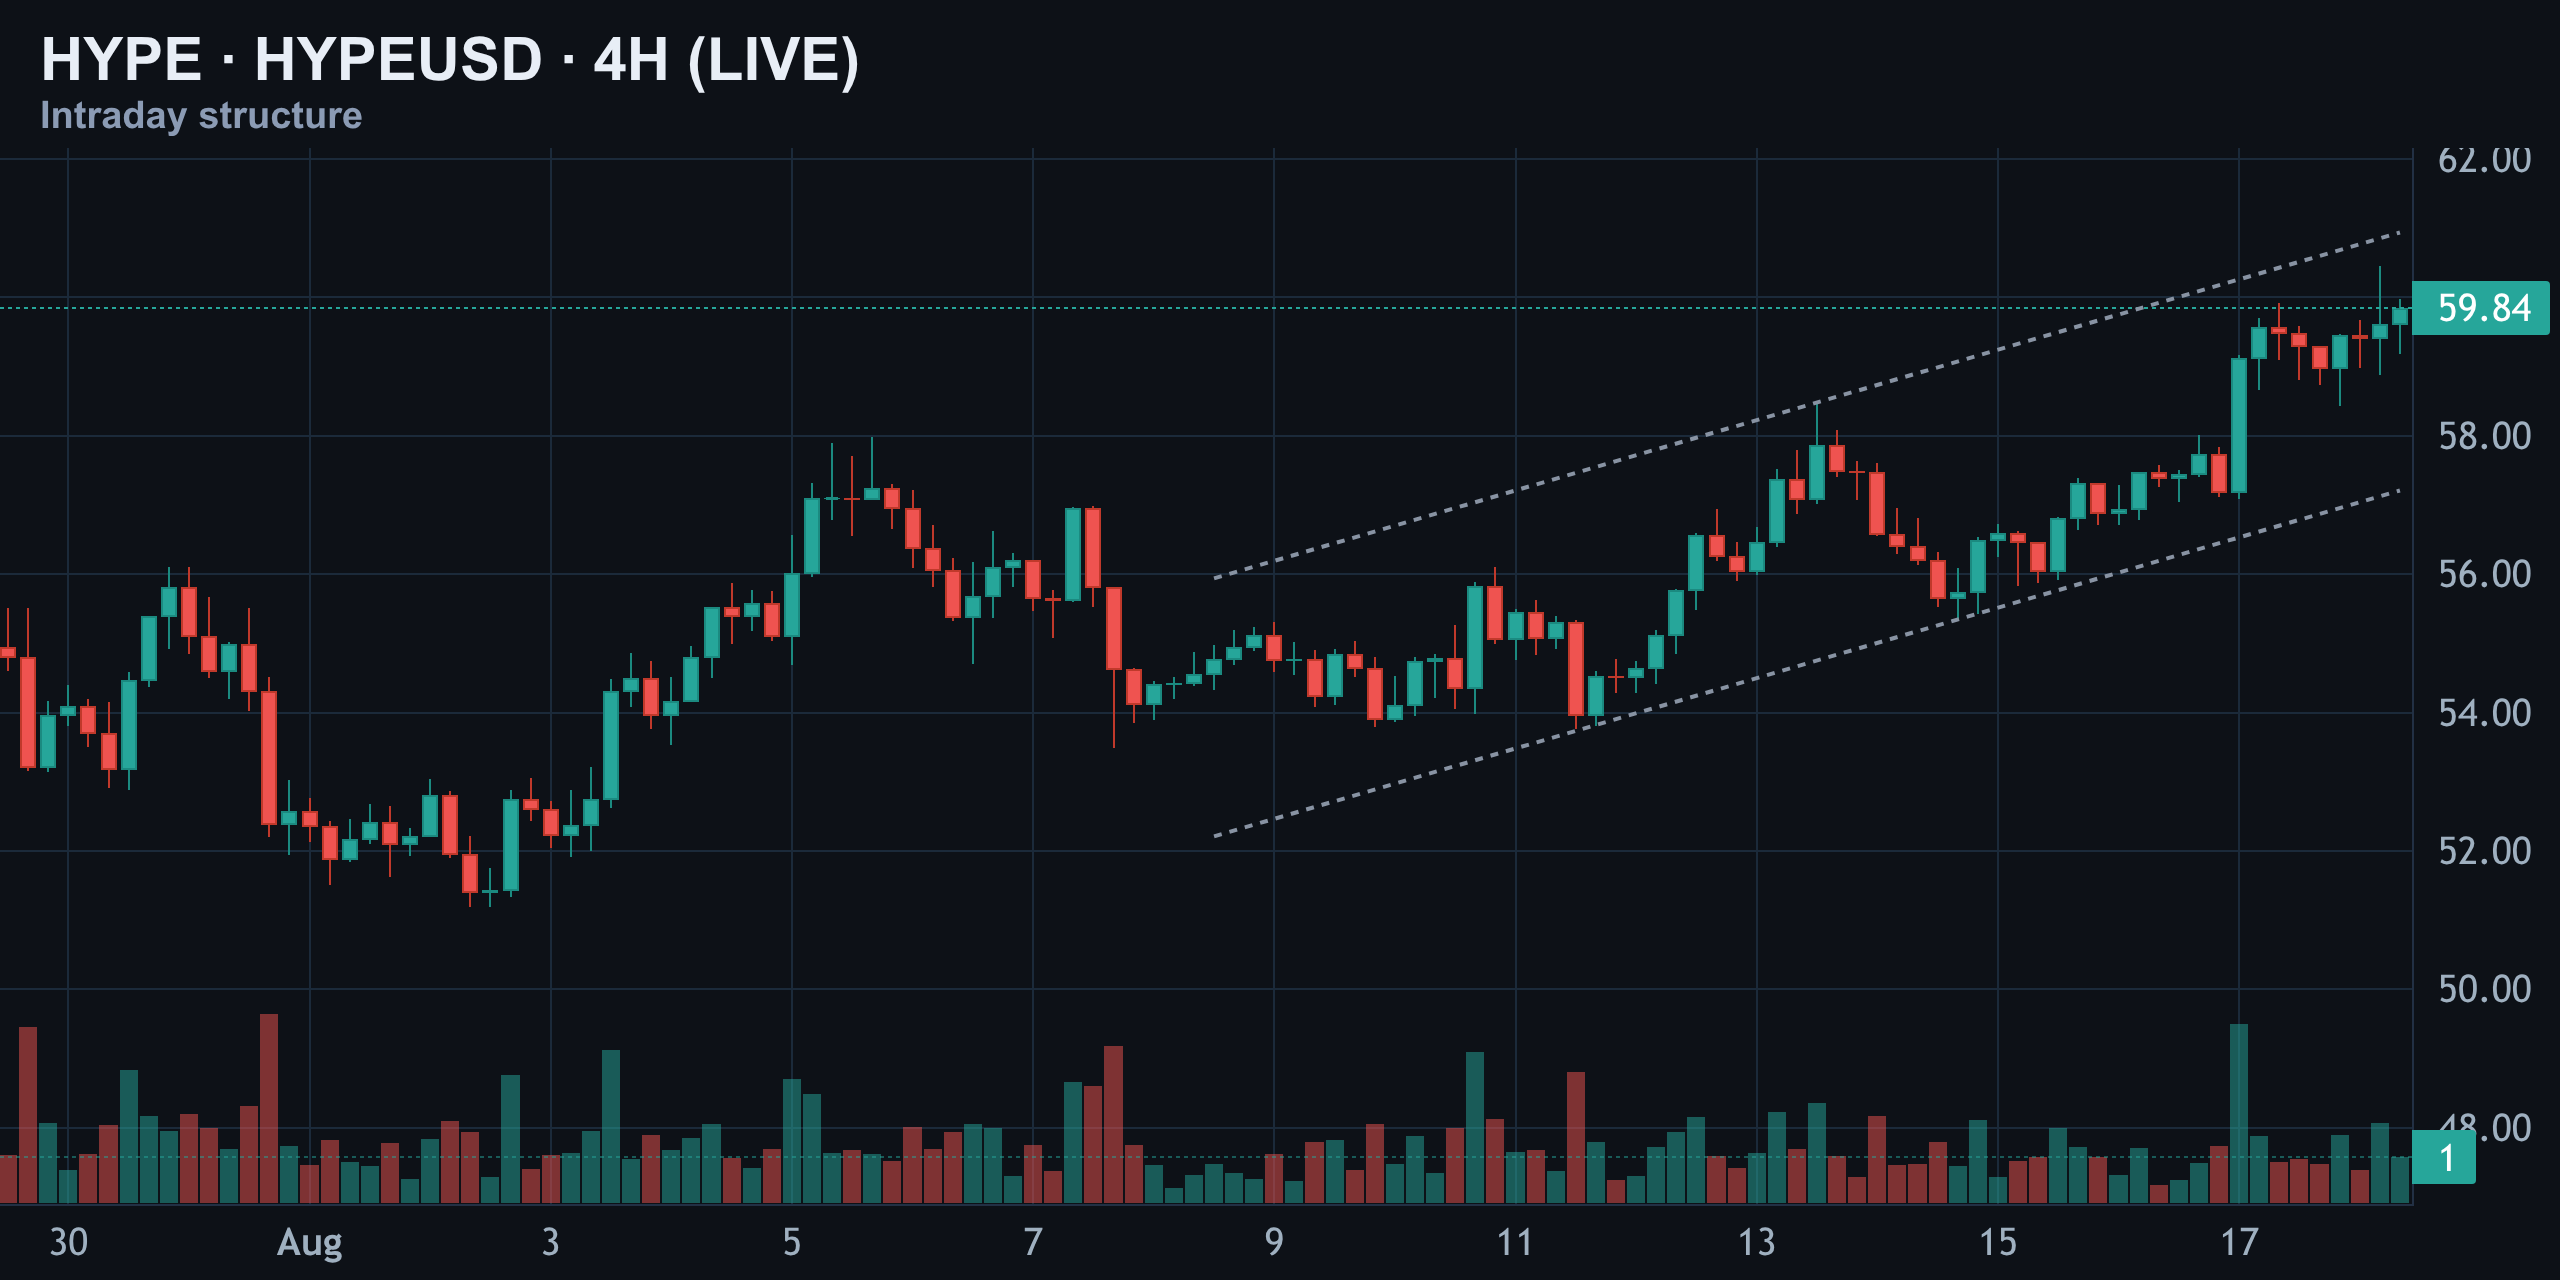
Step back to the four-hour chart and the bigger intraday picture gets clearer. HYPE has been carving higher lows since the August 11 low near $54, riding an ascending channel the whole way up. Price broke above the mid-$50s, punched through $58, and is now pressing the top rail of that channel near $59.84. Volume picked up meaningfully around the mid-August breakout candle — real participation, not a thin drift.
On the daily chart, HYPE is still working through the aftermath of June's blow-off top near $77, which capped the move and started a slow bleed toward the high $30s. Price found support, reclaimed the mid-$50s, and has now clawed back to $59.84 — right at a descending channel's underside.
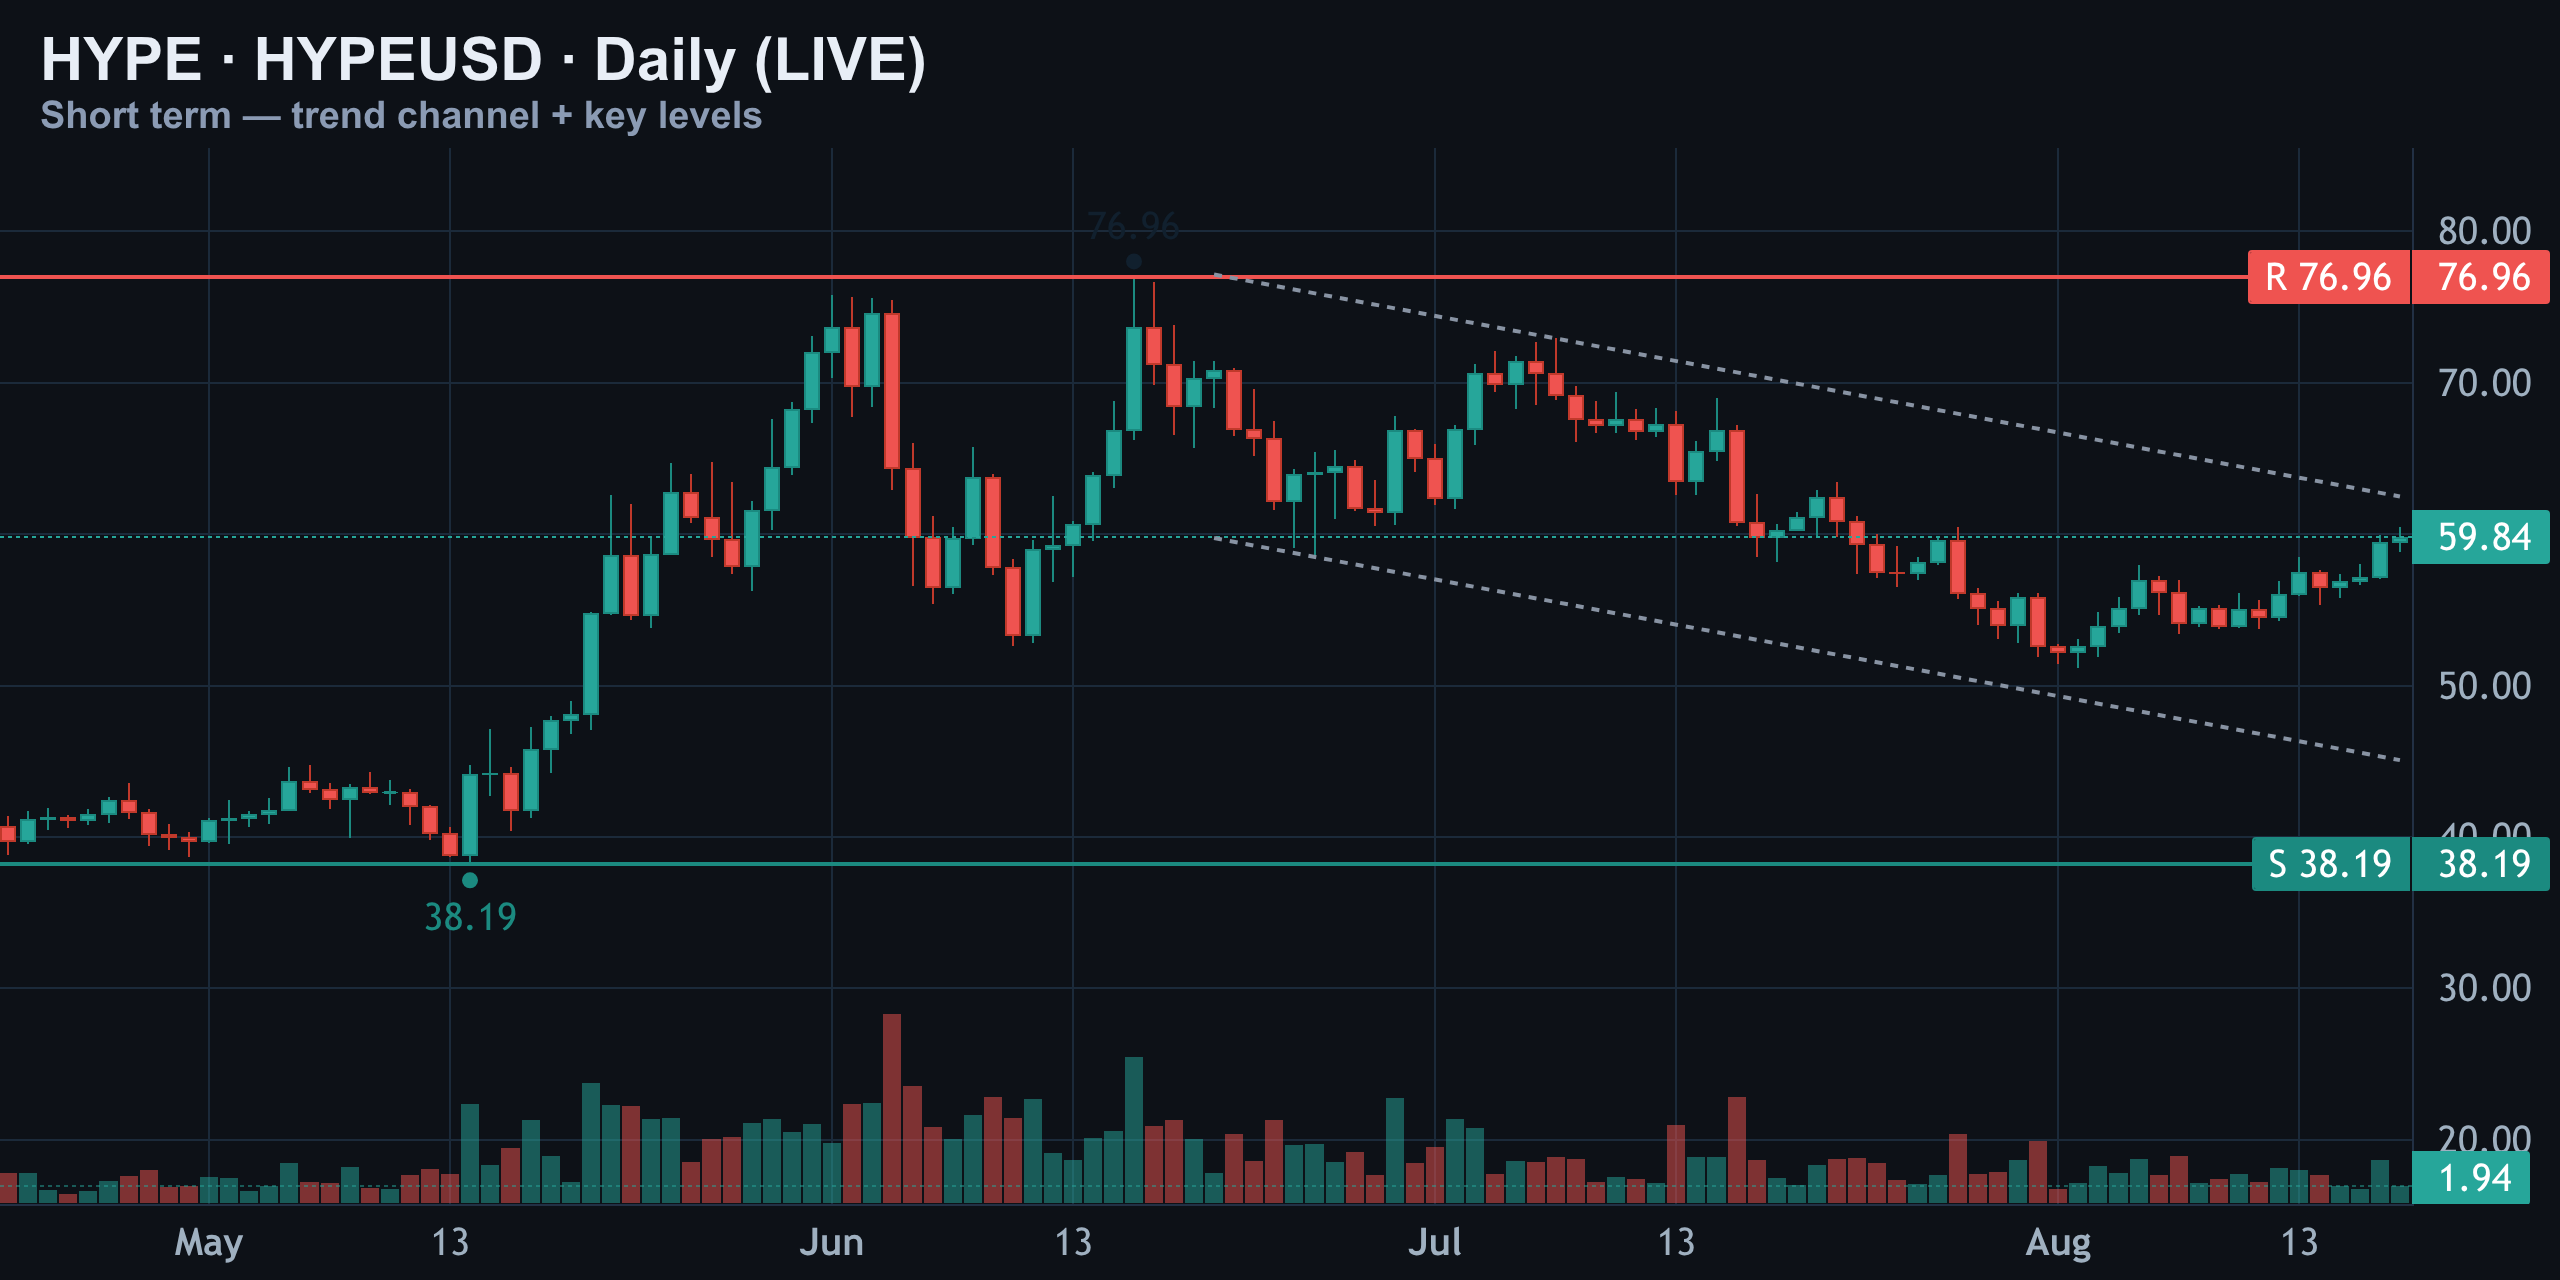
| Level | Price | Significance |
|---|---|---|
| Macro resistance | $76.96 | June blow-off top ceiling |
| Descending channel top | ~$59.84 | Current daily resistance |
| 4H channel top | ~$59.84 | Where the staircase is pressing now |
| Support | $38.19 | Macro guardrail, low probability today |
$76.96 above and $38.19 below are the wide macro guardrails, but they're not today's story. What matters right now is whether this bounce can clear that overhead channel line.
Momentum Check: RSI and MACD Say Improving, Not Overheated
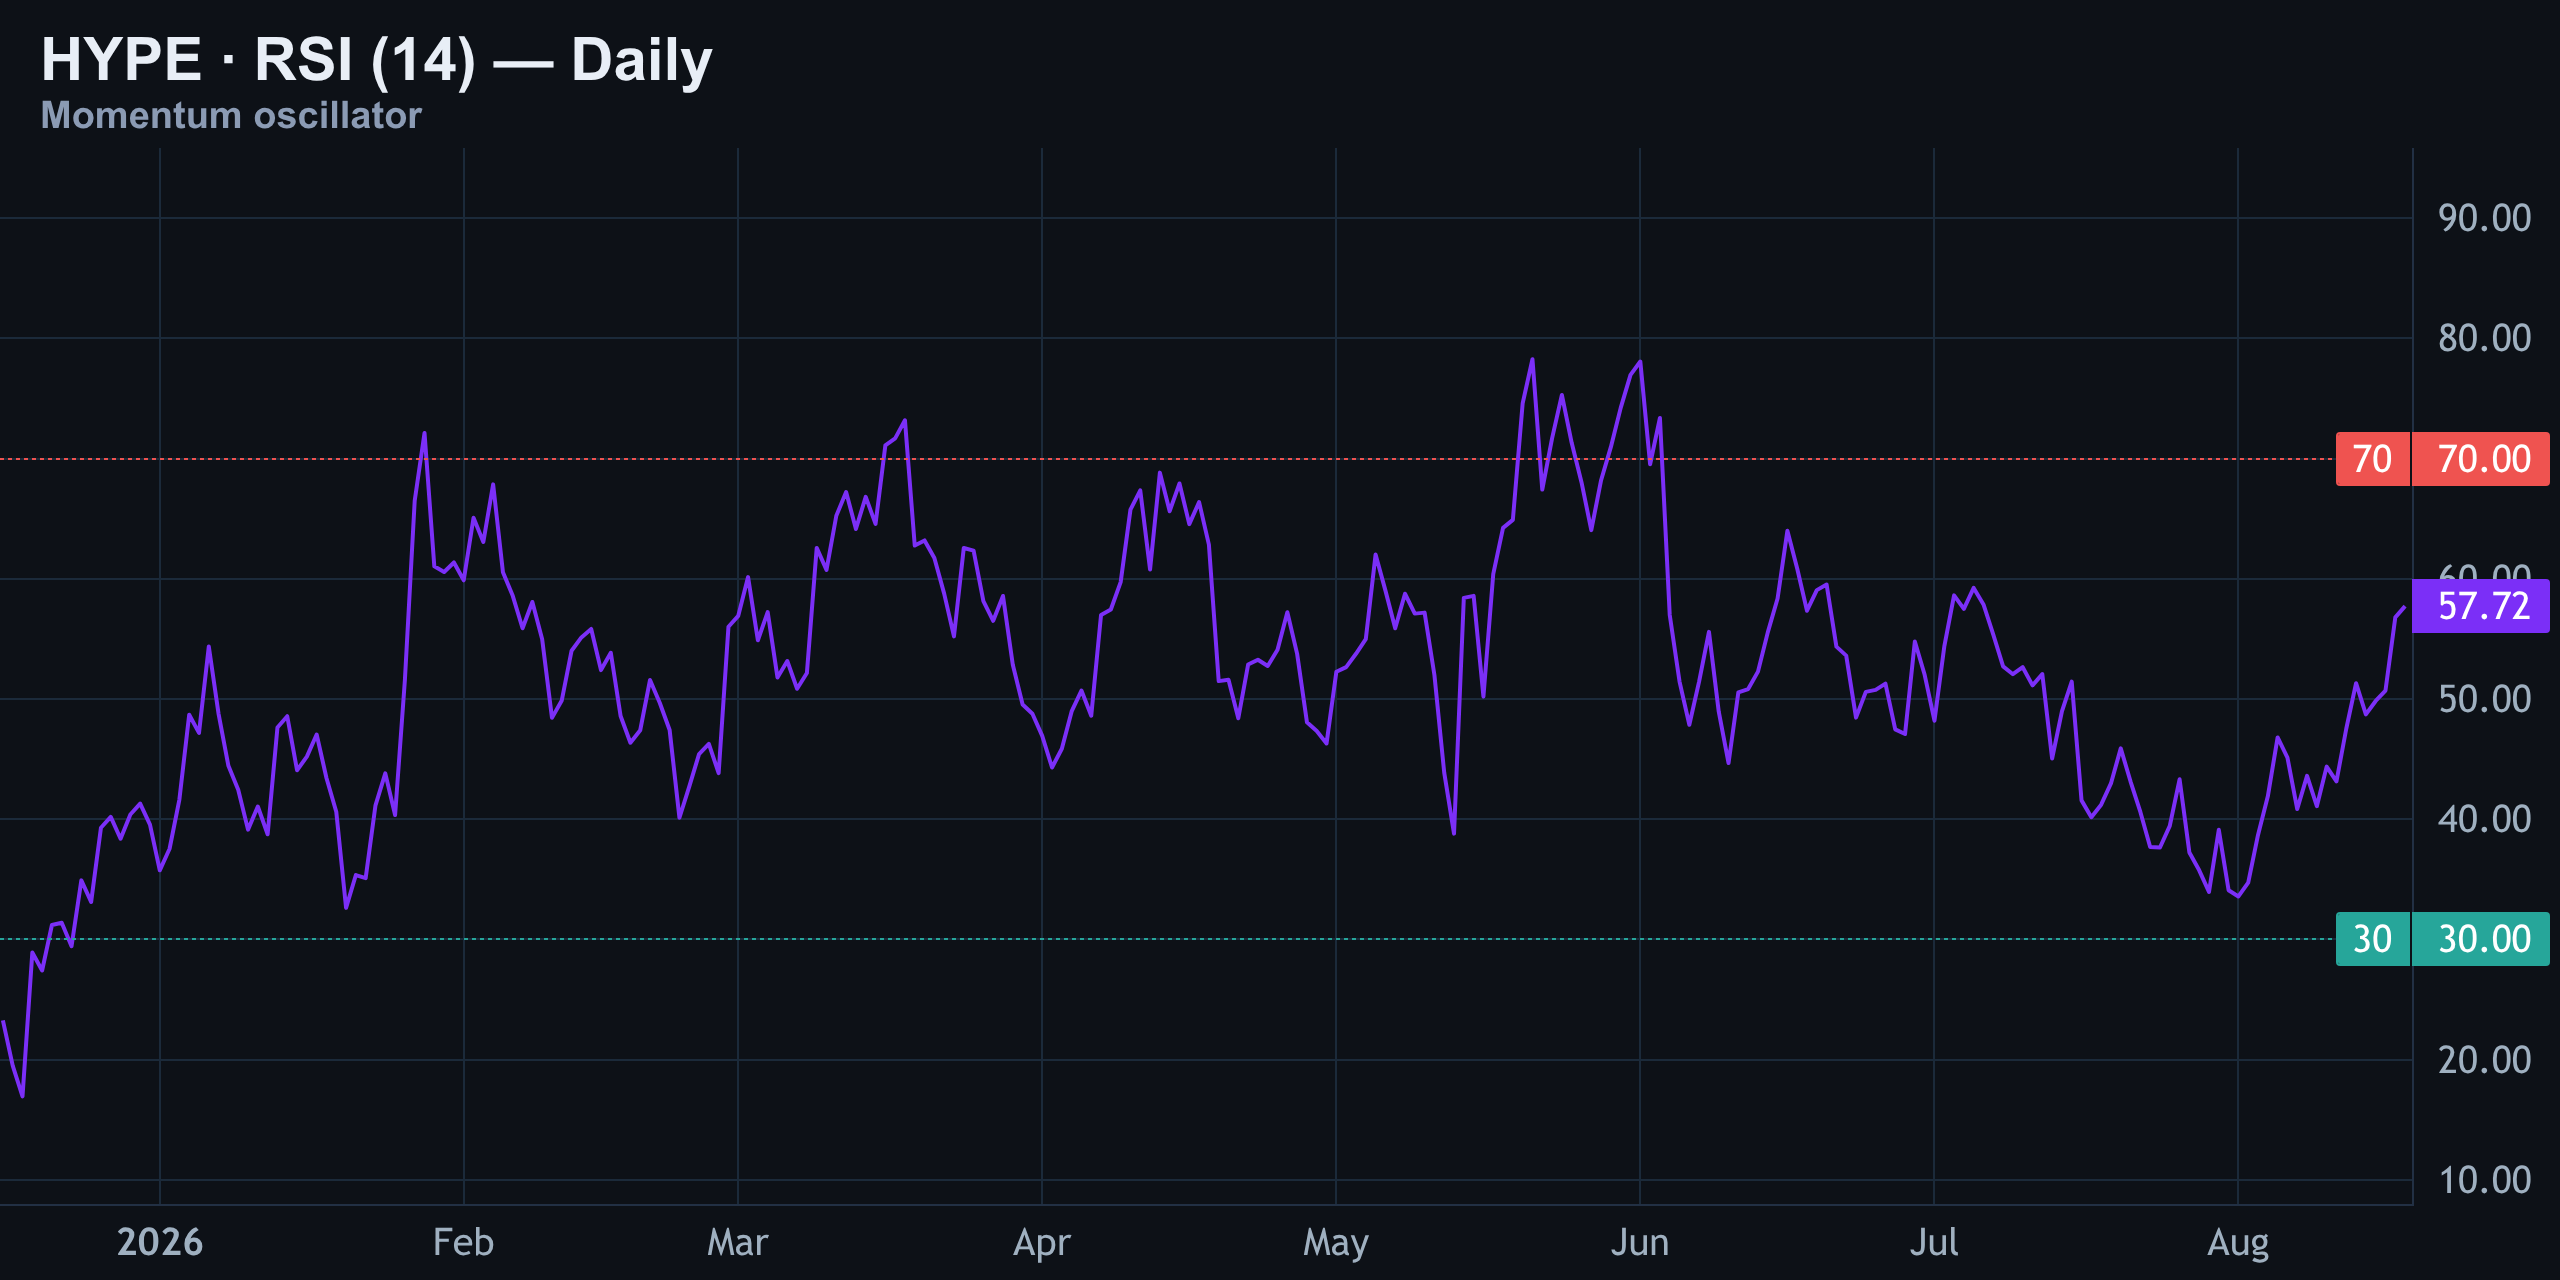
The Relative Strength Index on the daily is reading 58 — squarely neutral, nowhere near overbought and nowhere near oversold. That's actually constructive: RSI has been grinding higher off the low-40s from early August without any sign of bearish divergence against price. There's meaningful room left before this indicator flags exhaustion near 70, the same zone that capped rallies back in late May and early June.
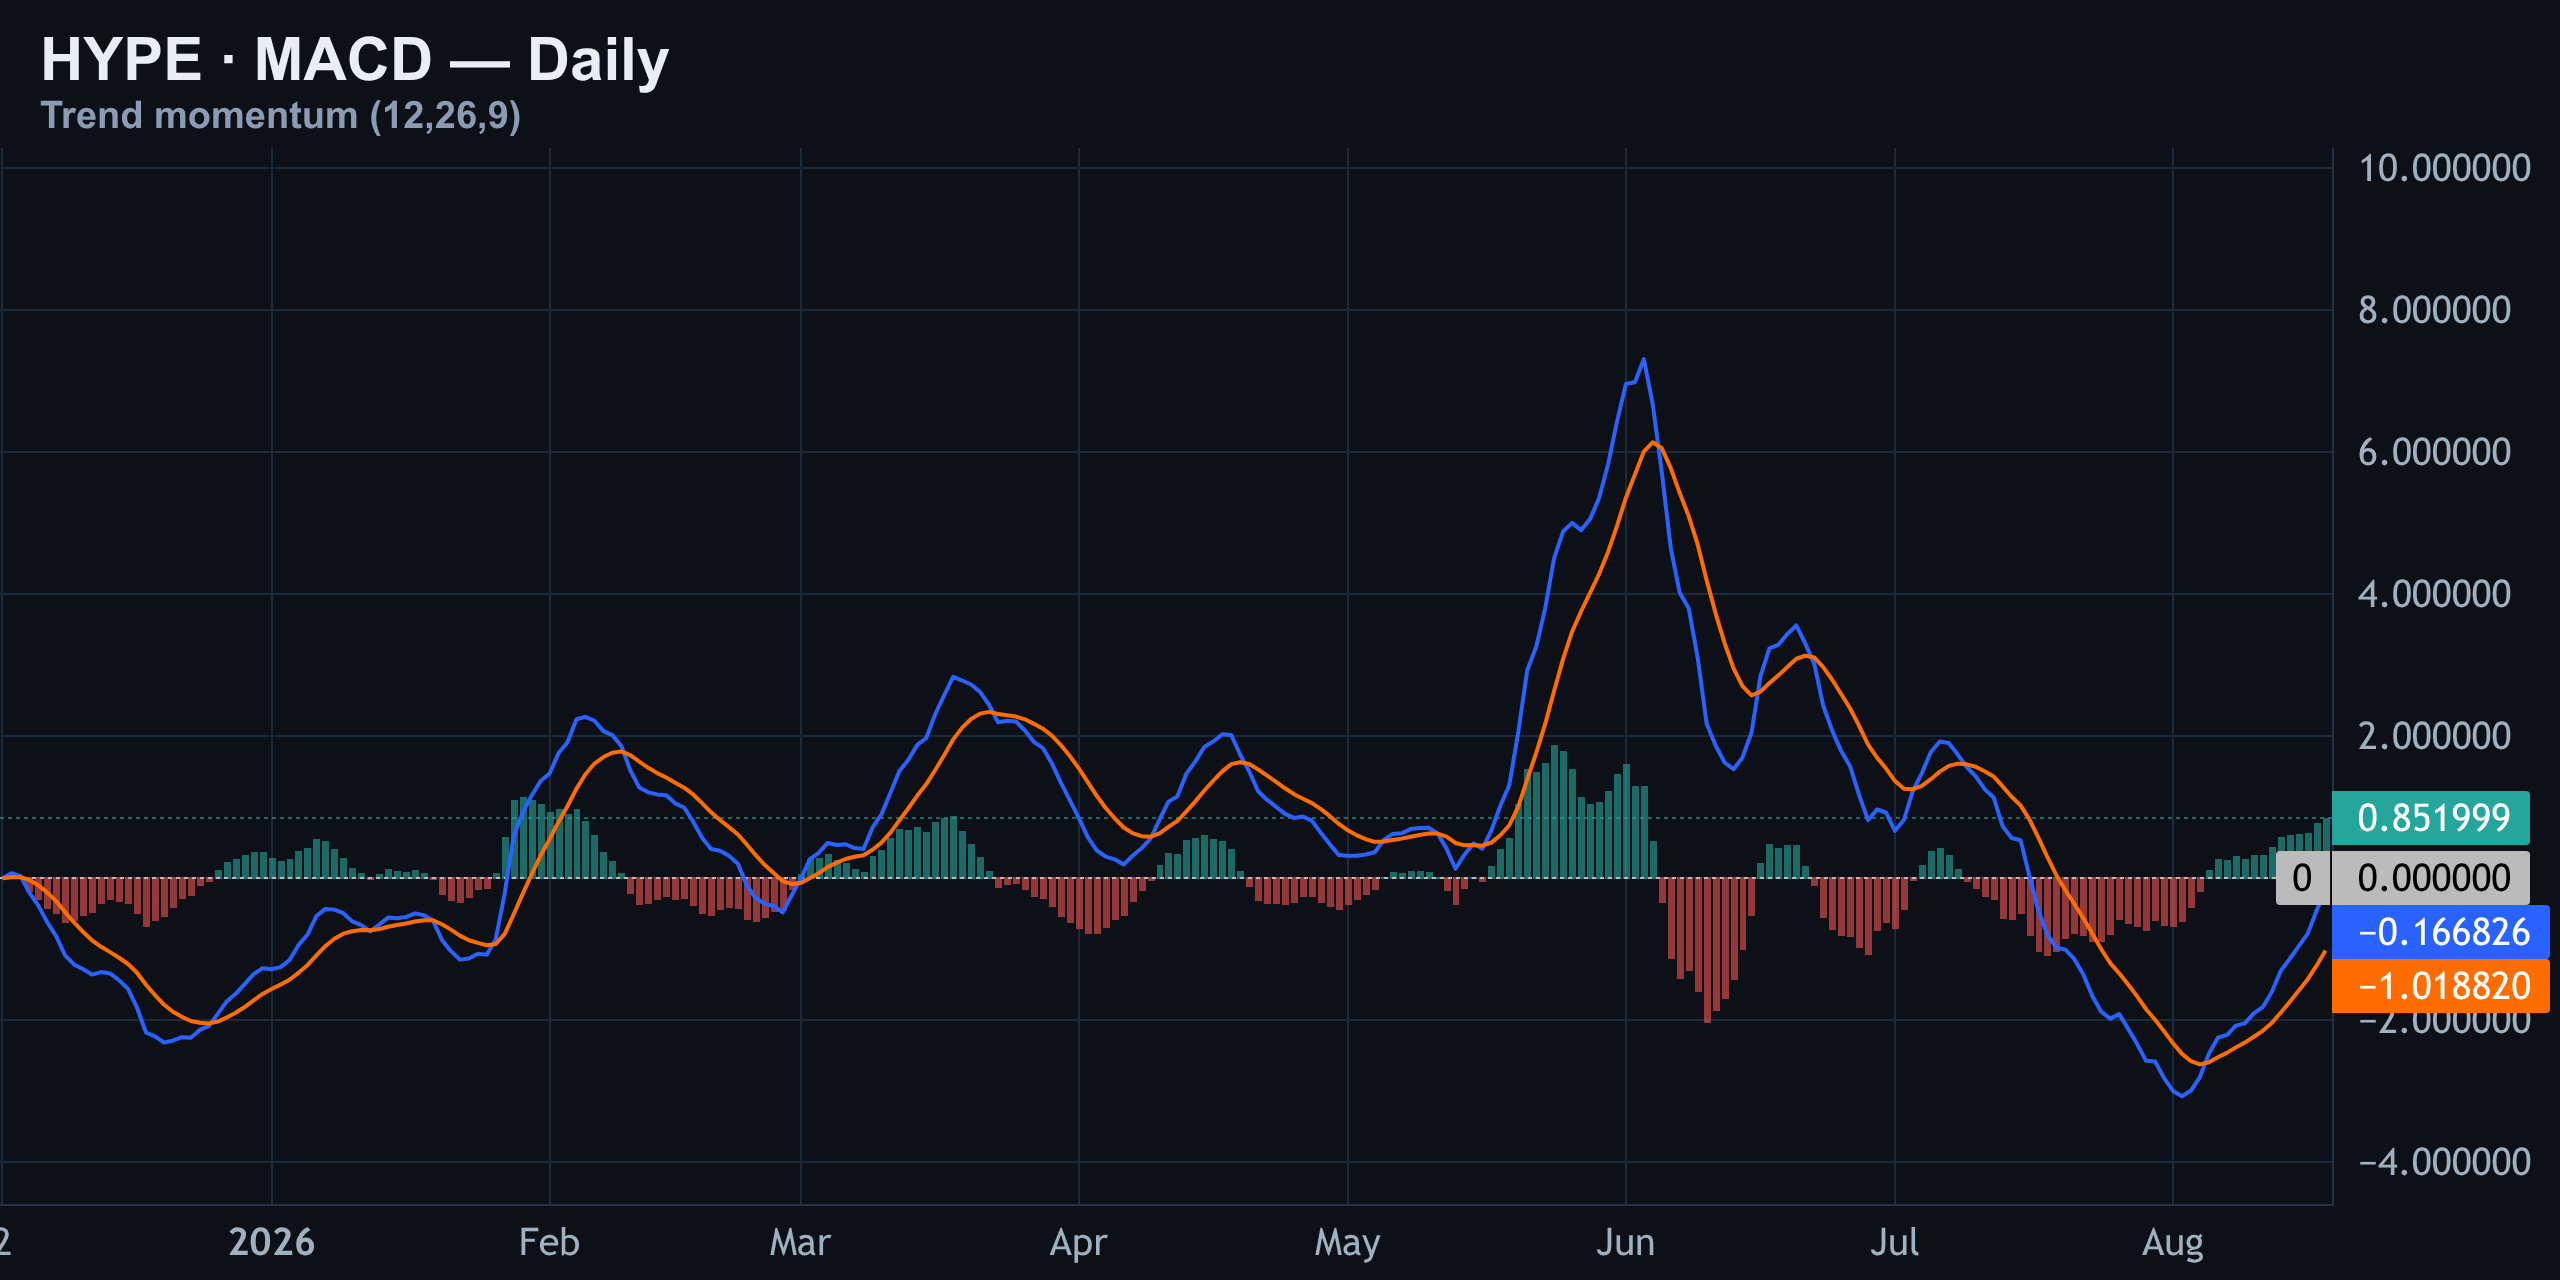
MACD just delivered a fresh signal-line cross to the upside, with the histogram flipping from red to green for the first time in about a week. The MACD line sits just above its signal, both still below the zero line — meaning this is an early-stage momentum shift, not a confirmed trend reversal yet. Compare that to June's spike, when the histogram ran far hotter on a much sharper rally. This cross is modest by comparison, which fits a market that's recovering, not exploding.
The $60 Flip: Where Dealer Hedging Turns From Calm to Violent
This is the heart of today's setup. The line in the sand is $60 — the zero-gamma flip where dealer hedging turns destabilizing. Above that, a gamma wall stacks resistance near $62, while gamma support sits down at $55.
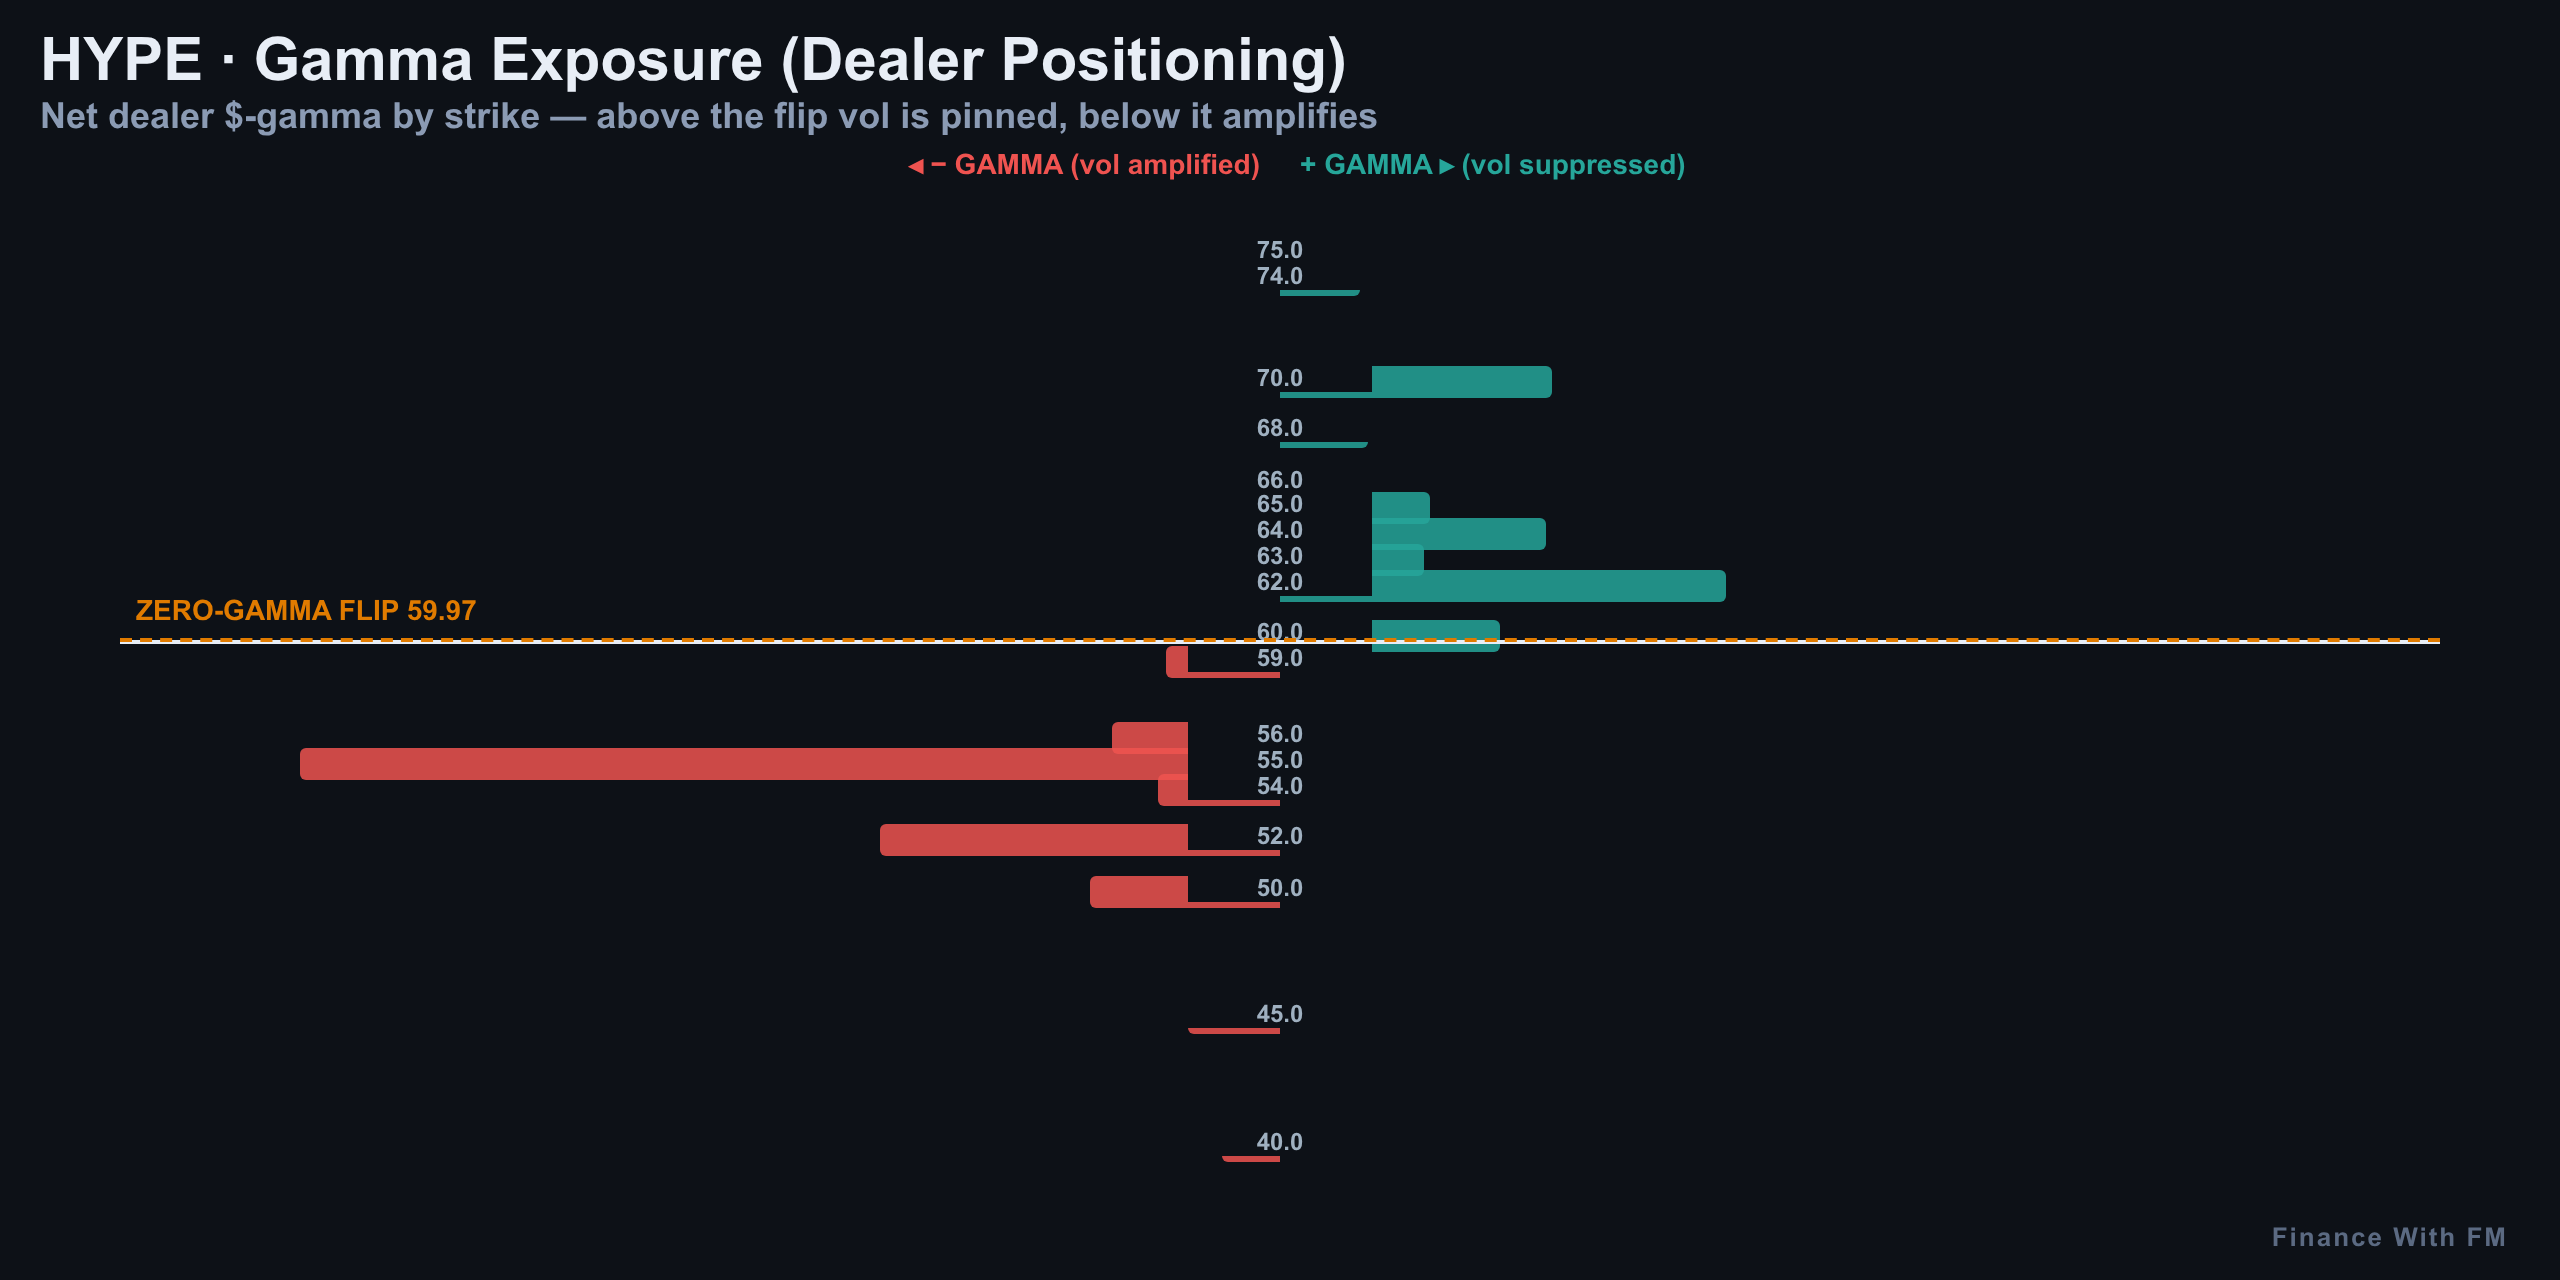
| Zone | Level | What It Means |
|---|---|---|
| Gamma wall (resistance) | $62 | Heaviest overhead dealer positioning |
| Zero-gamma flip | $60 | +0.2% from spot — the trigger for everything |
| Spot | $59.91 | Currently in negative gamma |
| Gamma support | $55 | Where dealer hedging stabilizes again |
| Liquidation pool | $57 / $59 / $53.88 | Clustered leveraged positions below spot |
Spot is currently in negative gamma — volatility is amplified here, meaning moves accelerate and breakouts or breakdowns tend to run further than usual. Hold above the $60 flip and volatility stays pinned; lose it and moves get violent. Net dealer gamma is roughly flat per 1% move right now, which is exactly why price feels like it's coiling rather than trending.
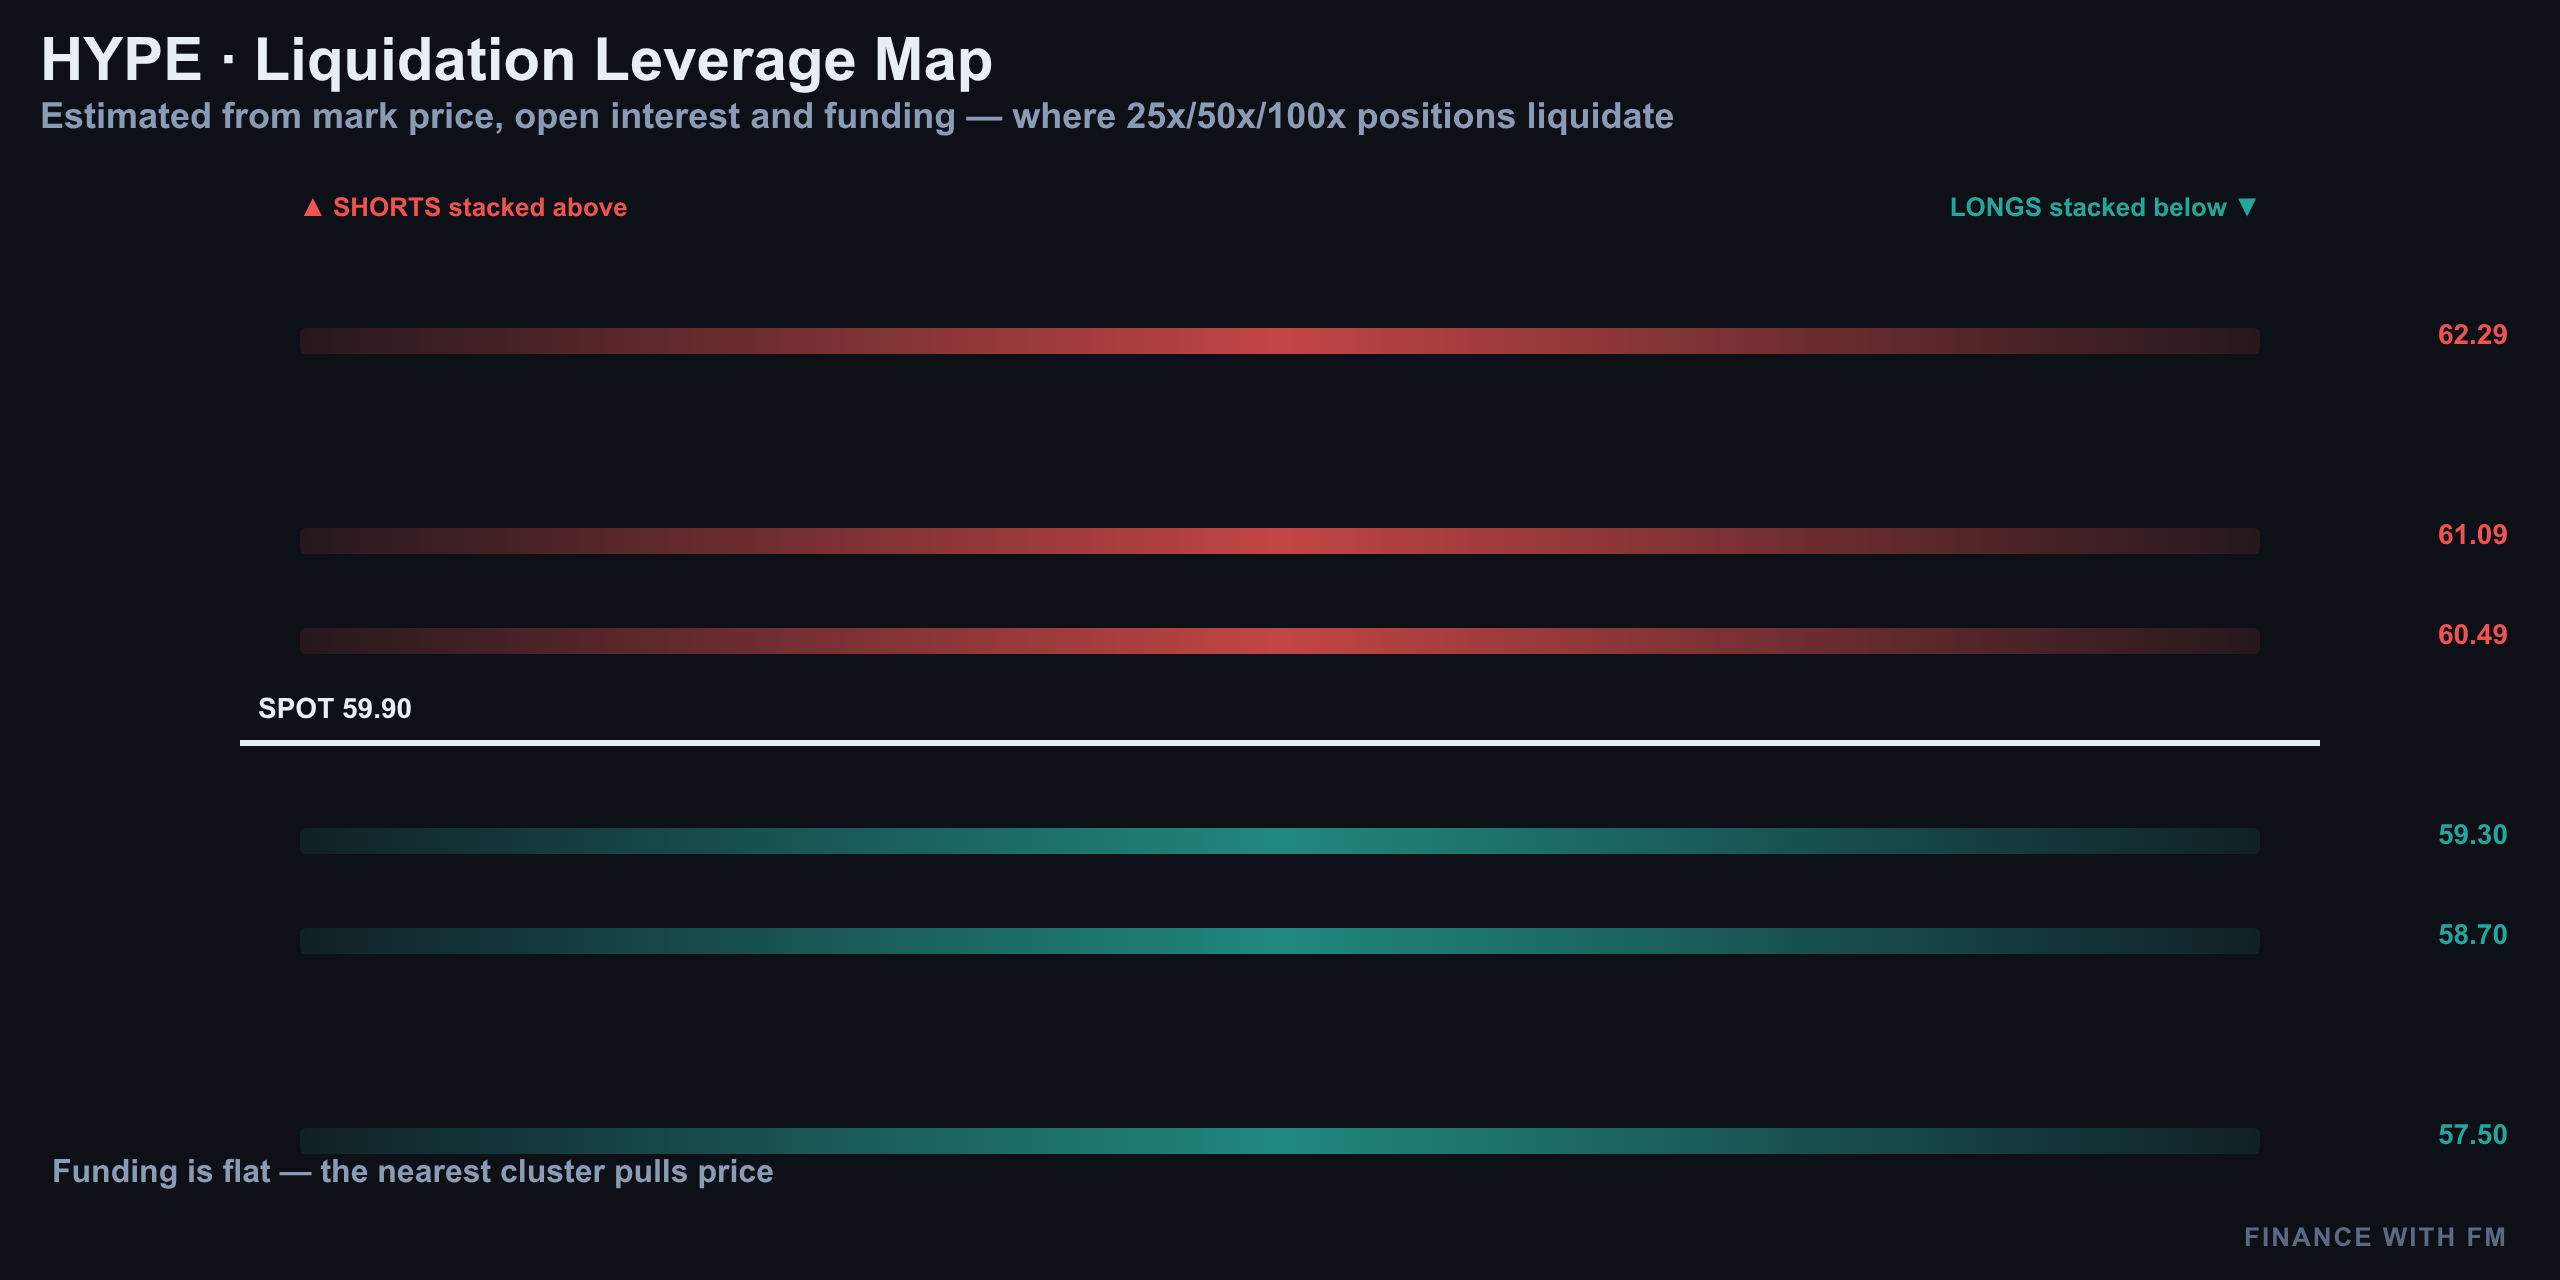
Below spot, liquidation pools cluster near $57, $59, and the well-fought $53.88 zone. Any sharp move down through $59 risks cascading into that liquidity, which is one reason dealers are watching this so closely.
Options Are Pricing Calm — But the Tails Are Wide
Options are pricing a one-sigma range of $58 to $62 into this week's expiry, with $56 to $64 as the wide two-sigma tail. ATM implied vol sits at 53% — elevated by traditional-market standards, but unremarkable for a mid-cap crypto token.
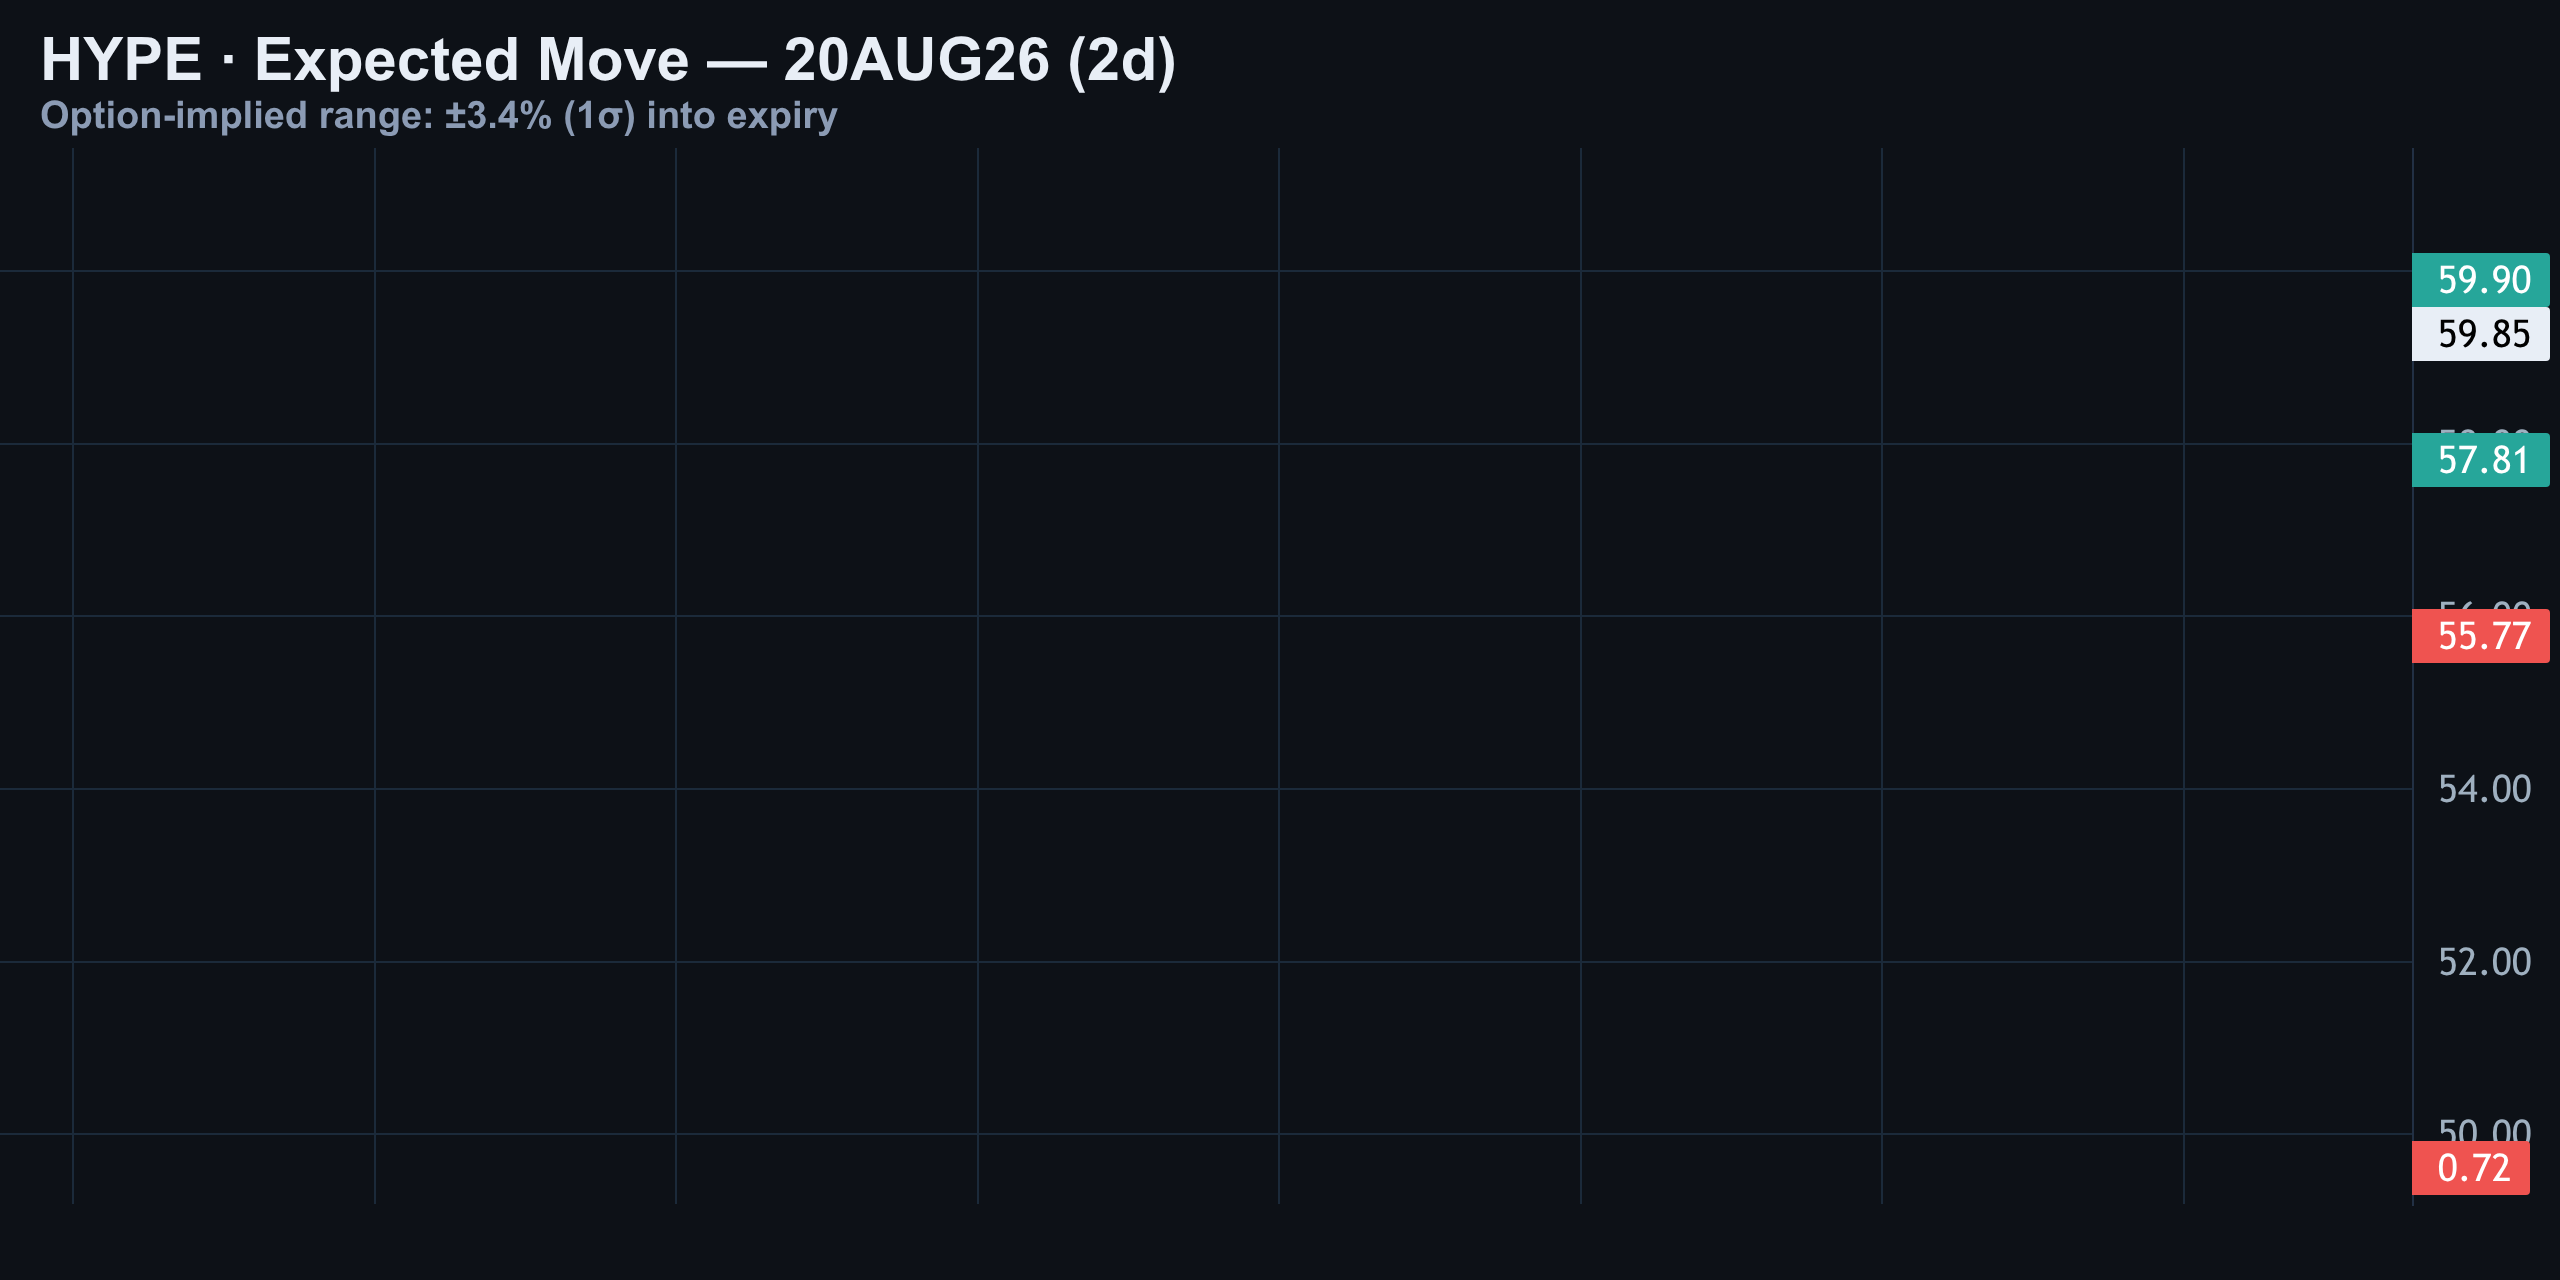
| Confidence Band | Range | Move From Spot |
|---|---|---|
| One-sigma (~68% odds) | $58 – $62 | ±3.4% |
| Two-sigma (~95% odds) | $56 – $64 | ±7%+ |
Trades that target inside the one-sigma band are high-probability plays; betting on a break beyond the two-sigma tail is the low-odds bet nobody should be sizing up on. The options market, in short, is pricing this like nothing dramatic is about to happen — which lines up with the tight, negative-gamma coil we're seeing in price.
Positioning: Retail and Smart Money Agree — Which Is the Problem
Retail accounts are net long at 1.32, while top traders are net long at 1.41 — they're aligned. That's rare, and it cuts both ways: when everyone leans the same direction, positioning alone stops being a useful contrarian signal. Historically, crowded one-sided books like this either resolve in a violent squeeze in the crowd's favor, or a sharp flush that catches both sides offside at once.
That's exactly why the desk isn't leaning on sentiment today. With options pricing calm, gamma sitting negative just below $60, and momentum improving but unconfirmed, there's no edge in following the crowd here.
Today's Verdict: No Clean 1:2.5 Trade — Standing Aside Again
Every piece of this setup — the 15-minute channel, the 4-hour staircase, the daily descending ceiling, RSI, MACD, gamma, and options pricing — points to the same conclusion: HYPE is coiled just under a decision point, but nothing here offers a clean risk-to-reward trade of at least 1:2.5 right now.
- Bullish trigger: A confirmed close above $60 with volume, opening a path toward the $62 gamma wall.
- Bearish trigger: A breakdown through the 15-minute channel floor near $58.50, risking a slide into the $57 liquidation pool.
- Invalidation for longs: Loss of the $55 gamma support zone flips the broader structure bearish.
- Kill level for today's trade: A fast reclaim-and-reject of $60 within the same session — that whipsaw kills any directional bet before it can work.
Until one of those triggers fires with conviction, the highest-probability move is patience. That's twice in two days the disciplined call has been to sit out — and twice in two days, price has proven there was nothing worth chasing.
08/17/2026 — HYPE Pulse Aug 17: Reclaims $59, $60 Guards the Move
HYPE Pulse Aug 17: Reclaims $59, $60 Guards the Move
Where We Left It: From Stand-Aside to a Real Breakout
Yesterday's call on HYPE was simple: stand aside. Price was stuck at $57.24, caught in no-man's-land between the 50-day and 200-day moving averages, and there was no clean setup worth forcing. That wasn't indecision — it was discipline. Sometimes the highest-probability trade is the one you don't take.
That patience just paid off in the way it's supposed to. Since that update, HYPE has ripped roughly 4% to trade around $59.60. Nobody got stopped out of a bad entry, because there was no entry to stop out — the market simply moved on its own terms and confirmed that waiting was the right call. The question now is whether this is the start of something real, or a fast move into a wall that stops it cold.
HYPE Right Now: A Real Reclaim, Stalling at the Worst Possible Spot
HYPE is trading around $59.60, up about 4% on the day. That's a legitimate reclaim of short-term structure — but the timing is almost comedic. Price is stalling exactly at the zero-gamma flip near $60, the level where dealer hedging behavior flips from calming price action to amplifying it.
Momentum backs the move without being euphoric. RSI is sitting near 57, MACD just turned positive. That combination reads as neutral leaning bullish — the trend is improving, but it hasn't fully earned a green light yet.
| Metric | Reading |
|---|---|
| Current price | ≈ $59.60 |
| 24h change | +4% |
| RSI (14) | 57 (neutral) |
| MACD | Bullish cross, histogram positive |
| Bias | Neutral leaning bullish |
15-Minute Intraday: Ascending Channel Intact
Zoom into the 15-minute chart and the story is refreshingly clean: one uninterrupted uptrend. HYPE based around $57 overnight, then broke a rising channel twice — once heading into evening trade, again into this morning's session — with each leg printing higher lows.
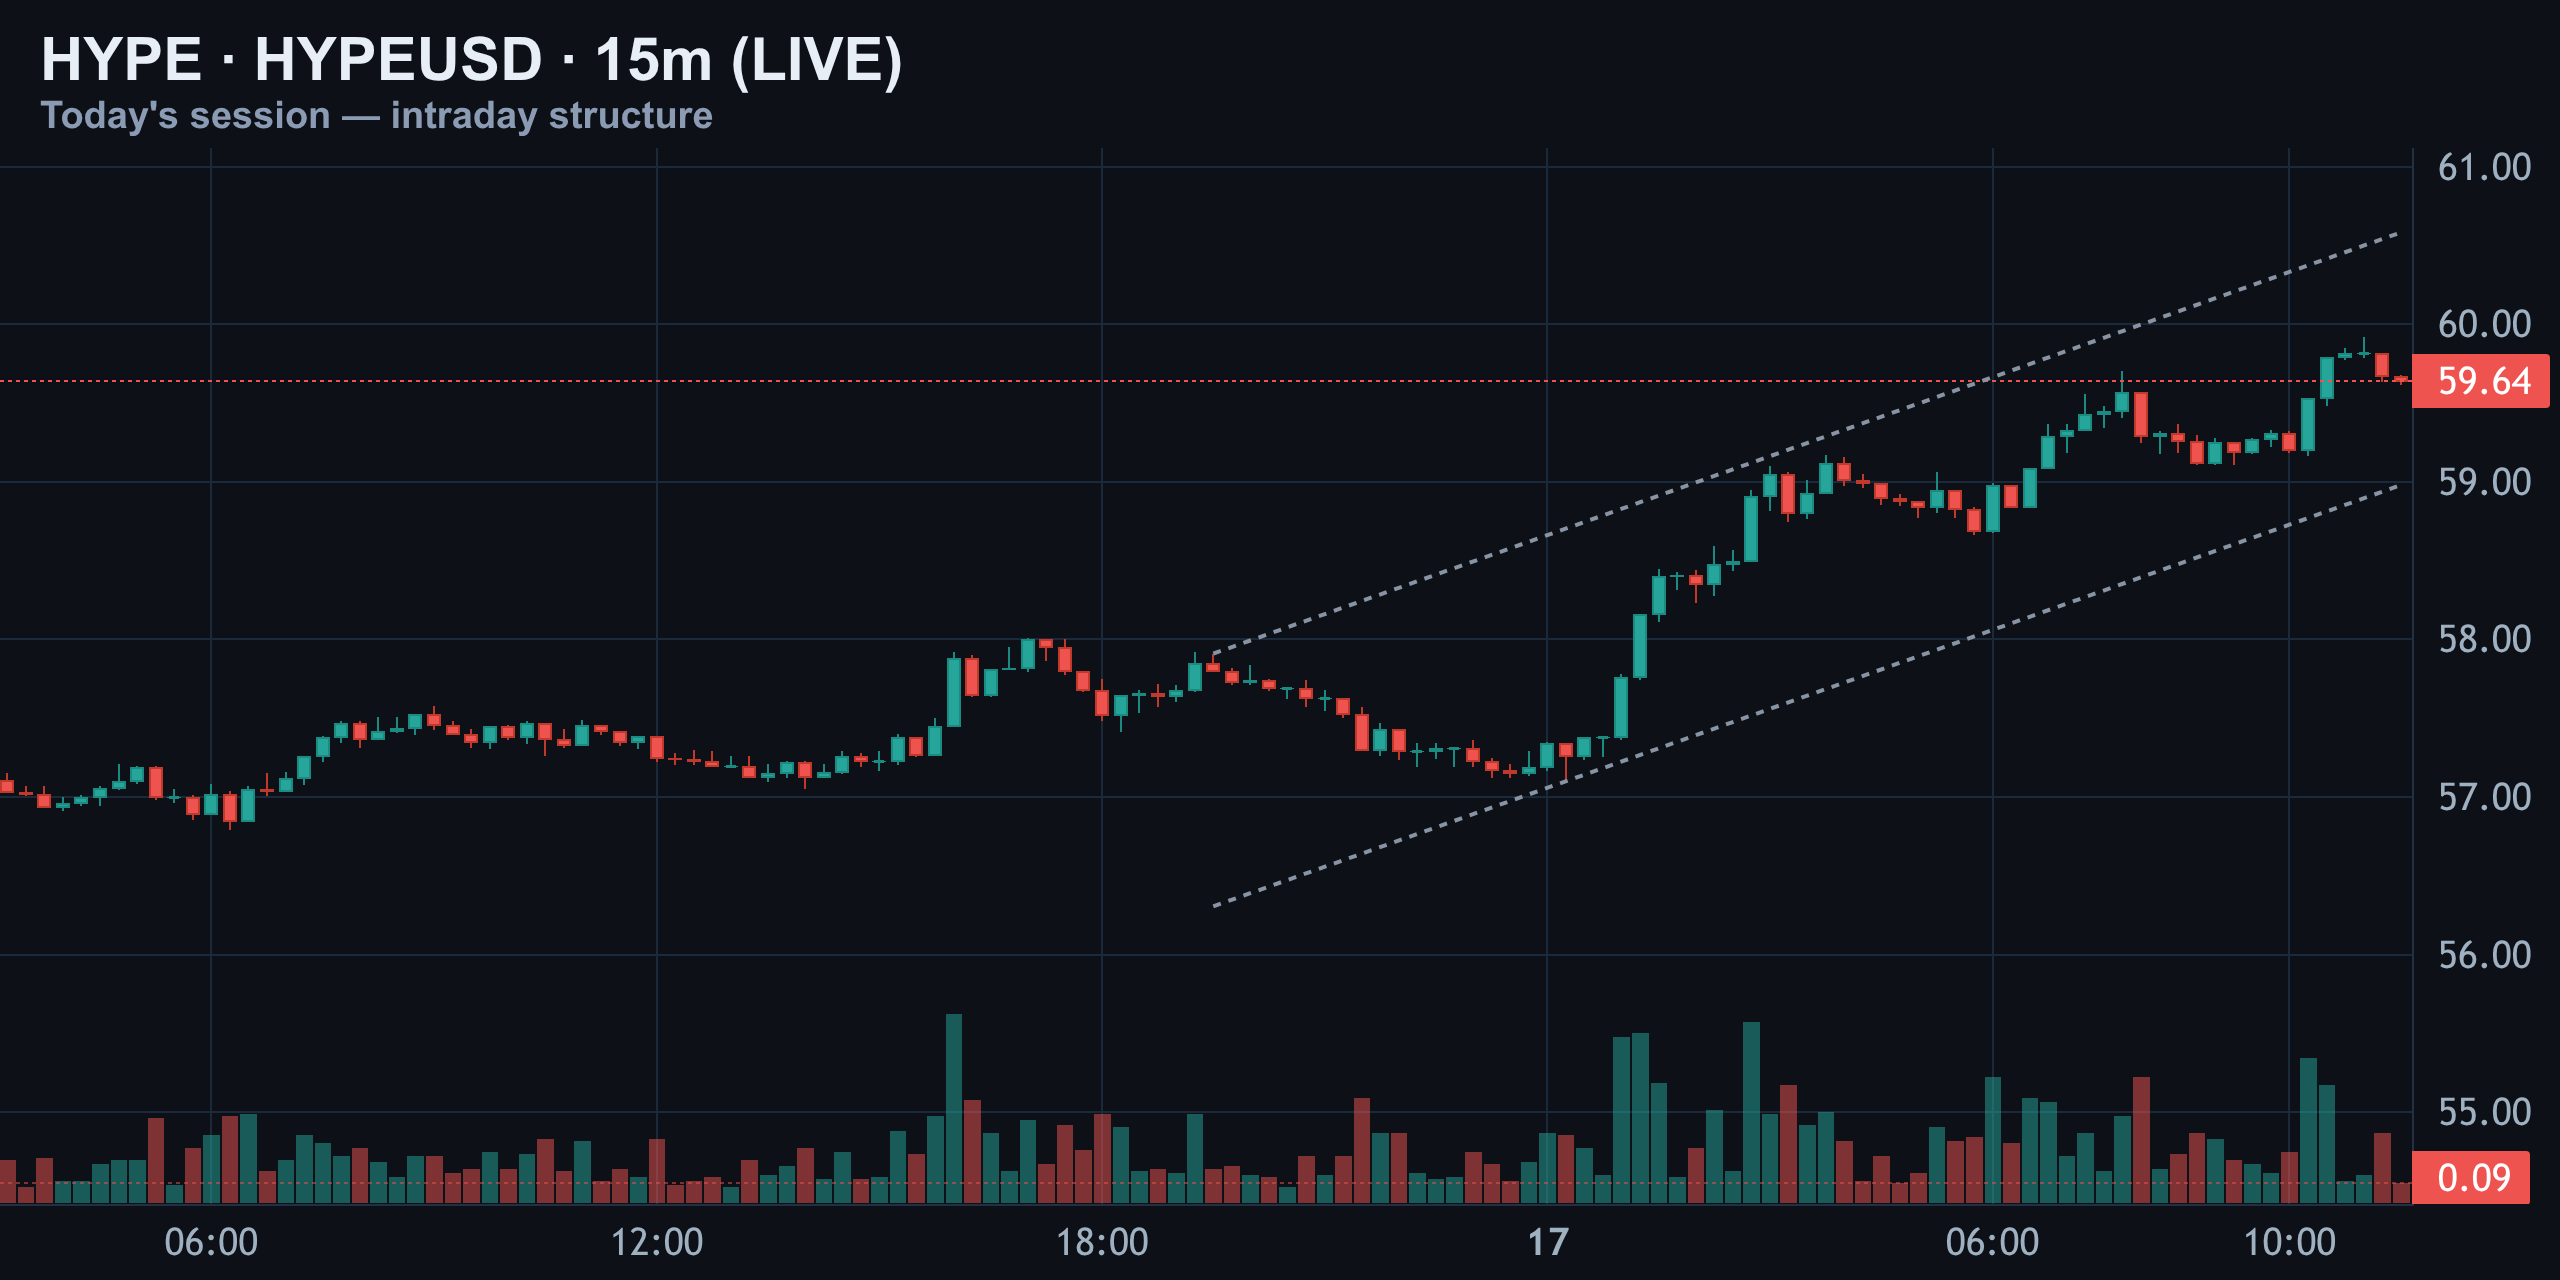
Right now, price is stalling at $59.64, sitting right on the top rail of that channel. The tell that matters here is volume: both breakout candles came on a sharp pickup in volume, which is the signature of real flow pushing the move — not a low-conviction drift higher.
4-Hour Structure: Breaking Out of the Range
This is, without exaggeration, the cleanest chart of the week. HYPE bottomed near $52 in early August, then built a textbook rising channel — higher lows, higher highs — all the way to today's breakout candle at $59.63.
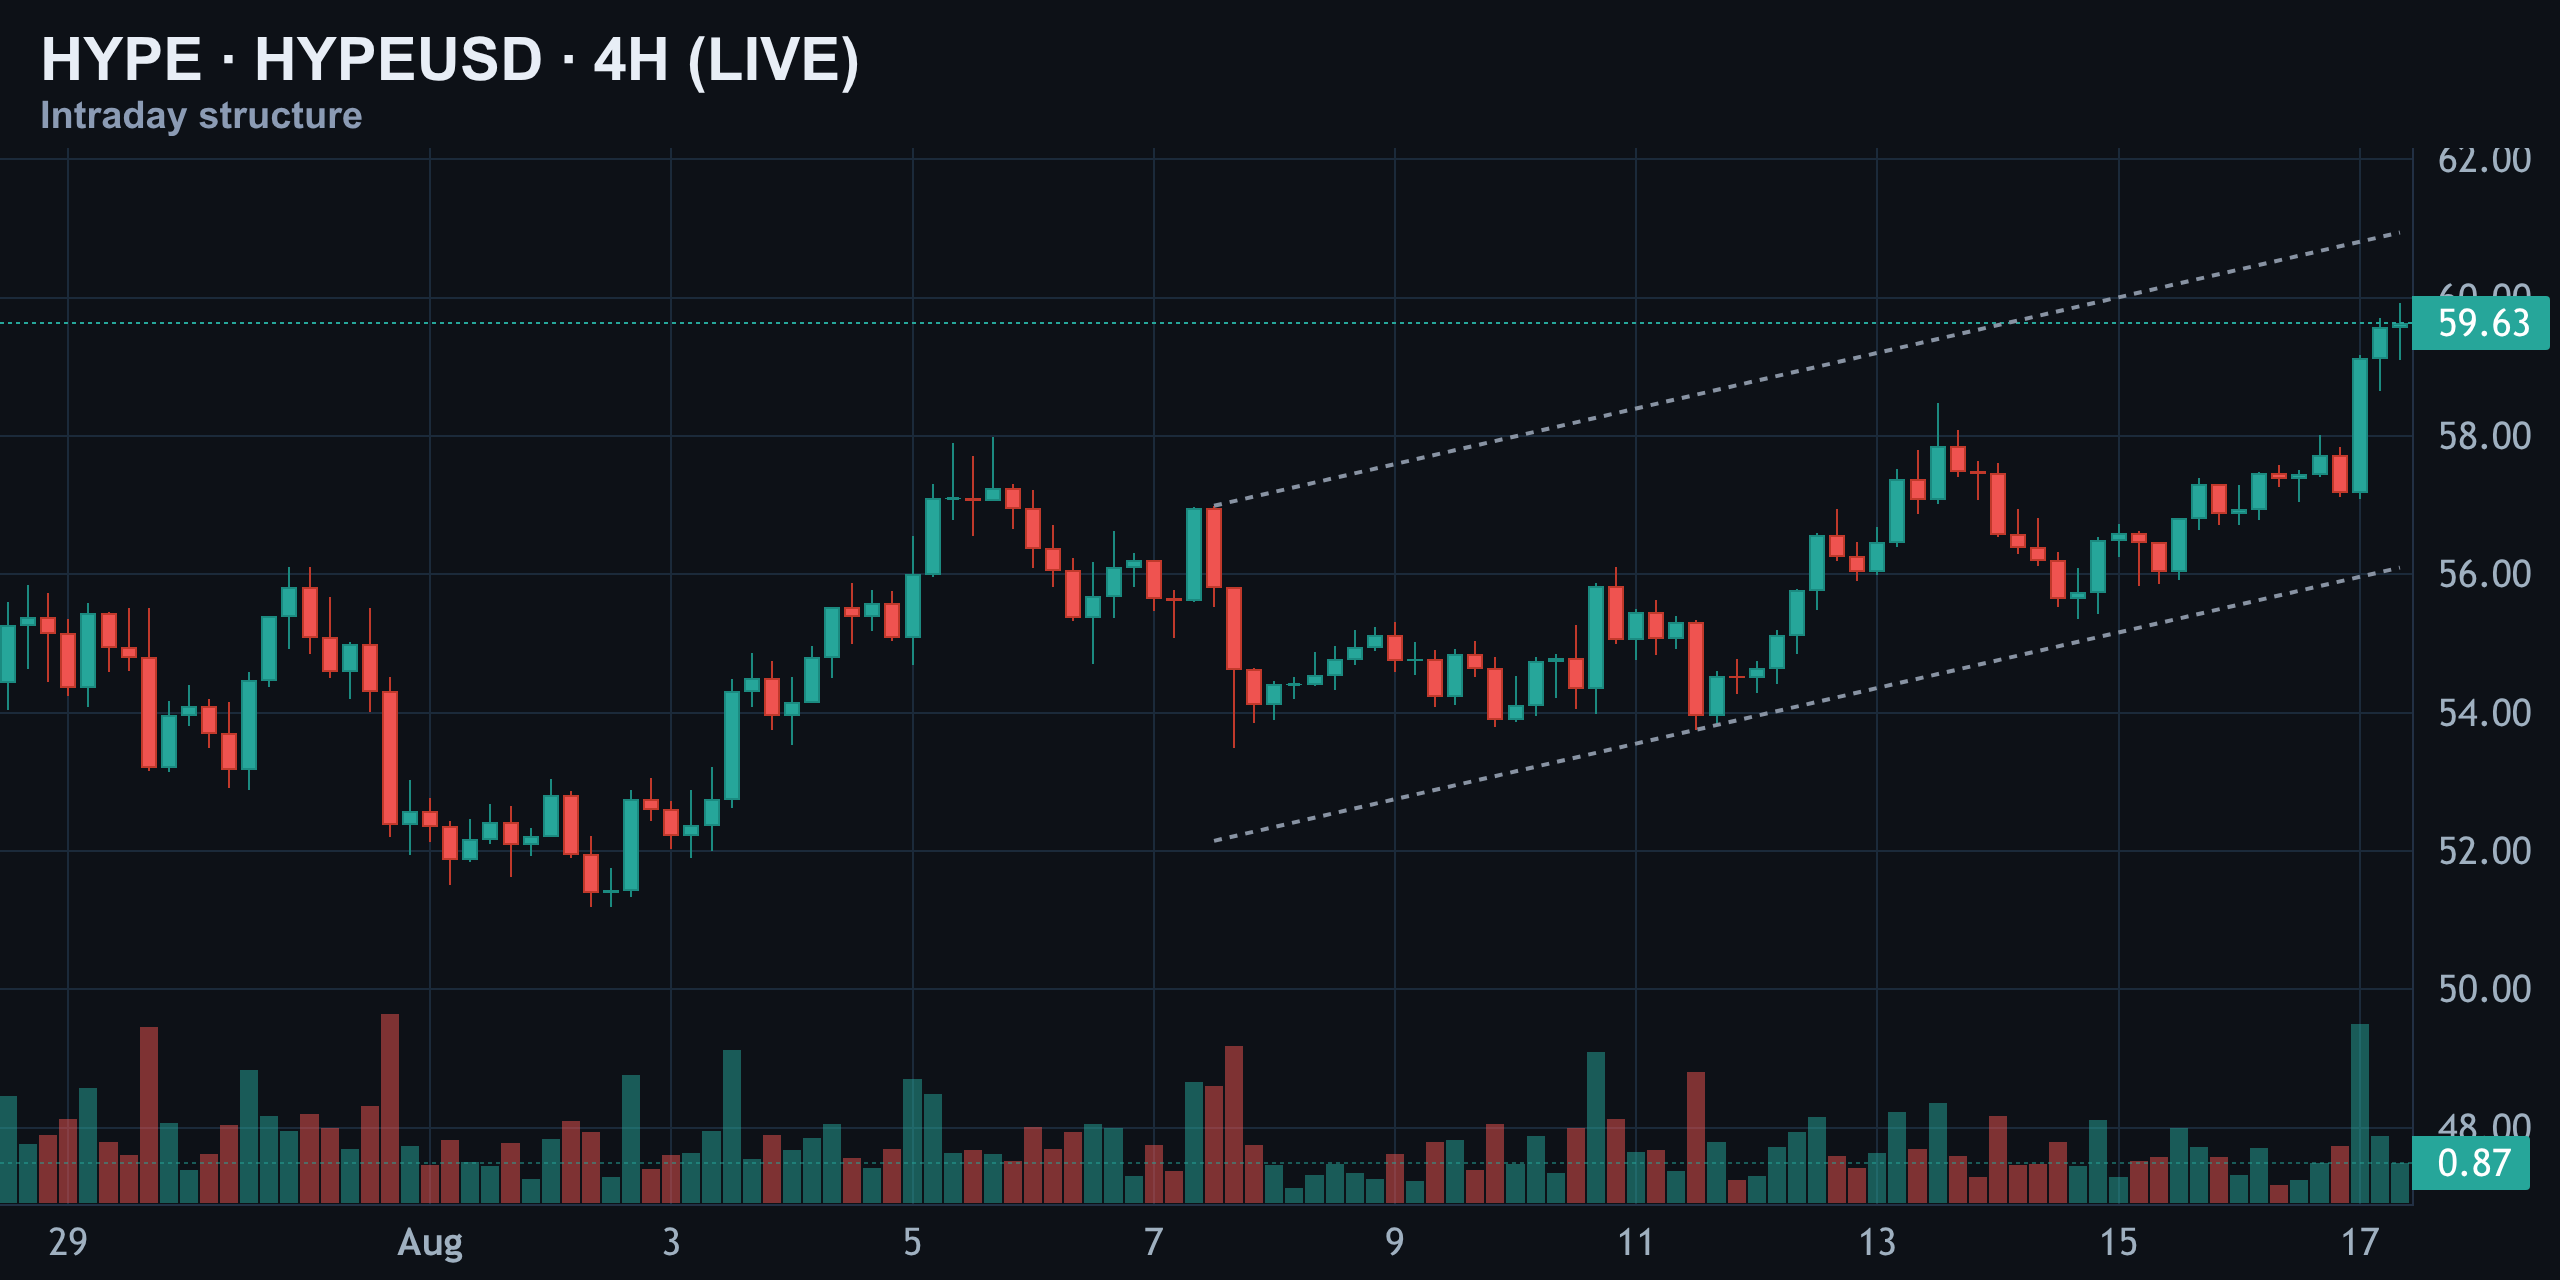
That candle didn't just poke above the channel — it closed on the largest volume bar since early August. That distinction matters. A wick above resistance is noise; a high-volume close above it is structure. In plain terms, the bigger trend just broke upward with real buying behind it.
Daily Structure: Testing the Ceiling of a Two-Month Downtrend
Stepping back to the daily timeframe changes the framing. HYPE has been carving a descending channel since June's high near $77. Today's bounce puts price at $59.63, pressing directly into the upper boundary of that channel for the first time since early July.
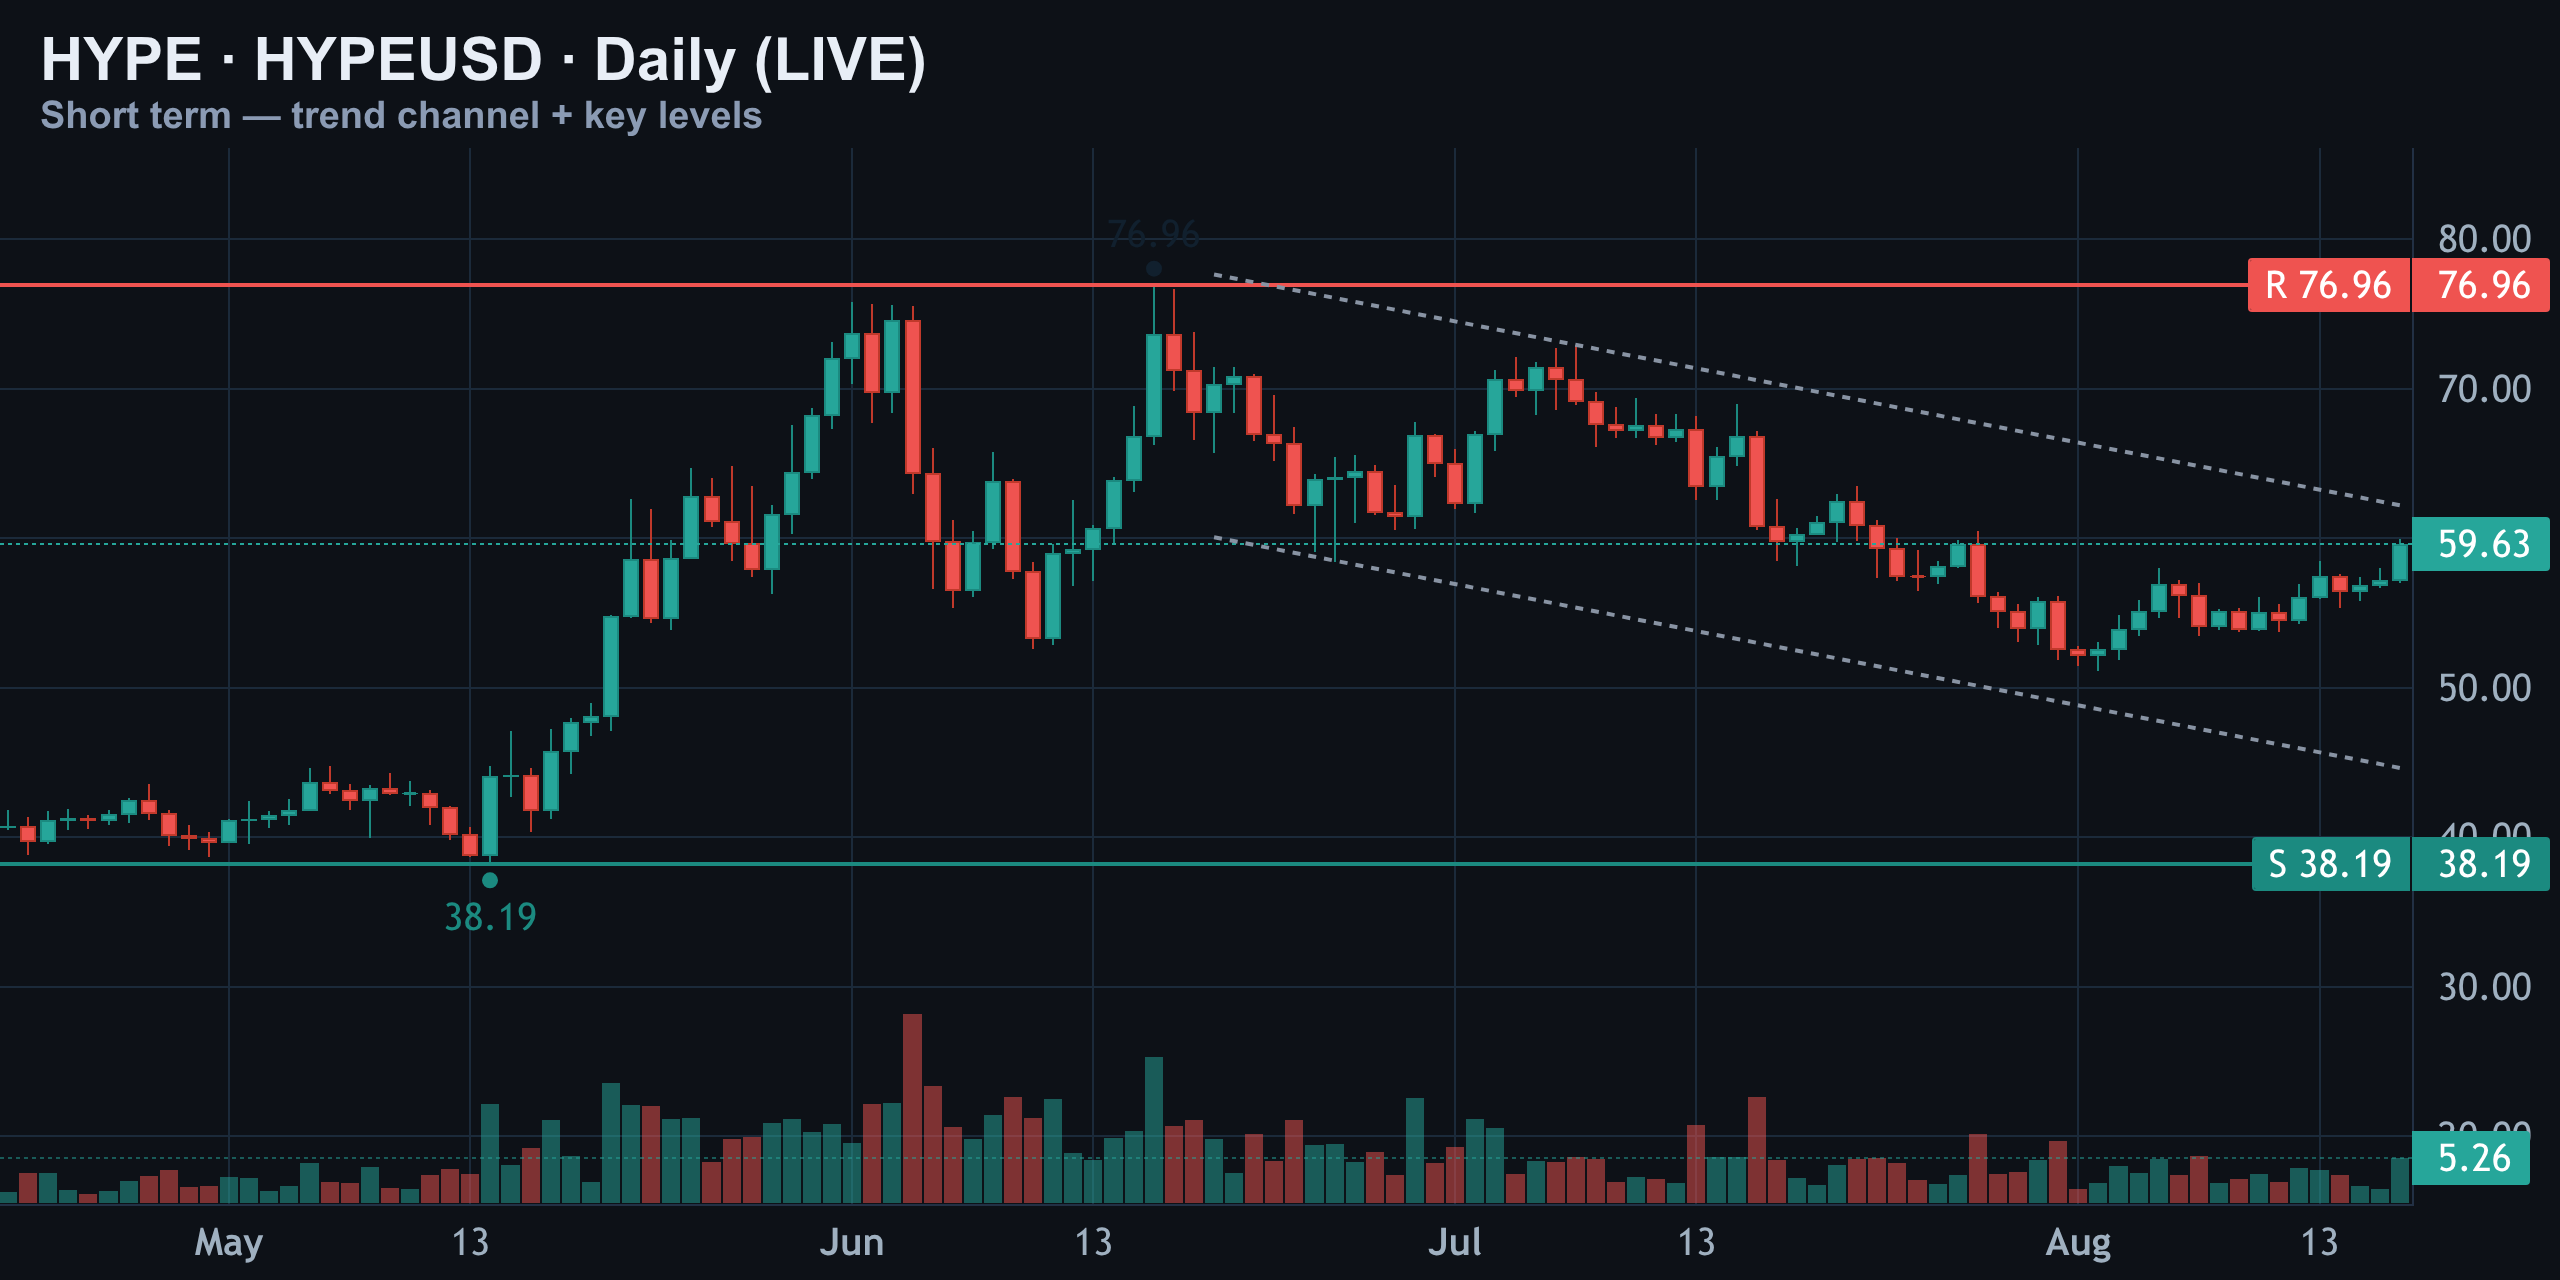
This is a meaningful test. Reclaim this rail with follow-through, and the multi-week downtrend is technically broken. Fail here again, and this simply becomes another lower high inside the range that's dominated price action since June.
Momentum Check: RSI Wakes Up, MACD Turns Green
RSI (14) — Neutral, Just Waking Up
Daily RSI reads 57, up from the low-40s just a week ago. That's a real momentum recovery, but nowhere near overbought. Compare that to early June, when RSI spiked above 75 right as price topped near $77 — this move has none of that euphoria yet.
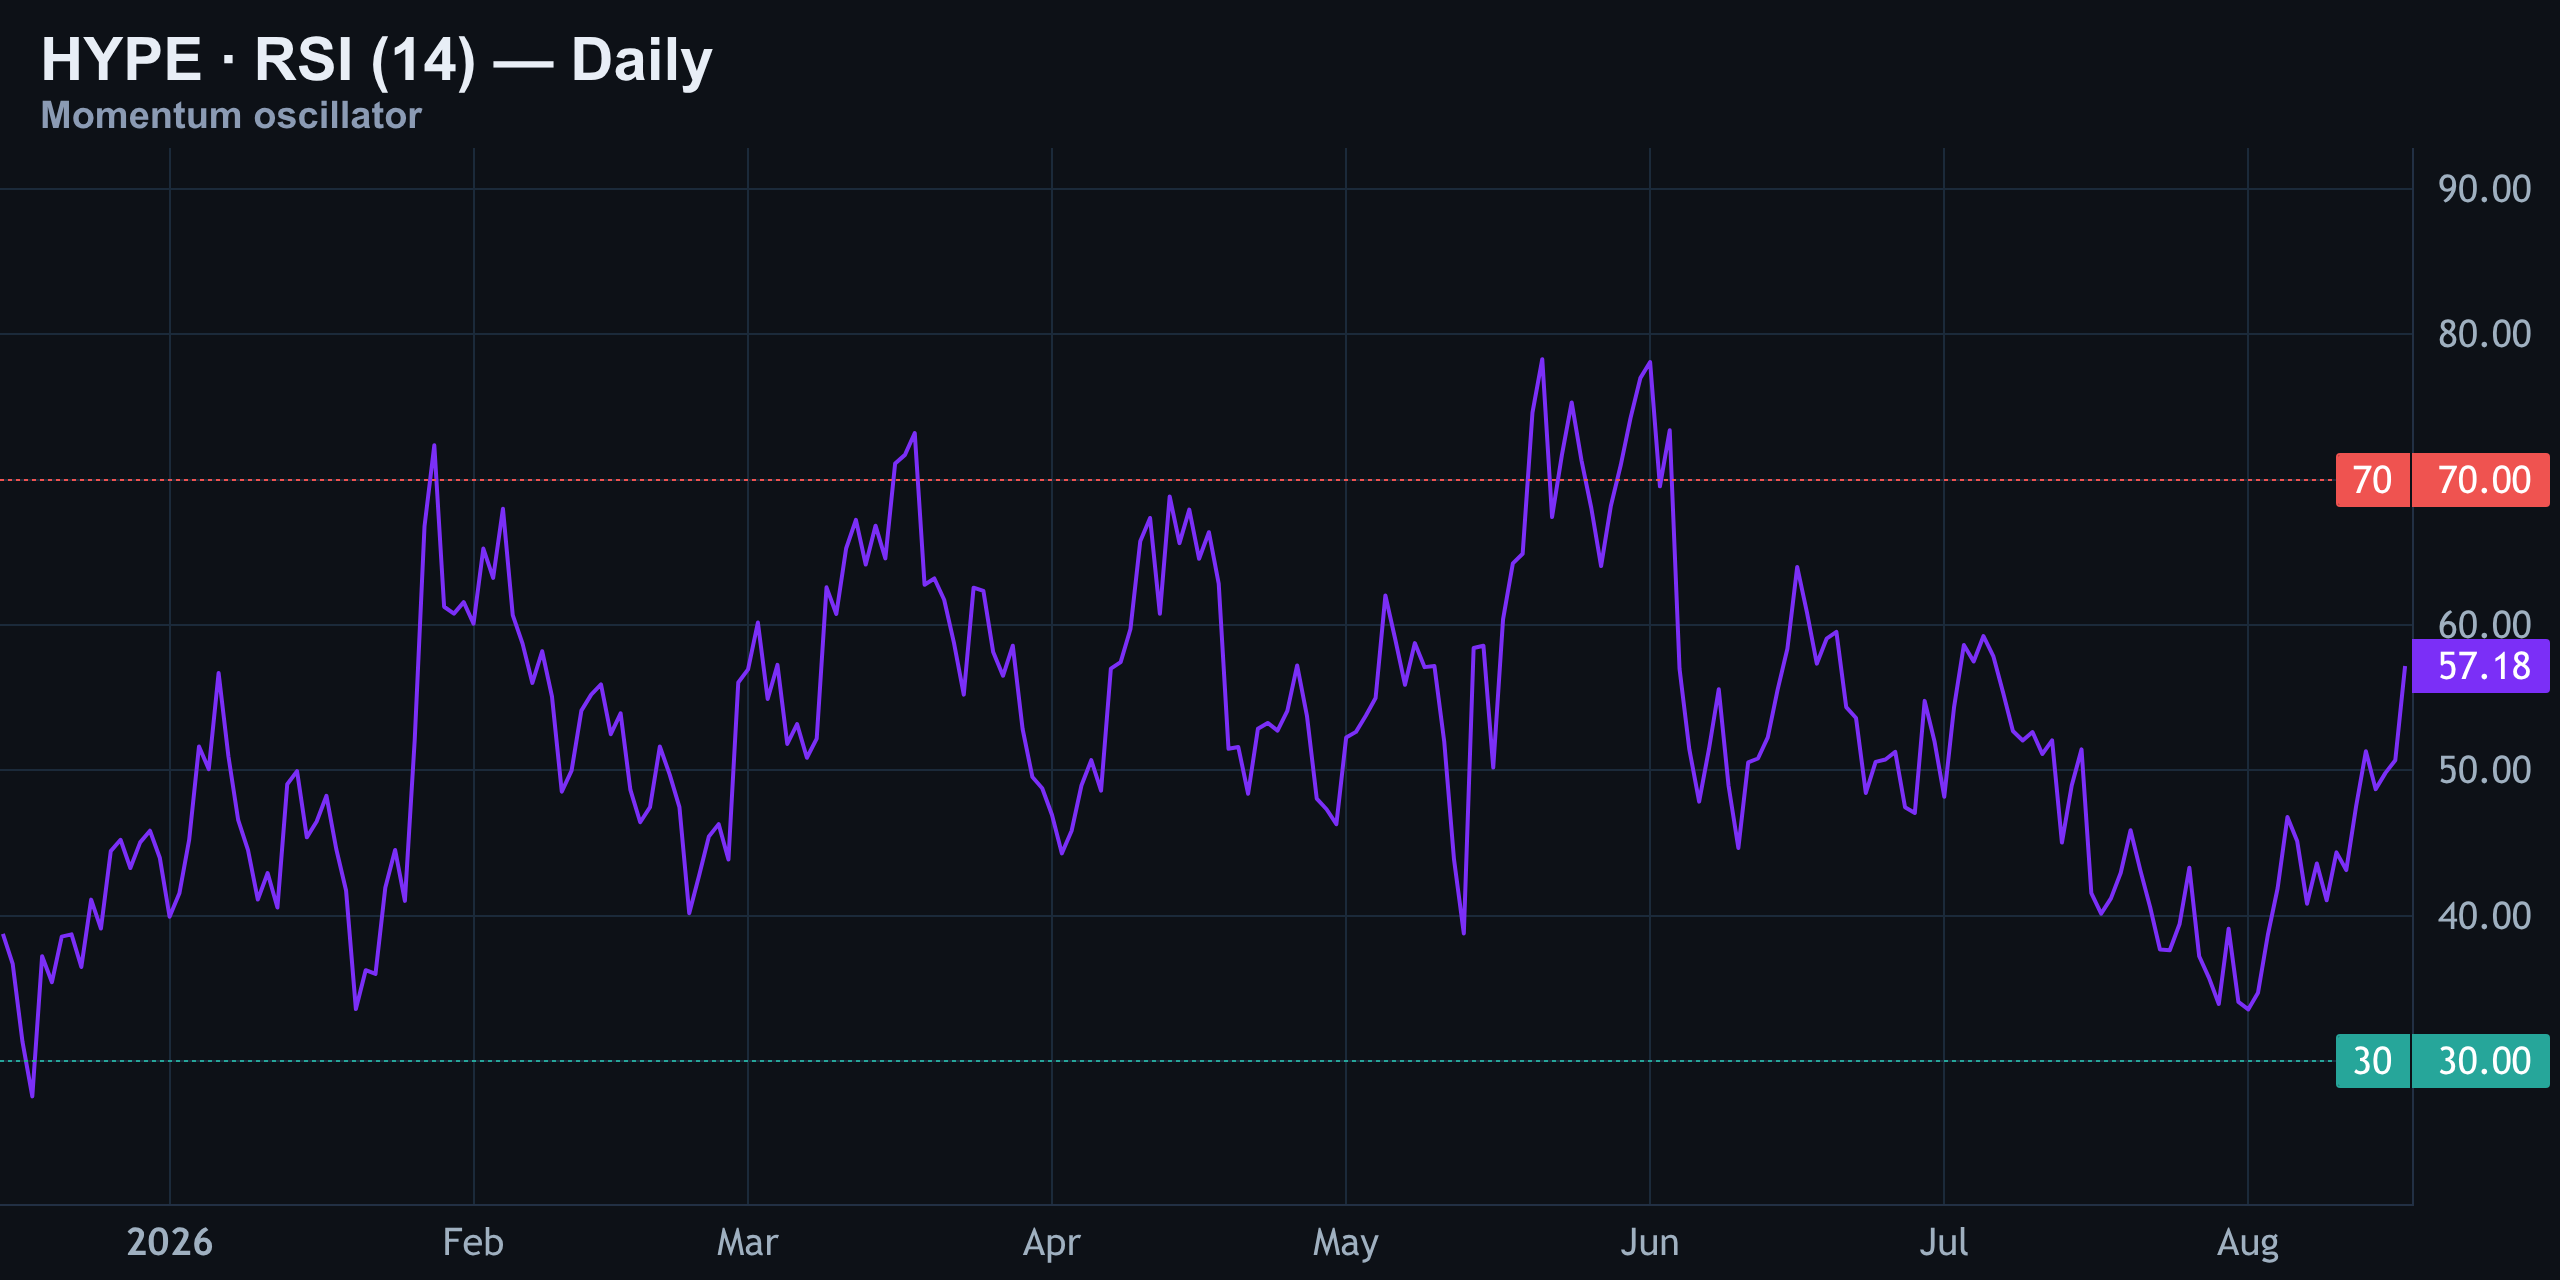
Neutral readings like this are actually the healthiest setup for a sustainable move higher, because there's no exhaustion that needs to unwind before the trend can continue.
MACD — Bullish Cross, Histogram Turns Green
MACD just crossed back above its signal line, with the histogram flipping positive after being red for most of August. That's the first fresh bullish cross since mid-July.
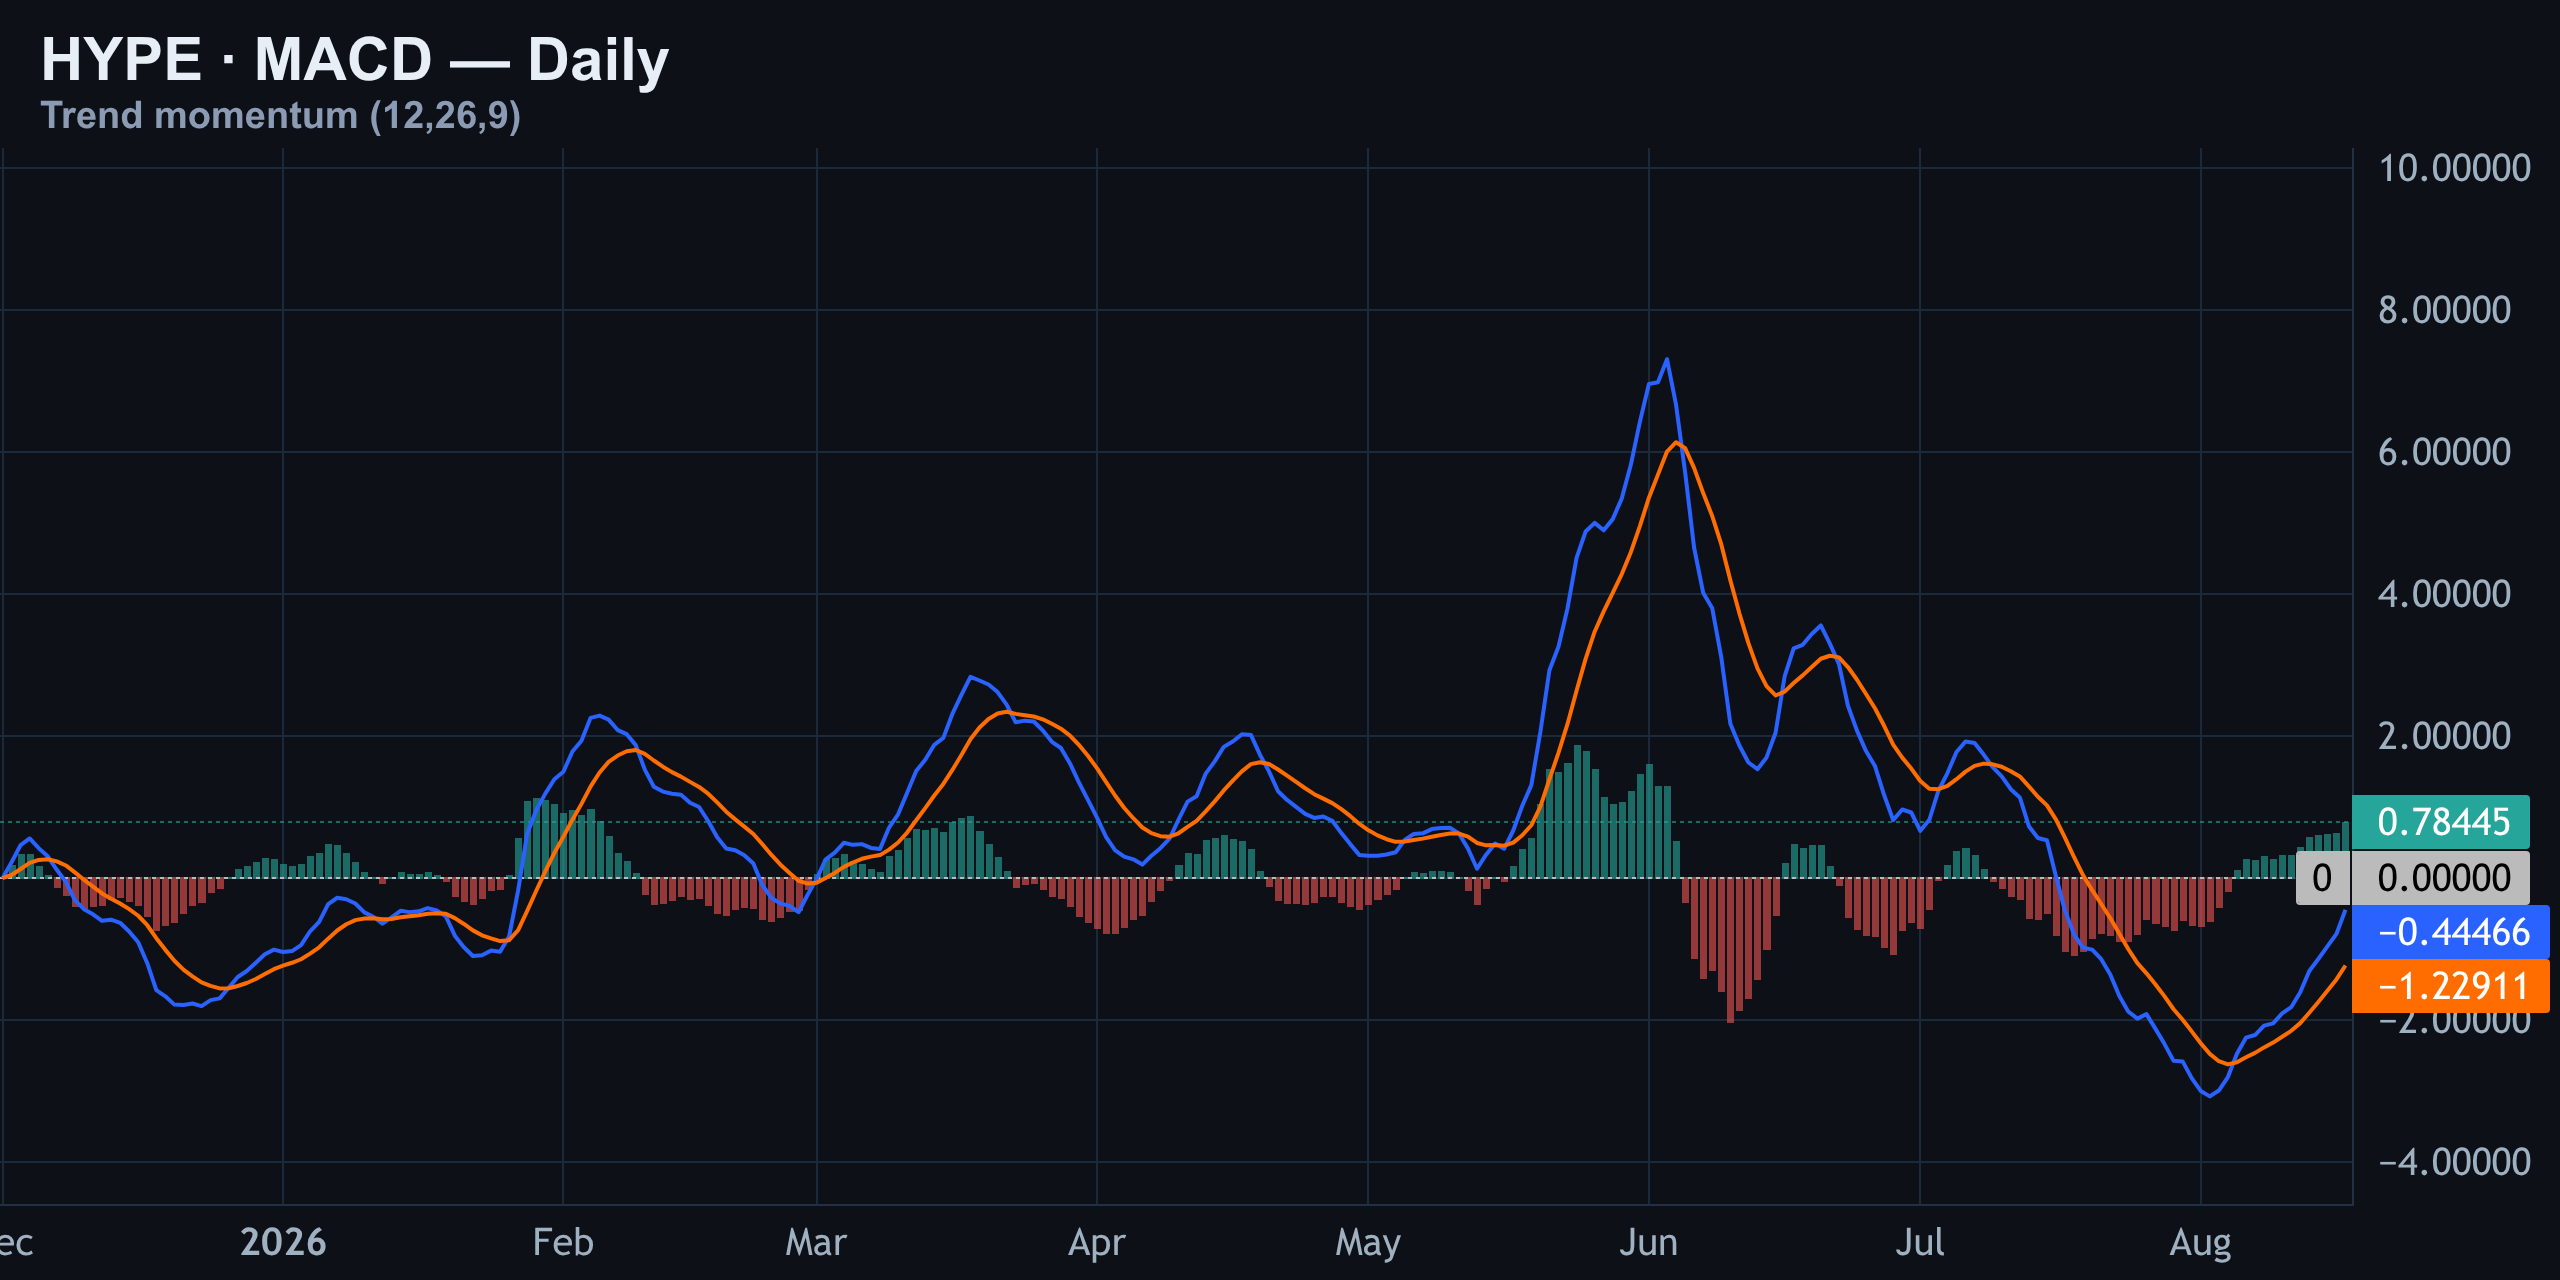
It's early — nowhere near the size of June's momentum spike — but a fresh MACD cross paired with recovering RSI is exactly the kind of confluence that carries more weight than either signal alone.
Levels, Liquidations, and Gamma: The Real Battle Above $60
The number to watch today is $60 — the zero-gamma flip. Above it, dealer hedging starts amplifying moves instead of dampening them, and volatility can get violent fast. Below it, this rally risks stalling exactly where it's sitting right now.
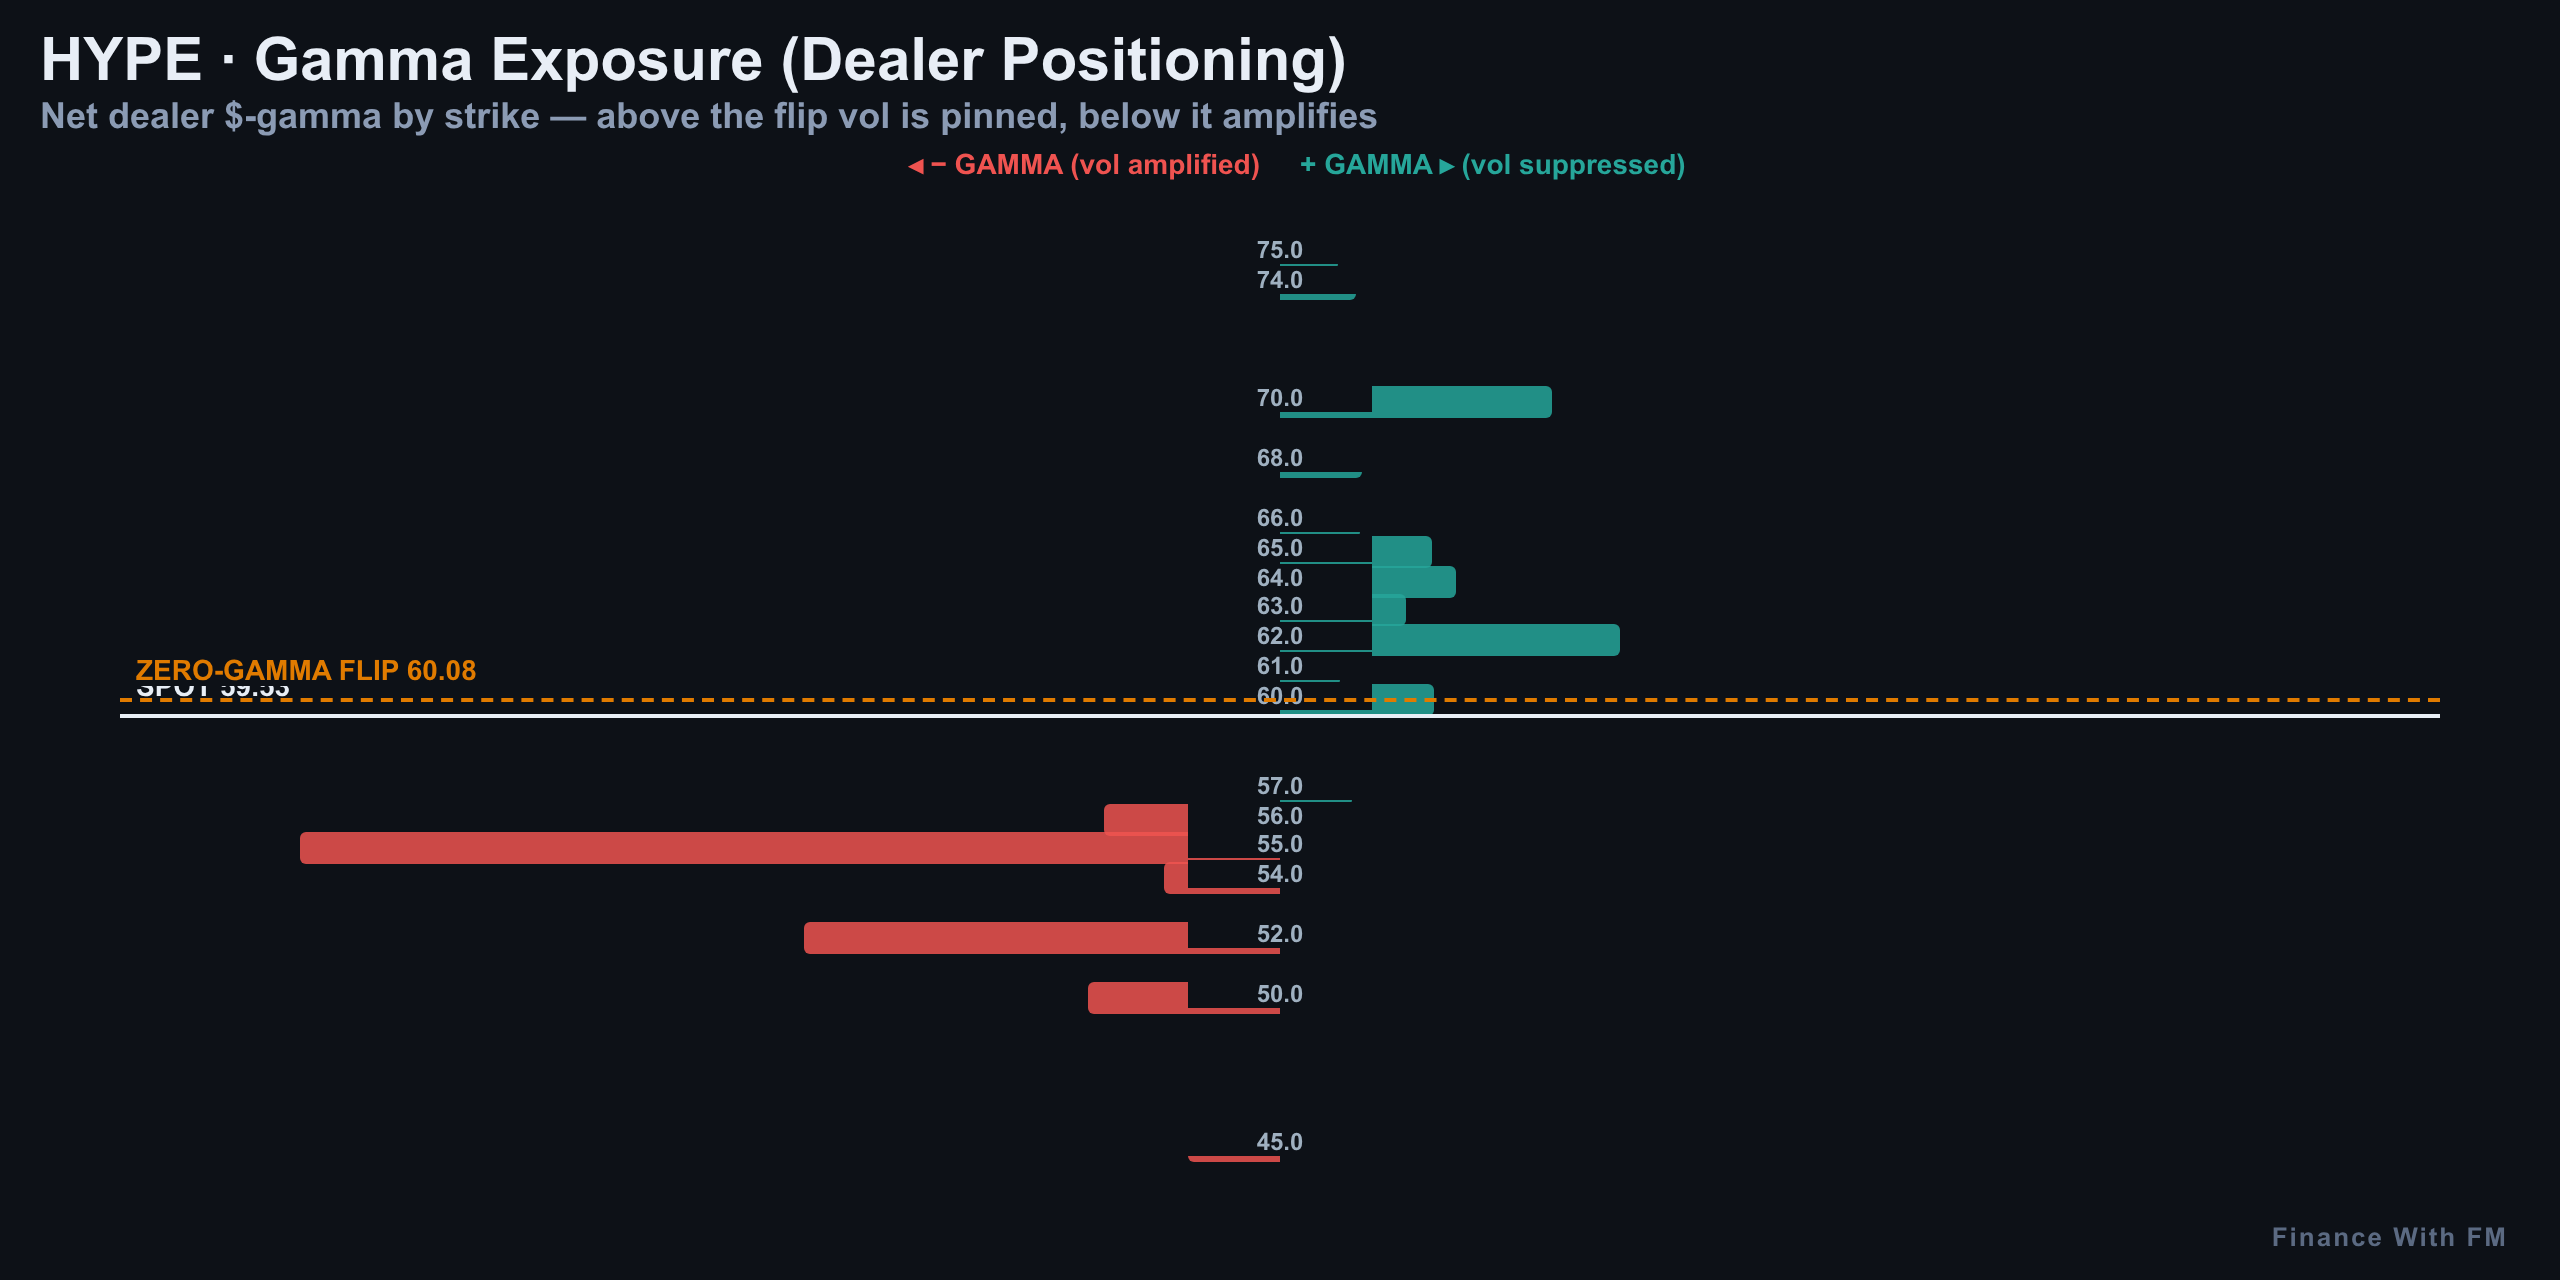
Spot is currently sitting in negative gamma territory, meaning volatility gets amplified rather than absorbed — breakouts and breakdowns both tend to run further than usual in this regime.
| Level | Price | What It Means |
|---|---|---|
| Gamma support | $55 | Dealer hedging cushions downside here |
| Long-liquidation cluster | $57 | Leveraged longs stacked, potential fuel on a dip |
| Long-liquidation cluster | $58 | Second cluster of leveraged long exposure |
| Zero-gamma flip | $60 | Bias-flip line — hold above, calm; lose it, violent |
| Gamma wall (resistance) | $62 | Heaviest dealer resistance overhead |
Below spot, the liquidation heatmap tells a story that momentum alone doesn't show. Long-liquidation clusters are stacked at $57 and $58 — meaning a chunk of this rally is leveraged longs, not just spot conviction. If price slips back through those levels, it can accelerate a pullback.
Expected Move
Options positioning gives this move context. The market is pricing a one-sigma range of roughly $57 to $62 into this week's expiry — meaning today's 4% pop is still inside the expected band, not a tail event.
| Range | Price Band | Approx. Probability |
|---|---|---|
| One-sigma | $57 – $62 | ≈ 68% |
| Two-sigma | $55 – $64 | ≈ 95% |
ATM implied vol sits at 55%. Trades that target inside the one-sigma band are high-probability plays; betting on a break beyond the two-sigma range is the low-odds tail bet nobody should be sizing heavily into.
Positioning adds one more wrinkle: retail accounts are net long at 1.42, and top traders are net long at 1.41 — nearly identical. When retail and smart money are this aligned, there's no crowd to fade, and no easy contrarian edge sitting on the table right now. Funding is near neutral at +5% APR, which keeps the setup clean rather than crowded.
Today's Drivers and the Verdict: Still No Clean Trade
Put it all together and today's drivers line up like this: a genuine 4% breakout on strong volume, momentum indicators turning constructive without being overheated, but a hard line at $60 where the options market's dealer hedging can flip from friend to foe — sitting directly on top of the current price.
- Structure: 15-min and 4-hour charts confirm a real breakout with volume behind it
- Daily: price is testing — not yet breaking — a two-month downtrend ceiling
- Momentum: RSI and MACD both turned bullish, but neither is stretched
- Gamma: zero-gamma flip at $60 sits almost exactly on spot — the tiebreaker level
- Leverage: long liquidations stacked at $57–58 mean part of this move is fuel, not just conviction
- Positioning: retail and top traders are equally net long — no crowd to fade
That's a lot of encouraging signals stacked on top of one unresolved question: does HYPE close above $60 with conviction, or does it stall right where it is and roll back into the range? Until that question answers itself, there's no clean 1:2.5 risk-reward trade to put on — so today, once again, the call is to stand aside.
More on Hype: derivatives
Analysis and education, not investment advice. See our editorial policy.