Daily market analysis
Kaspa (KAS) technical analysis today
Last updated
KAS Daily Pulse — August 21, 2026
KAS Daily Pulse: The Market Has Strengthened, But the Setup Is Still Neutral
Welcome to Finance With FM. This is the KAS Daily Pulse for August 21, 2026, covering the latest price action, market structure, momentum indicators, positioning, liquidation risk, and the trade decision for today.
KAS is trading near $0.029287, up approximately 4.3% from the previous update at $0.028069. That is a meaningful short-term improvement, but a stronger price does not automatically mean a better entry. The central question is whether this move represents the beginning of a confirmed breakout or simply a crowded expansion inside a wider range.
| Metric | Current reading | What it means |
|---|---|---|
| KAS price | $0.029287 | Near the upper end of the current short-term range |
| Change since prior update | +4.3% | Momentum has improved |
| Key structure level | $0.0276 | The practical intraday bias line |
| Near-term resistance | $0.0300 | Breakout area requiring acceptance |
| Daily RSI | 66 | Constructive, but not yet traditionally overbought |
| Funding | Near neutral, about +5% APR | No strong funding-based directional edge |
The previous update also stood aside because KAS was caught between the 50-day and 200-day moving averages. That decision remains open rather than wrong or right: no position was entered, so there was no stop-loss or target to record. The market has moved higher, but it still has not delivered the minimum 1:2.5 risk-to-reward profile required by this analysis.
15-Minute KAS Chart: Higher Lows, But Resistance Is Close
The 15-minute chart shows the clearest evidence of short-term demand. KAS has built a sequence of higher lows from roughly $0.028 toward the current $0.0293 area, keeping the rising intraday channel intact. This structure tells us buyers are defending progressively higher levels rather than allowing the entire move to retrace.
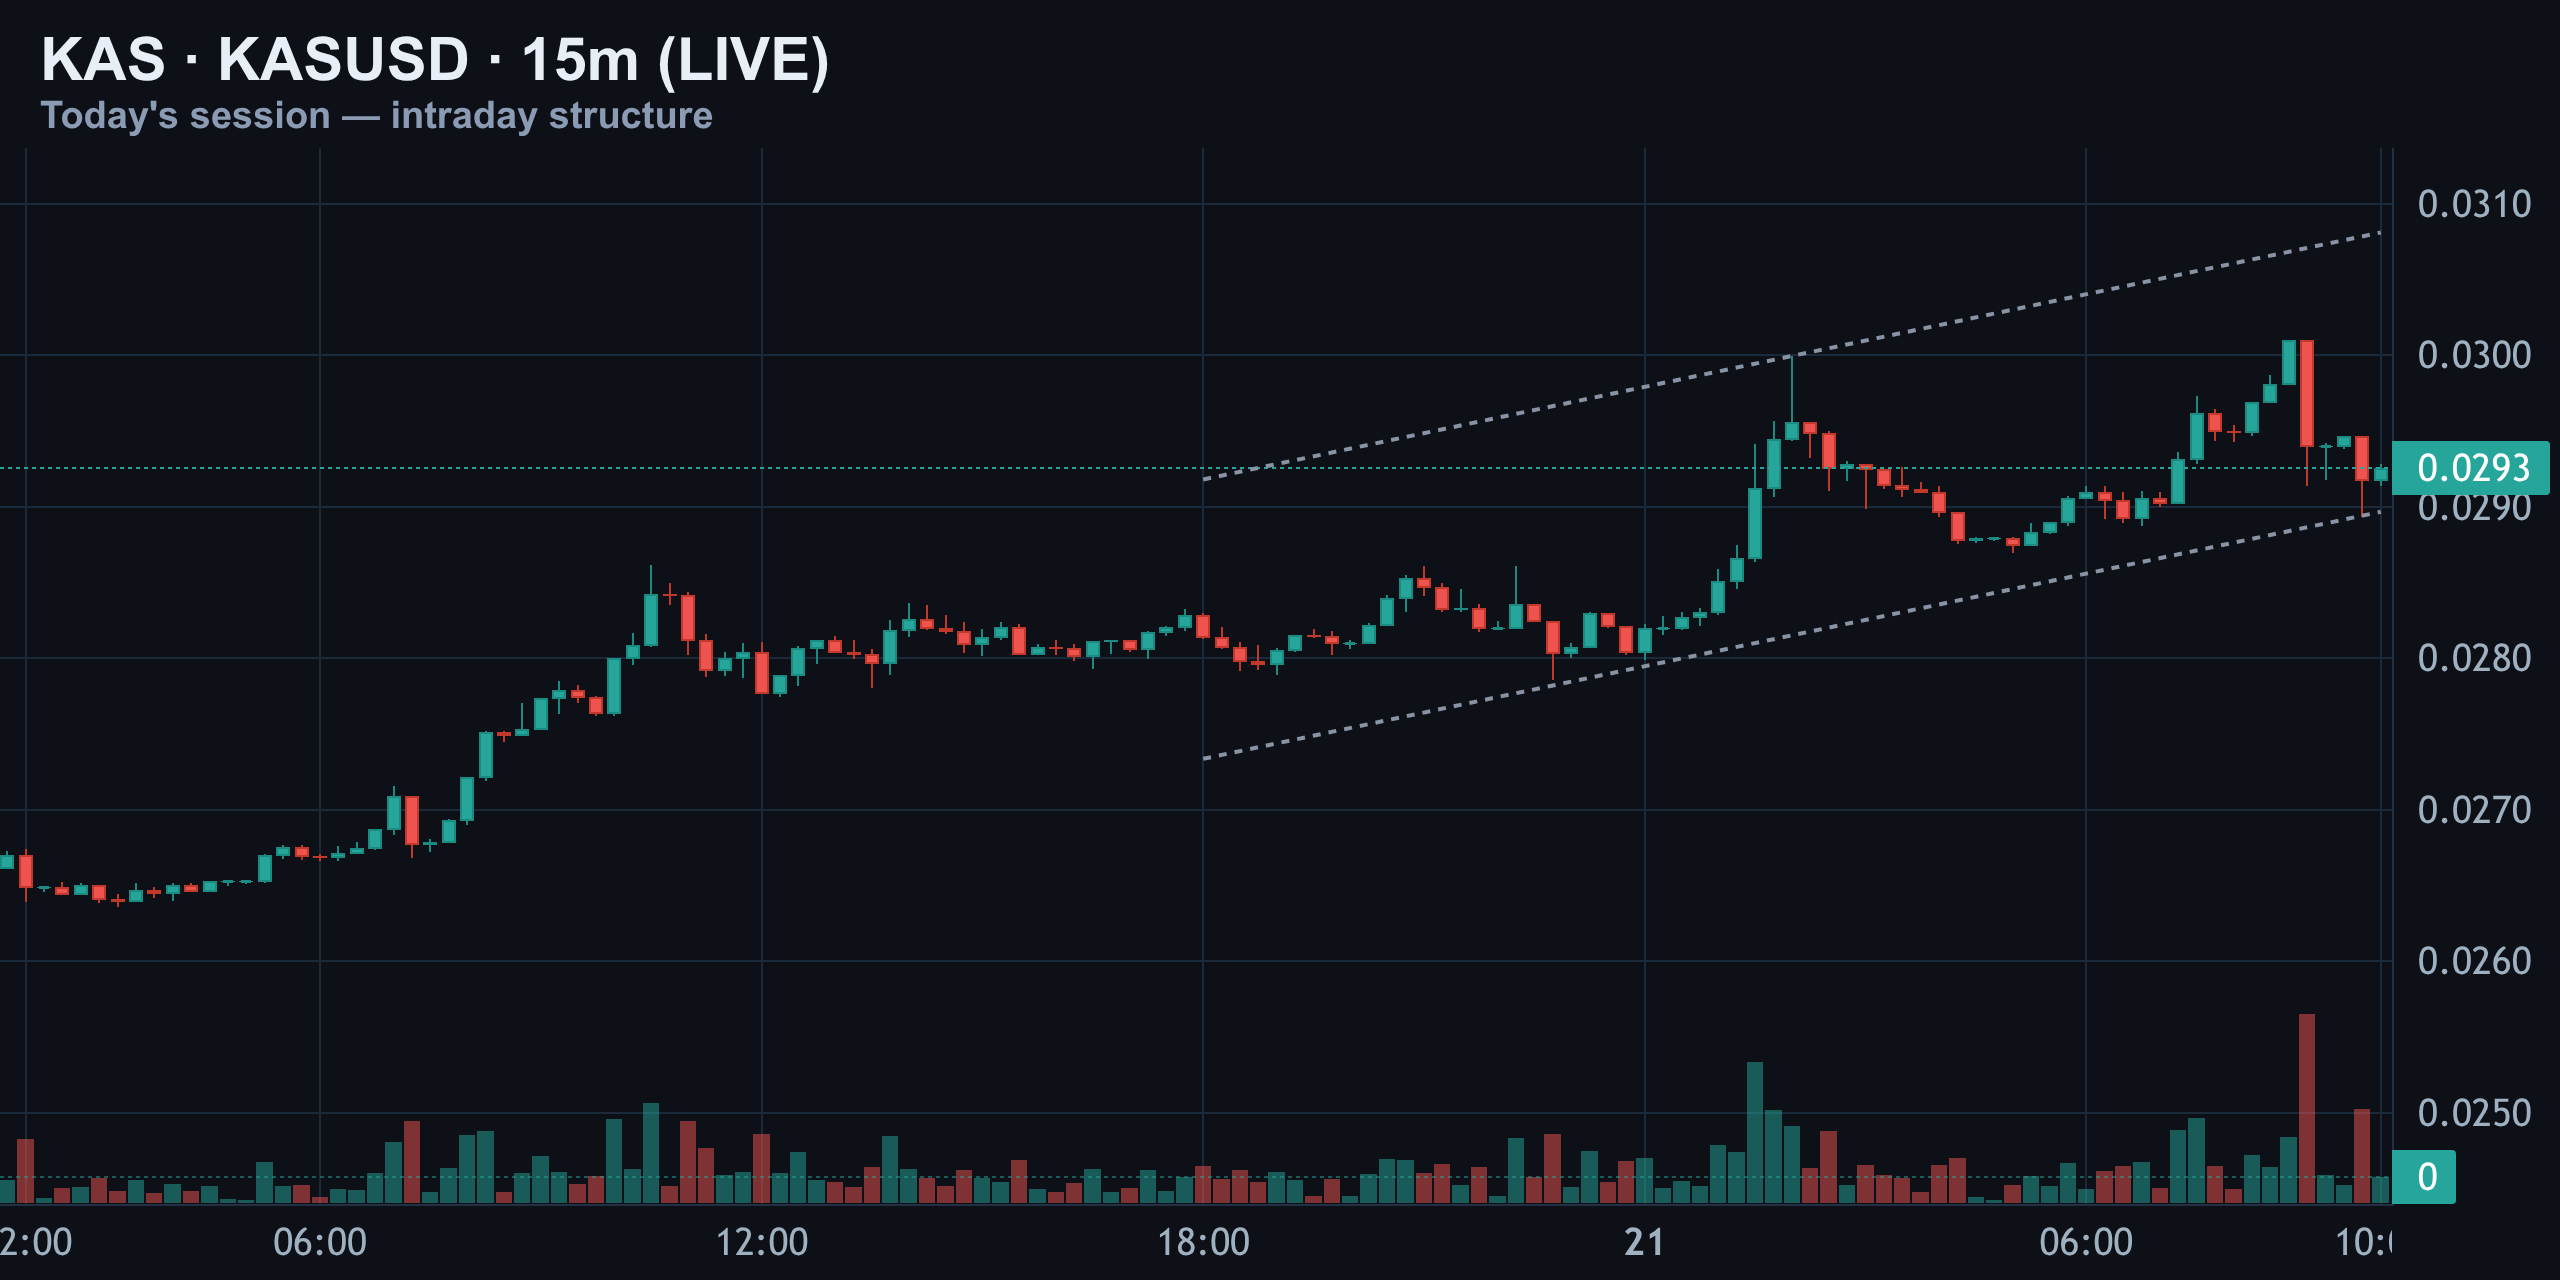
However, the same chart also highlights the problem with buying immediately. KAS pushed into the $0.03 zone and was sharply rejected. The latest candles are consolidating instead of expanding decisively through that level. Consolidation can precede a breakout, but it can also be the pause before a pullback, especially when price is approaching the top of a short-term channel.
The most important intraday level is $0.0276. A hold above it would preserve the sequence of higher lows and keep the current channel technically healthy. A loss of $0.0276 would weaken the channel, invalidate the immediate bullish rhythm, and increase the probability of a move toward the lower liquidity areas identified by the liquidation map.
| Intraday area | Price | Interpretation |
|---|---|---|
| Current spot | $0.029287 | Price is pressing toward resistance |
| Resistance | $0.0300 | A clean break and acceptance would improve the bullish case |
| Structure test | $0.0276 | Holding this level preserves the rising channel |
| Lower liquidity reference | $0.0258 | A notable liquidation-history area below price |
In practical terms, KAS is rising short term but has not cleared nearby supply. Traders should distinguish between a candle that briefly trades above $0.03 and genuine acceptance above it. Acceptance would mean price holds the level, attracts follow-through, and does not immediately fall back into the range.
Four-Hour Structure: A Real Impulse, Not Yet a Confirmed Trend Change
The four-hour structure has improved materially. KAS broke upward from the $0.027 region and accelerated through the $0.028 area on expanding candles. That is stronger evidence of demand than a slow, low-volume drift. Buyers have demonstrated that they can move price with force.
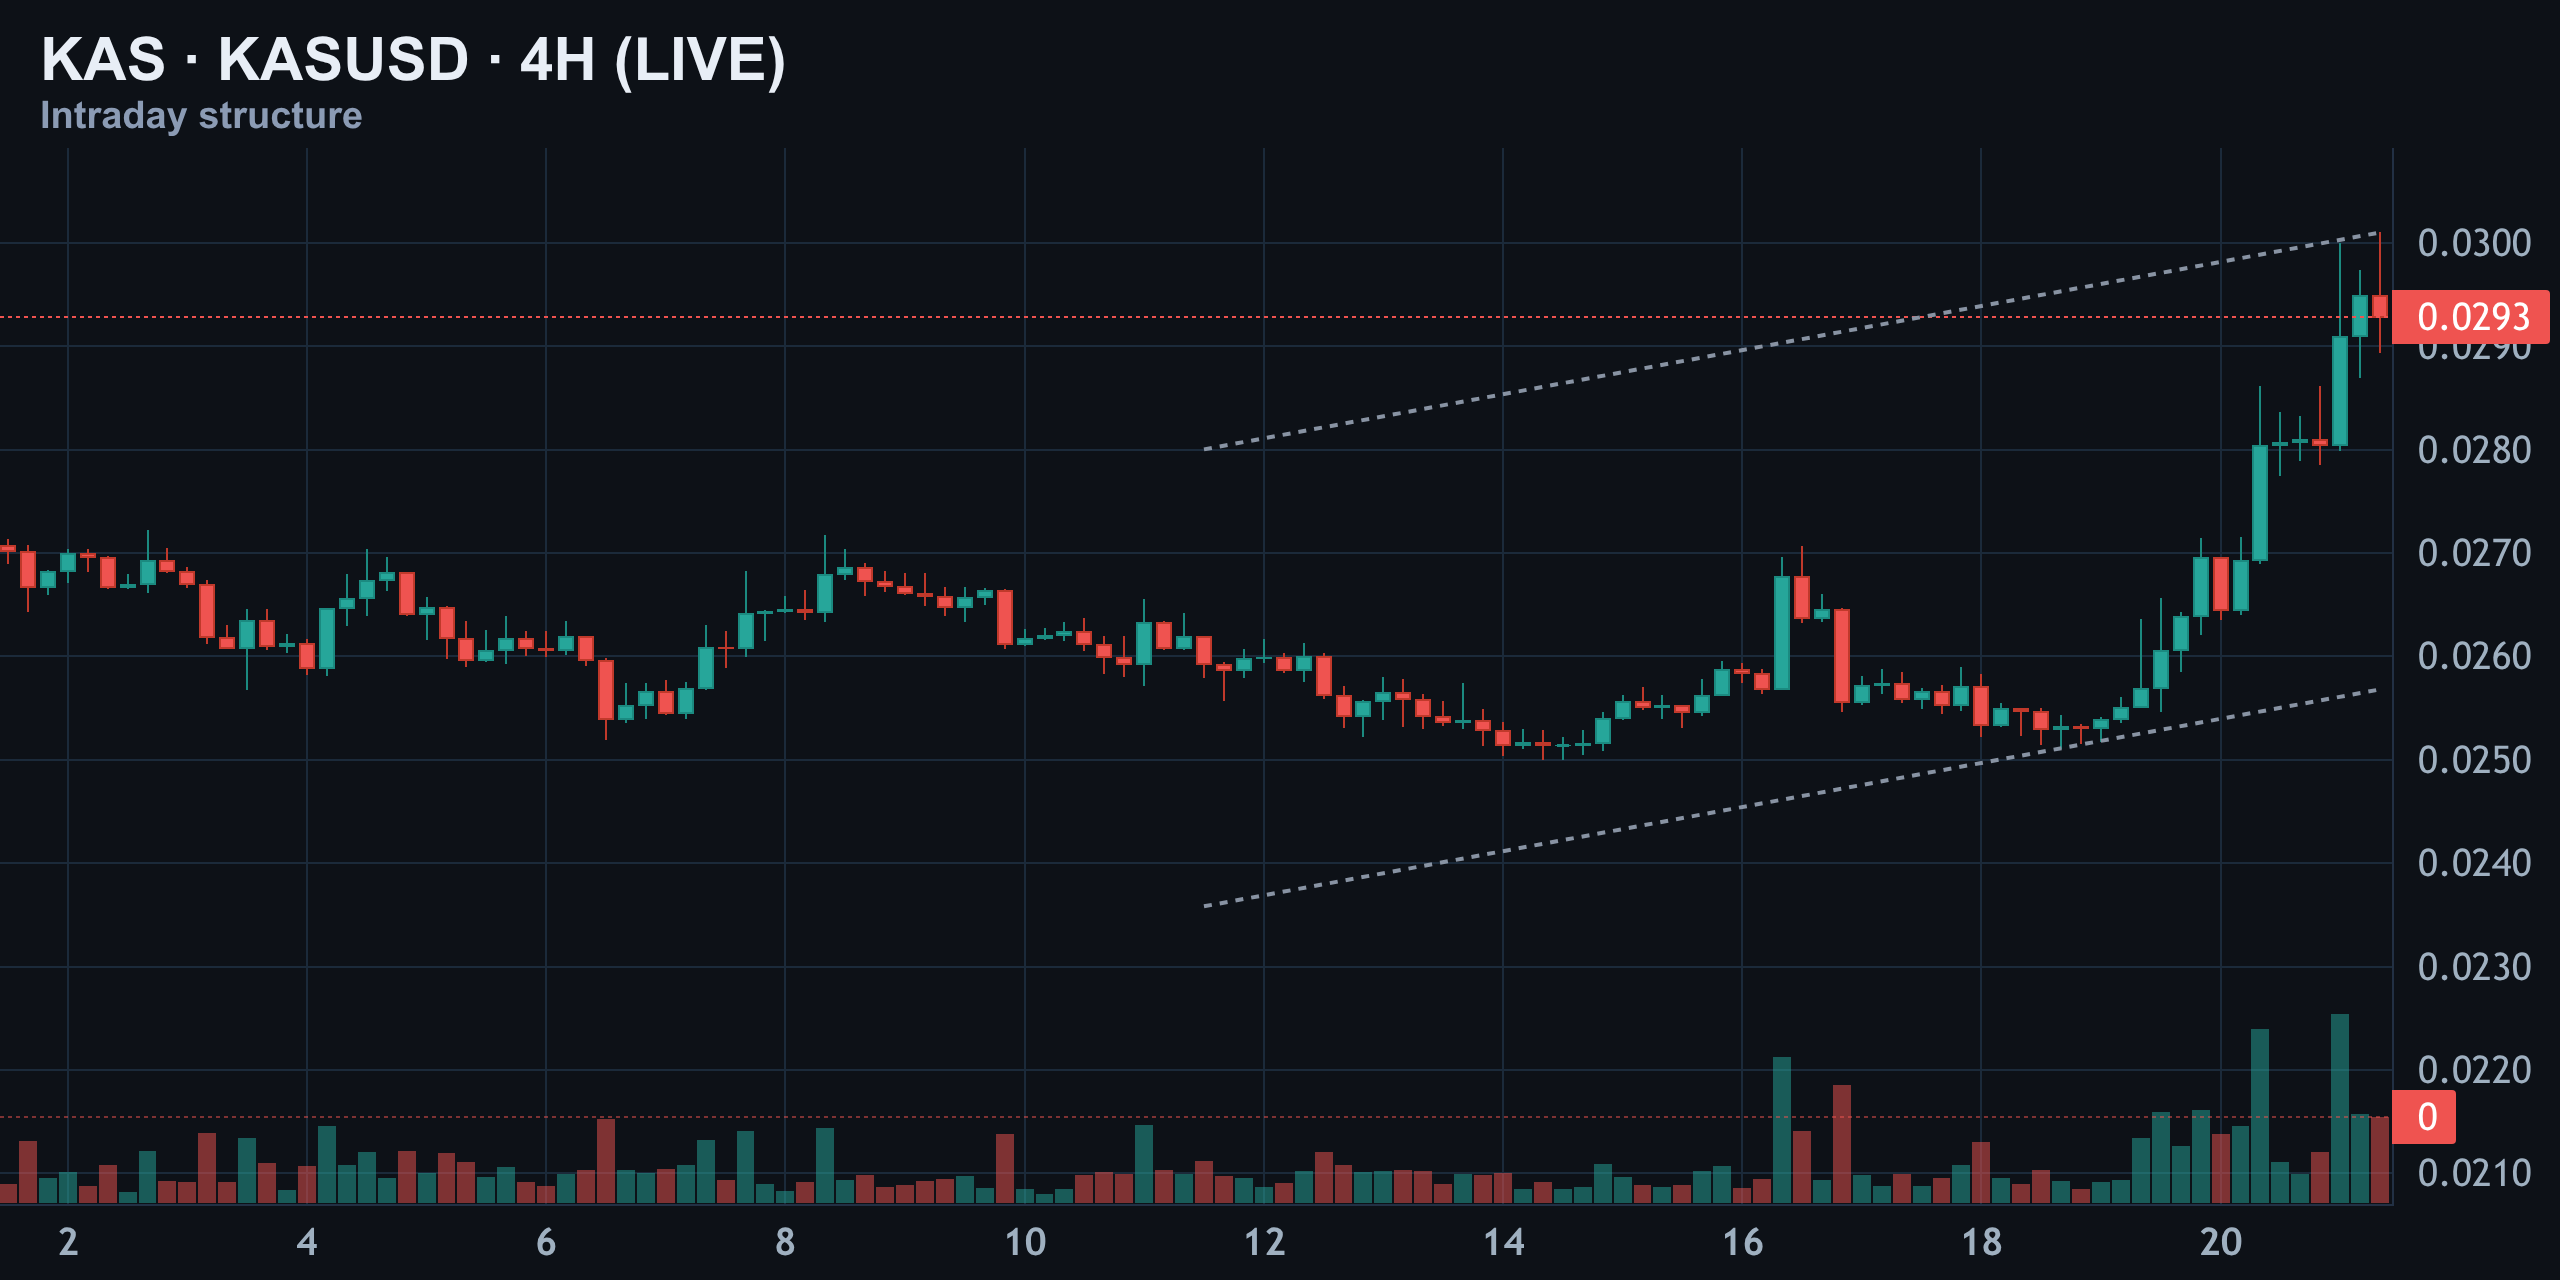
The difficulty is location. The rally is now pressing into the upper channel boundary near $0.03, where the latest candle shows hesitation. Price is also still range-bound between the 50-day and 200-day moving averages. Until KAS establishes acceptance above that broader moving-average zone, the four-hour impulse should be treated as an improving counter-move rather than a fully confirmed trend reversal.
This distinction matters because strong momentum can arrive late in a range. A trader who buys after a 4.3% rise, directly beneath resistance, may have less upside available while still carrying the full downside risk back to structure. The chart is constructive, but the reward location is not yet attractive.
Daily Context, RSI, and MACD: Momentum Supports the Bounce
The short-term daily chart places the current rally inside a broader descending channel. KAS is bouncing from the lower portion of that channel, with broader support marked near $0.025 and resistance near $0.04095. Those wider levels matter for context, but today's decision is being made much closer to spot, around the $0.0276 to $0.0300 region.
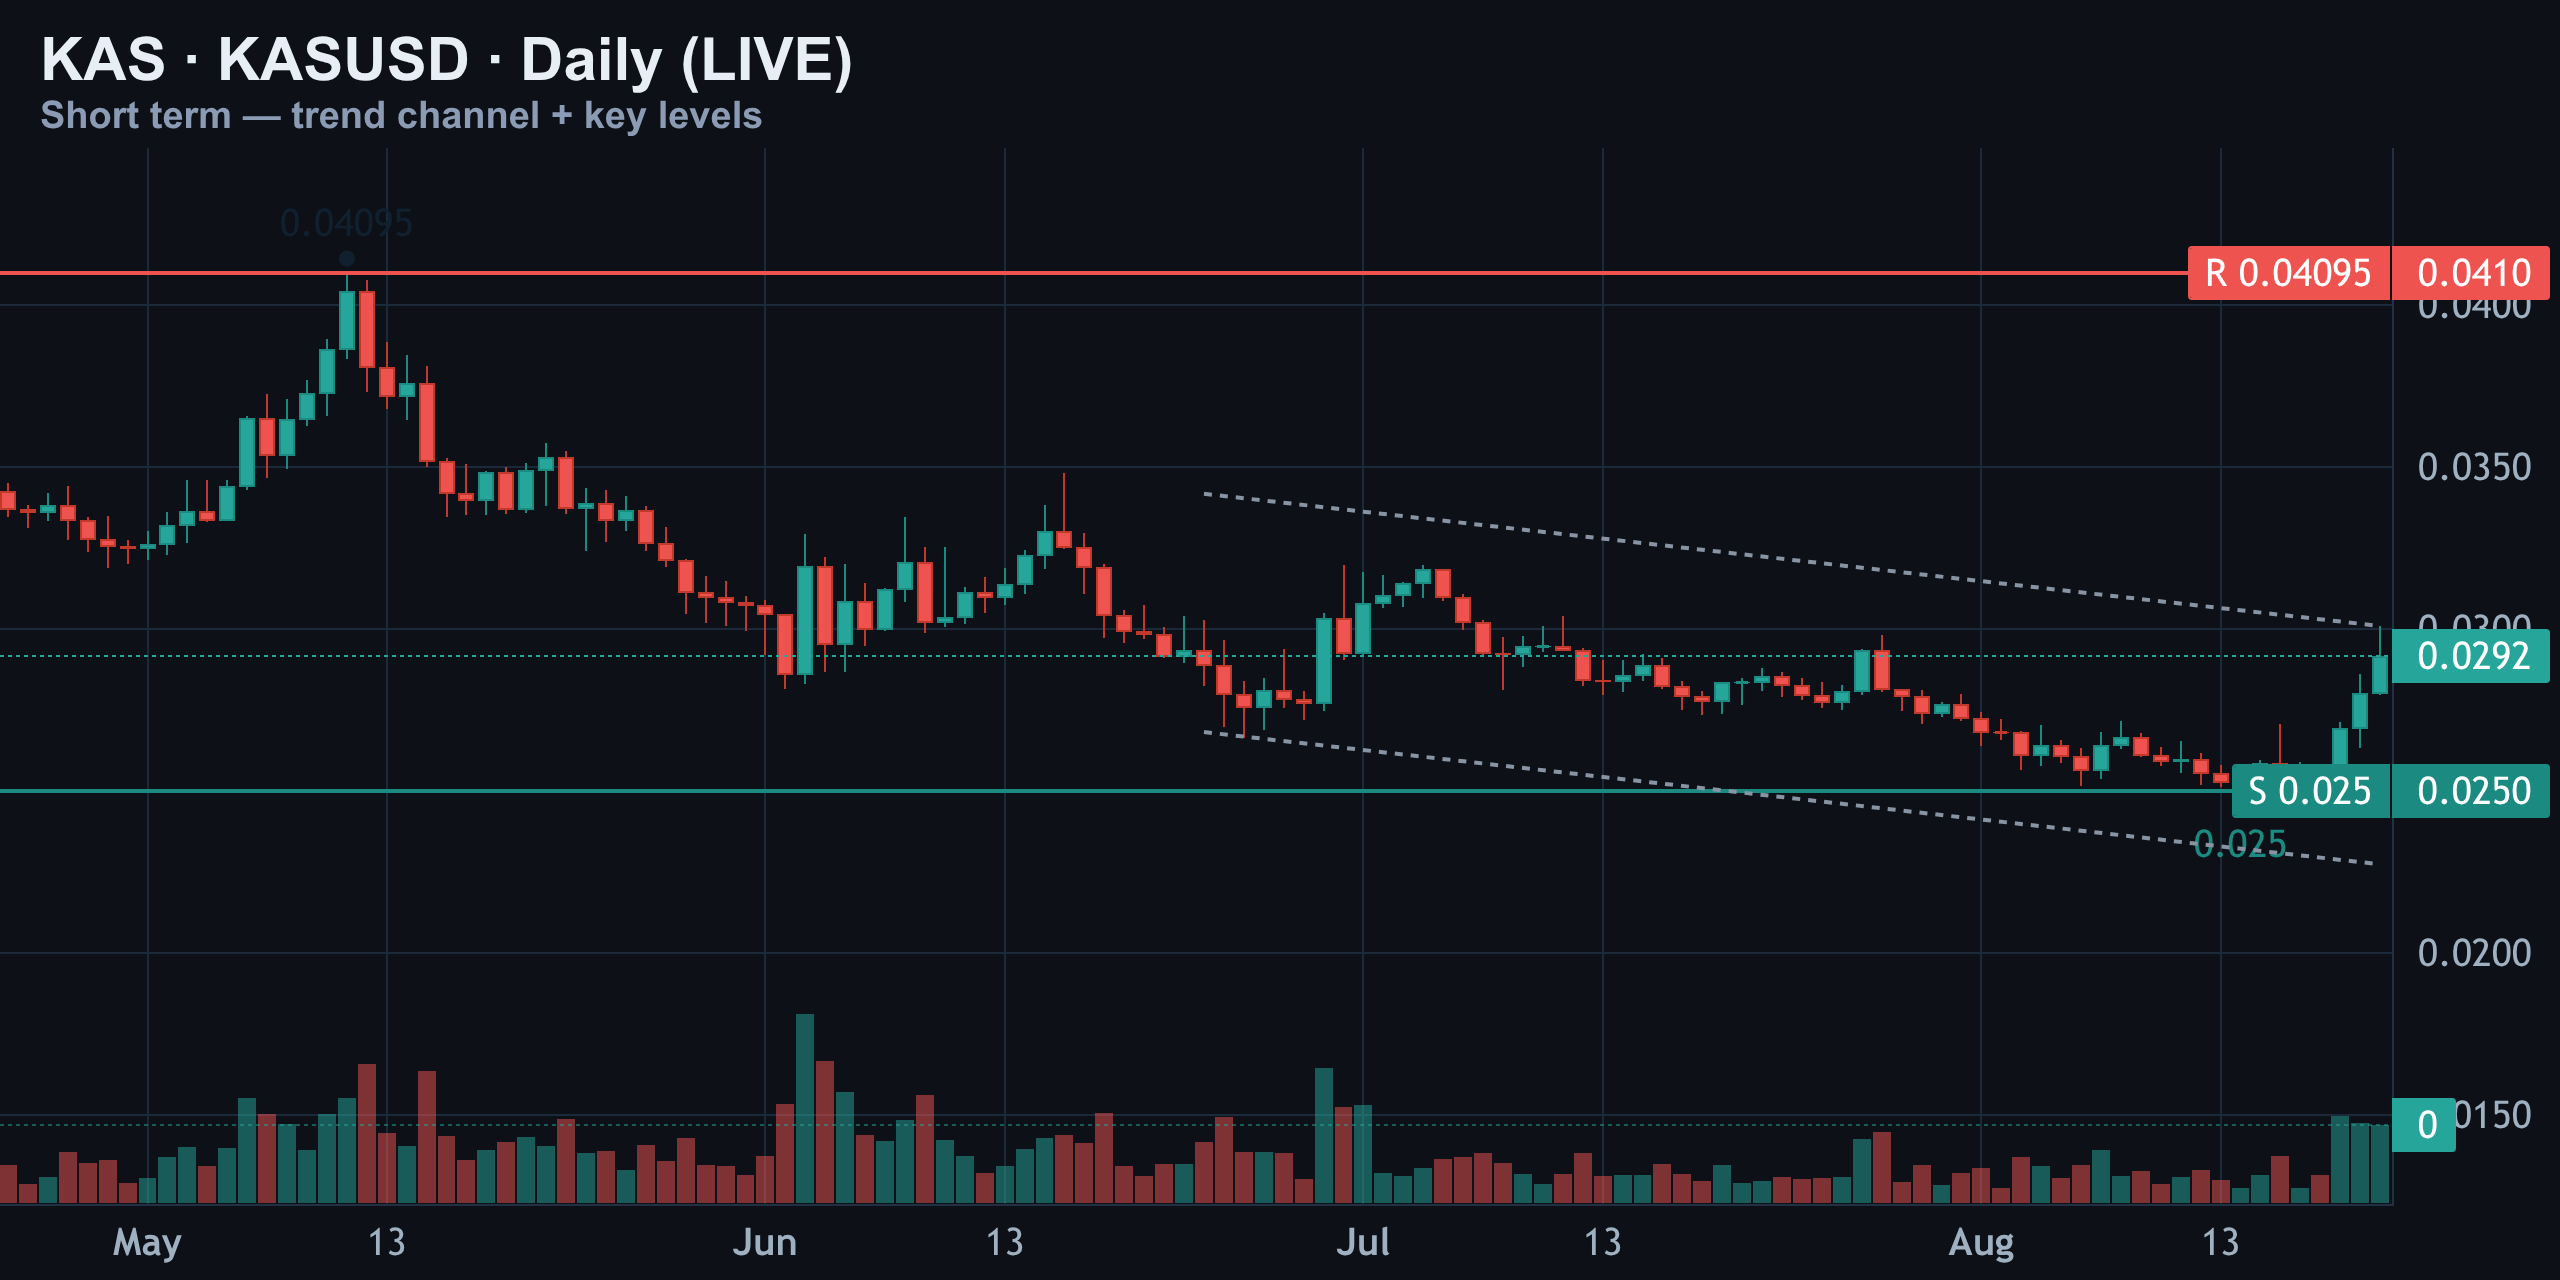
The daily backdrop has not fully flipped upward. The current rally can continue, but it remains a counter-move inside unresolved structure until KAS establishes acceptance above the nearby range ceiling and begins producing higher highs on the daily timeframe.
RSI is constructive, not conclusive
Daily RSI (14) is reading 66. That is constructive because momentum has recovered strongly without reaching the traditionally overbought threshold near 70. It also means KAS is no longer offering the simple oversold-rebound setup that often provides a clearer asymmetric entry.
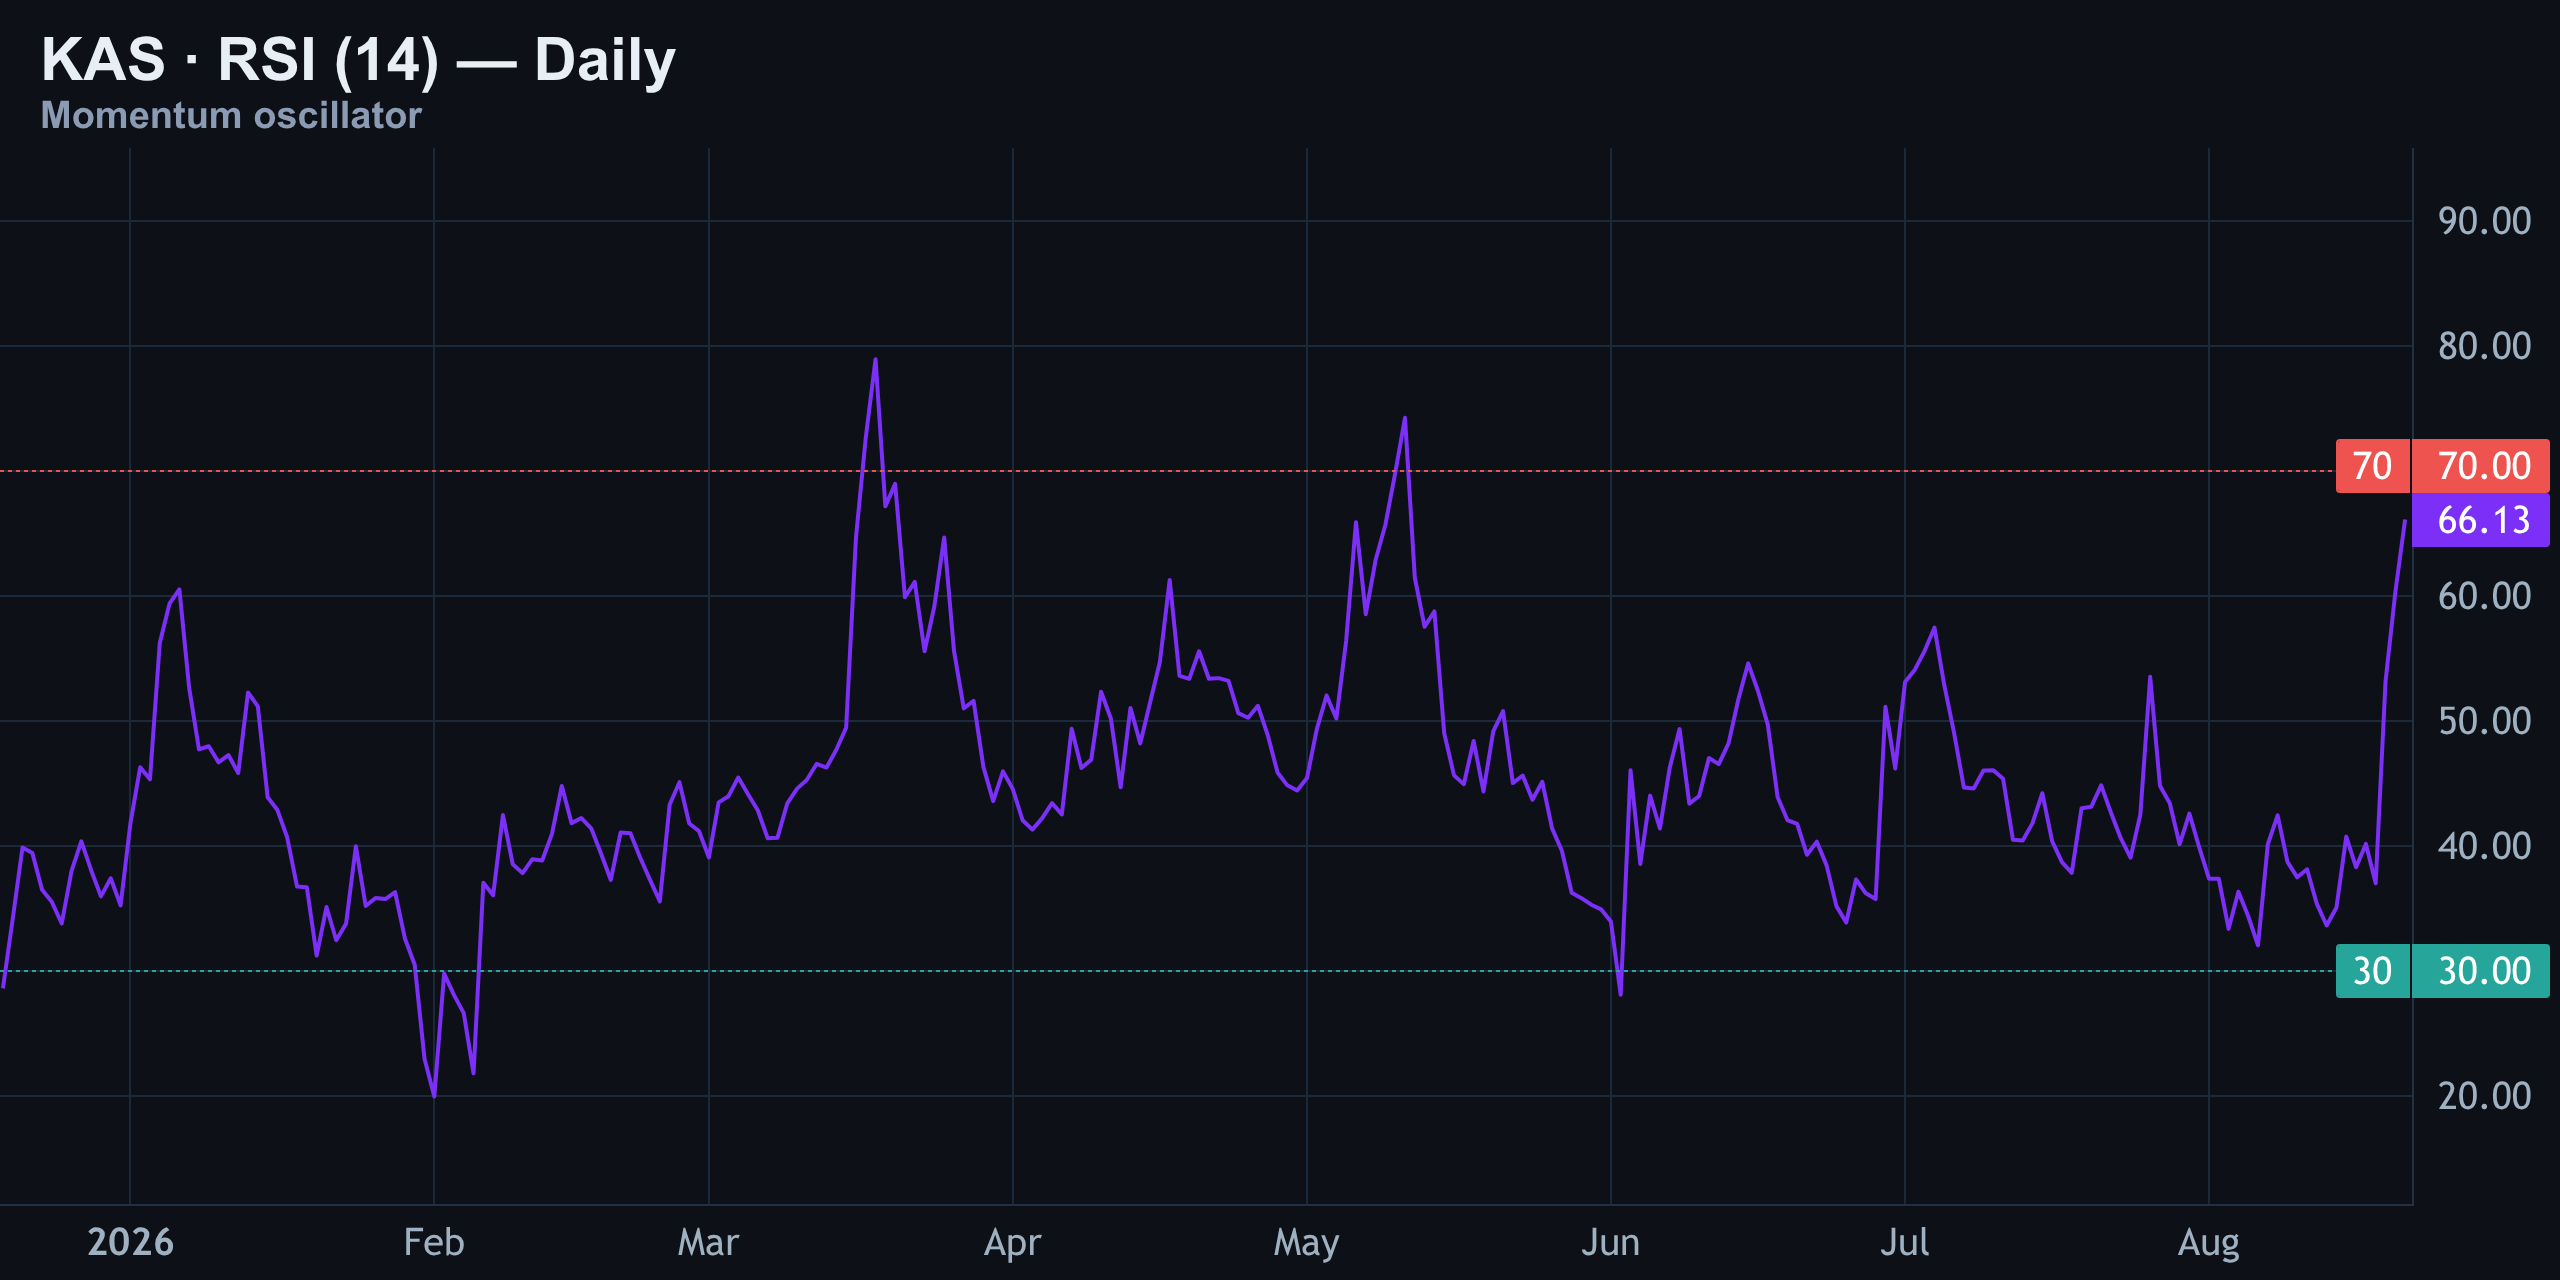
RSI can continue rising if KAS holds the $0.0293 area and breaks resistance. Conversely, a failure near $0.03 could cause momentum to cool quickly. RSI confirms improving pressure, but it does not guarantee a breakout.
MACD confirms improving pressure
The daily MACD is above its signal line and printing a positive histogram. This aligns with the four-hour breakout and the rising 15-minute channel. Momentum has clearly improved compared with the previous update.
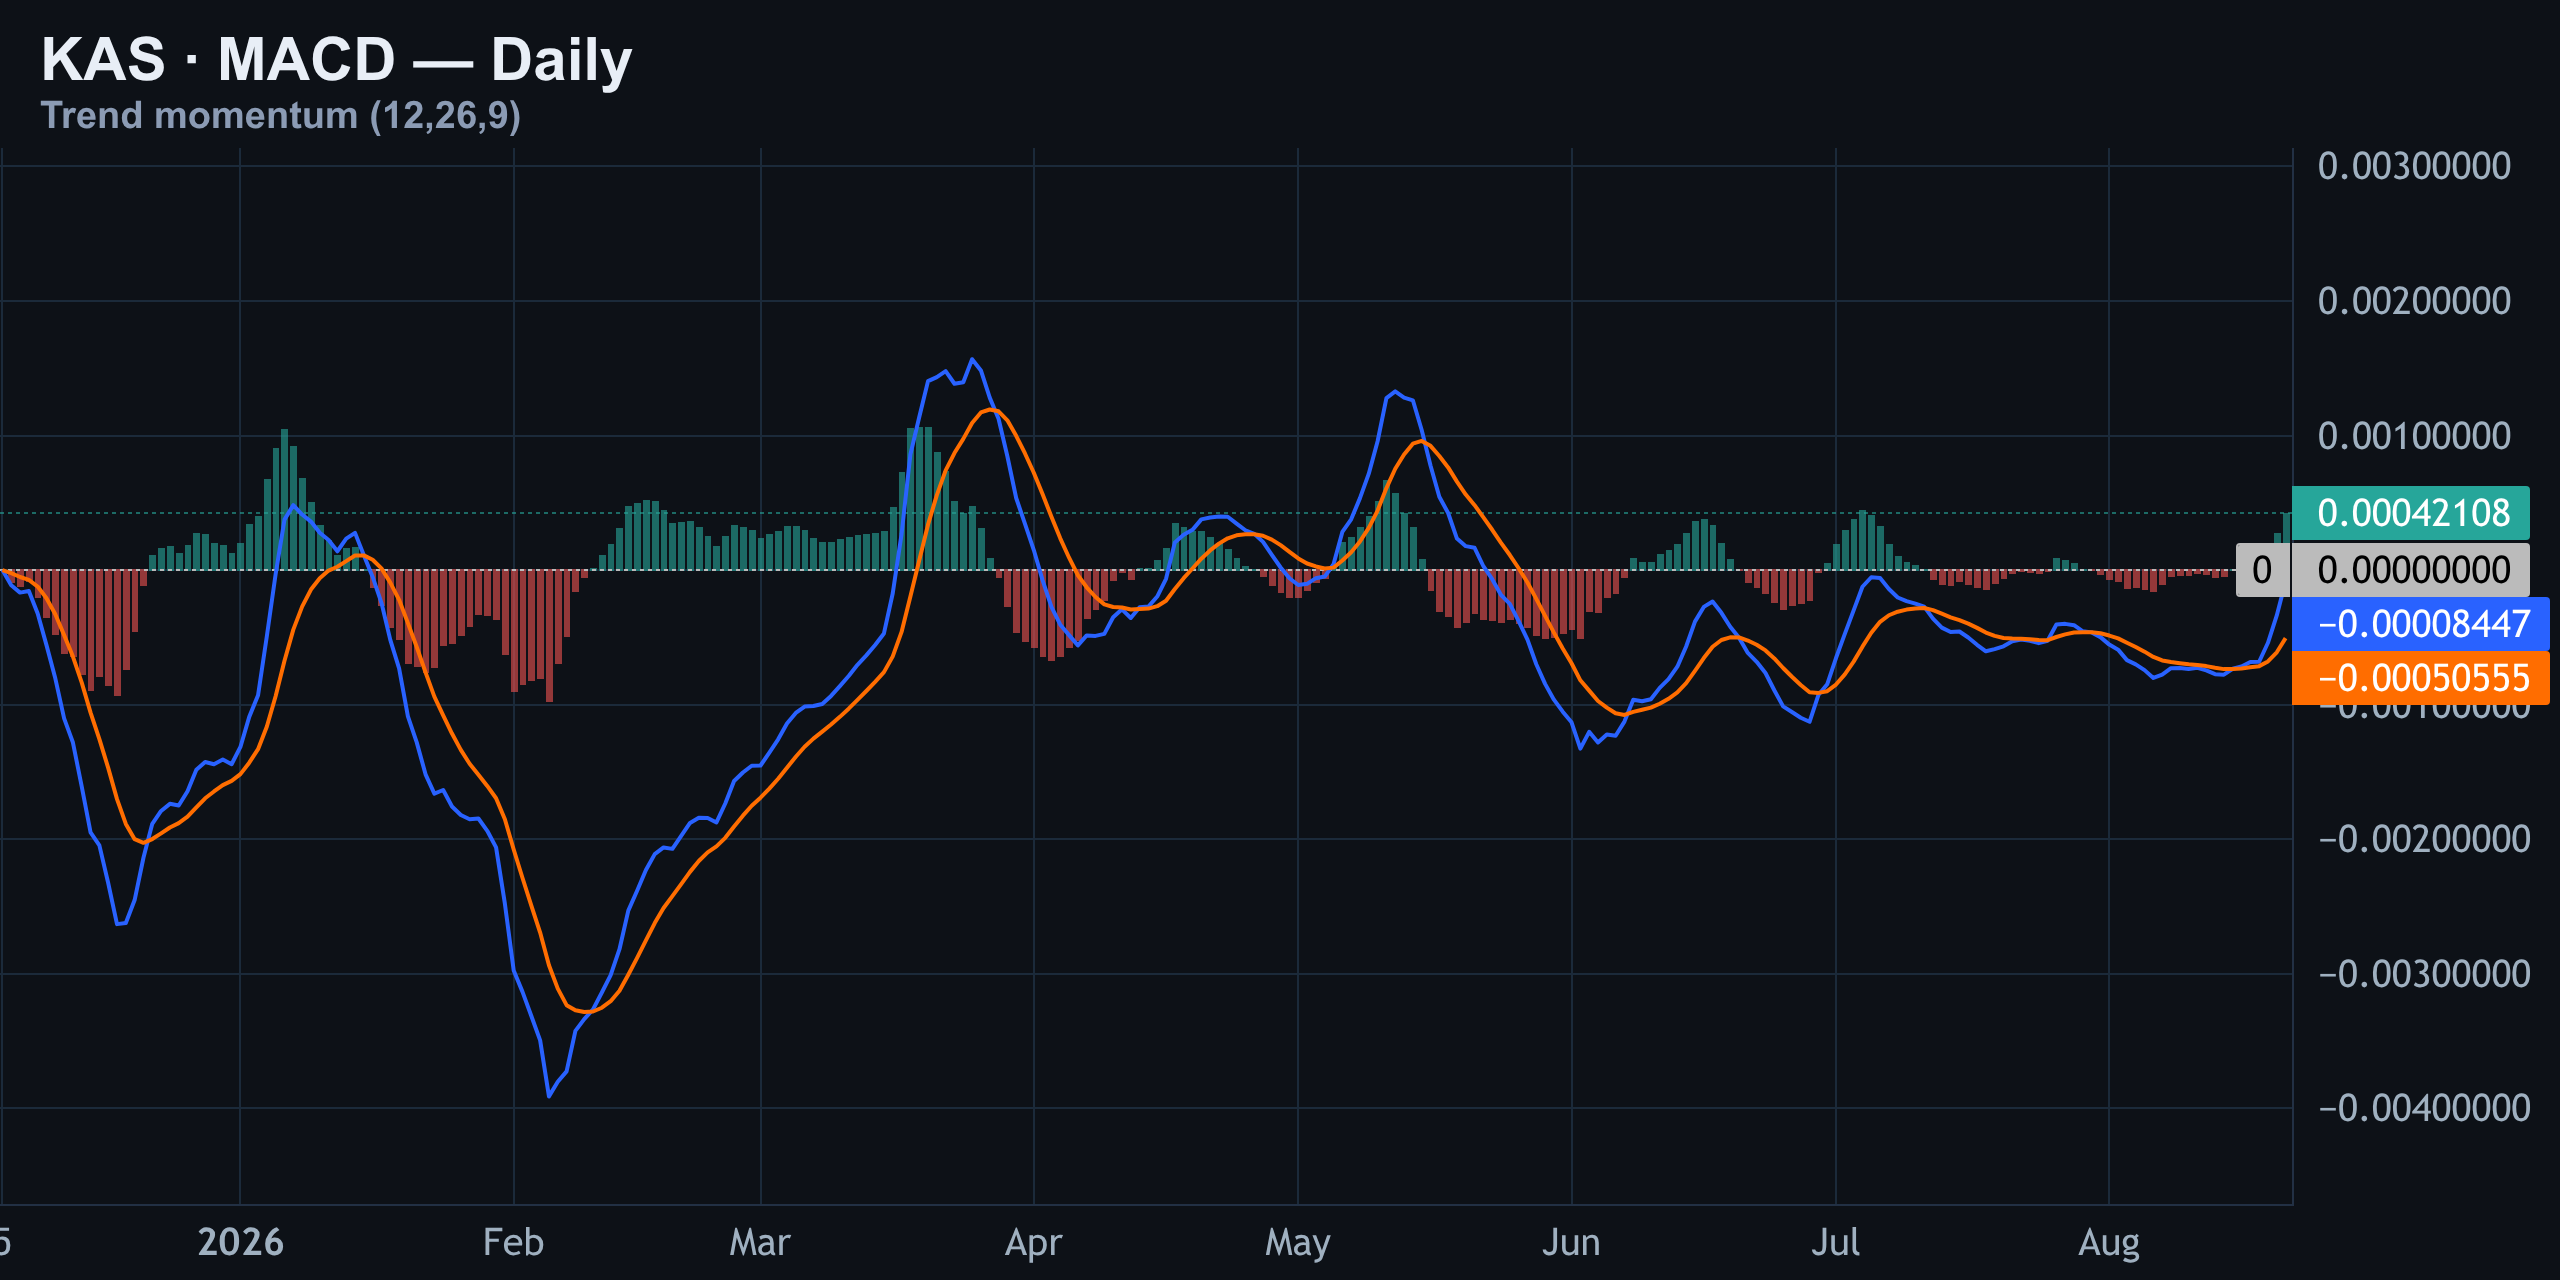
MACD is a confirmation tool, not a location tool. It tells us directional pressure has improved; it does not tell us that buying directly beneath resistance offers acceptable risk. The bullish MACD signal is valid but insufficient to force a trade while the moving-average range remains unresolved.
KAS Liquidation Heatmap and Positioning: Crowding Gives No Clear Edge
The liquidation picture adds an important layer to the chart analysis. Realised liquidation history is densest near $0.0258, with additional areas around $0.0292 and $0.0255. These zones do not predict price with certainty, but they identify areas where forced exits may create volatility if price travels into them.
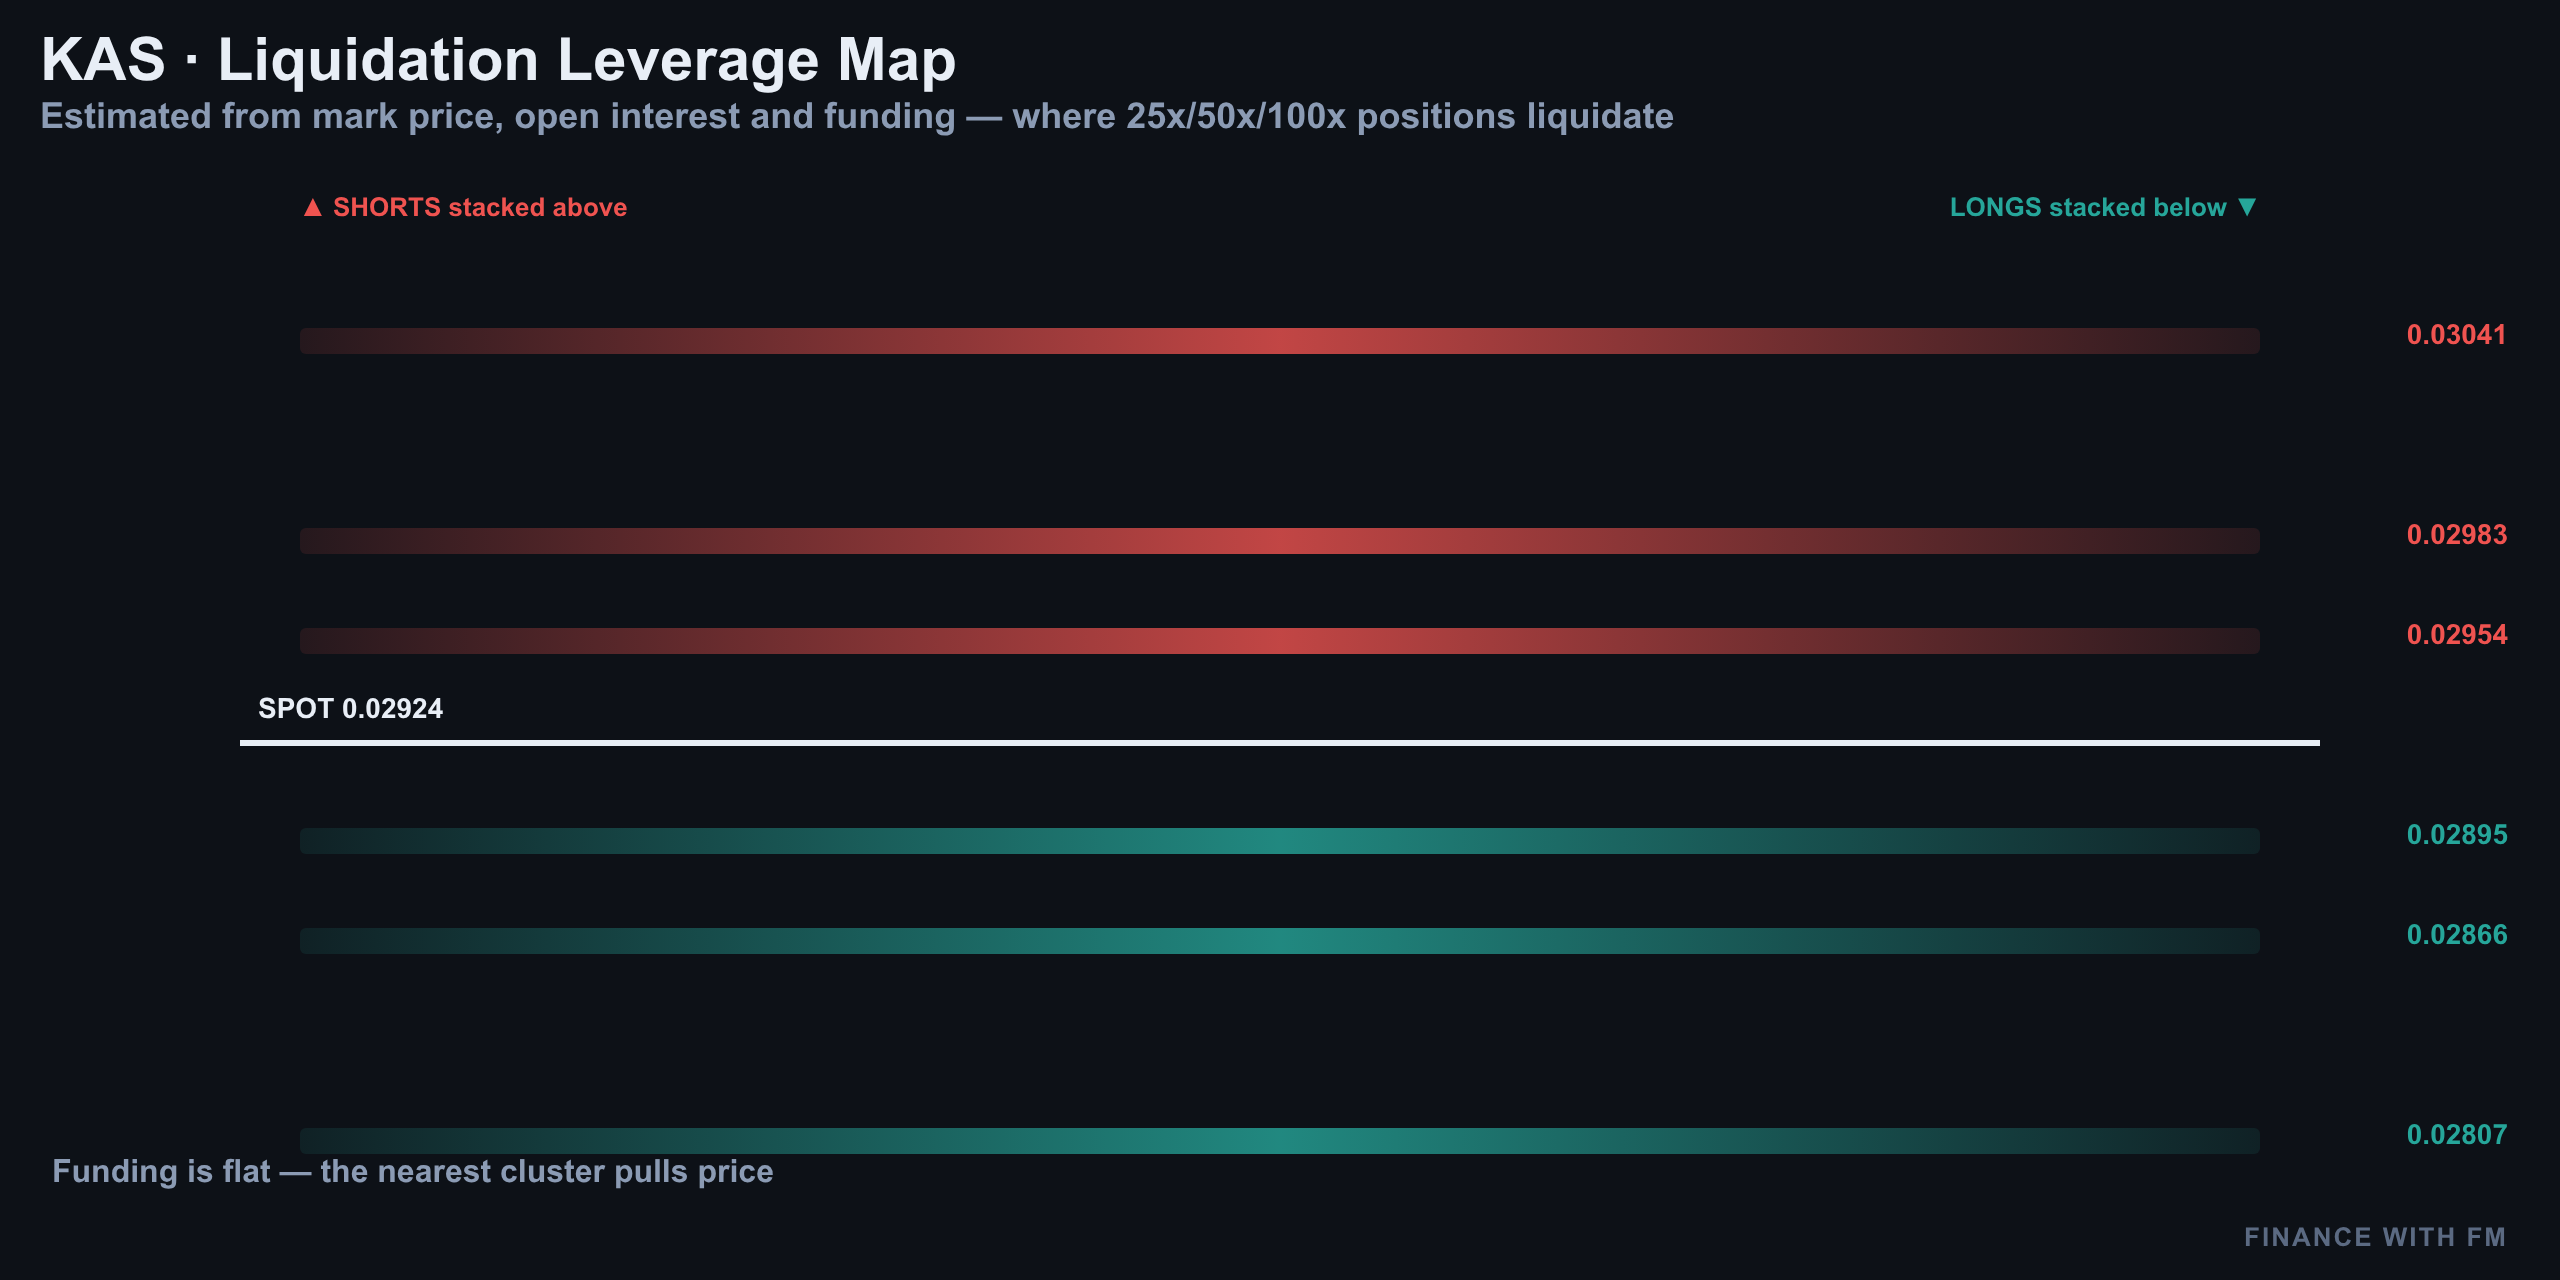
Below the market, the heavier long-liquidation pools create a potential downside magnet if $0.0276 fails. Above price, short-liquidation clusters may become relevant if KAS breaks cleanly through $0.03. With funding near neutral, neither side has created an extreme funding imbalance. The nearest and heavier cluster may attract price, but the direction of the next sweep still depends on which level breaks first.
Positioning is also aligned rather than providing a useful contrarian signal. Retail accounts are net long at approximately 1.94, while top traders are net long at approximately 1.23. When both groups lean long, there is no obvious positioning edge to fade. Alignment can support continuation, but it can also make the market vulnerable to a downside flush if nearby support gives way.
| Market input | Reading | Risk implication |
|---|---|---|
| Retail positioning | Net long, 1.94 | No clear retail-fade signal |
| Top-trader positioning | Net long, 1.23 | Professional positioning agrees with retail |
| Funding | Near neutral, about +5% APR | No strong long or short funding pressure |
| Liquidation history | Heavier pool below price | A support failure could trigger a downside sweep |
The practical lesson is simple: do not treat positive positioning as proof that price must rise. Positioning is context. Price structure still decides whether the market is accepting higher levels or rejecting them.
Levels to Watch for KAS Today and Tomorrow
The decision framework is built around two nearby levels: $0.0276 below and $0.0300 above. These levels matter more than distant targets because they define whether the current short-term structure is being preserved or challenged.
| Level | Price | Why it matters |
|---|---|---|
| Current market | $0.029287 | KAS is near the upper part of the short-term range |
| Breakout area | $0.0300 | Acceptance above it would improve the bullish bias |
| Intraday structure | $0.0276 | A hold keeps the higher-low sequence intact |
| Liquidation area | $0.0258 | A downside magnet if the structure test fails |
| Daily support | $0.0250 | Broader support beneath the current range |
| Broader resistance | $0.04095 | Longer-range resistance, not an immediate target |
A sustained move above $0.03 would change the decision. It would show that buyers can absorb nearby supply and may open room for a continuation setup, provided the retest holds and the stop location produces a sensible risk-to-reward ratio. A move below $0.0276 would weaken the bullish intraday thesis and shift attention toward $0.0258 and then $0.0250.
The word sustained is important. A quick wick above resistance is not enough. Traders should watch whether candles close above the level, whether volume expands, and whether a retest turns former resistance into support. Without those conditions, a breakout chase remains vulnerable to rejection.
Desk Decision: No Clean 1:2.5 Trade Today
The final decision is to stand aside. This is not a bearish call and it is not a judgment that KAS cannot move higher. It is a risk-management decision based on the current location of price.
A long entry near $0.0293 would be close to the $0.03 resistance area, leaving limited room before the first major obstacle. A stop beneath the relevant structure would be materially farther away, especially if the trade needs to survive normal intraday volatility. That combination does not currently offer the minimum 1:2.5 opportunity.
| Scenario | Confirmation | Desk response |
|---|---|---|
| Bullish continuation | Acceptance above $0.0300 and a successful retest | Reassess for a defined long setup |
| Range continuation | Repeated rejection near $0.0300 while $0.0276 holds | Remain patient and avoid chasing |
| Bearish deterioration | Clean loss of $0.0276 | Watch for a move toward lower liquidity and support |
| Trade quality today | Insufficient 1:2.5 risk-to-reward | No position |
This is exactly where discipline matters. The market has improved enough to tempt late buyers, but not enough to eliminate structural uncertainty. Waiting for either a confirmed breakout or a better-defined pullback is more professional than entering simply because the daily candle is green.
KAS Daily Pulse Summary
KAS is stronger than it was in the previous update. The 15-minute chart is producing higher lows, the four-hour structure has improved, RSI is constructive at 66, and MACD is above its signal line with a positive histogram. Those are legitimate bullish developments.
But price is now testing resistance near $0.03 while the broader structure remains trapped between major moving averages and inside an unresolved daily channel. Retail and top traders are both net long, funding is near neutral, and the liquidation map shows meaningful downside pools beneath price. The market may continue higher, but the current location does not offer a clean asymmetric trade.
For the next session, $0.0276 is the level that protects the short-term bullish structure, while $0.03 is the level that can change the bias if buyers achieve acceptance above it. Until one of those conditions develops, the Finance With FM desk remains neutral and patient.
For broader market reference, traders can compare live KAS market data on CoinGecko and review chart structure on TradingView. Always verify prices, liquidity, and execution conditions before making a trading decision.
Previous days
08/19/2026 — KAS Daily Pulse Aug 19: Rally Hits Wall, Divergence Builds
KAS Daily Pulse Aug 19: Rally Hits Wall, Divergence Builds
Where We Left It — And Where KAS Stands Right Now
Yesterday's Daily Pulse stood aside on KAS. The best setup on the table only offered a 1:2.4 risk-reward, just short of our bar, so we passed rather than force a trade. That patience paid off: KAS rallied roughly 1.5% overnight, climbing from about 2.53 cents to 2.57 cents, and that exact move is what pushed price into today's resistance cluster and finally opened up a clean 1:2.6 setup. No trade was live yesterday, so there's nothing to score — just a disciplined call that let better structure come to us.
KAS is trading near 2.57 cents as we publish, up about 1.5% on the day. The bounce off support is real, but it's running straight into a stacked liquidation zone overhead. Underneath the price action, momentum is quietly improving — RSI is showing a bullish divergence and MACD just flipped positive — yet the immediate structure still favors a fade before any reversal gets confirmed.
15-Minute Chart: Ascending Channel Into Resistance
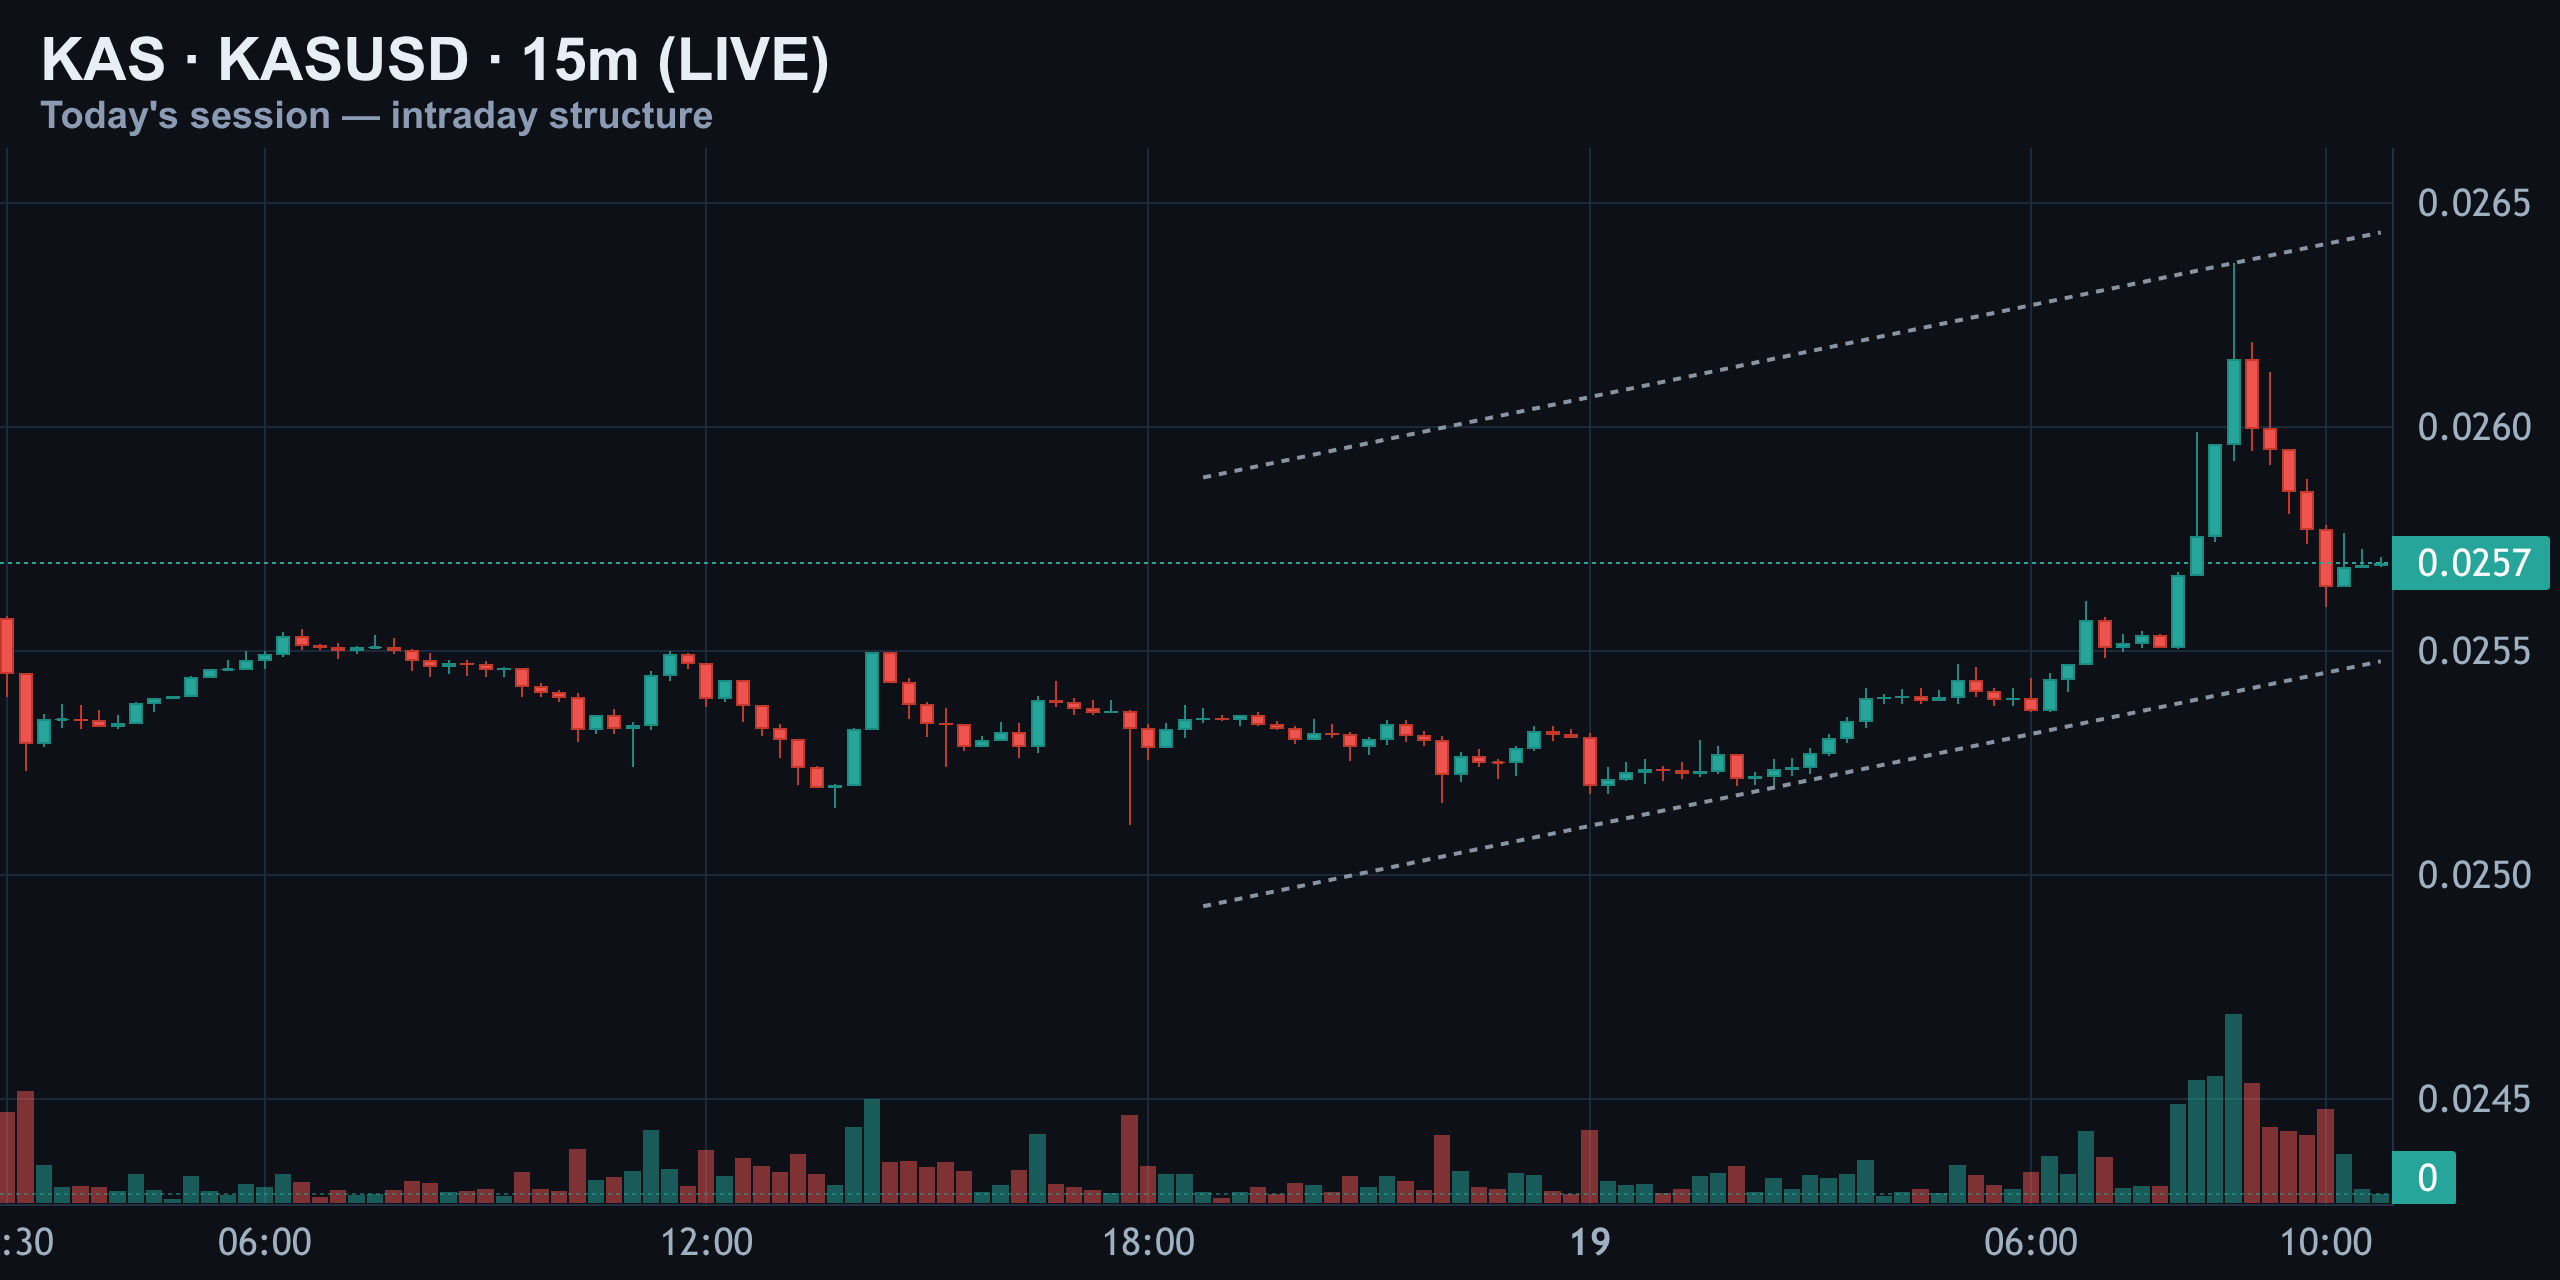
Zoom into the 15-minute chart and today's story is a clean ascending channel. Price bottomed near the 2.55-cent shelf overnight, then ground higher candle after candle, finally spiking to about 2.61 cents before sellers stepped in hard. That spike printed the session's biggest volume bar — a strong tell that this was liquidity getting swept, not organic demand chasing price higher.
Price has since cooled back toward 2.57 cents, still technically inside the rising channel, but the wick rejection at the top is the first visible crack in an otherwise orderly uptrend. In plain terms: KAS climbed steadily today but got slapped down right near the top of its own channel.
4-Hour Chart: Descending Channel Rejected Near 0.0267
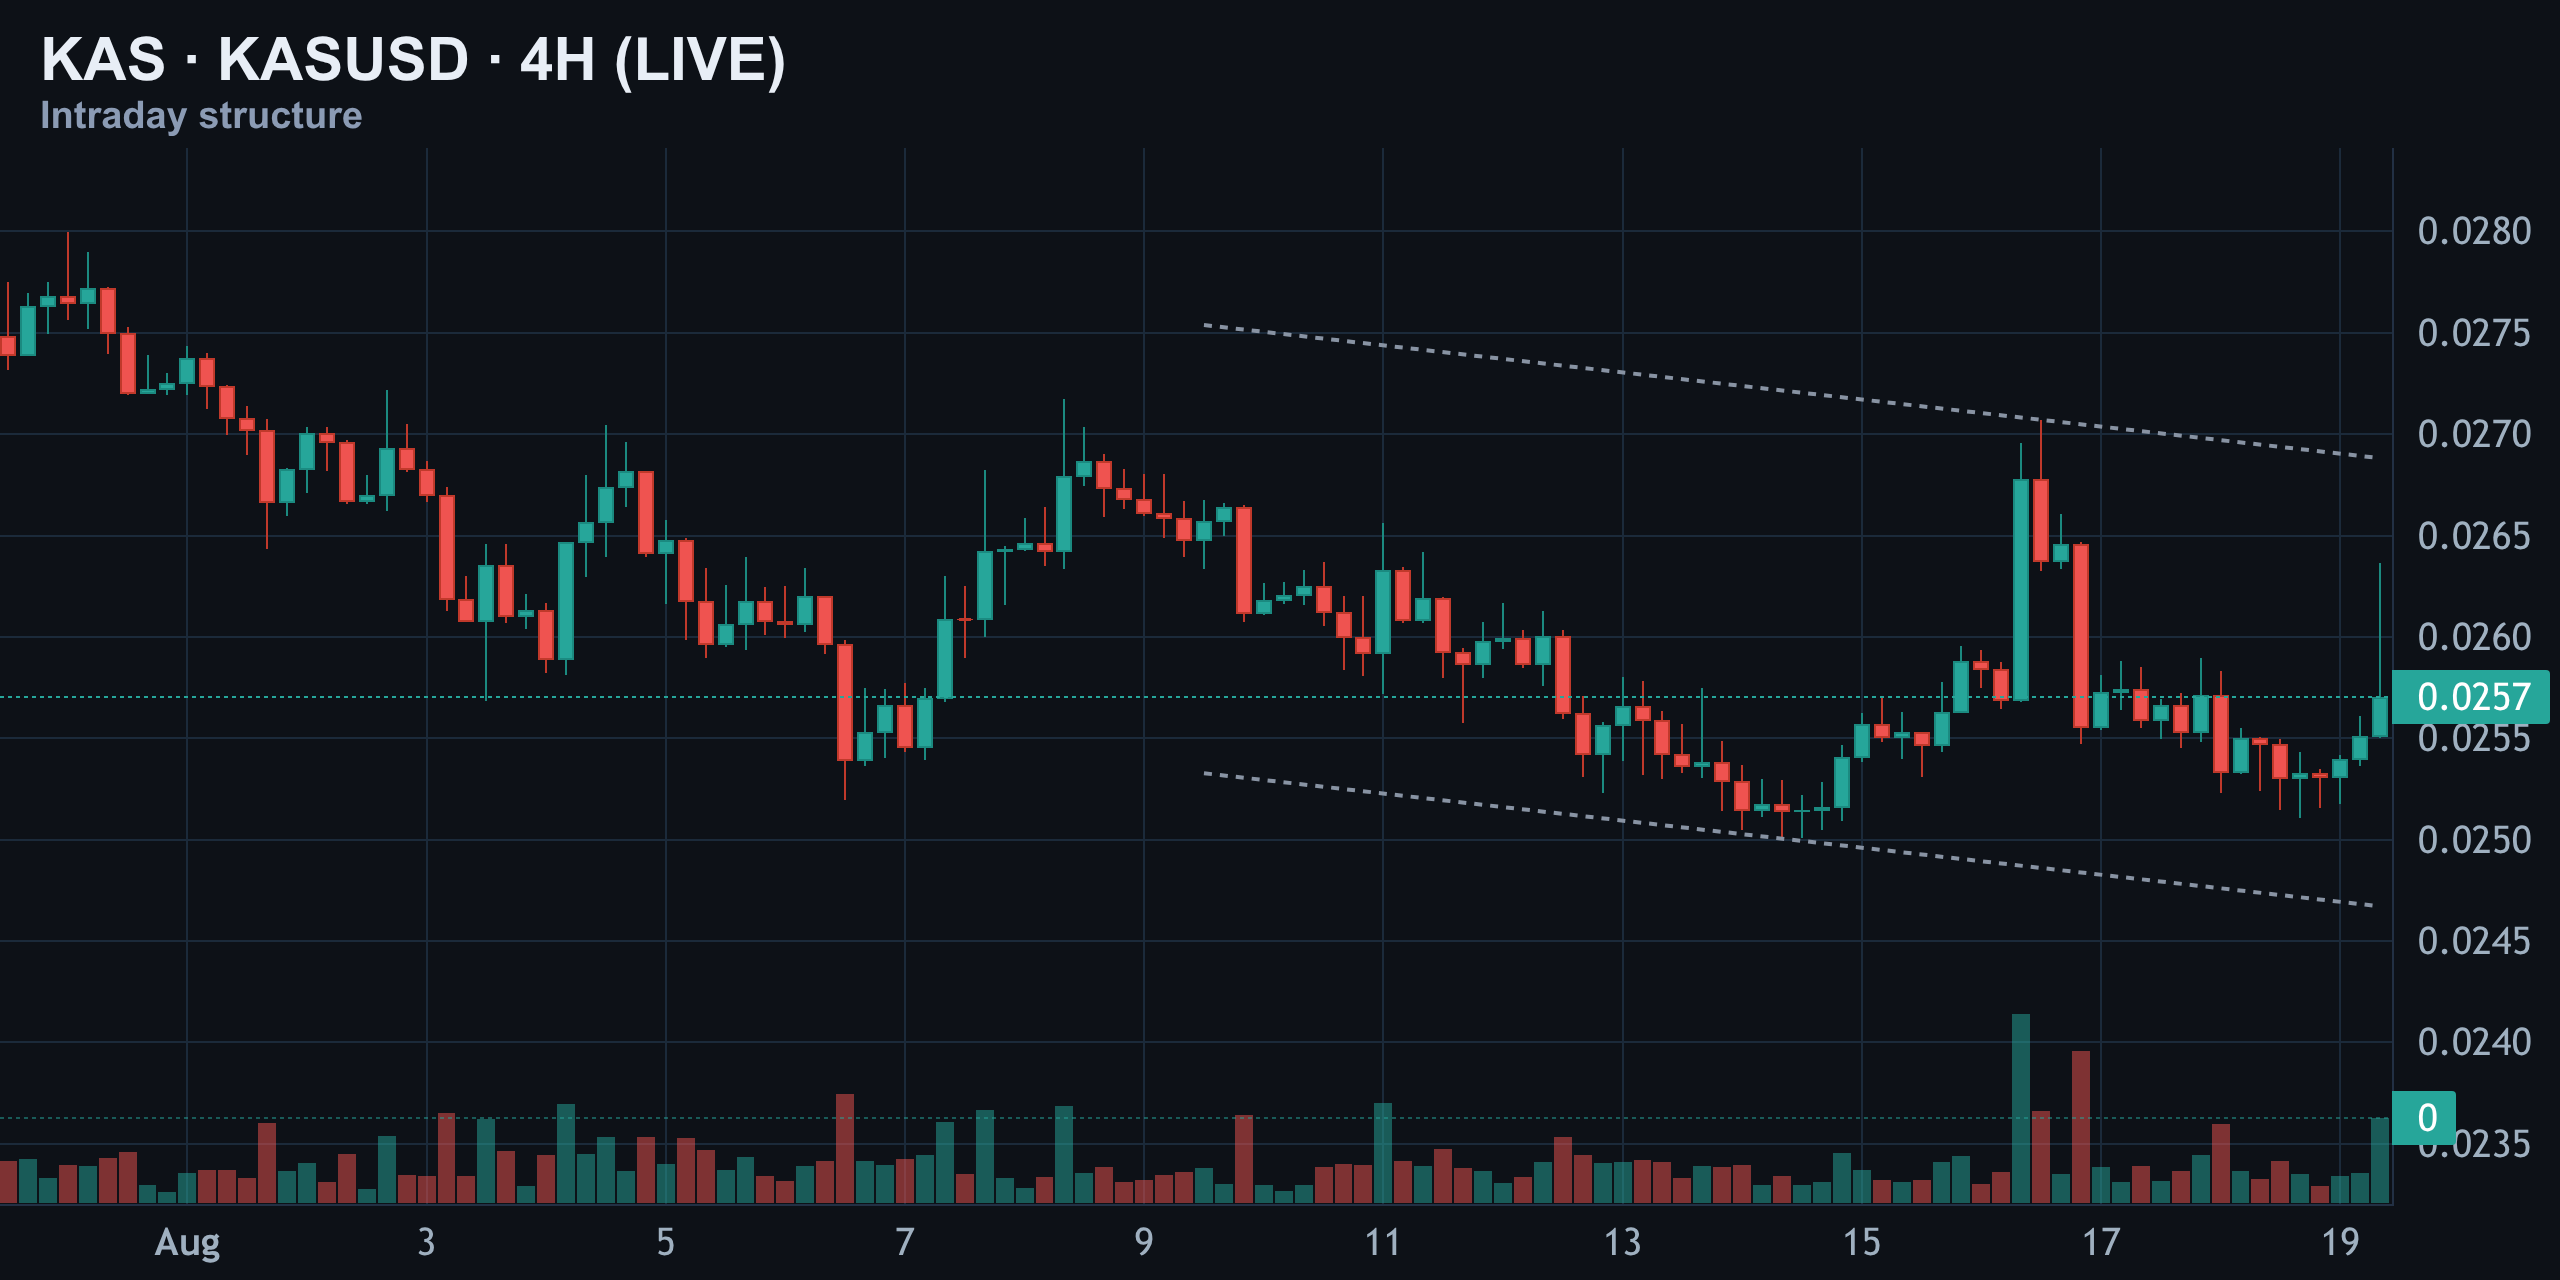
Step back to the four-hour timeframe and the bigger picture sharpens. KAS has been carving a descending channel since mid-August, and today's rally actually punched right through that upper trendline near 2.70 cents — only to get rejected almost immediately, leaving a long red wick around 2.67 cents. That's a textbook false-breakout signature: a clean break that fails to hold and snaps straight back.
Price has since slid back toward the 2.55–2.57 cent zone, right where the last few sessions have been building a base. The four-hour structure stays technically bearish until that descending trendline actually reclaims and holds on a closing basis. In plain terms: KAS tried to break higher but got pushed straight back down.
Daily Chart: Sitting On The 0.025 Floor
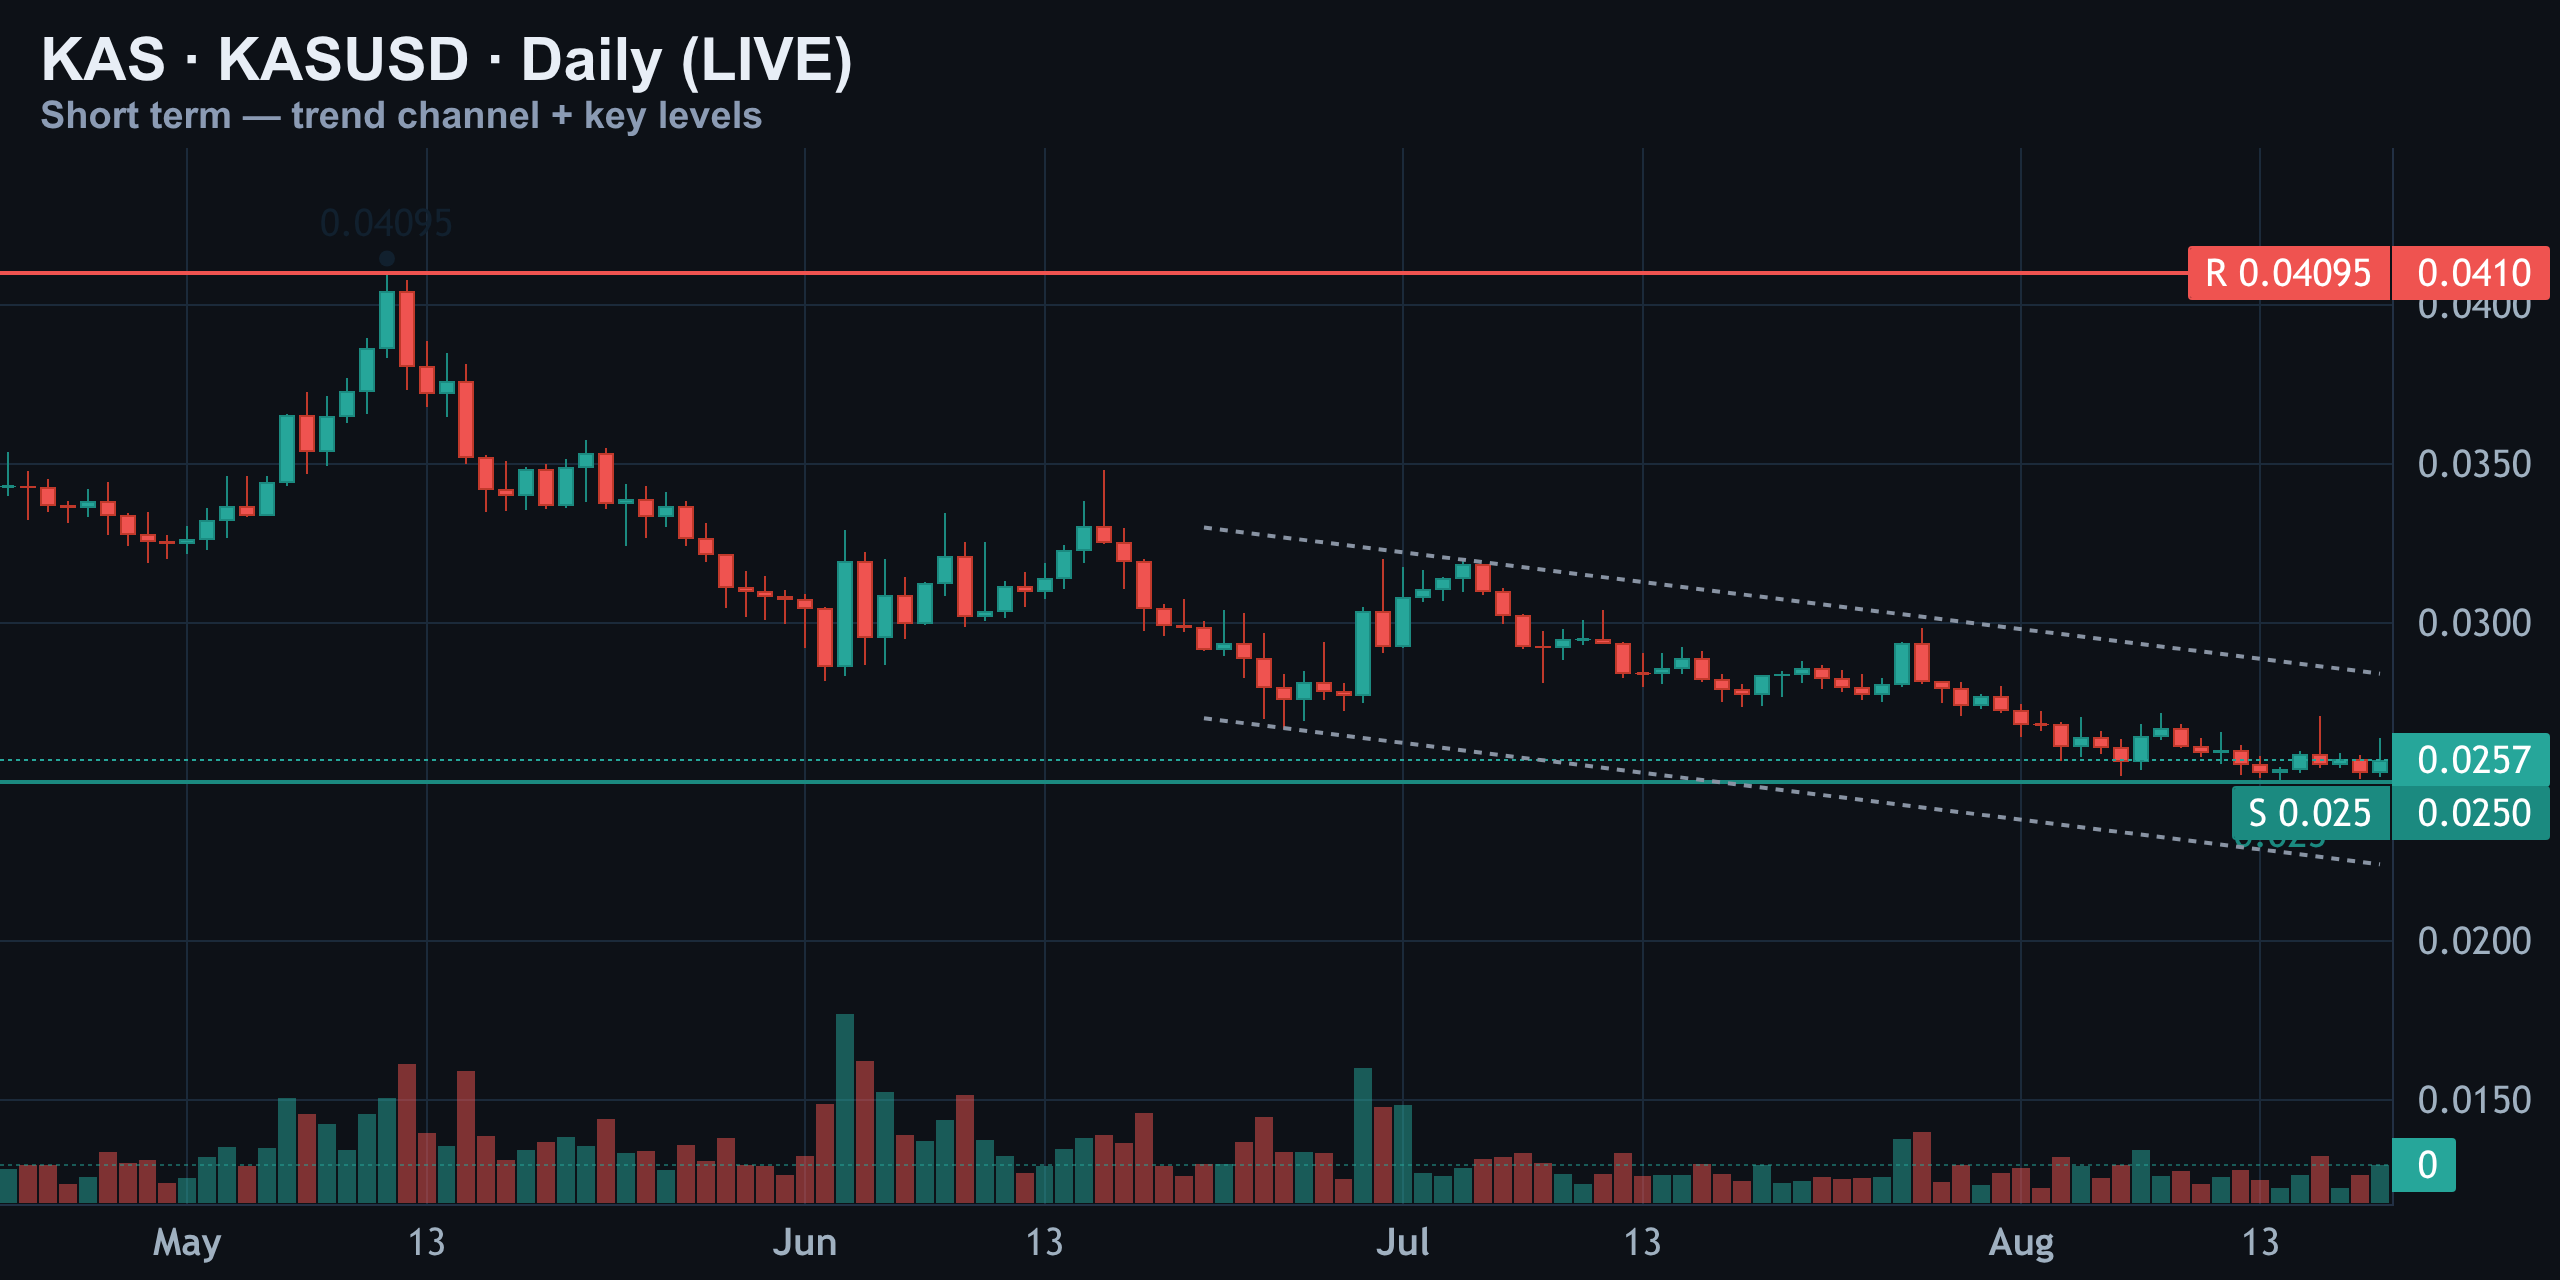
On the daily chart, the dominant trend since July has been one long descending channel, and KAS is currently parked right on its support shelf near 2.5 cents. The old resistance up near 4 cents from May is ancient history at this point — completely irrelevant to today's setup — but the local support at 2.5 cents lines up almost exactly with today's live price.
This zone has absorbed selling pressure for over a week now. As long as daily closes hold above it, the bigger downtrend has a fighting chance of stabilizing rather than accelerating lower. In plain terms: KAS is resting on a floor that's held for more than a week — but it hasn't broken free of it yet either.
RSI & MACD: The Divergence Brewing Underneath
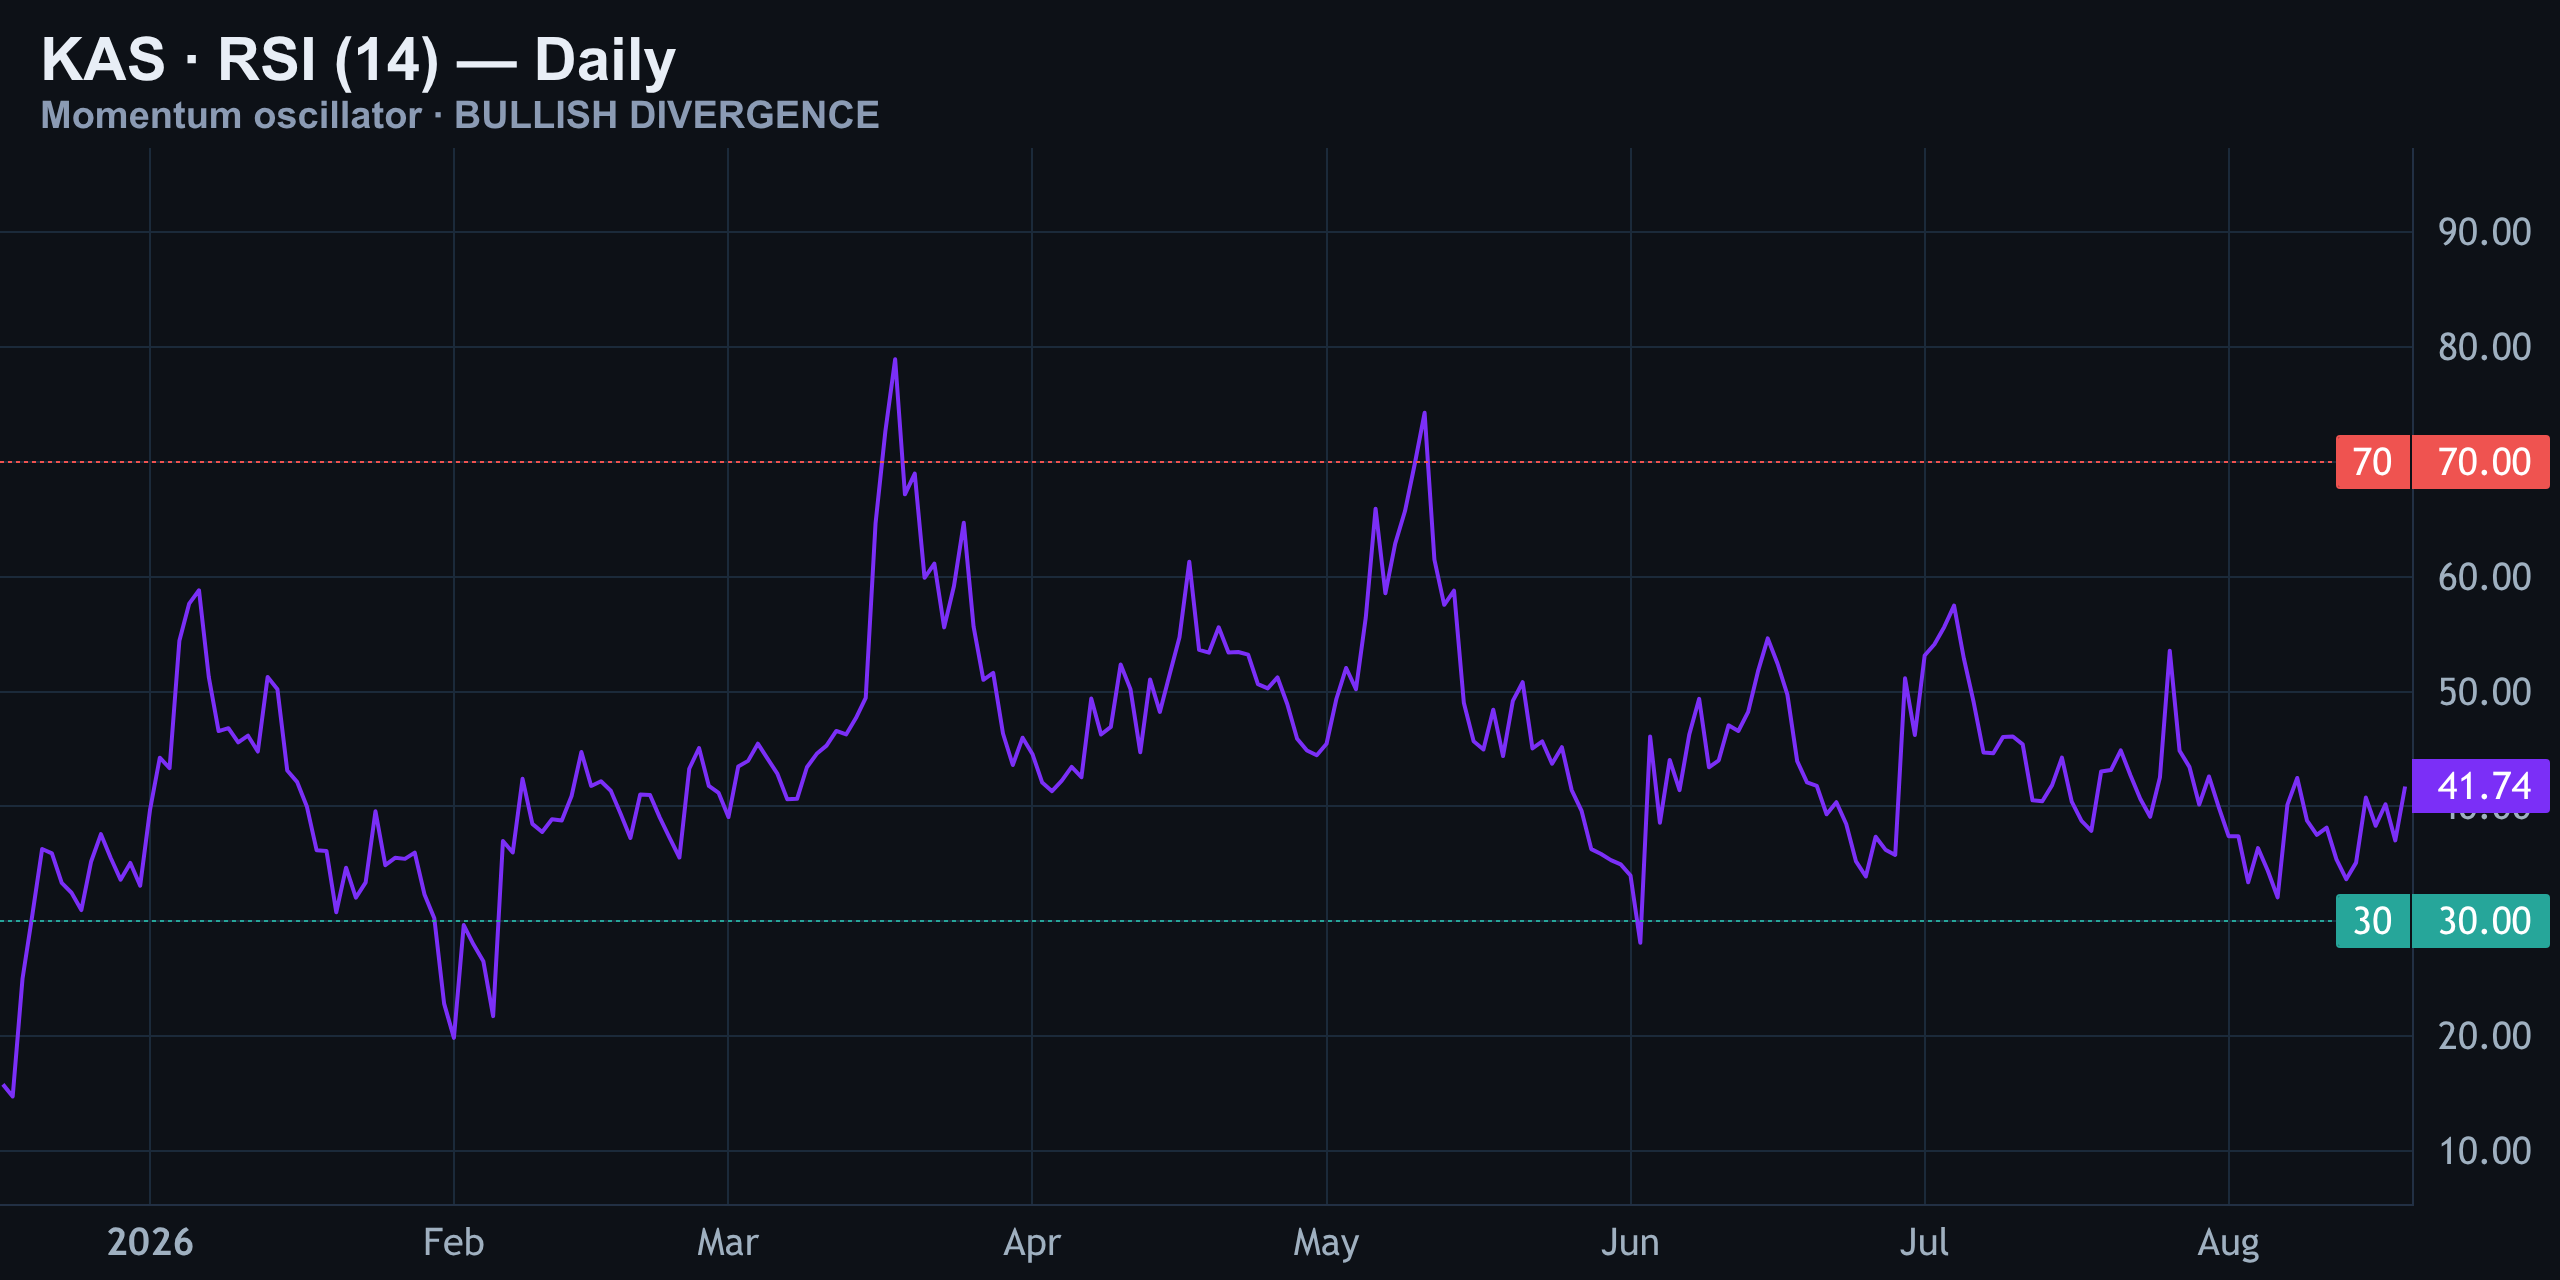
RSI (14) sits at 42 right now — dead neutral, no extreme in either direction. But look closer at the last two swing lows: price made a lower low, dropping to about 2.50 cents versus the prior 2.52-cent low, while RSI actually made a higher low, 35 versus 32. That's textbook bullish divergence — downside momentum is fading even as price grinds lower.
| Swing | Price Low | RSI Low |
|---|---|---|
| Prior swing low | 2.52 cents | 32 |
| Latest swing low | 2.50 cents | 35 |
It doesn't confirm a reversal on its own, but it's exactly the kind of quiet clue that tends to show up before sellers start losing control. In plain terms: price fell, but momentum didn't fall as much — a warning sign for sellers.
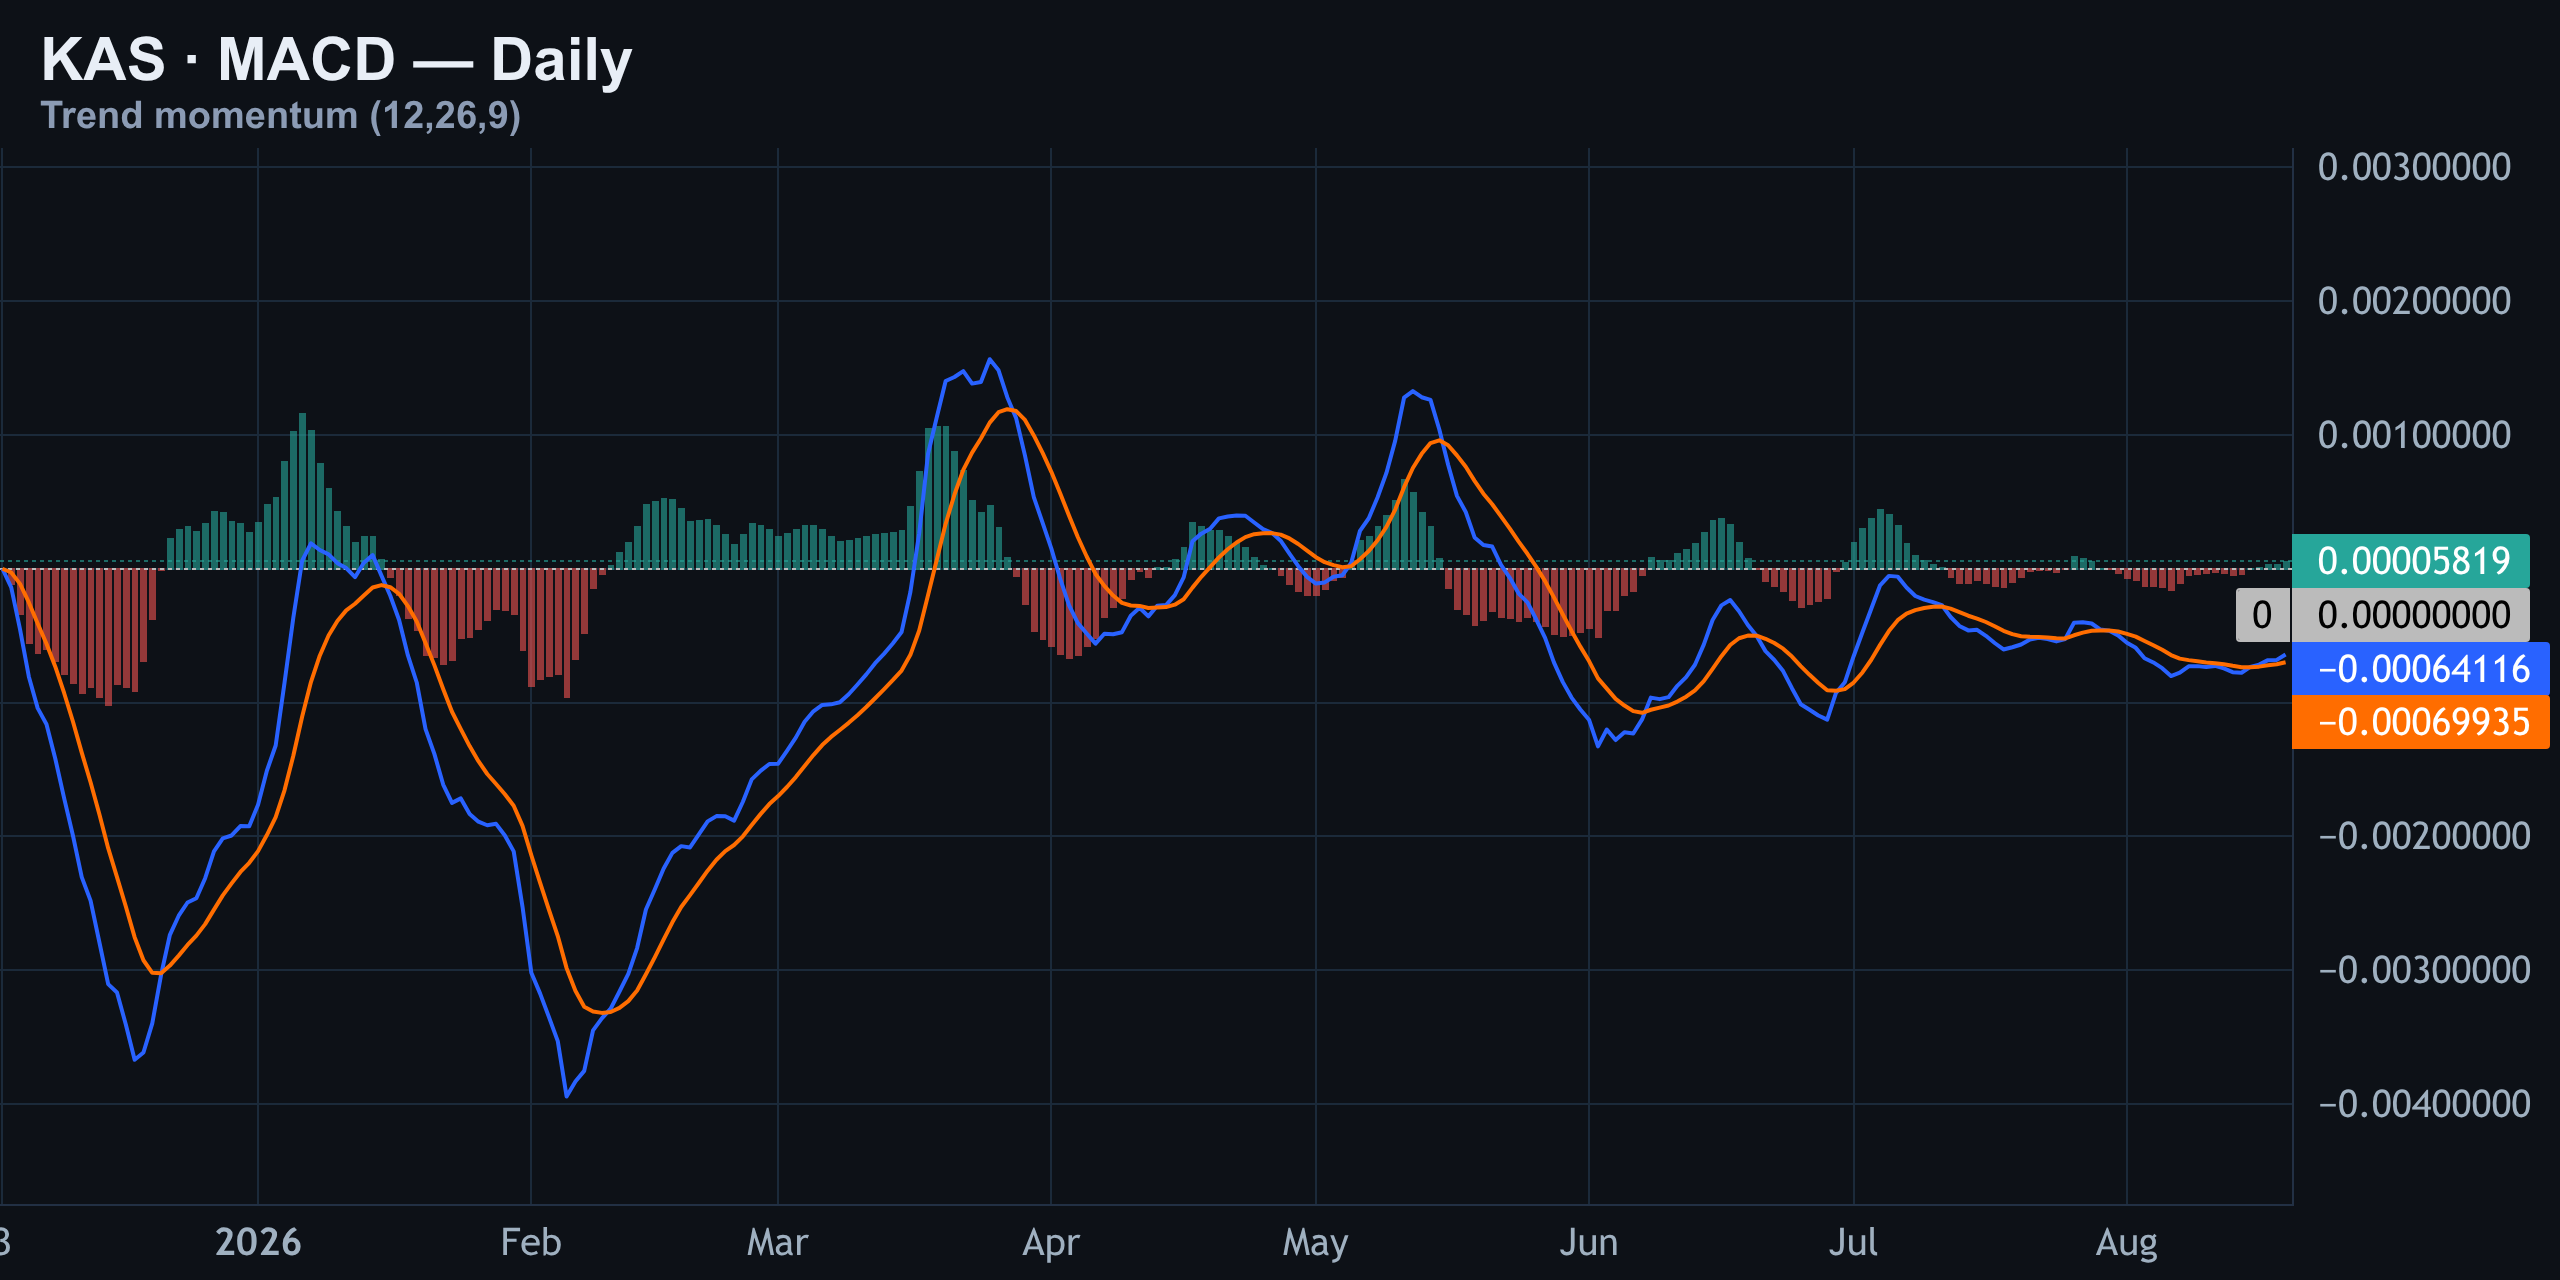
MACD backs up that divergence story. The MACD line has crossed back above the signal line, and the histogram just turned positive for the first time in days. Both lines are still sitting below the zero line, though, which means this is an early-stage momentum shift, not a confirmed trend change.
Levels To Watch: The Liquidation Map And Today's Trade Setup
Right now KAS trades near 2.57 cents. Above spot, two liquidation clusters sit at 2.59 cents and 2.64 cents — these are recent flush zones, not magnets pulling price toward them. Below spot, the densest liquidation zone and near-term support cluster around 2.55 cents.
| Level Type | Price | Approx. Size |
|---|---|---|
| Liquidation cluster (above) | $0.0259 | $28,000 |
| Liquidation cluster (above) | $0.0264 | $23,000 |
| Entry trigger | $0.0260 | — |
| Stop / invalidation | $0.0265 | — |
| Densest liquidation zone (below) | $0.0255 | $157,000 |
| Liquidation cluster (below) | $0.0255 | $28,000 |
| Liquidation cluster (below) | $0.0254 | $23,000 |
| Trade target | $0.0247 | — |
These are prices where leverage has already been cleared out recently — meaning they mark levels the market has already fought over, not levels it's now aiming for. The densest single zone on the book sits at 2.55 cents, directly below current price, which lines up with the daily support shelf discussed earlier.
Today's Macro Drivers Beyond The Chart
Today's macro tape is regulatory, not KAS-specific. The SEC is teeing up a significant overhaul of crypto rules while the CLARITY Act continues to languish in Congress, effectively moving to fill the regulatory gap on its own.
Two proposals are moving in parallel: a one-time fundraising exemption that would let crypto projects raise up to $5 million over a four-year period without full registration, alongside a separate accounting-standards discussion around treating certain digital assets differently on issuer books.
A second, larger fundraising exemption track under discussion would let issuers raise as much as $75 million over one year, alongside a proposed safe harbor for crypto issuers — a notably more permissive framework than anything crypto projects have had access to before.
That said, nothing here is finalized — commissioners have already delayed at least one scheduled vote on these exact exemptions, underscoring that this is a slow-moving, multi-month process rather than an imminent green light.
None of this is KAS-specific, but it's mildly constructive for the industry's plumbing longer term — easier fundraising rules and clearer accounting treatment reduce friction for the broader altcoin ecosystem KAS trades inside of. Meanwhile Bitcoin remains stuck in its six-week range as bond yields sit at decades-highs, keeping risk appetite for smaller-cap alts like KAS in check for now.
Summary — And Why This Isn't Financial Advice
- KAS bounced ~1.5% to 2.57 cents but ran straight into a stacked liquidation/resistance cluster at 2.59–2.64 cents.
- The 4-hour chart shows a false breakout above its descending channel, rejected hard near 2.67 cents.
- Daily chart: KAS is sitting on the 2.5-cent support shelf that's held for over a week.
- RSI (42) shows bullish divergence — higher low in momentum vs. a lower low in price.
- MACD histogram just turned positive, but both lines remain below zero — early signal, not confirmation.
- Trade plan: entry 2.60 cents, stop 2.65 cents, target 2.47 cents — a 1:2.6 setup.
08/18/2026 — KAS Daily Pulse Aug 18 2026: Bearish Price, Bullish RSI Divergence
KAS Daily Pulse Aug 18 2026: Bearish Price, Bullish RSI Divergence
Where We Left It: The Short Is Still Working
Since our last call, KAS has moved down about 1.4%, sliding from roughly $0.0257 to around $0.0253 today. That's consistent with the broader slide the token has been on for weeks — KAS is now trading near $0.0253, down about 1.4% on the day, according to real-time pricing data.
The prior short call — entry near $0.026, stop at $0.0265, target $0.0247 — is still live and still tracking in the right direction. Price hasn't tagged the stop, and it hasn't tagged the target yet either. No changes to that position. It's just steady progress toward the objective.
15-Minute Intraday: The Session's Fake-Out and Fade
Zooming into the current session, the tape told a clean story of hope followed by disappointment. An early push higher toward $0.026 got sold hard, spiking price down through $0.025 before dip-buyers stepped in. That bounce reclaimed $0.0254 briefly — and then started rolling over almost immediately.
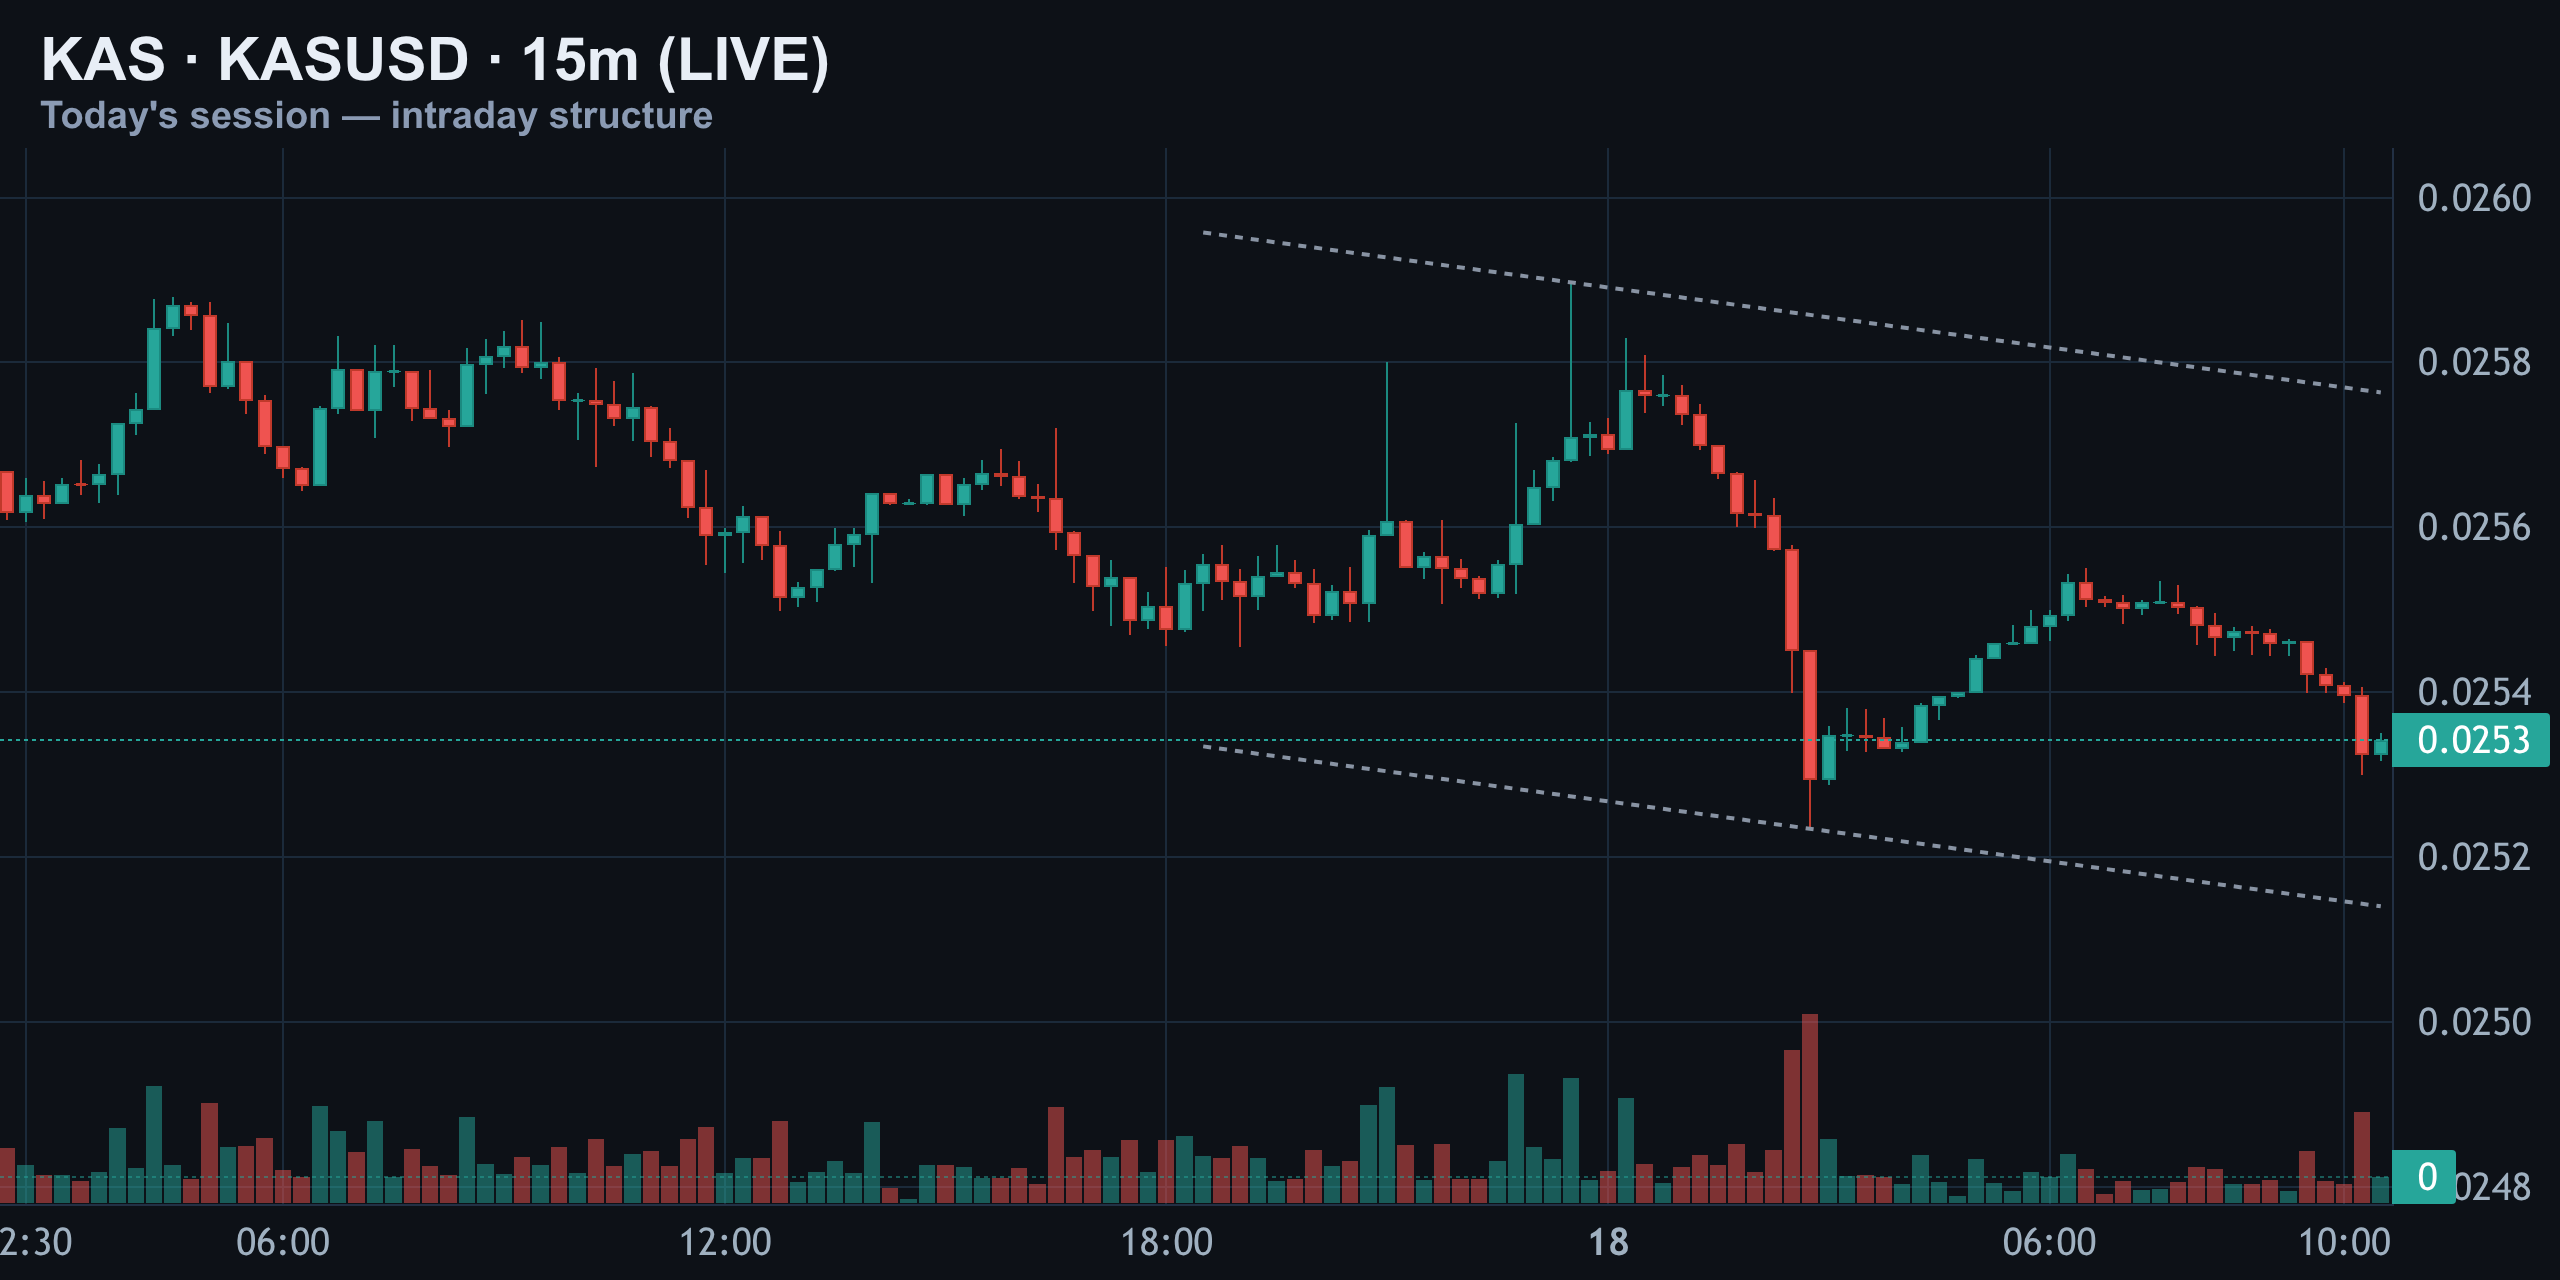
We're now sitting inside a descending channel on the intraday chart, with lower highs stacking since the mid-session flush. Spot is hugging the bottom of that structure around $0.0253. In plain terms: KAS spiked down hard today, bounced, then started fading again — a fake-out that trapped late buyers.
4-Hour Structure: Still Boxed in a Falling Channel
Widen the lens to the 4-hour chart and the same descending channel appears, just with more room to breathe. Since the end of July, every single rally attempt has topped out lower than the last.
| Rally Attempt | High Reached |
|---|---|
| Late July bounce | $0.028 |
| Early August bounce | $0.027 |
| Aug 16 wick | $0.0267 |
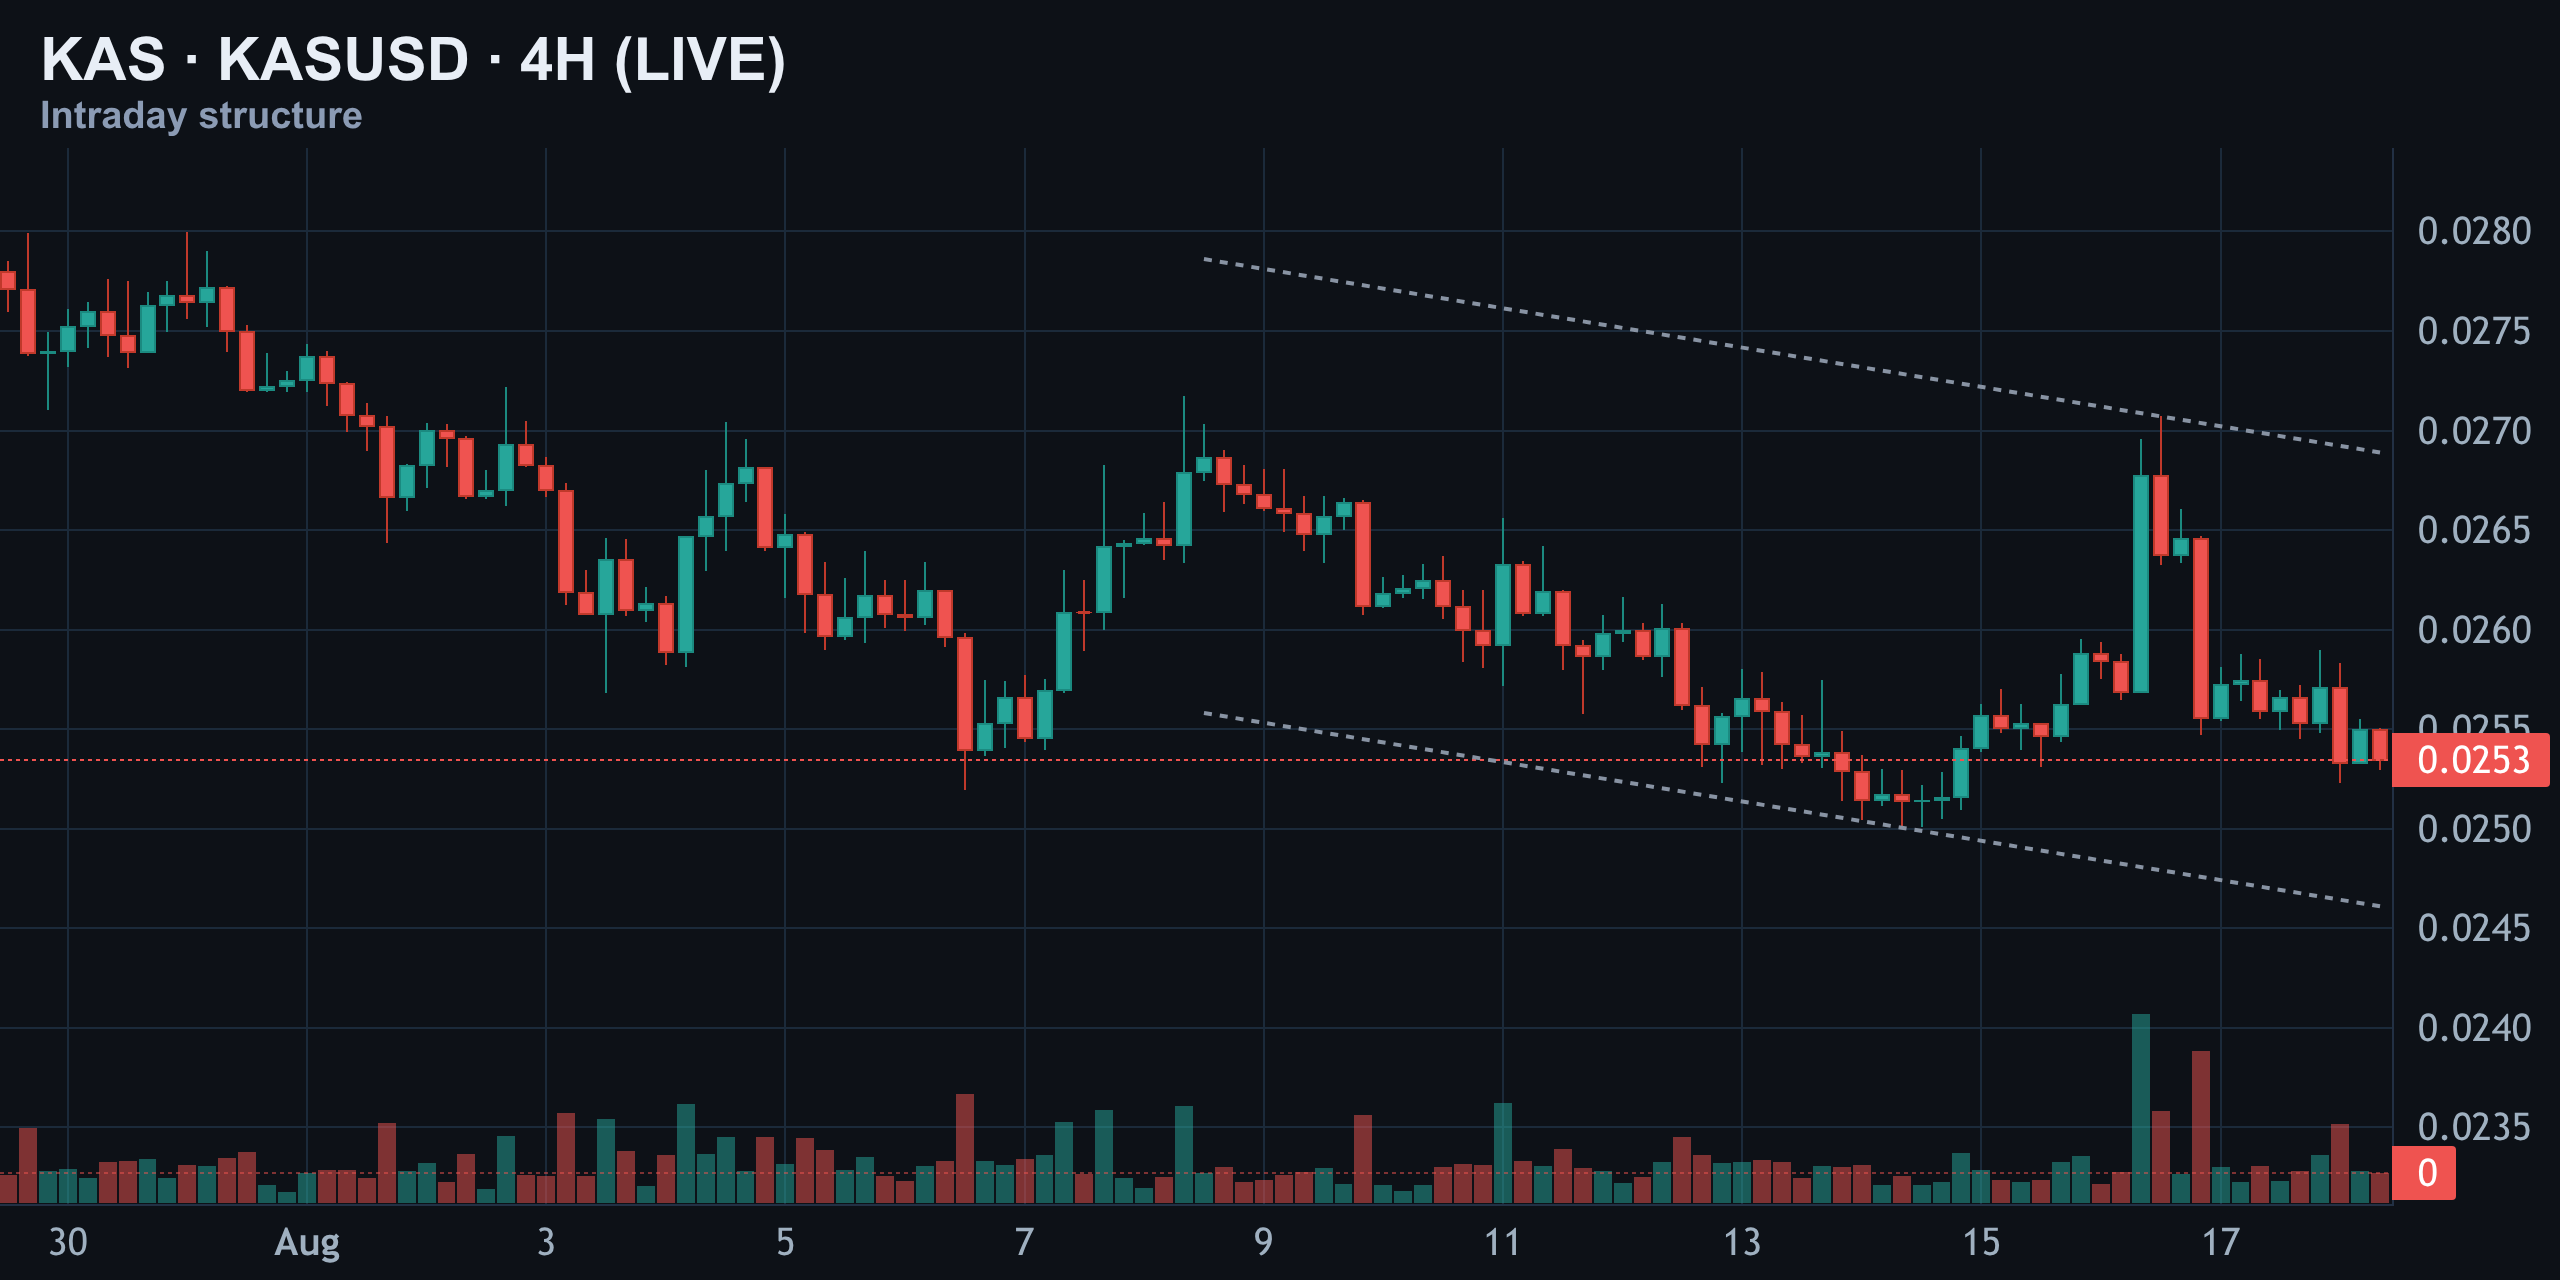
That August 16th wick was the most recent attempt to break the pattern, and it failed. Right now, price is pressing against the lower boundary of that channel near $0.0253 — exactly where today's indecision is playing out. In plain terms: KAS keeps making lower highs, the same downtrend that's been intact for three weeks.
Short-Term Daily: The Bigger Downtrend Hasn't Broken
The daily chart is the honest one. KAS is down roughly 38% from its May high near $0.041, and the structure since late June has been a clean descending channel — lower highs and lower lows in lockstep. Longer-range forecasts still see this level as a meaningful floor, with several models projecting a 2026 trading range broadly between the low-$0.02s and mid-$0.05s depending on adoption catalysts.
| Level Type | Price |
|---|---|
| Major resistance | $0.041 |
| Major support | $0.025 |
| Current spot | $0.0253 |
| 30-day change | approx -10% to -14% |
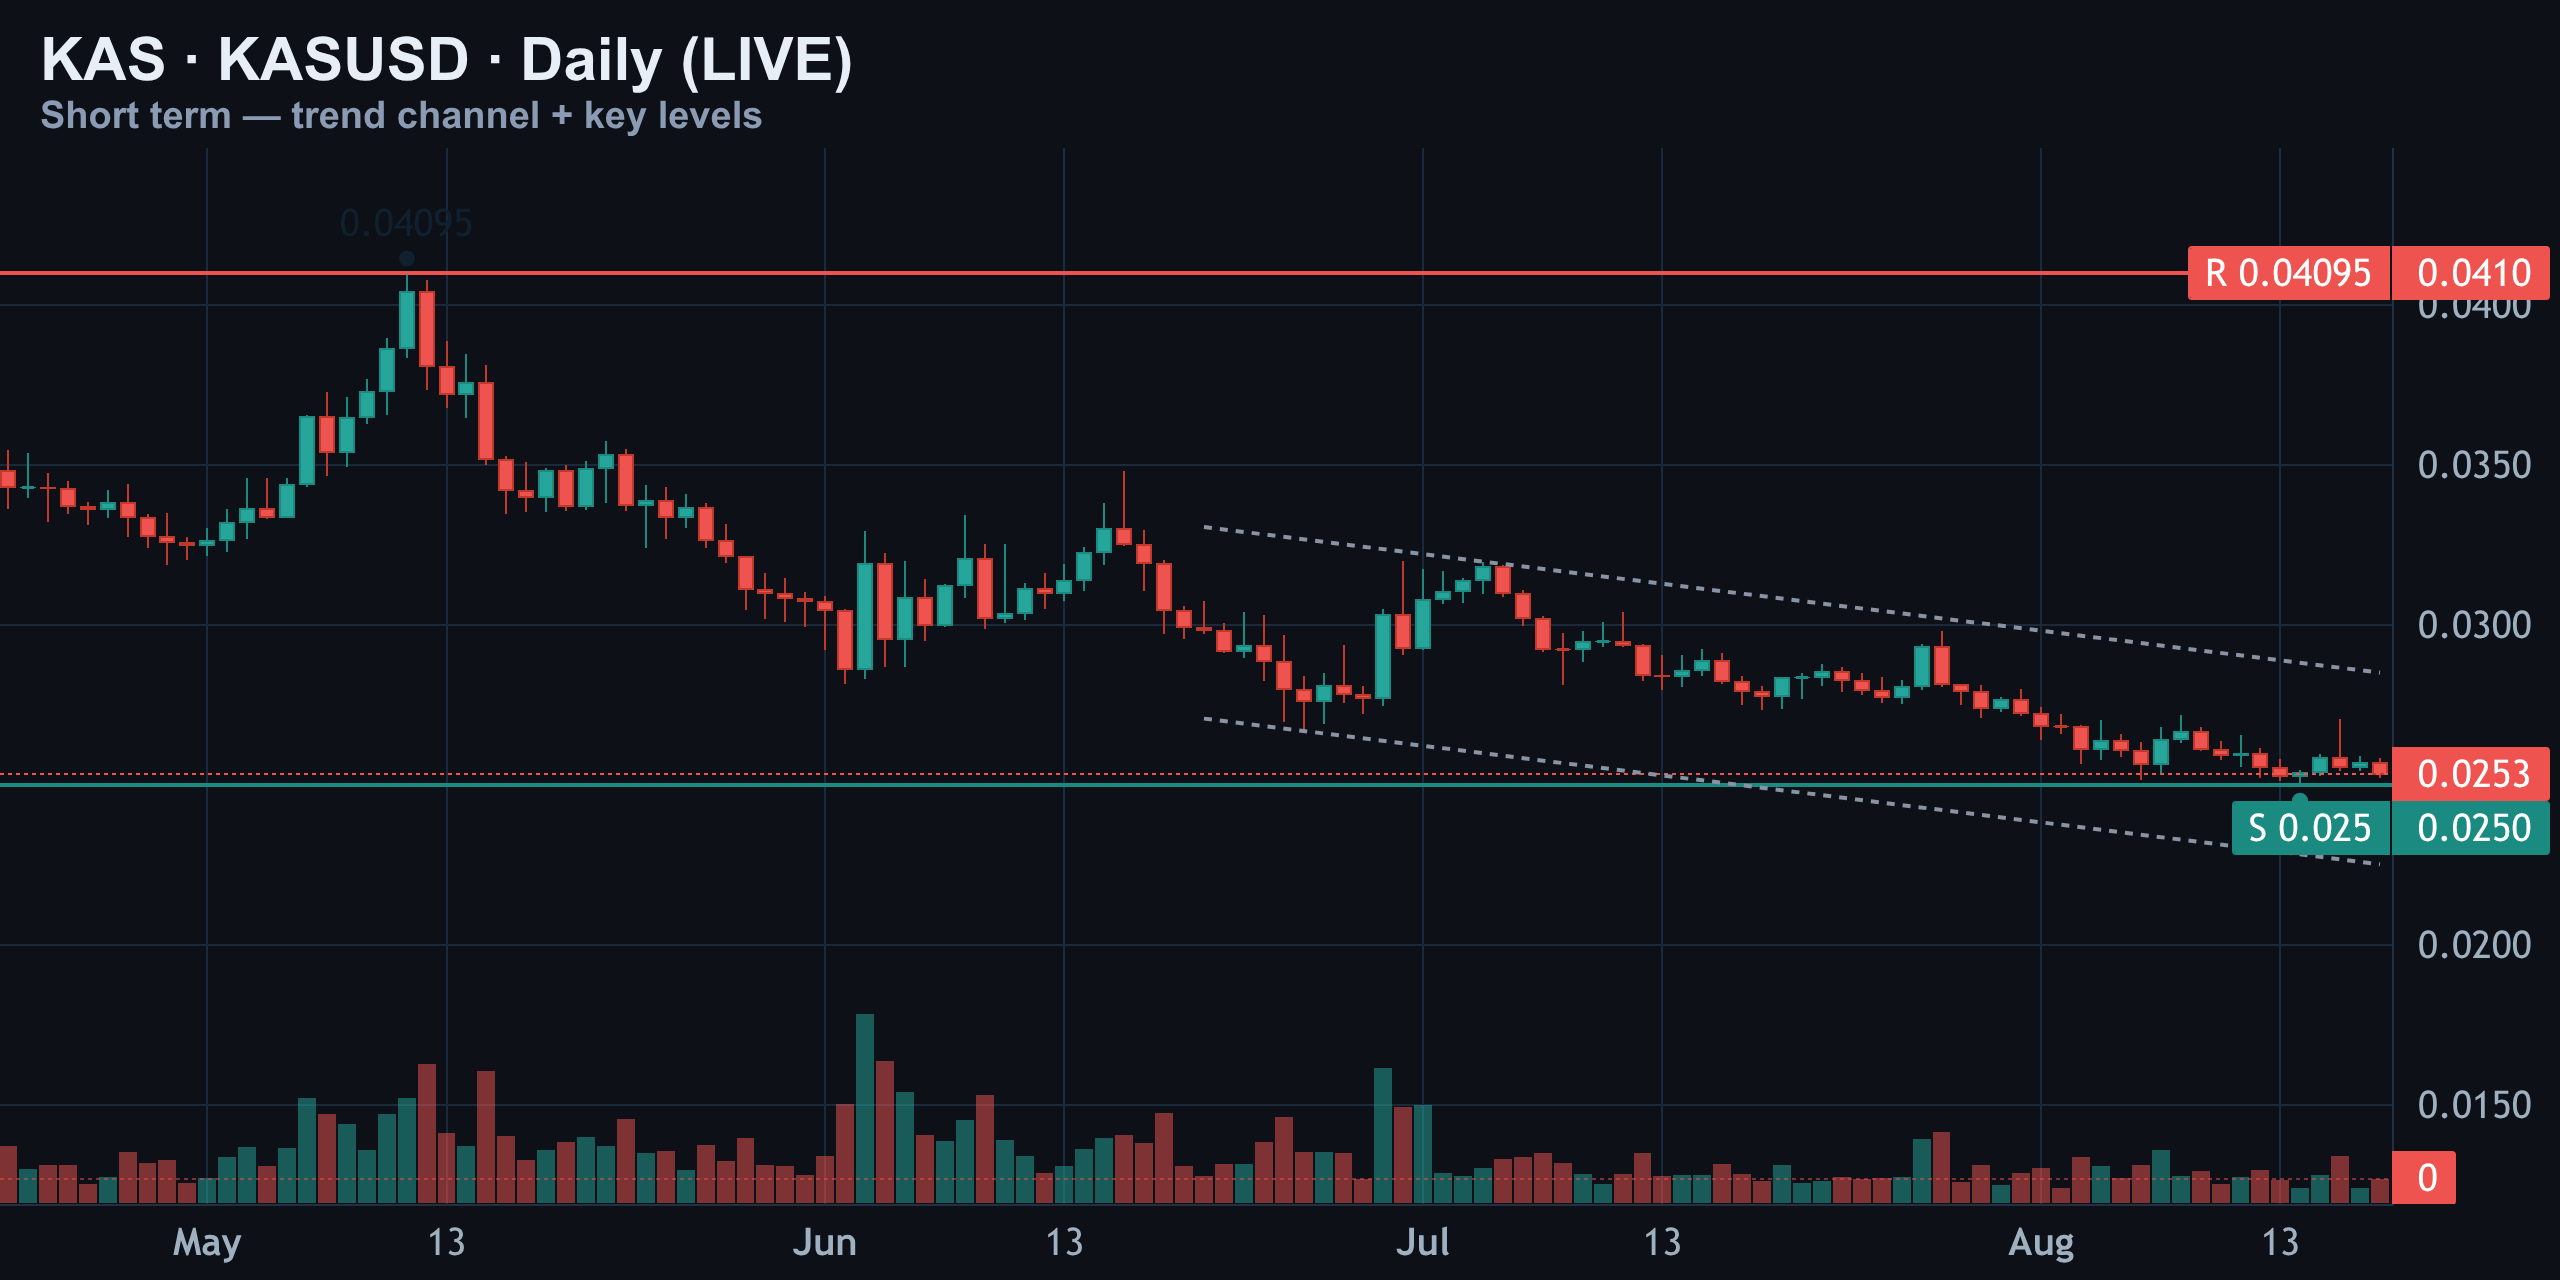
Some price-history trackers put the 30-day decline closer to double digits, reinforcing that this is not a one-day wobble — it's a sustained grind lower.
Nothing on this timeframe has broken the bigger downtrend yet. We're still inside it. In plain terms: the months-long downtrend for KAS is still fully intact, and today's bounce attempts haven't changed that fact.
RSI (14) Daily: The Quiet Bullish Tell
Here's the signal that doesn't match the candles. Daily RSI is sitting at 37 — neutral territory, nothing extreme on its own. But look closer at the shape of it: when price carved a lower low near $0.025, RSI actually printed a higher low — 35 versus the prior swing's 32.
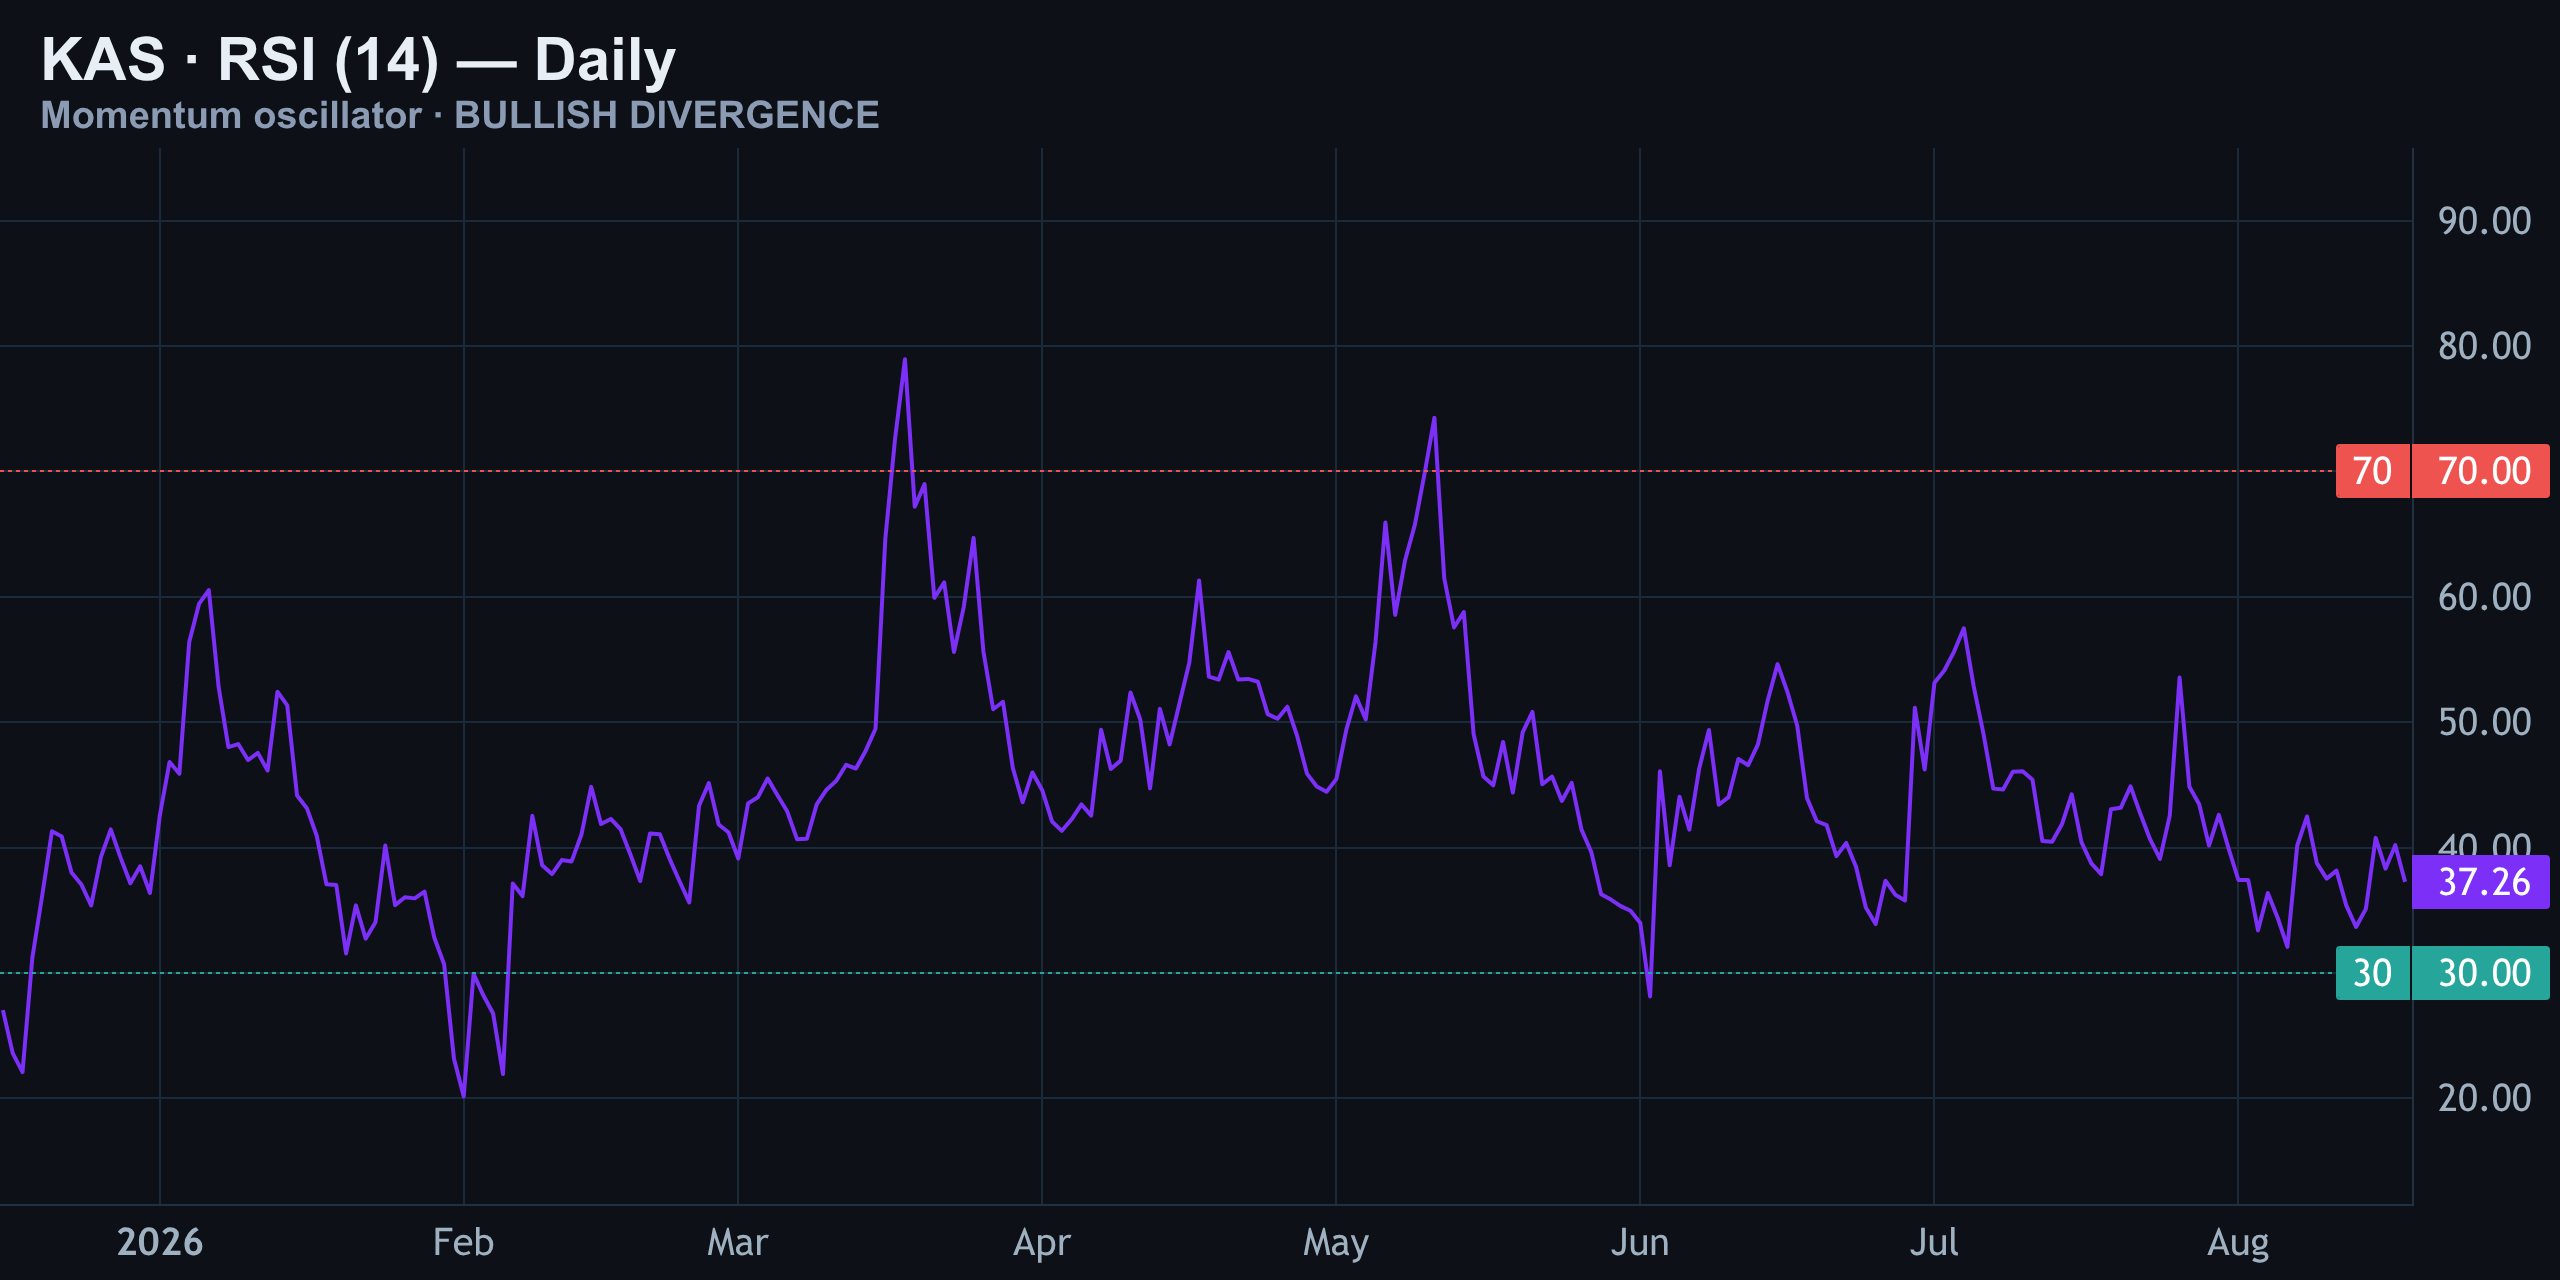
It doesn't guarantee a reversal — divergences can persist for a while before price actually turns — but it's the kind of quiet clue that historically precedes a shift. In plain terms: price fell further, but the selling pressure itself is actually weakening underneath.
MACD Daily: Momentum Flips Positive, Barely
MACD backs up what RSI is whispering, but with a caveat. The MACD line has crossed above its signal line, and the histogram just ticked positive after sitting negative for weeks — that's a genuine momentum shift on paper.
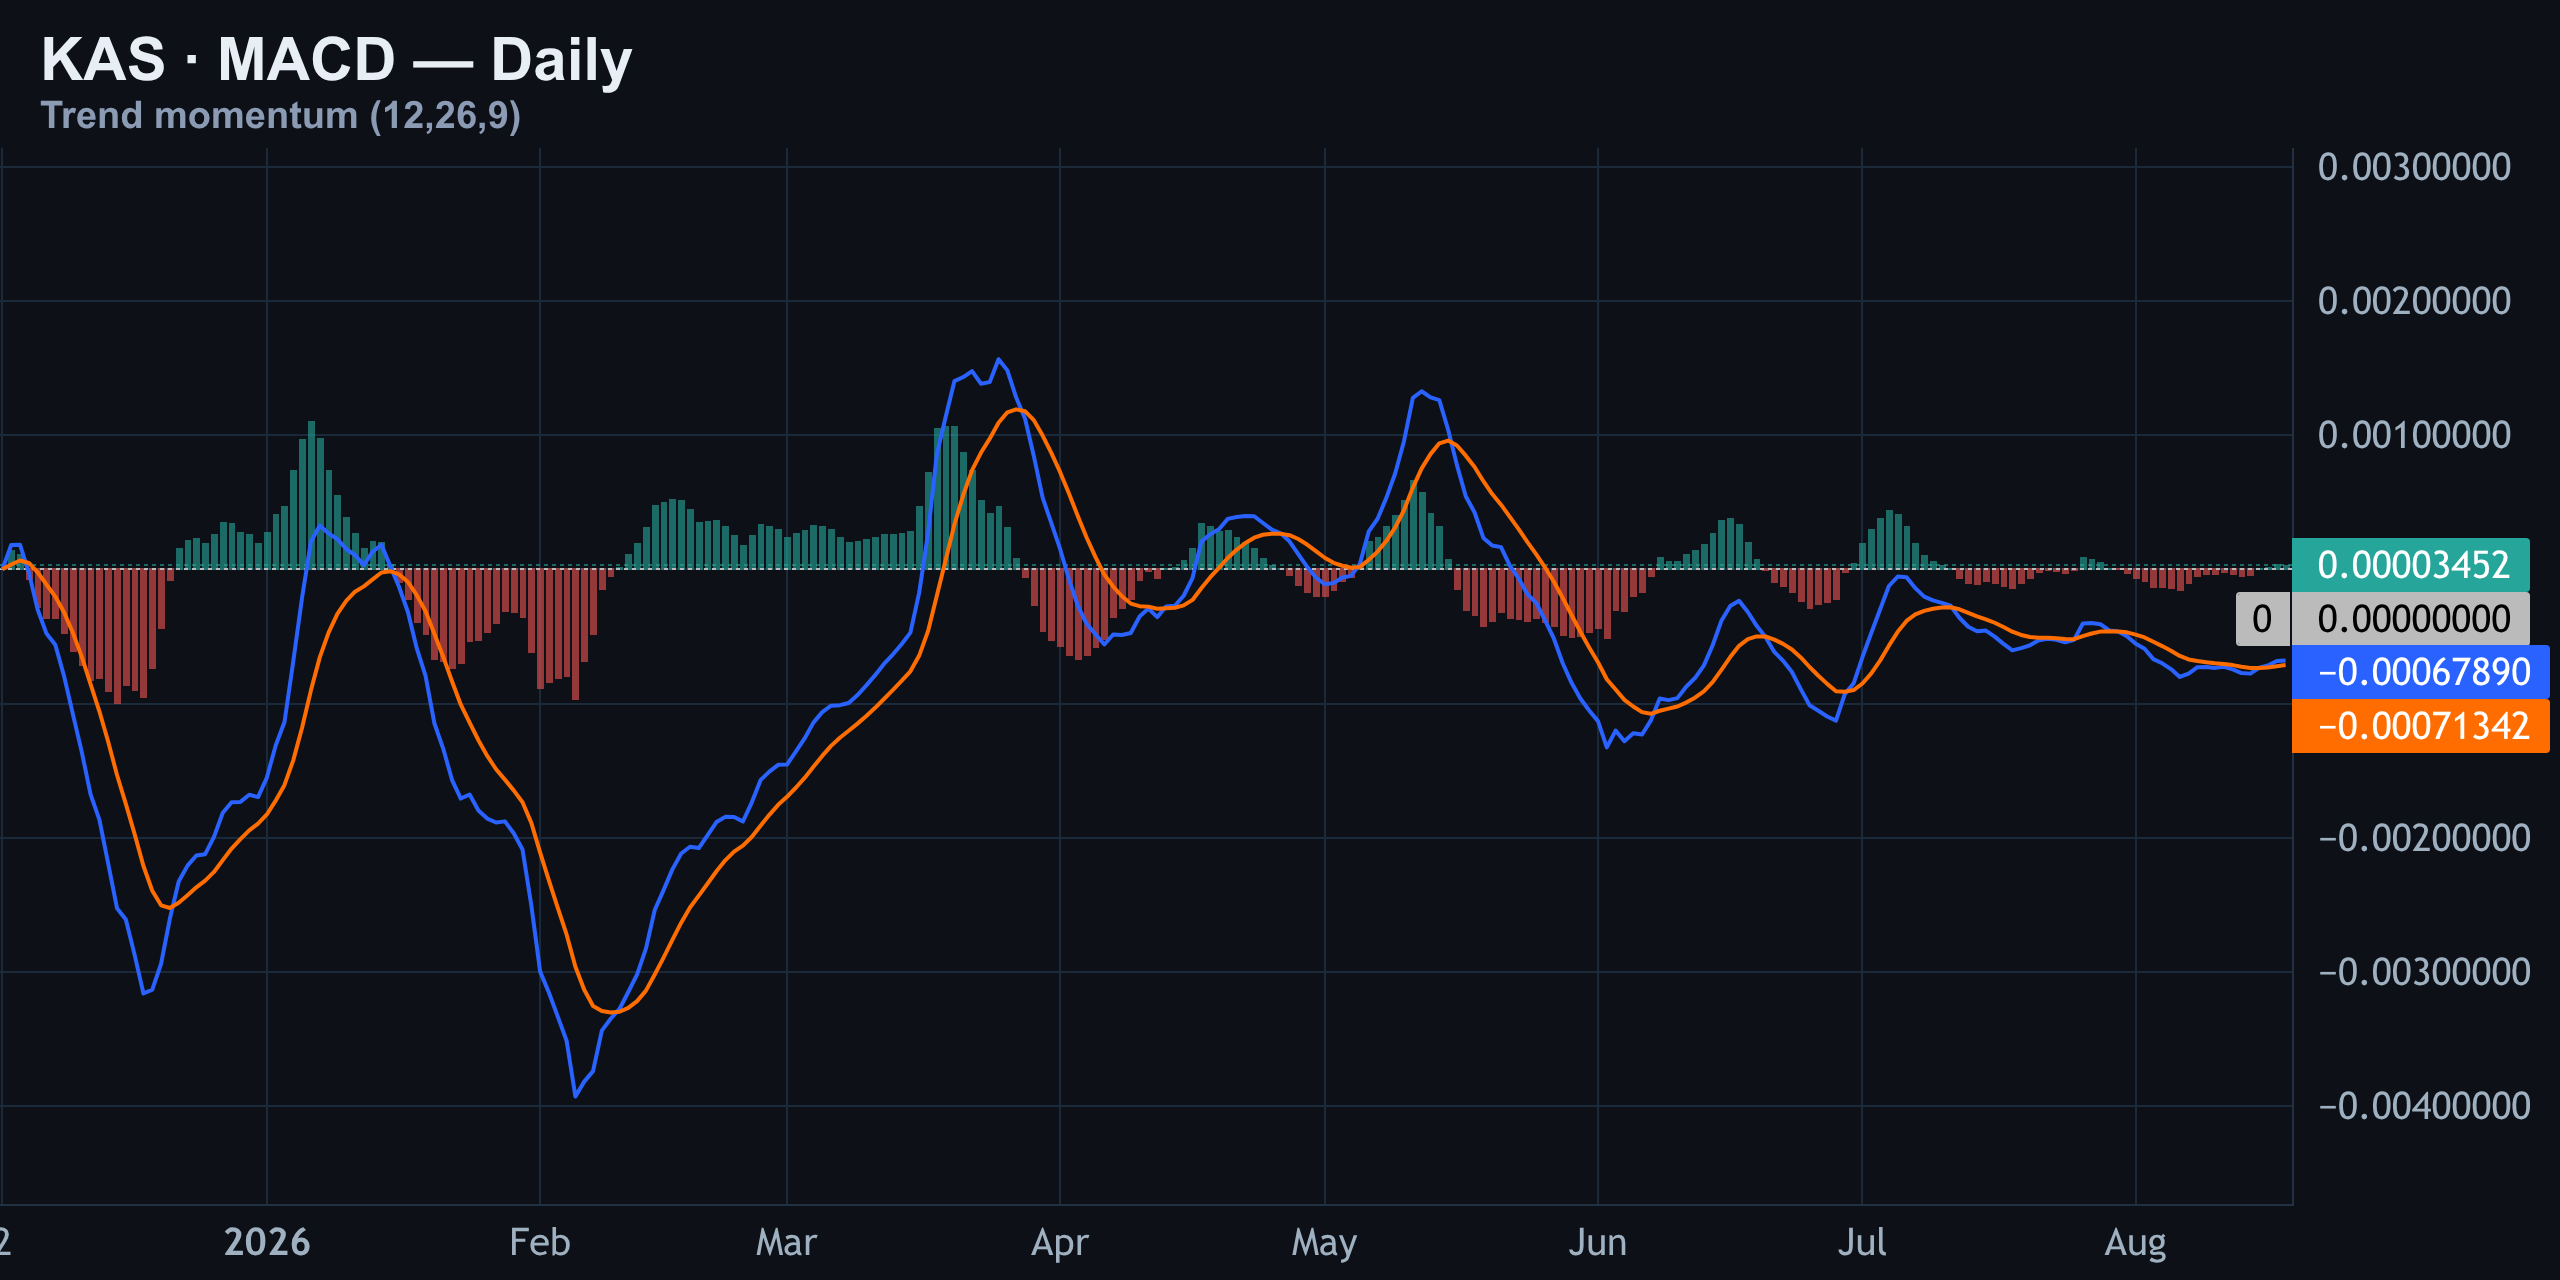
Zoom into the actual numbers, though, and the histogram reading is barely above zero — nowhere near the strength of the swings seen back in April or May when KAS was still trading closer to its highs. This is an early-stage flip, not confirmation of a new trend. Worth watching, not worth trusting blindly yet. In plain terms: momentum just turned slightly positive, but it's still a weak signal that could fade just as fast as it appeared.
Liquidation Heatmap: The Wall Nobody's Talking About
The liquidation map above spot is crowded. $0.0255 is the densest liquidation zone from the last two weeks, with $0.0259 sitting just above that. Below spot, there's a thinner cluster right around $0.0253 — basically where KAS is trading right now.
| Level | Type | Notional Size |
|---|---|---|
| $0.0255 | Long liquidation (heaviest) | ≈ $157,000 |
| $0.0255 | Long liquidation (secondary) | ≈ $28,000 |
| $0.0259 | Short liquidation | ≈ $28,000 |
| $0.0253 | Thin cluster (at spot) | Below reported threshold |
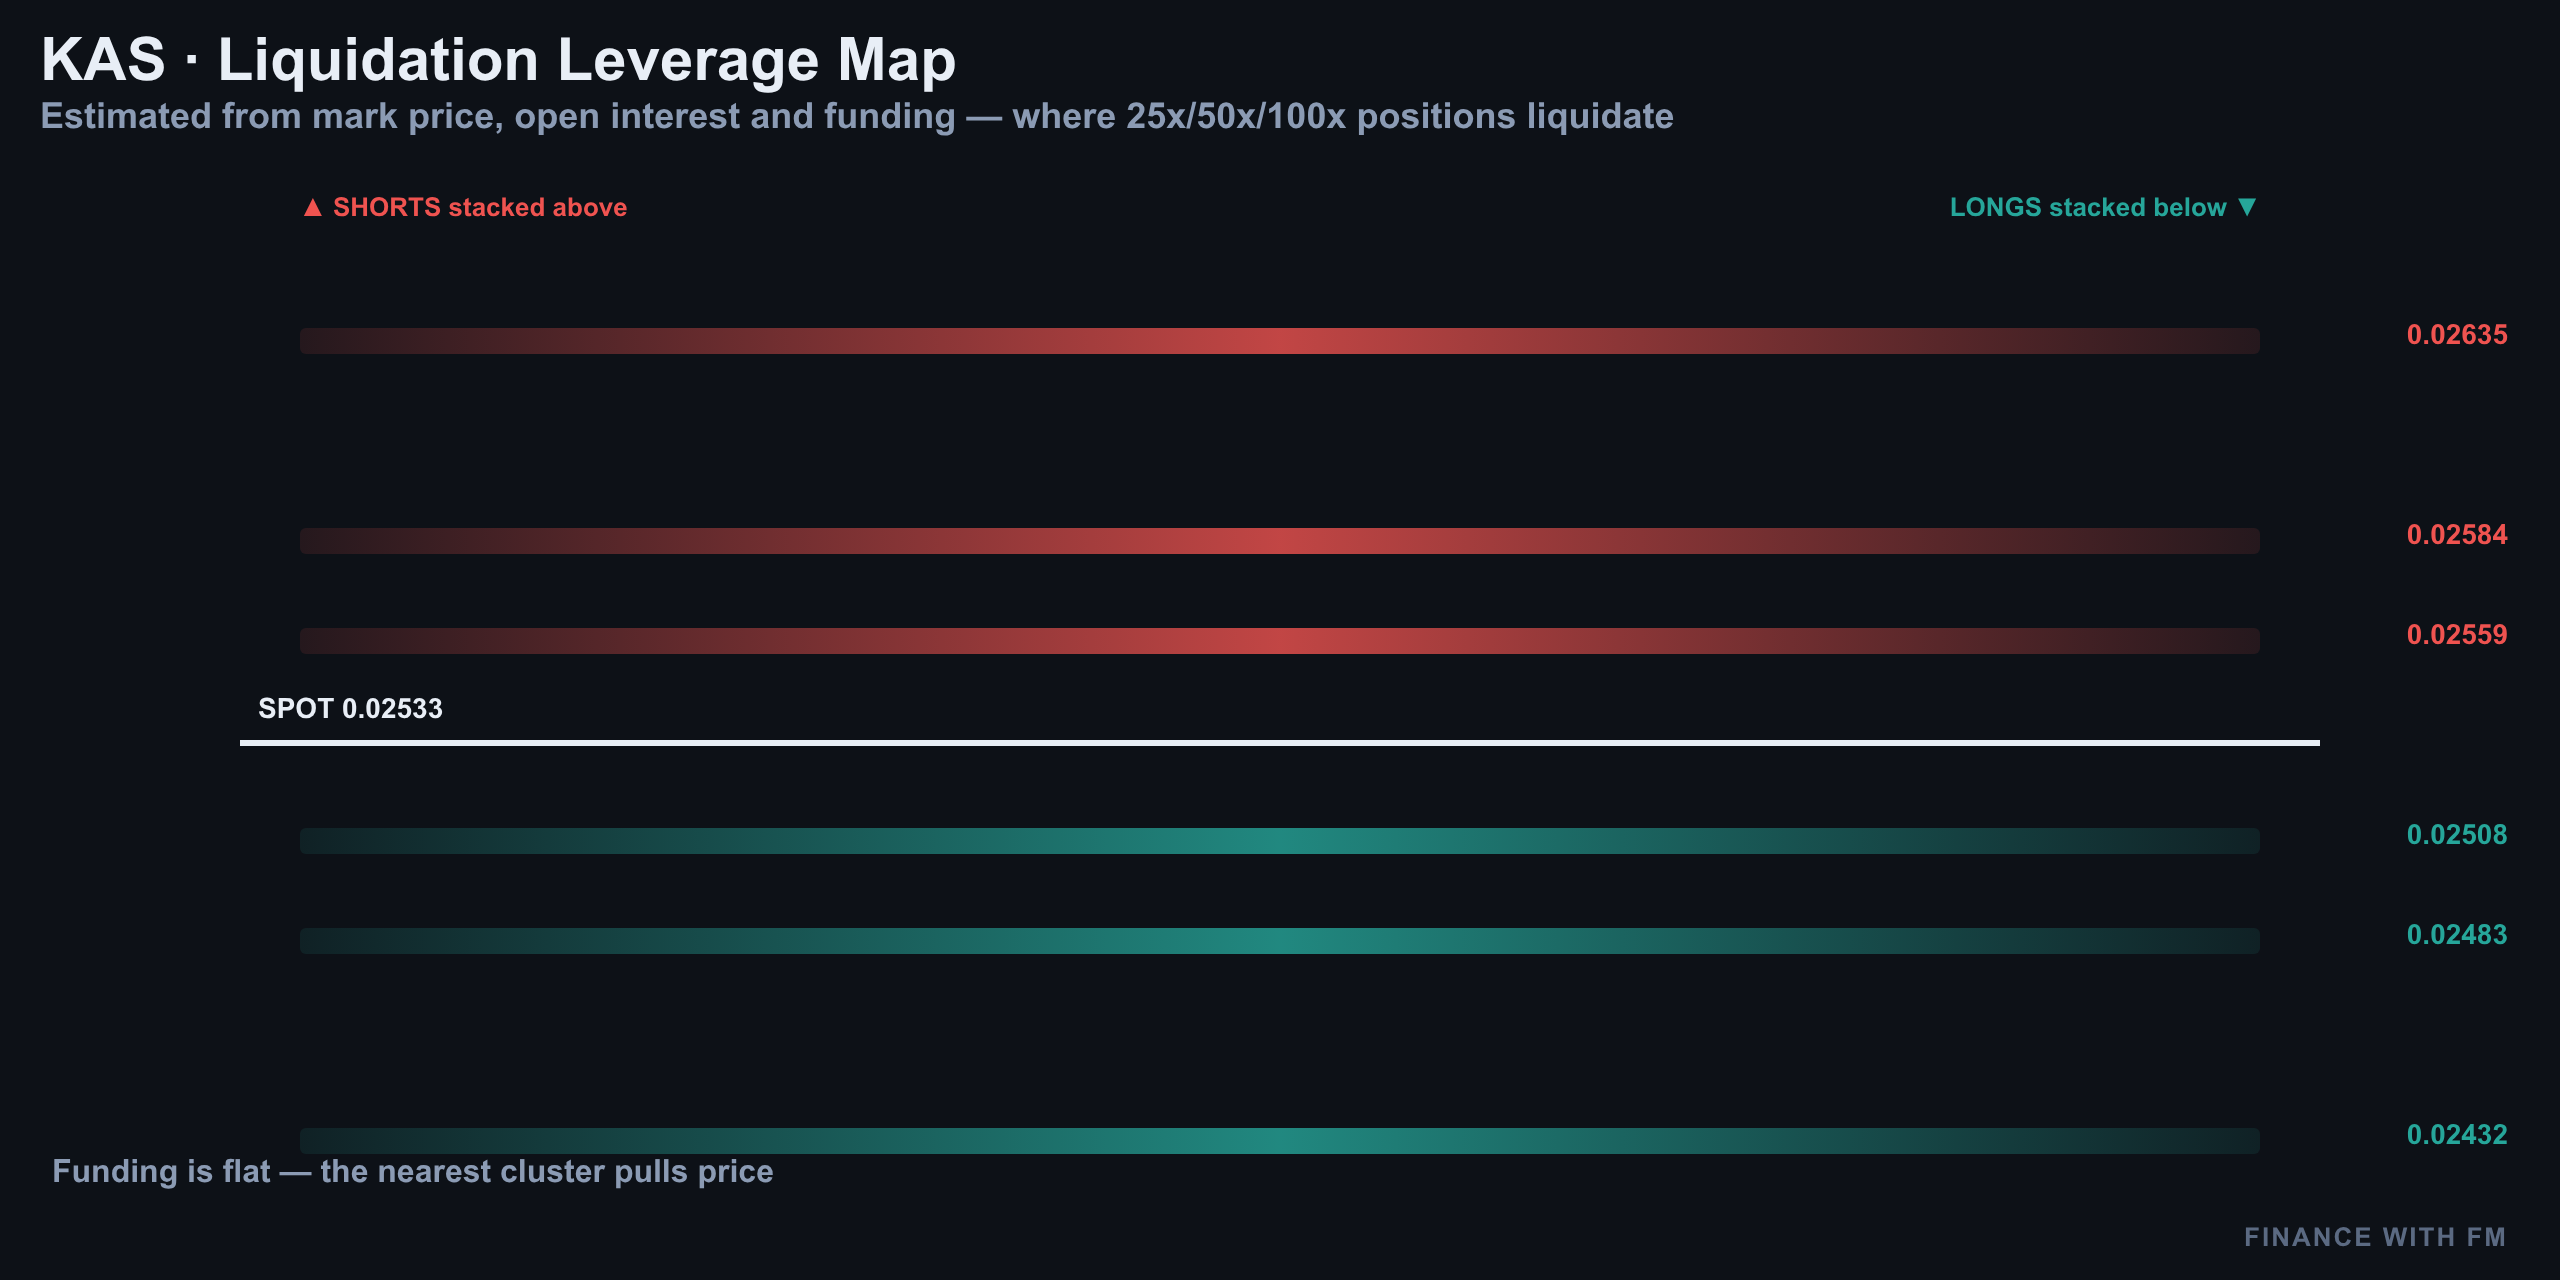
Positioning data adds context here: retail accounts are net long at 1.88, and top traders are also net long at 1.32. They're aligned rather than opposed, which means positioning alone gives no edge to fade right now. Funding is near neutral at roughly +5% APR, leaning two-sided pressure rather than a strong directional skew.
Levels to Watch, Desk Verdict, and Today's Drivers
| Level | Price | Significance |
|---|---|---|
| Major resistance (daily) | $0.041 | May 2026 swing high |
| Major support (daily) | $0.025 | Current battle zone |
| Liquidation wall (upside) | $0.0255 – $0.0259 | Dense stop clusters |
| Patience trigger | $0.0244 | The level that flips today's bias |
| Active short — entry | $0.026 | Still open |
| Active short — stop | $0.0265 | Not yet tagged |
| Active short — target | $0.0247 | Not yet tagged |
No Clean 1:2.5 Trade Today — Standing Aside
Here's the honest desk math: with structure still bearish on the lower timeframes, a bullish divergence brewing on the daily, neutral funding, and aligned (not stretched) positioning, there is no clean directional edge with a favorable 1:2.5 risk-reward setup right now. That combination is a wait-and-watch tape, not a chase tape.
Today's Drivers
- KAS trading around $0.0253, down roughly 1.4% on the day
- Broader crypto forecasting models still see a wide 2026 range for KAS, from the low-$0.02s to the mid-$0.05s depending on network adoption
- Some trackers show a steeper 30-day drawdown, underlining that this decline has been grinding rather than sudden
- Price history data confirms KAS has been in retreat since early August, consistent with the descending channel on the 4-hour and daily charts
Analysis and education, not investment advice. See our editorial policy.