Daily market analysis
Bitcoin (BTC) technical analysis today
Last updated
Bitcoin August 31, 2026: Bullish Structure, Bearish Pressure
Bitcoin August 31, 2026: The Market in One Sentence
Bitcoin is trading near $78,700 on August 31, 2026, and the chart is sending two messages at once. The larger trend remains constructive: price is above its major moving averages, the daily structure is making higher lows, and MACD continues to confirm trend momentum. However, short-term positioning is becoming crowded. Taker flow is bearish, funding is positive, RSI is hot and price is pressing into resistance.
That combination creates a market that can still move higher, but probably should not be chased blindly. Buyers need to defend the $77,000-$77,300 area and then reclaim the immediate resistance zone near $78,800. If support fails first, leveraged longs could become the fuel for a fast liquidation sweep.
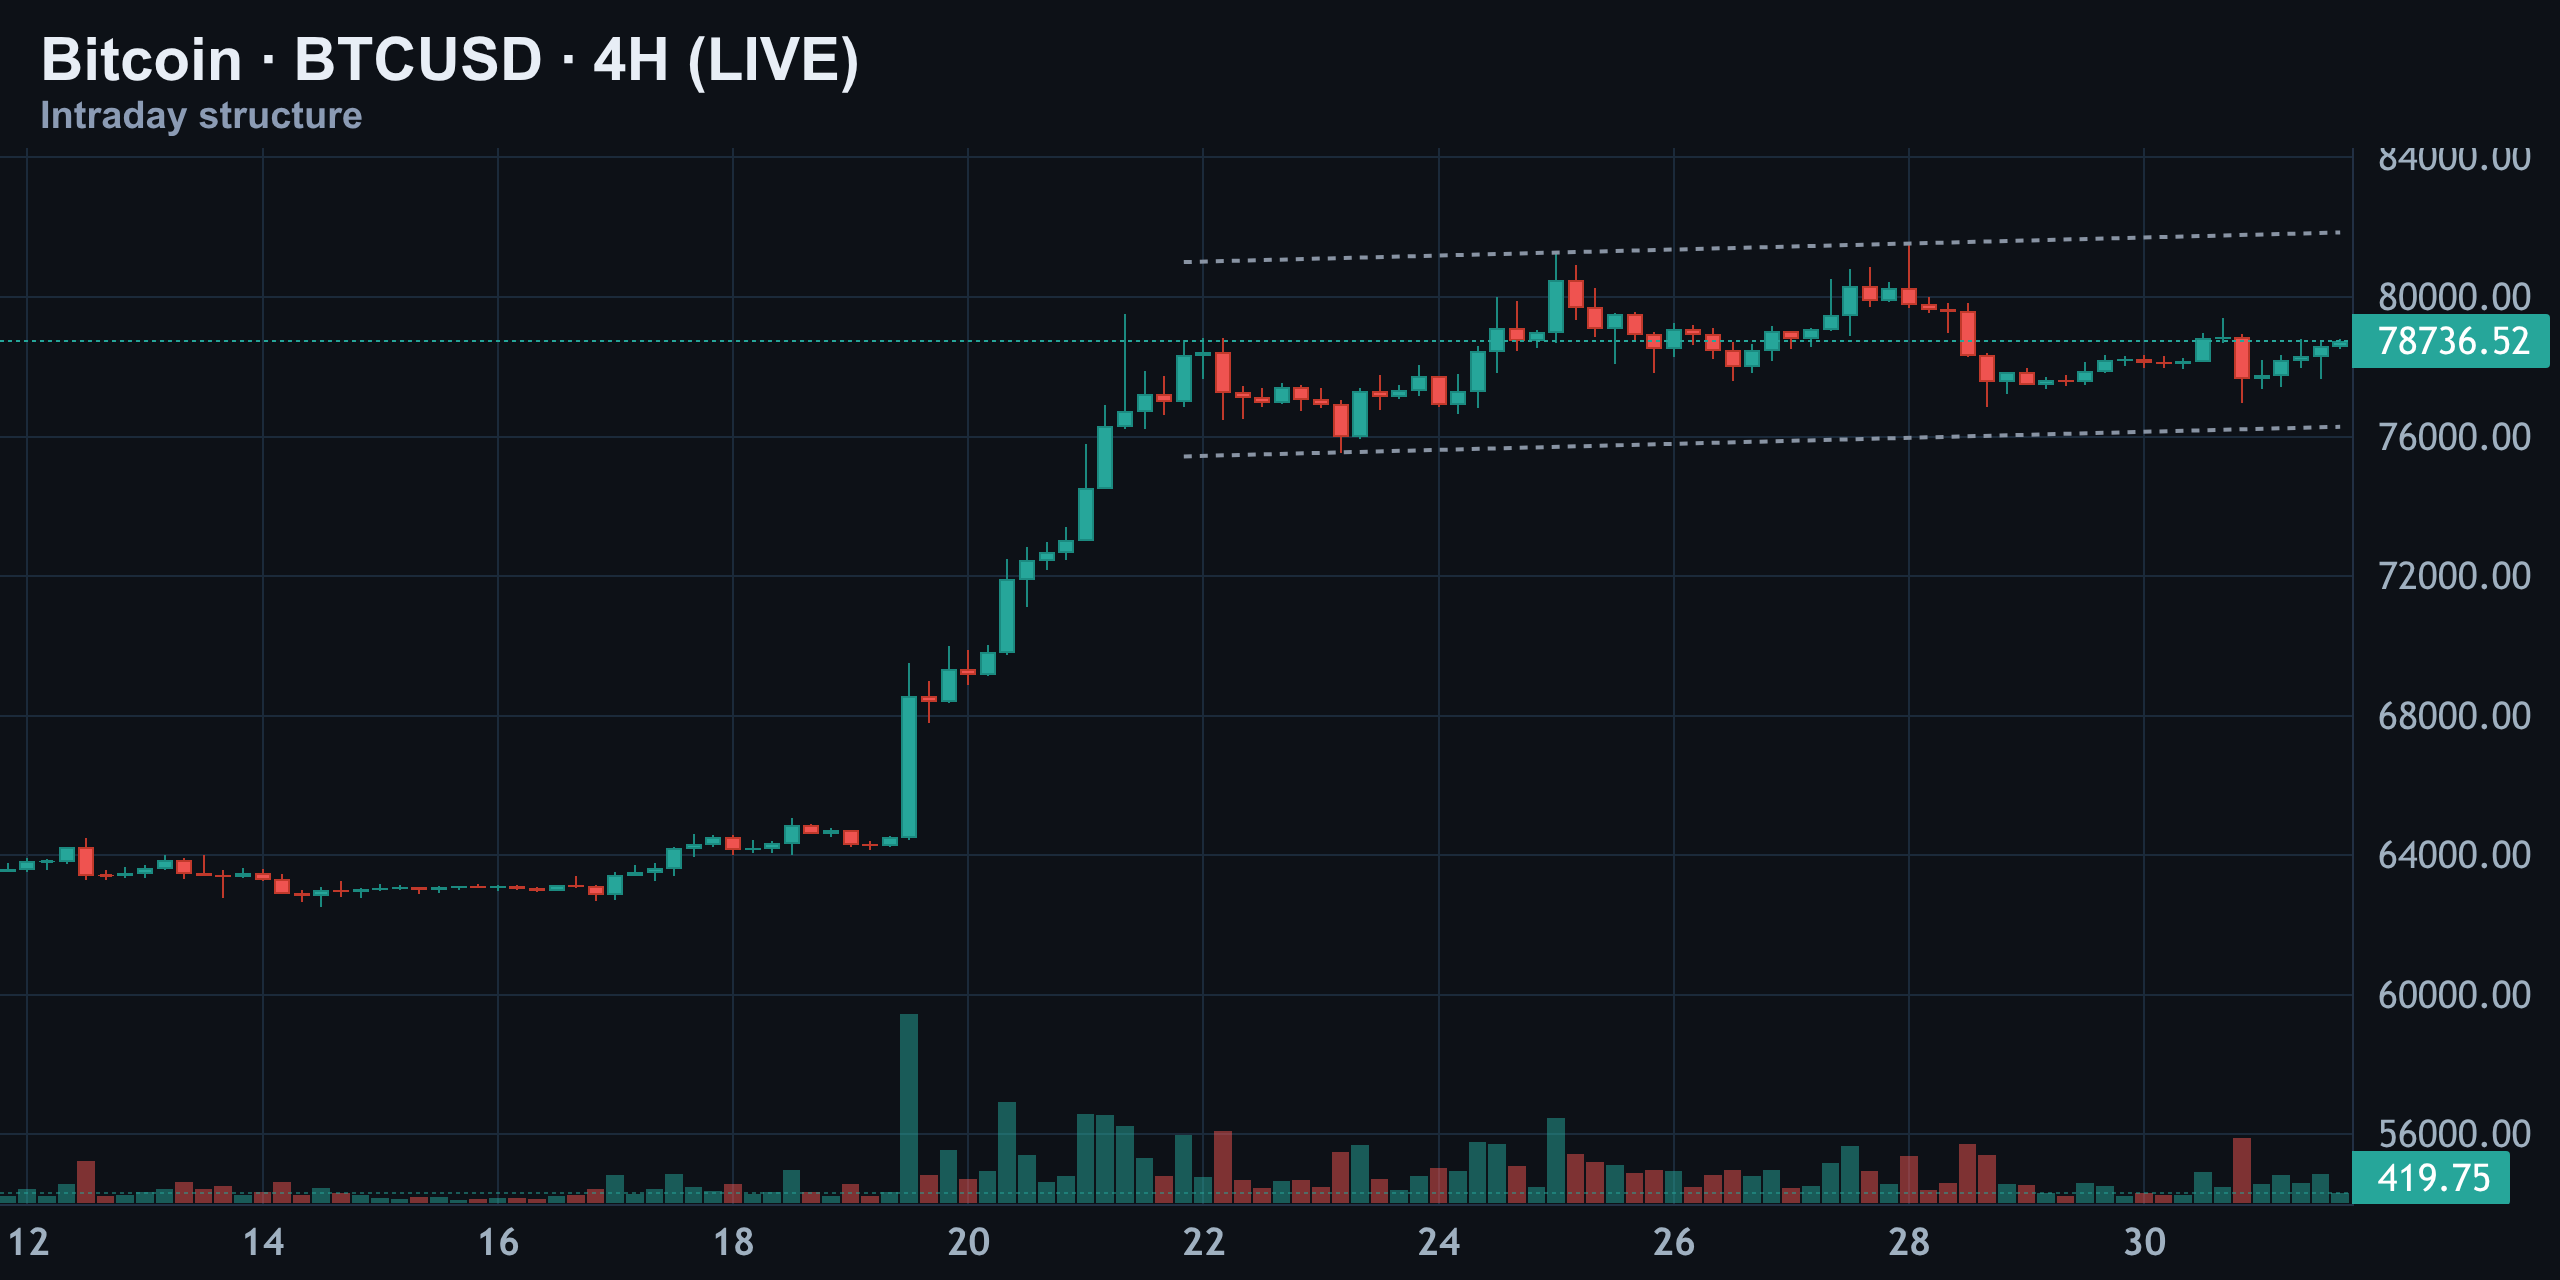
The immediate order-book test is also tight. A small bid wall sits near $78,619, while an ask wall appears near $78,800. Those levels are not guaranteed to hold, but they help explain why price is currently compressed rather than trending cleanly in one direction.
Options and Volatility: Constructive, but Not Comfortable
The options market leans bullish, although it is far from one-sided. The put-to-call ratio by open interest is 0.56, meaning calls outnumber puts in outstanding positions. That signals upside interest. The volume ratio is 0.93, however, which is much closer to balanced hedging and suggests traders are not aggressively betting on a straight-line rally.
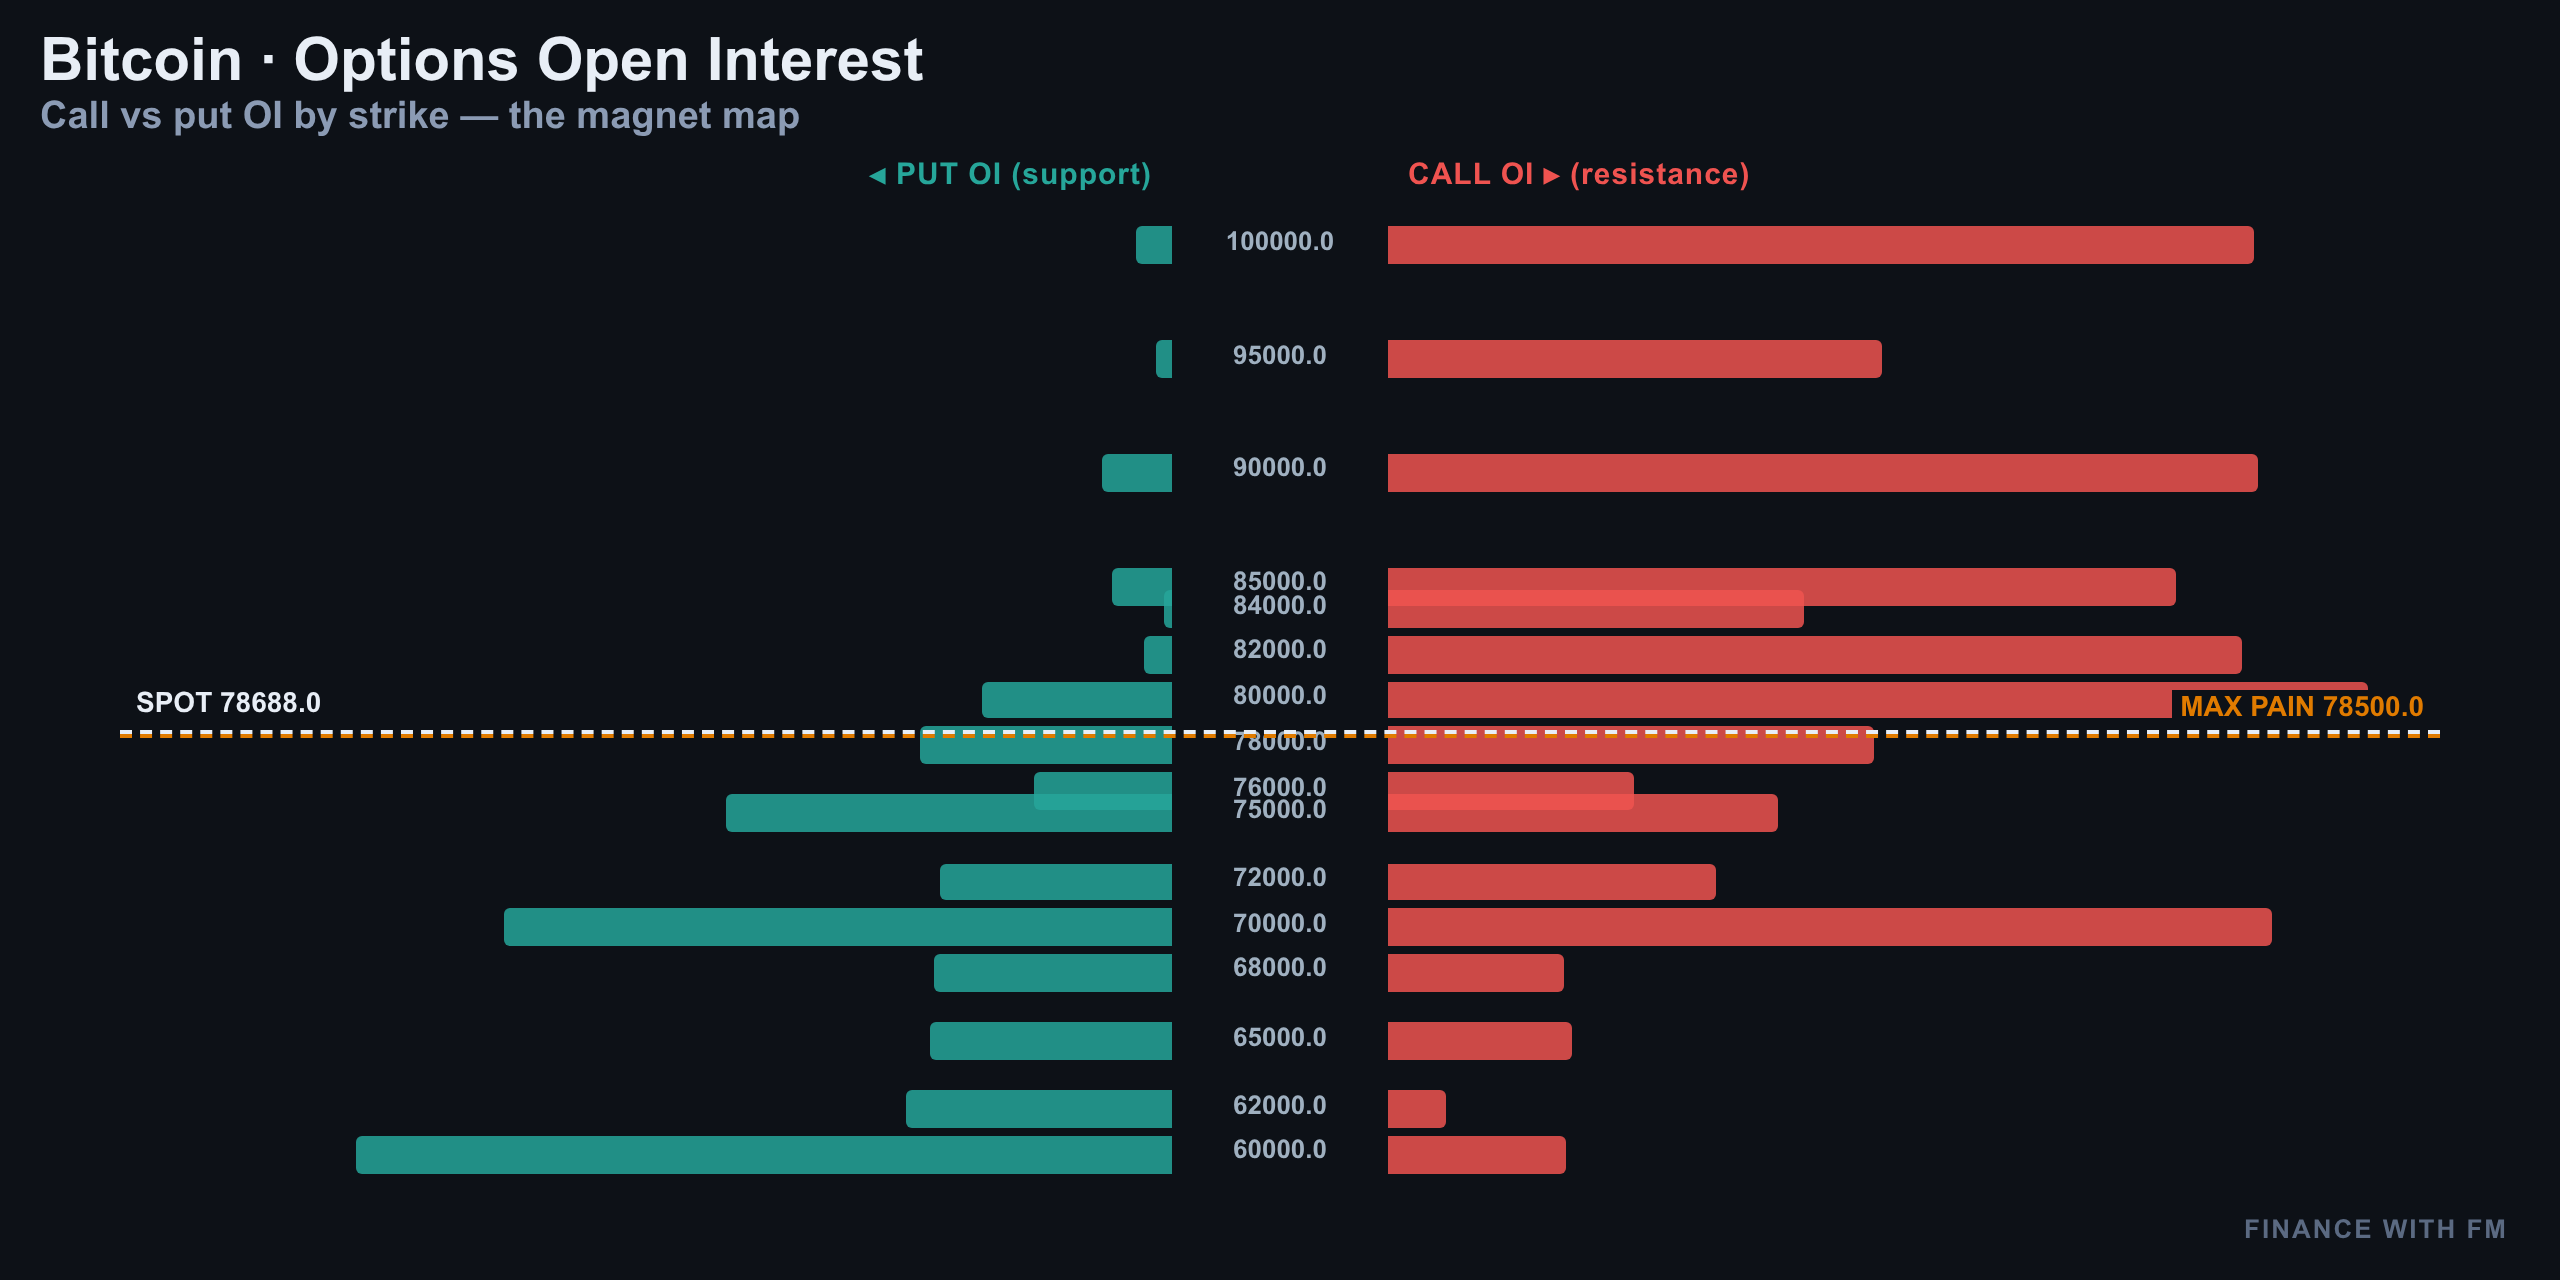
The nearest expiry has max pain near $78,500, almost directly beneath spot. That makes the level a potential magnet into the September 1 expiry. Above price, the largest call wall is at $80,000, creating a natural resistance zone. The largest put wall is much lower at $60,000, so it represents distant structural support rather than an immediate downside floor.
| Options metric | Reading | Market implication |
|---|---|---|
| Put-to-call open interest | 0.56 | Calls outweigh puts |
| Put-to-call volume | 0.93 | Near-balanced trading |
| Max pain | $78,500 | Possible expiry magnet |
| Largest call wall | $80,000 | Overhead resistance |
| Largest put wall | $60,000 | Distant downside support |
Volatility adds an important contradiction. Bitcoin’s implied volatility, measured by DVOL, is 37.1, while realized volatility is 49.0. That creates a negative volatility risk premium of 11.9 percentage points. In simple terms, options are pricing less movement than Bitcoin has recently delivered.
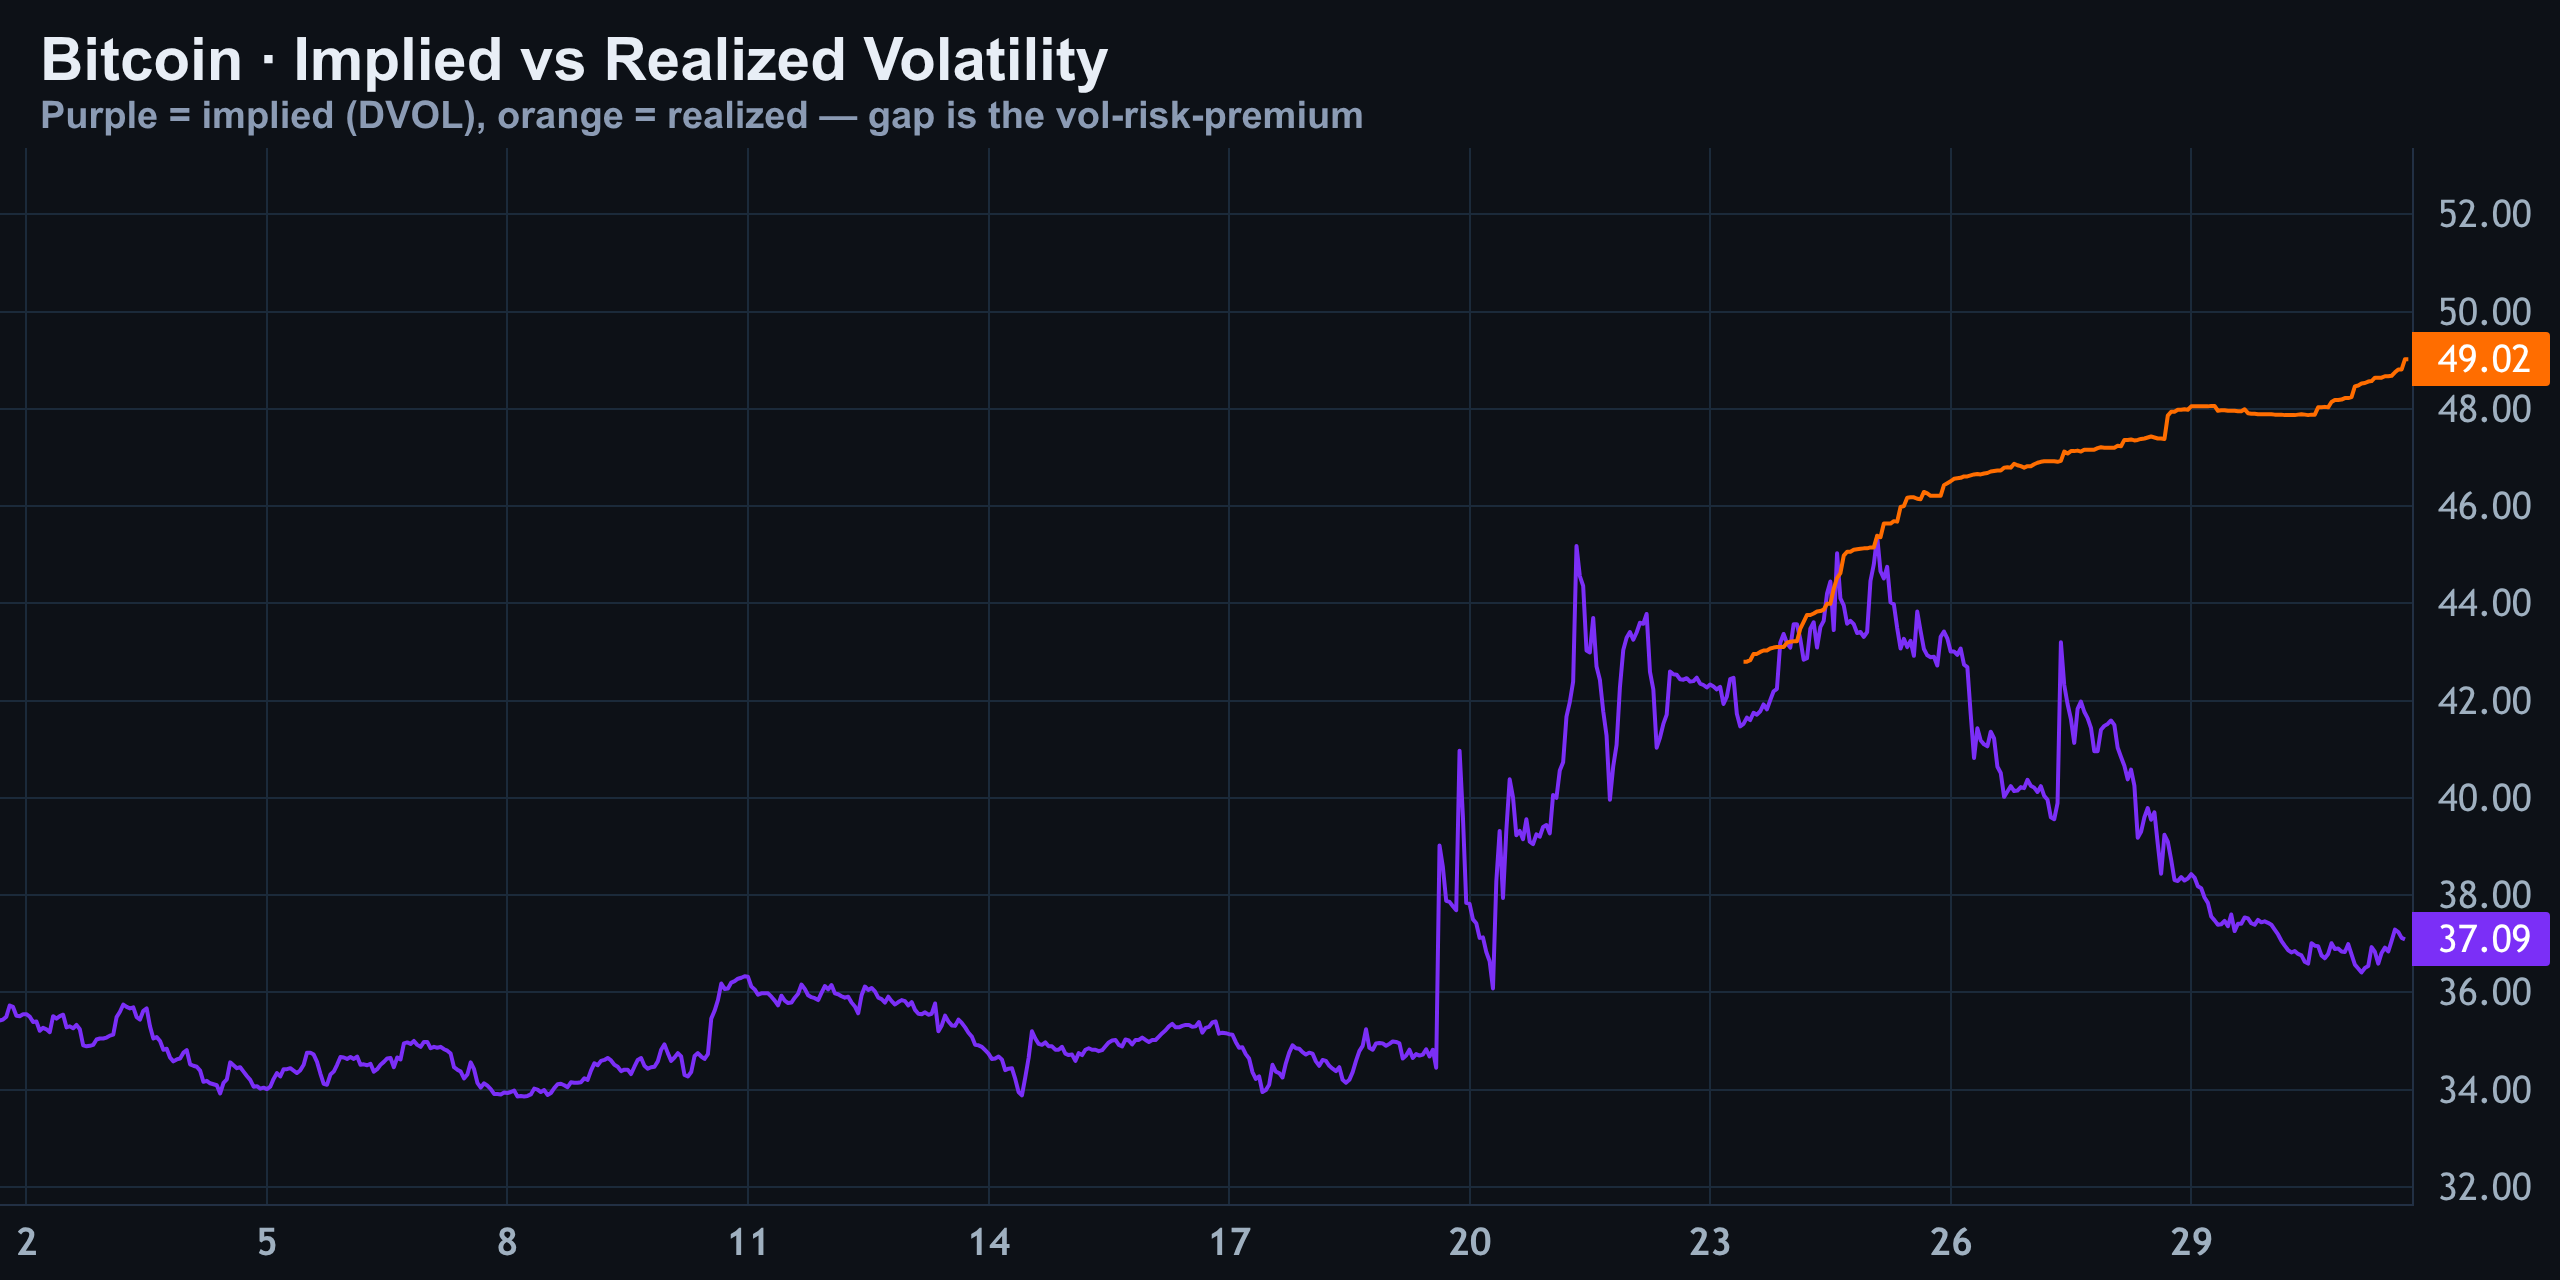
The 25-delta skew is +2.8%, showing that downside puts are richer than comparable calls. The market is not pricing panic, but traders are paying extra for downside protection. That matters because a quiet-looking options surface can still precede a violent move when expiry positioning and leveraged futures are concentrated around the same range.
Technical Structure: Bullish Trend, Hot Momentum
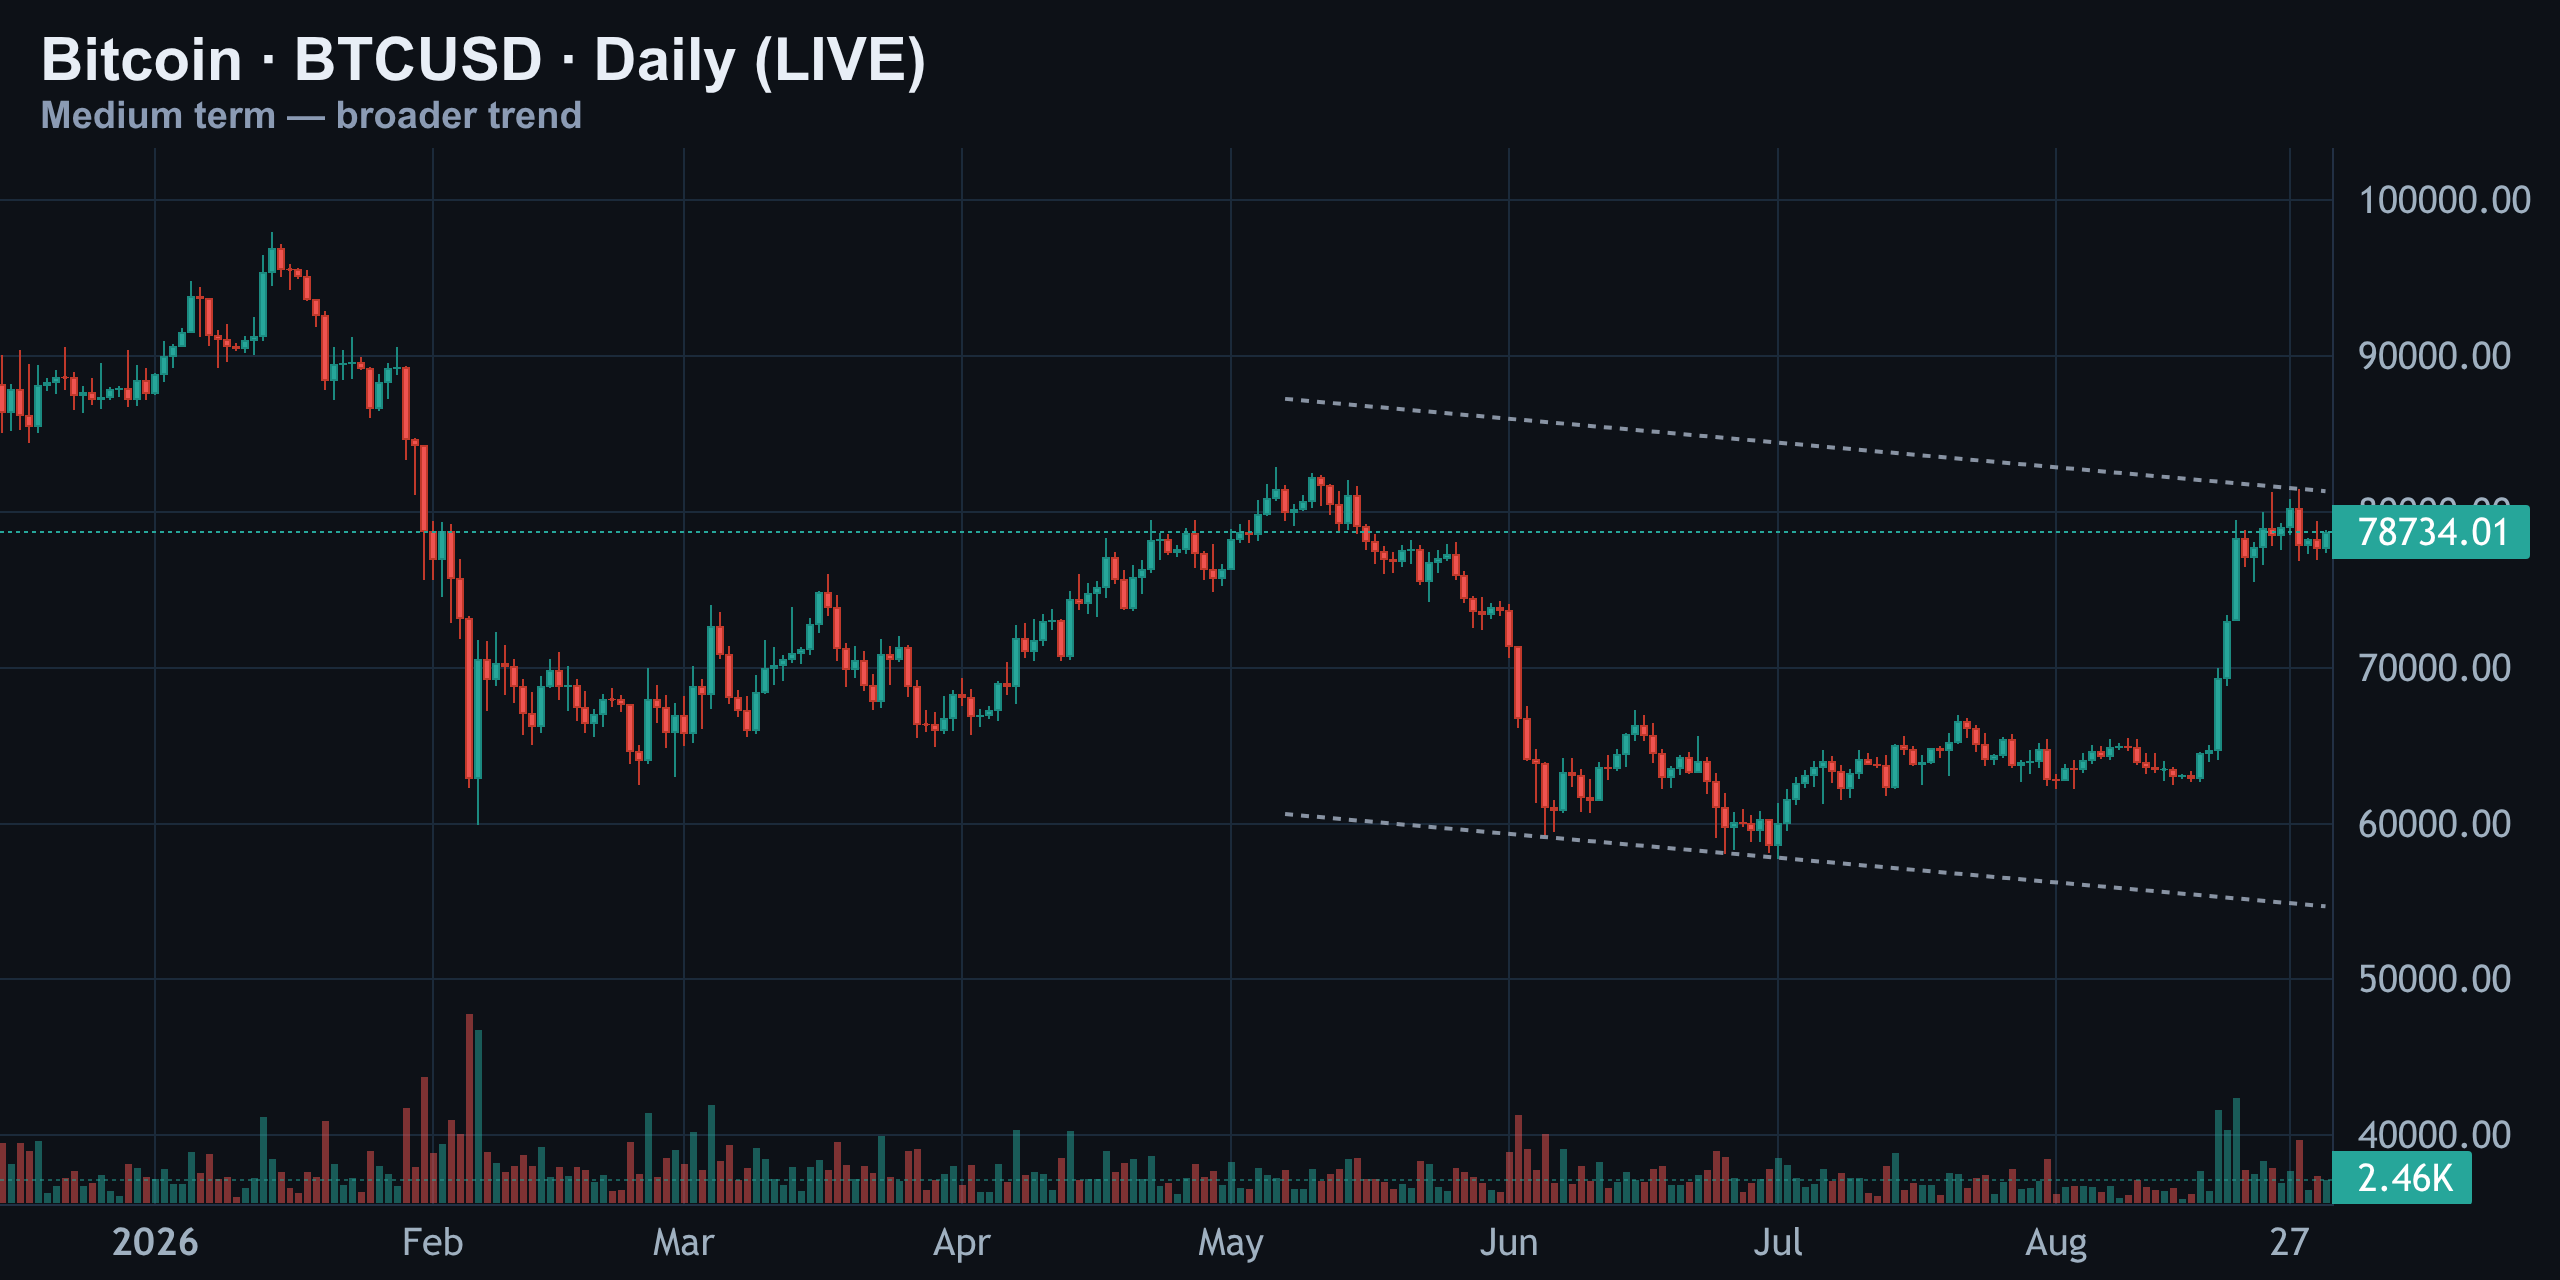
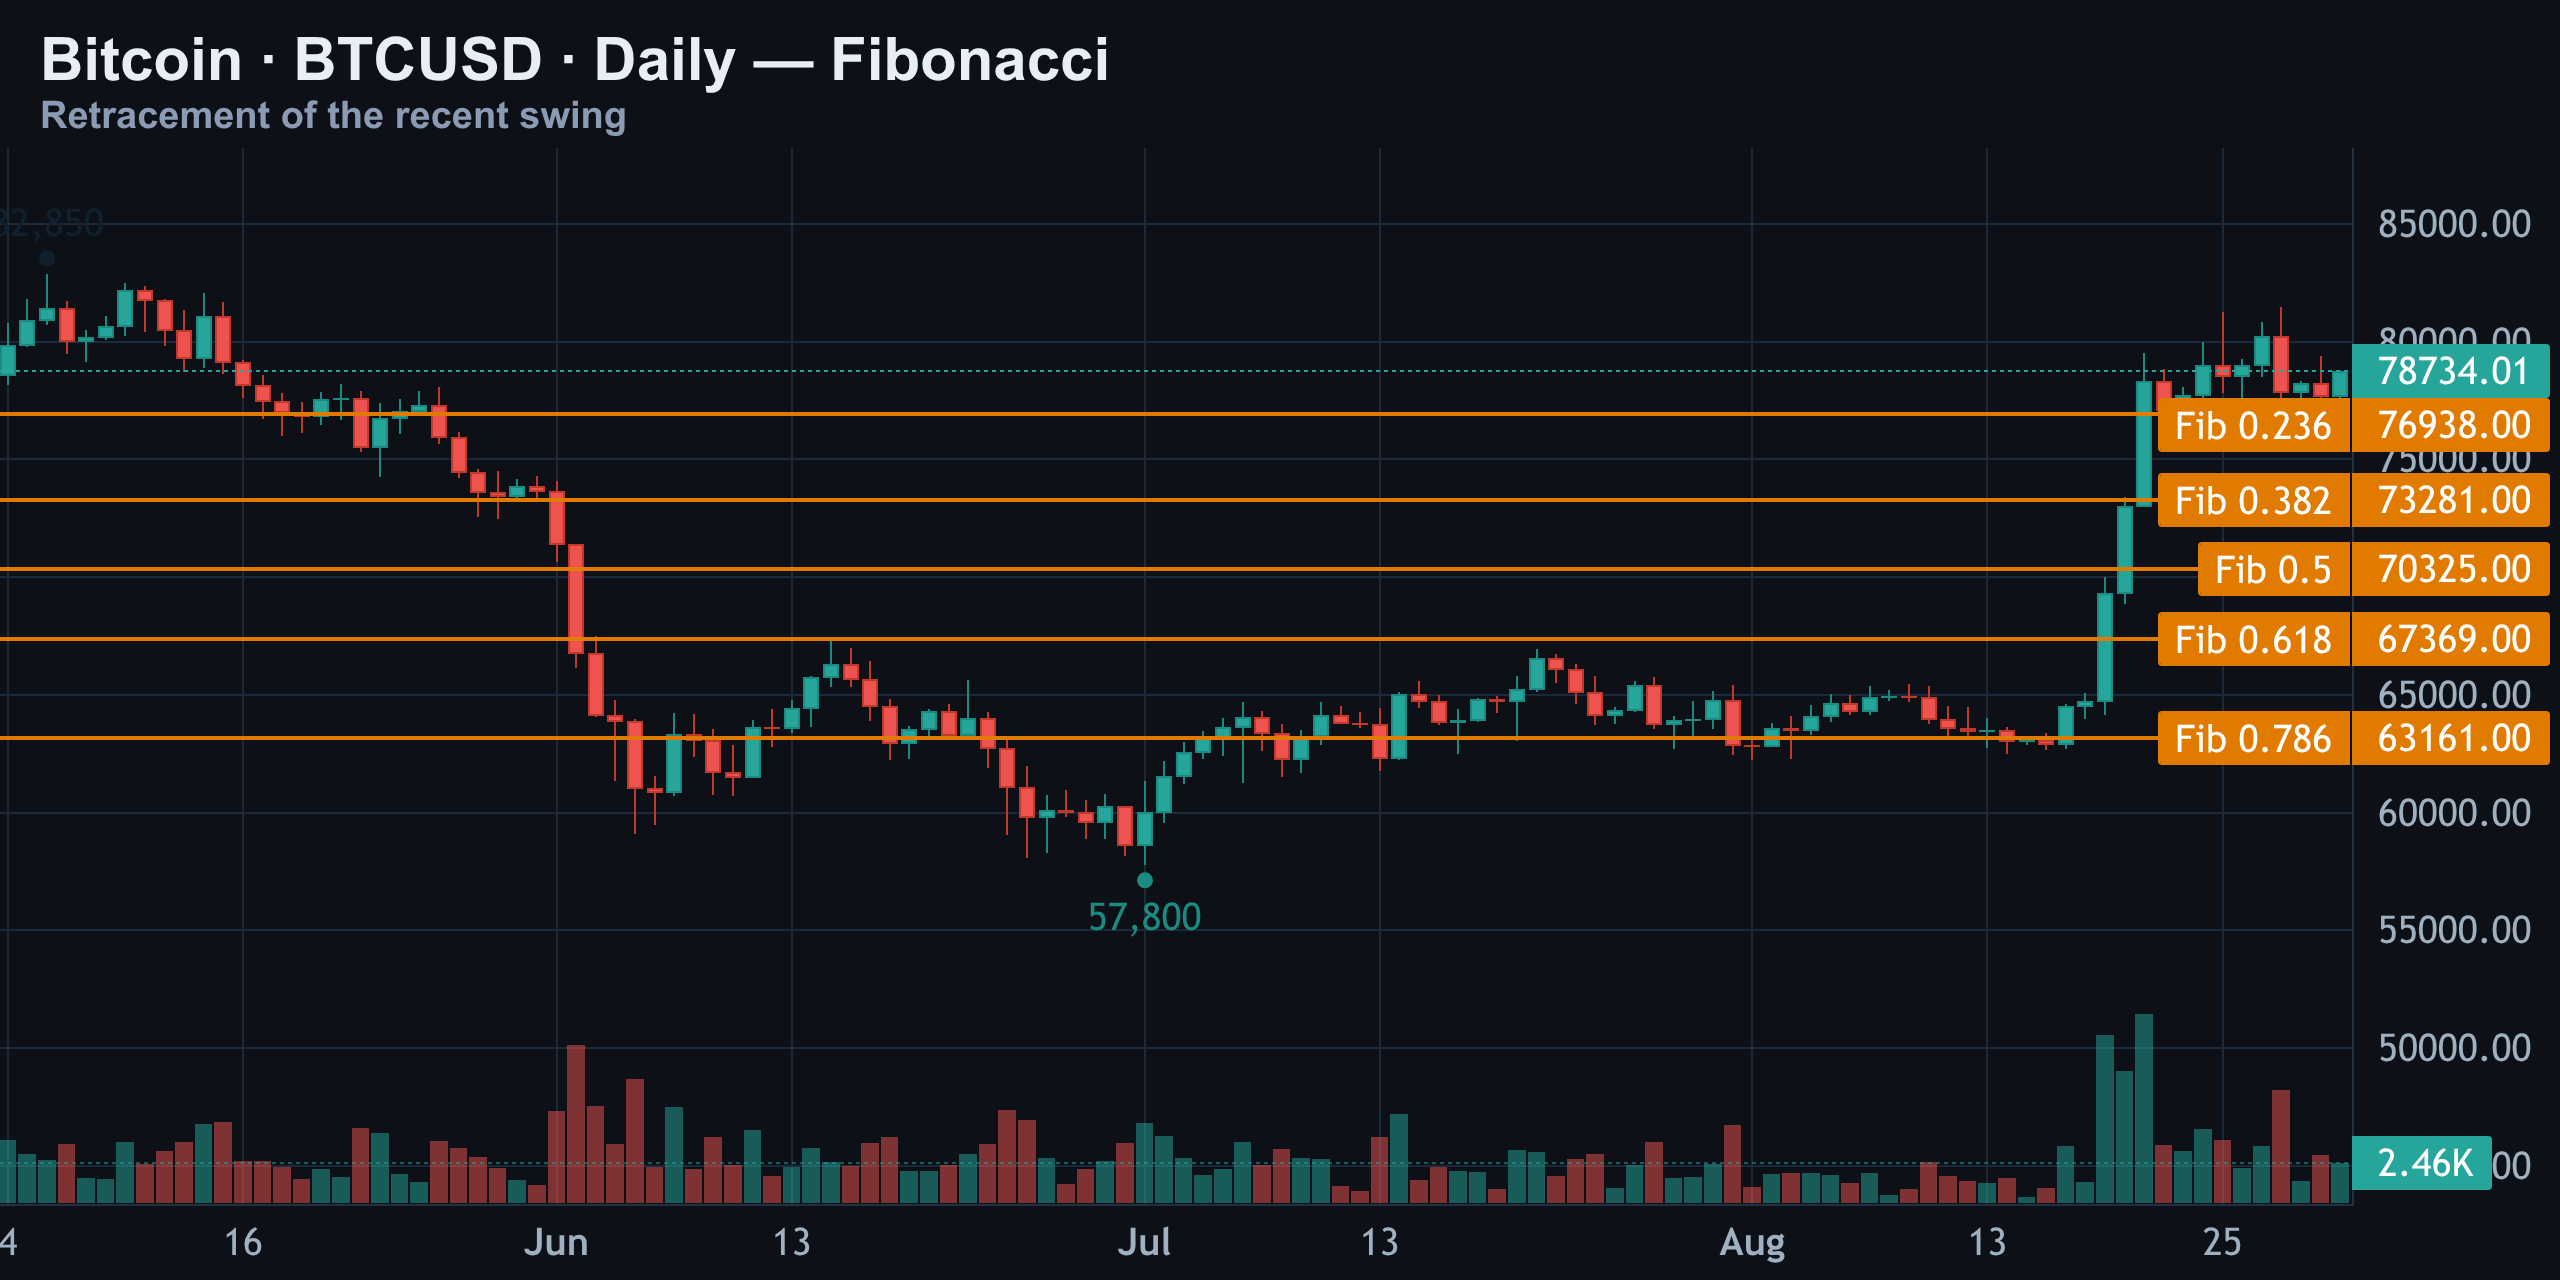
Bitcoin’s short-term daily structure has changed character. After spending weeks building a base in the low-to-mid $60,000s, price broke higher with expanding volume and moved into the high $70,000s. The current compression beneath the upper edge of the rising channel is generally consistent with a healthy pause, but it is not confirmation of another breakout yet.
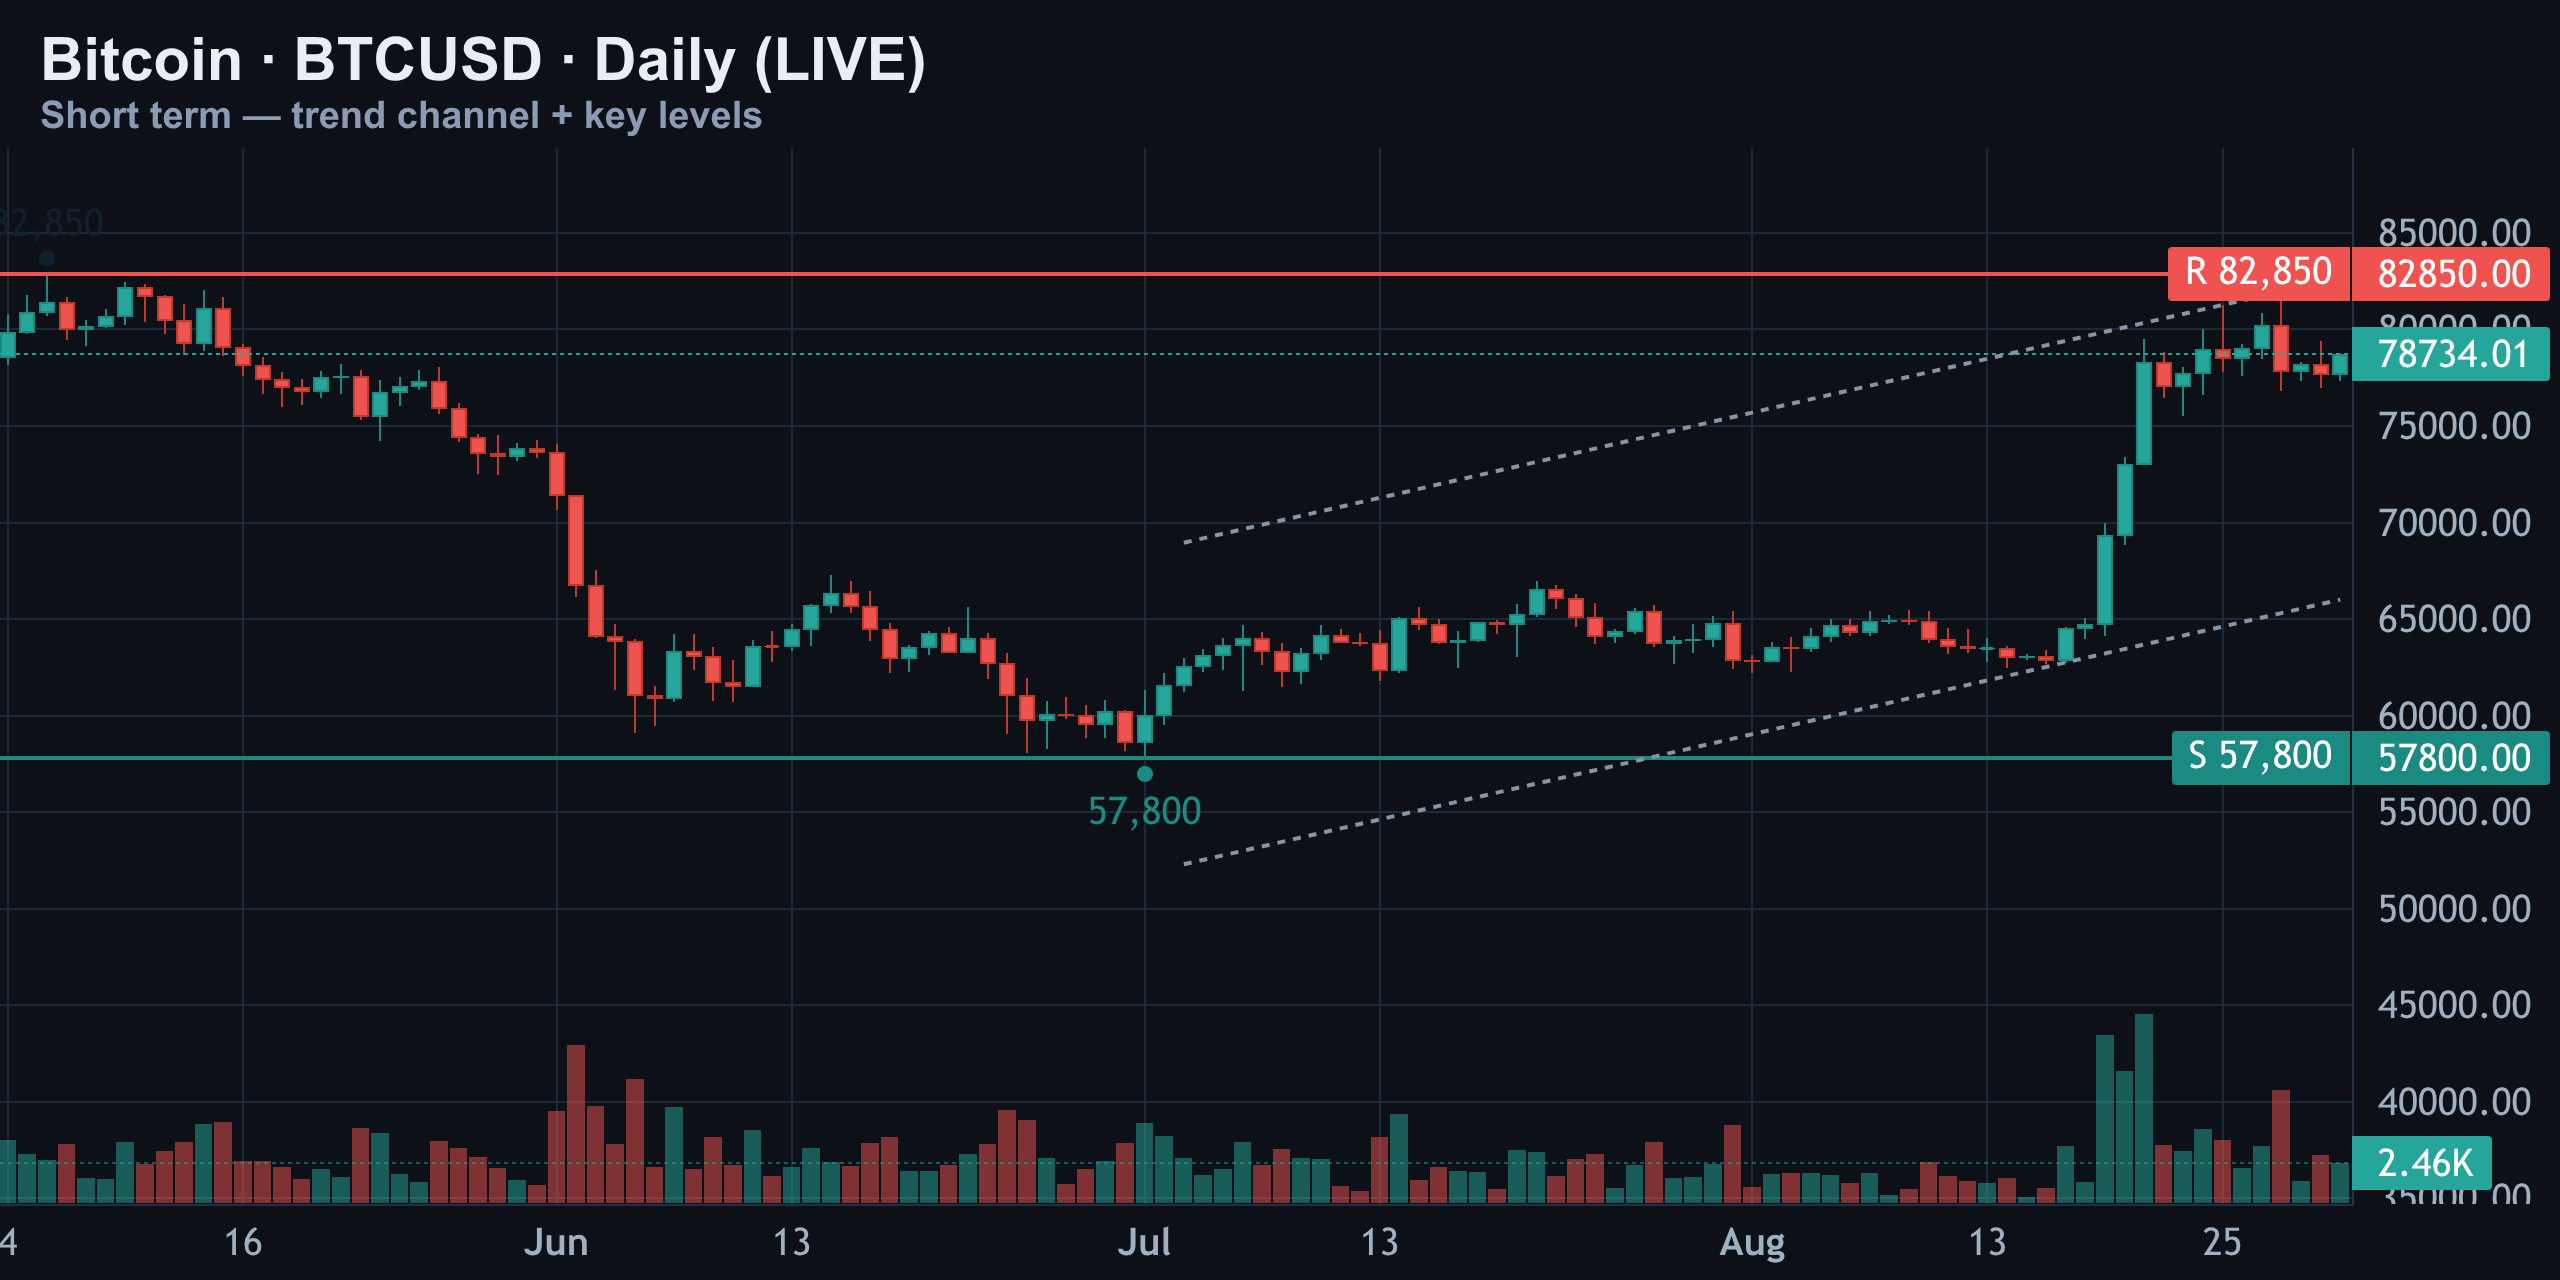
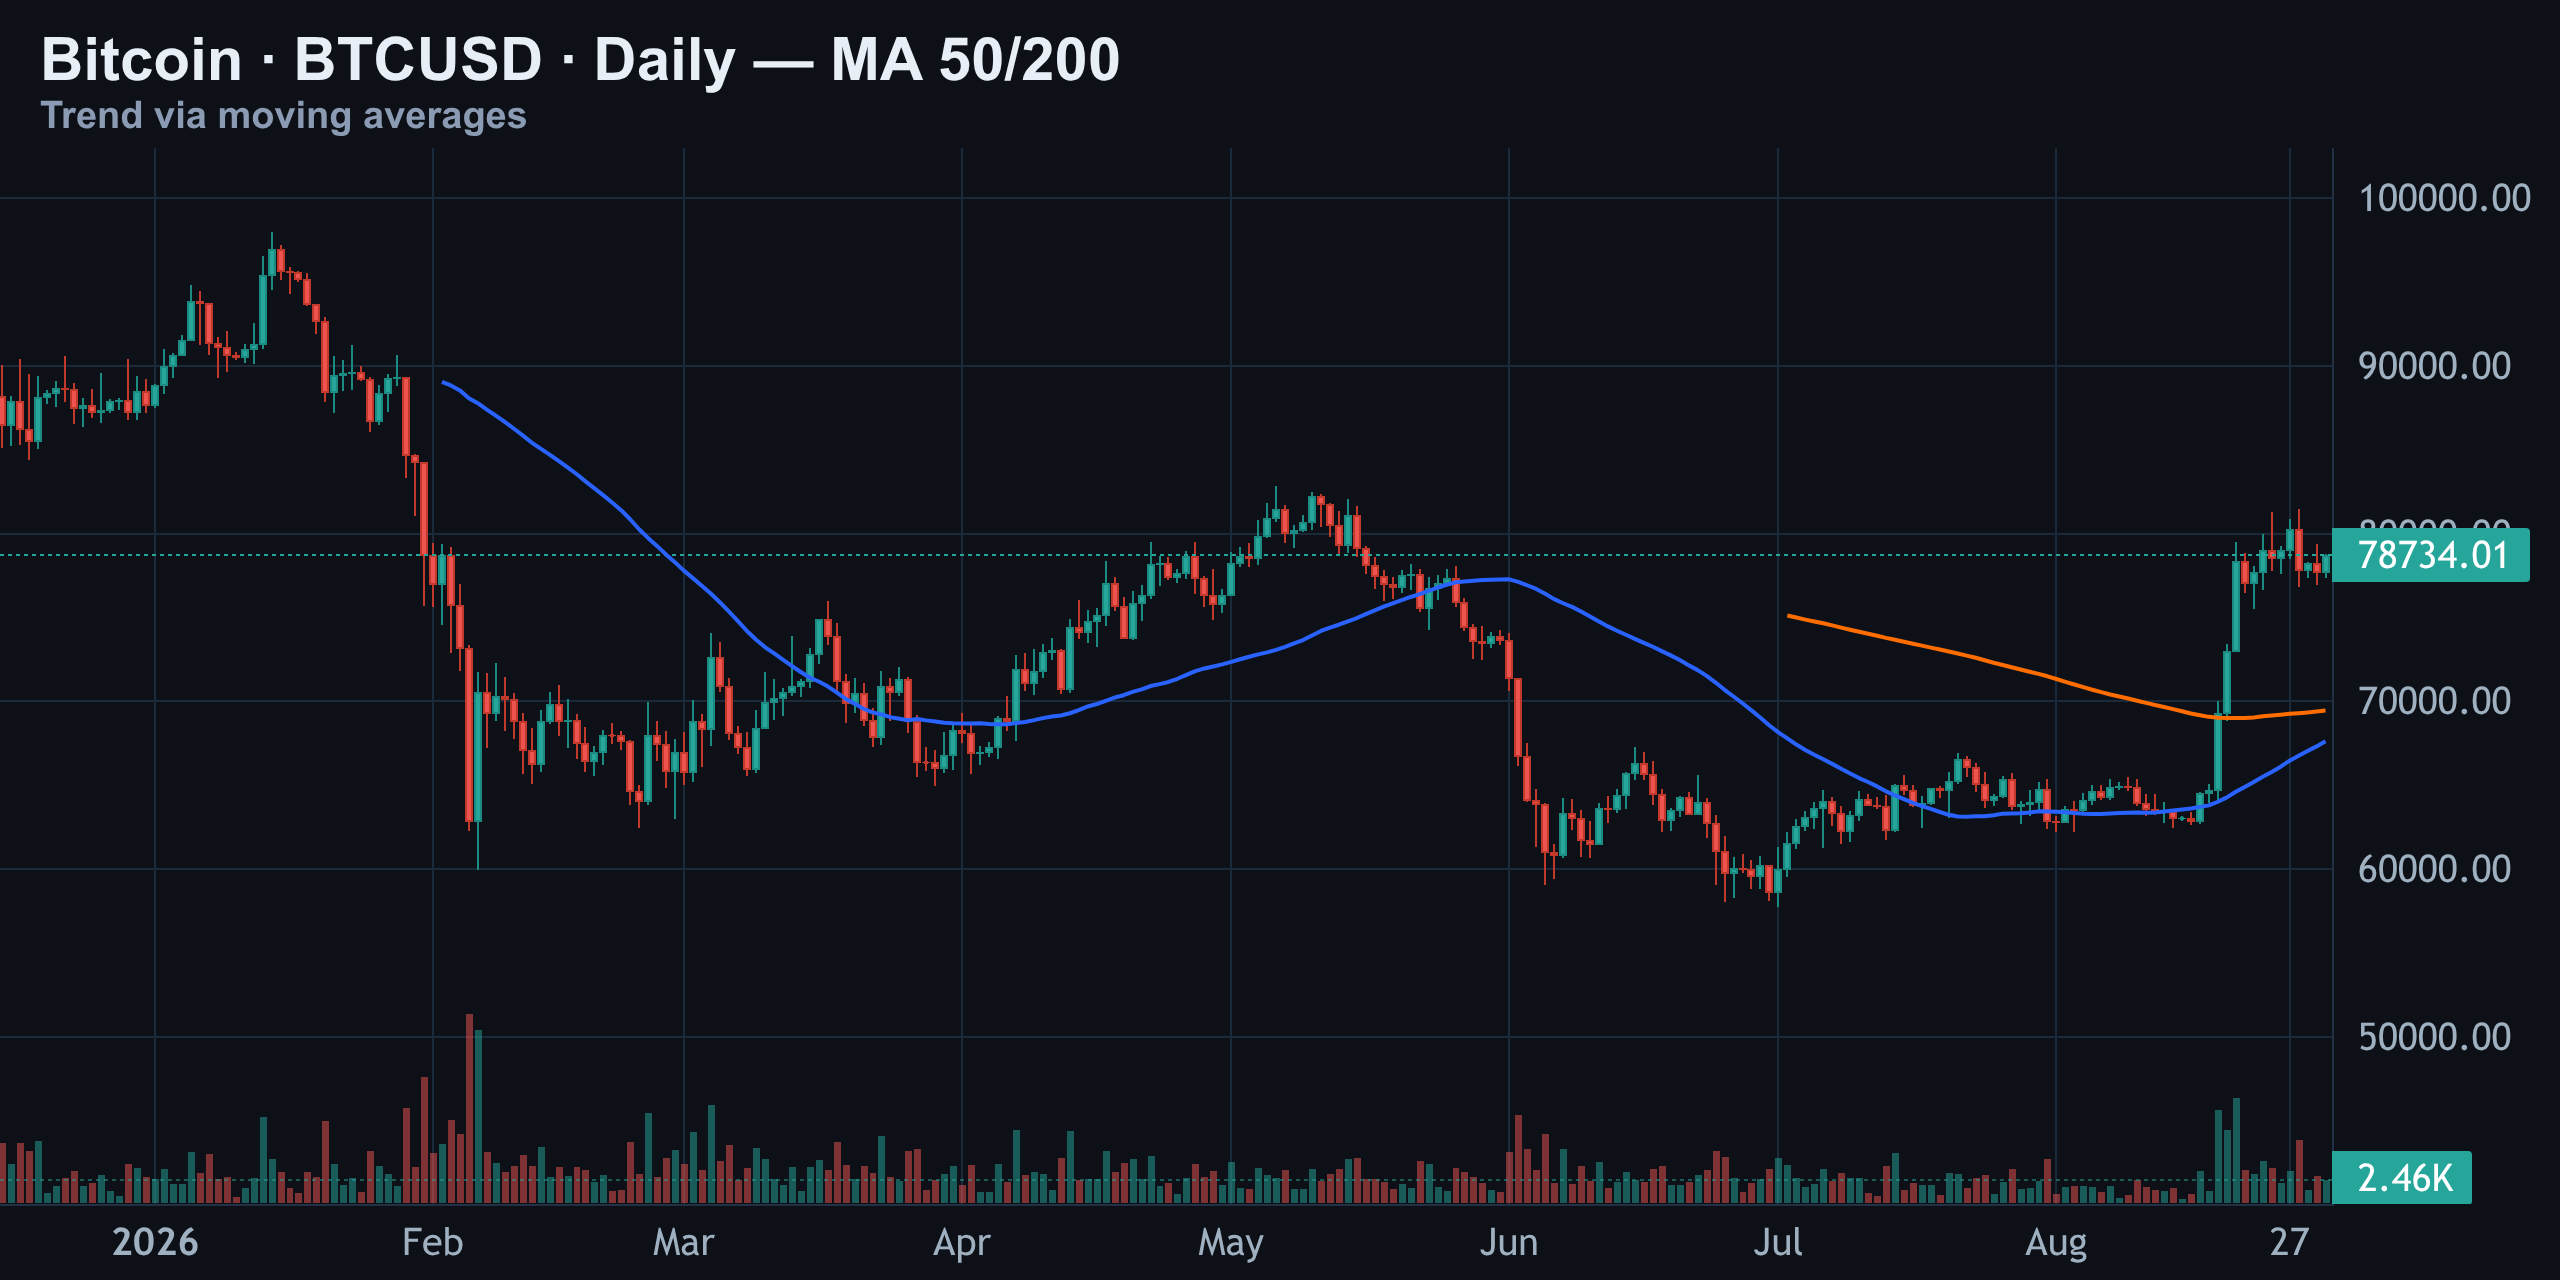
The medium-term chart supports the same interpretation: the market is trending higher, but extended moves often need time to absorb profit-taking. Price remains above the 50-day and 200-day moving averages, keeping the broader bias positive.
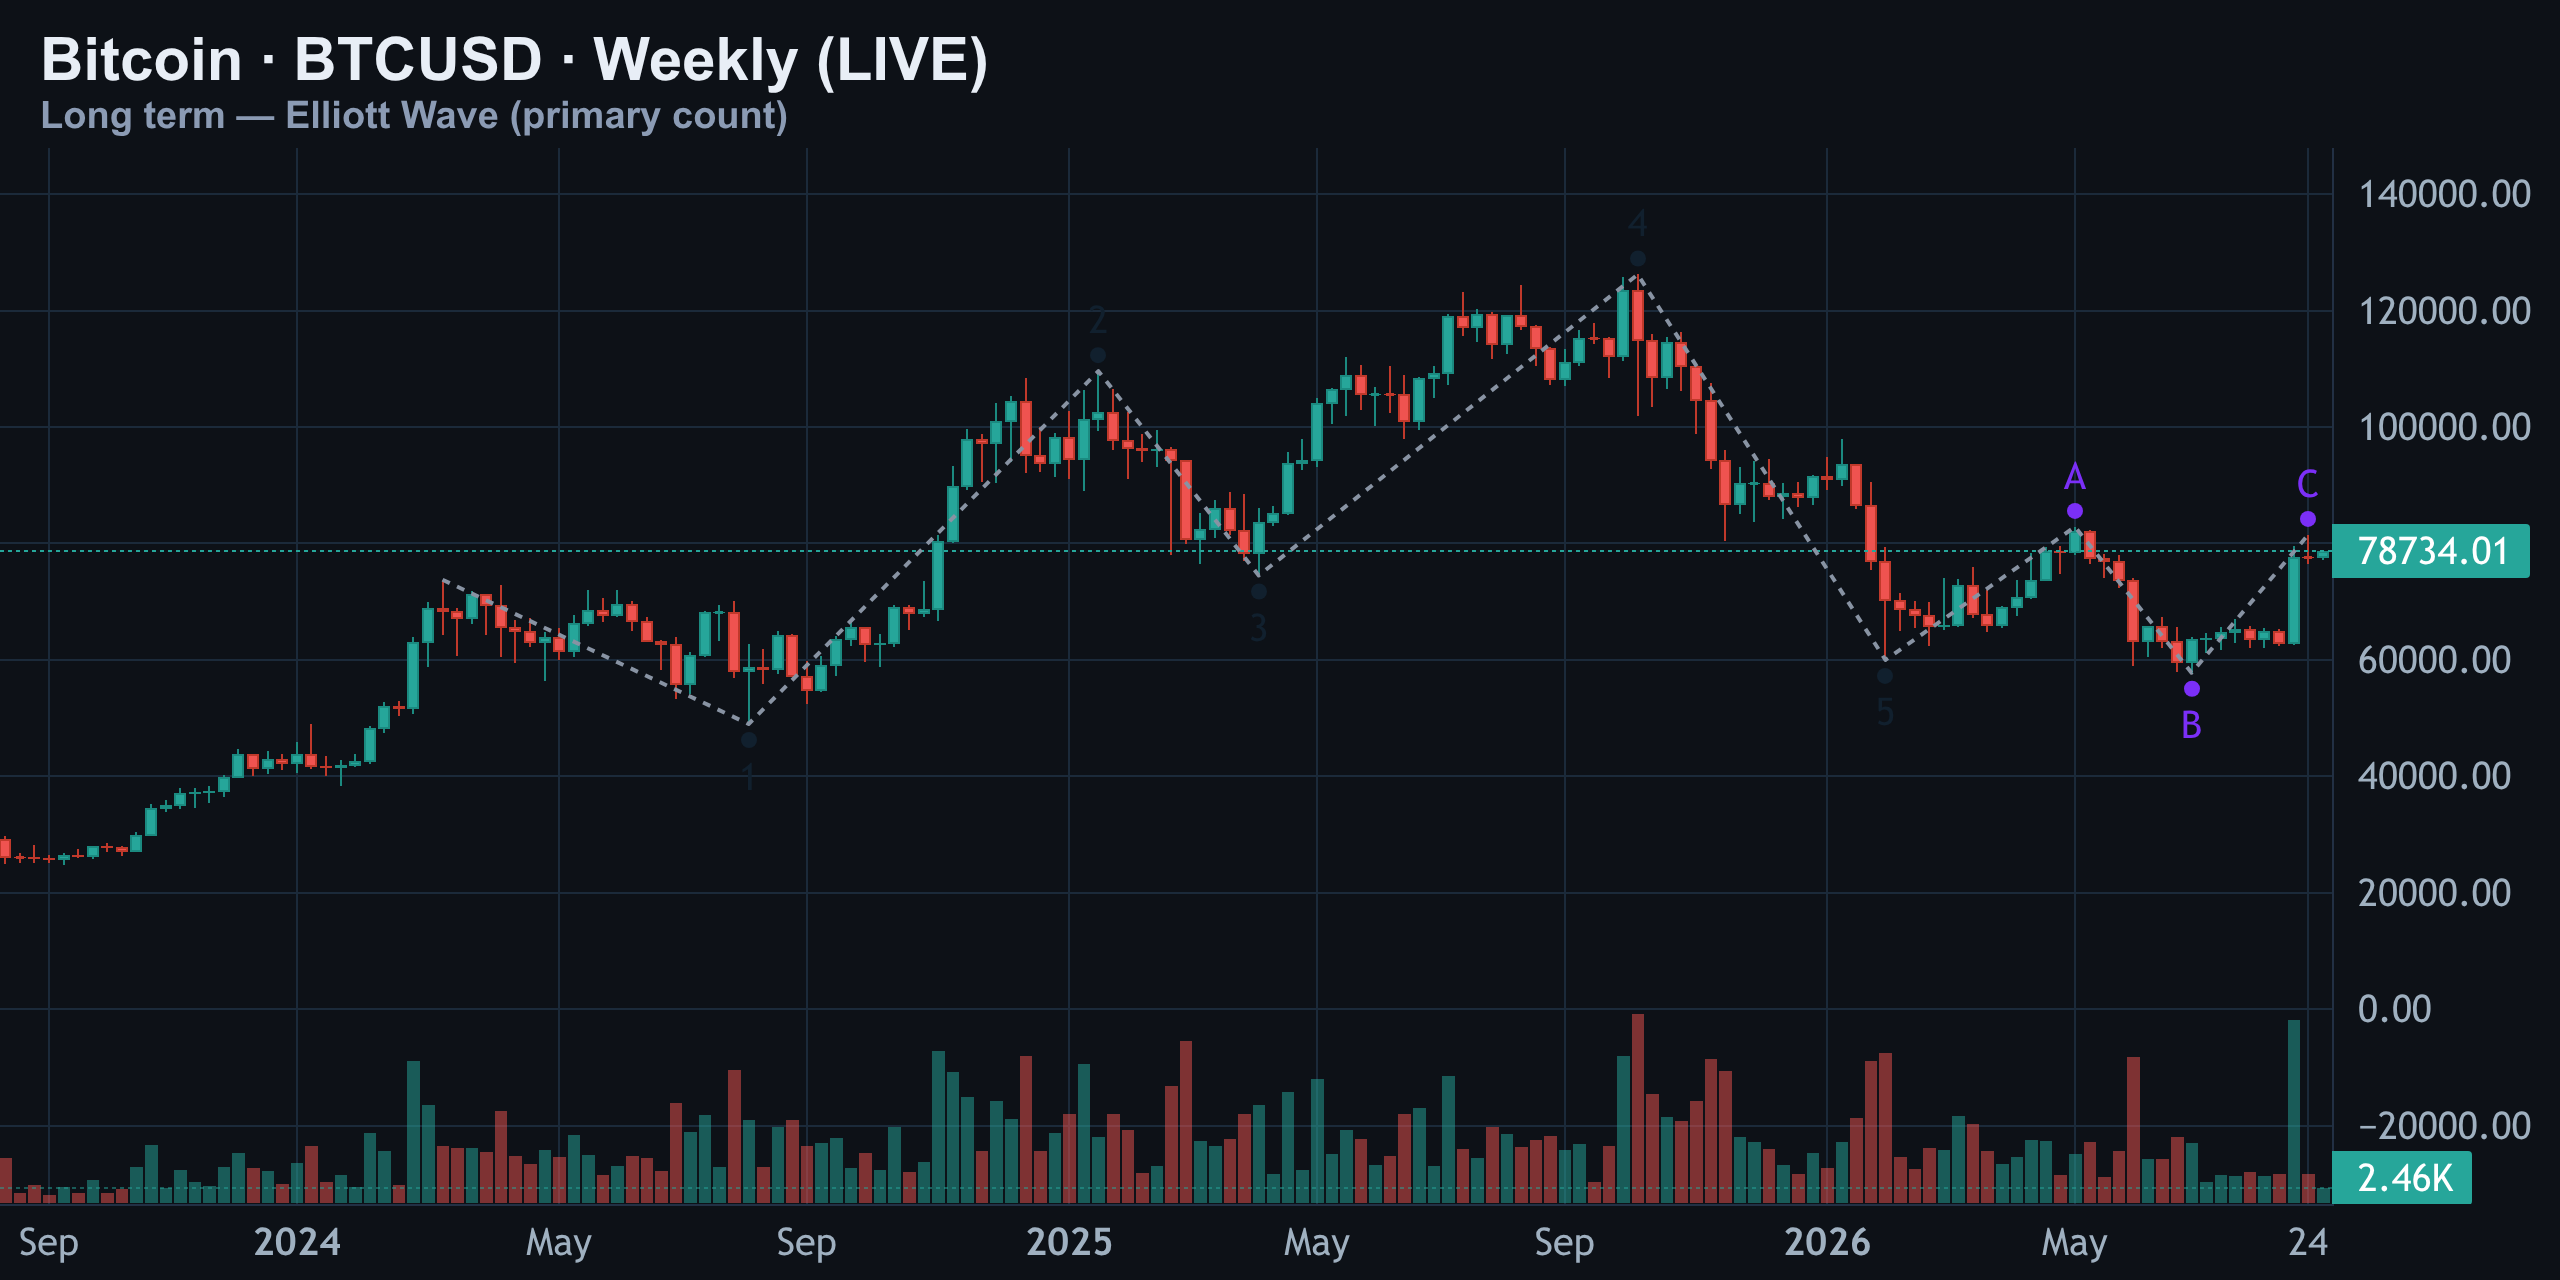
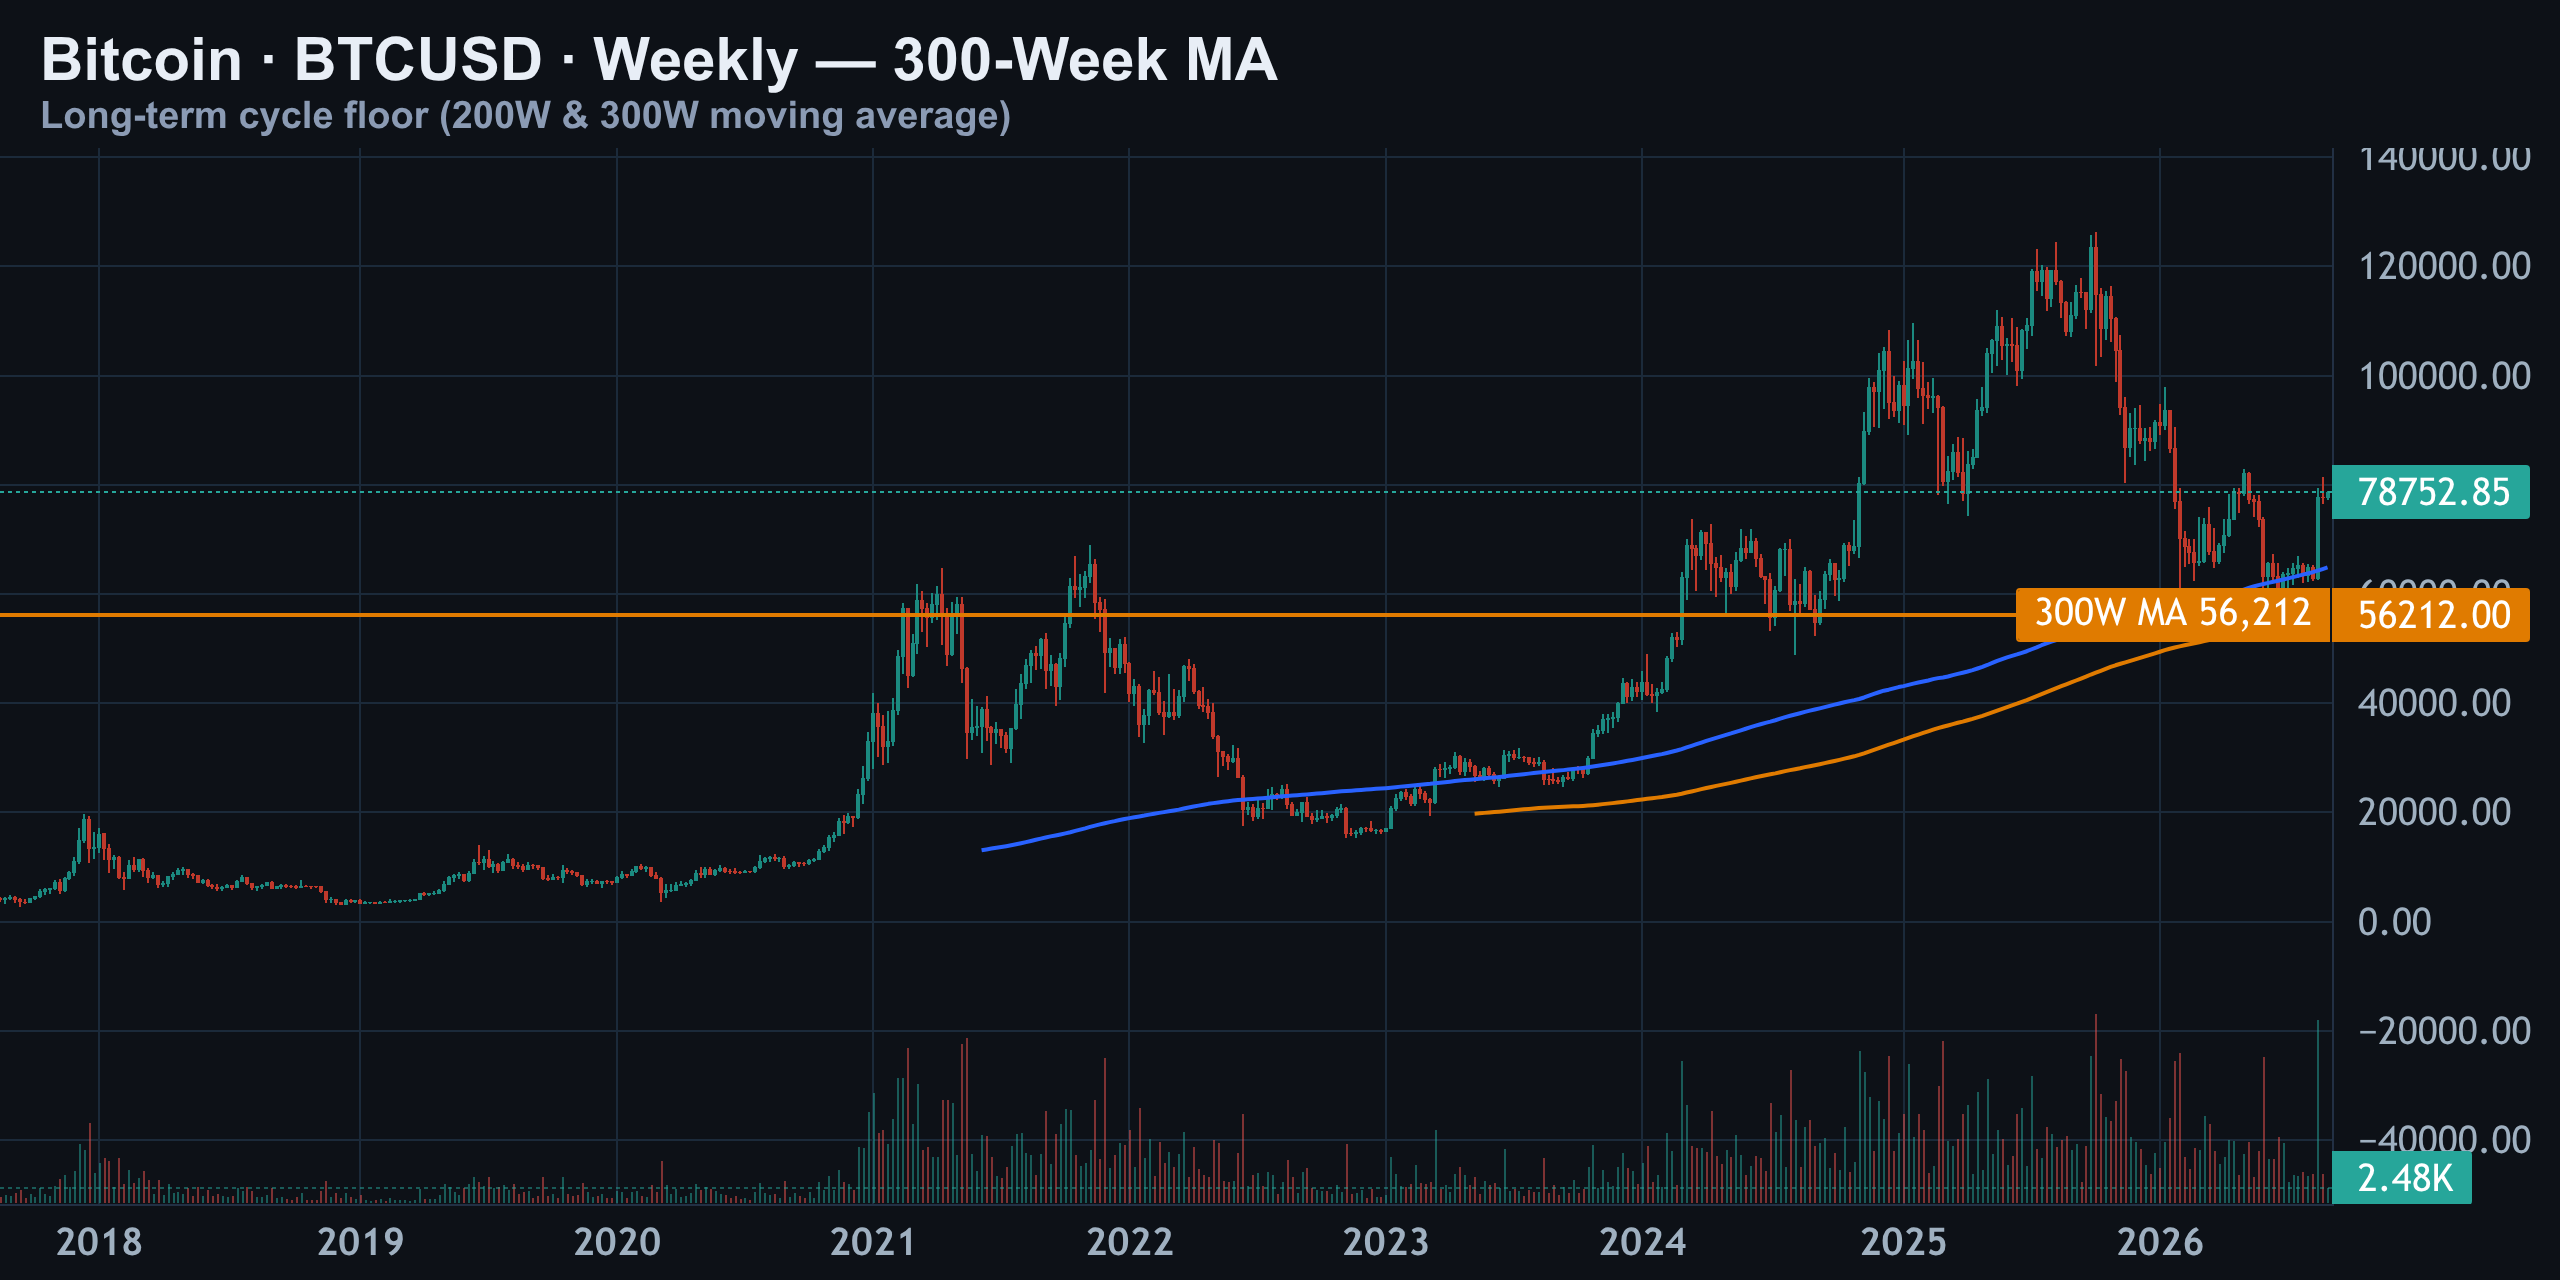
The weekly view is more ambitious. It places the current advance within a larger bullish structure, although Elliott Wave analysis is inherently scenario-based rather than certain. A weekly trend can remain bullish even while a short-term correction develops.
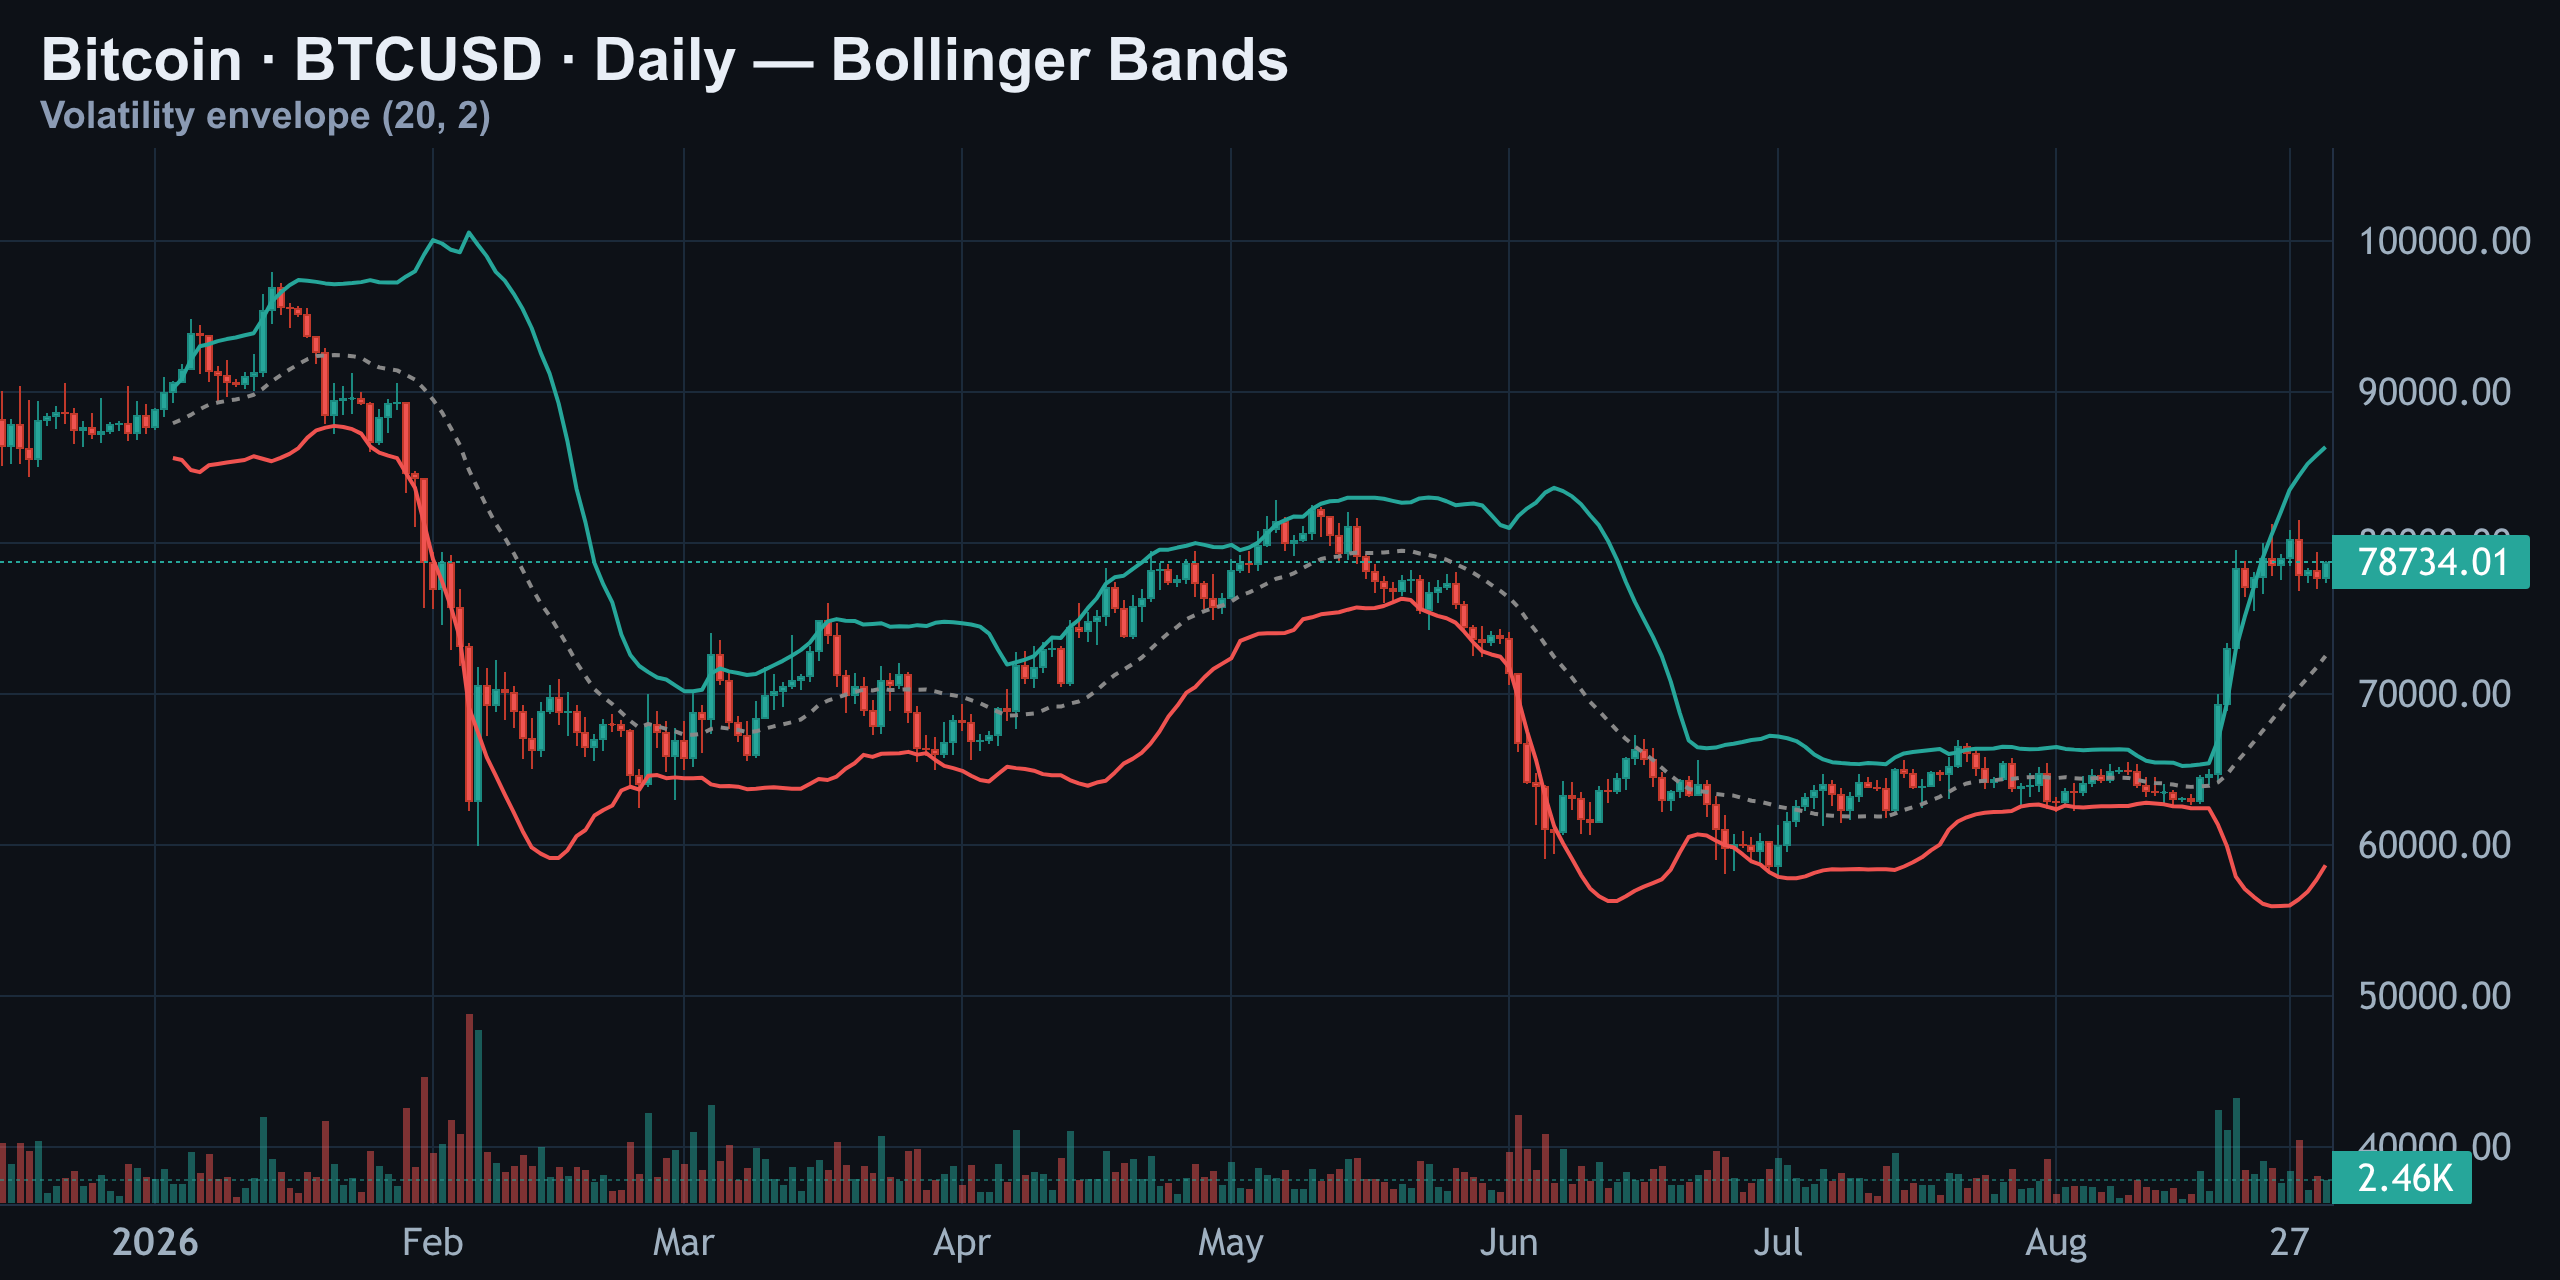
Bollinger Bands show price operating toward the upper portion of its recent range. That confirms strength, but it also warns that the market is stretched relative to its short-term mean. The key question is whether Bitcoin can walk higher along the upper band or mean-revert toward support.
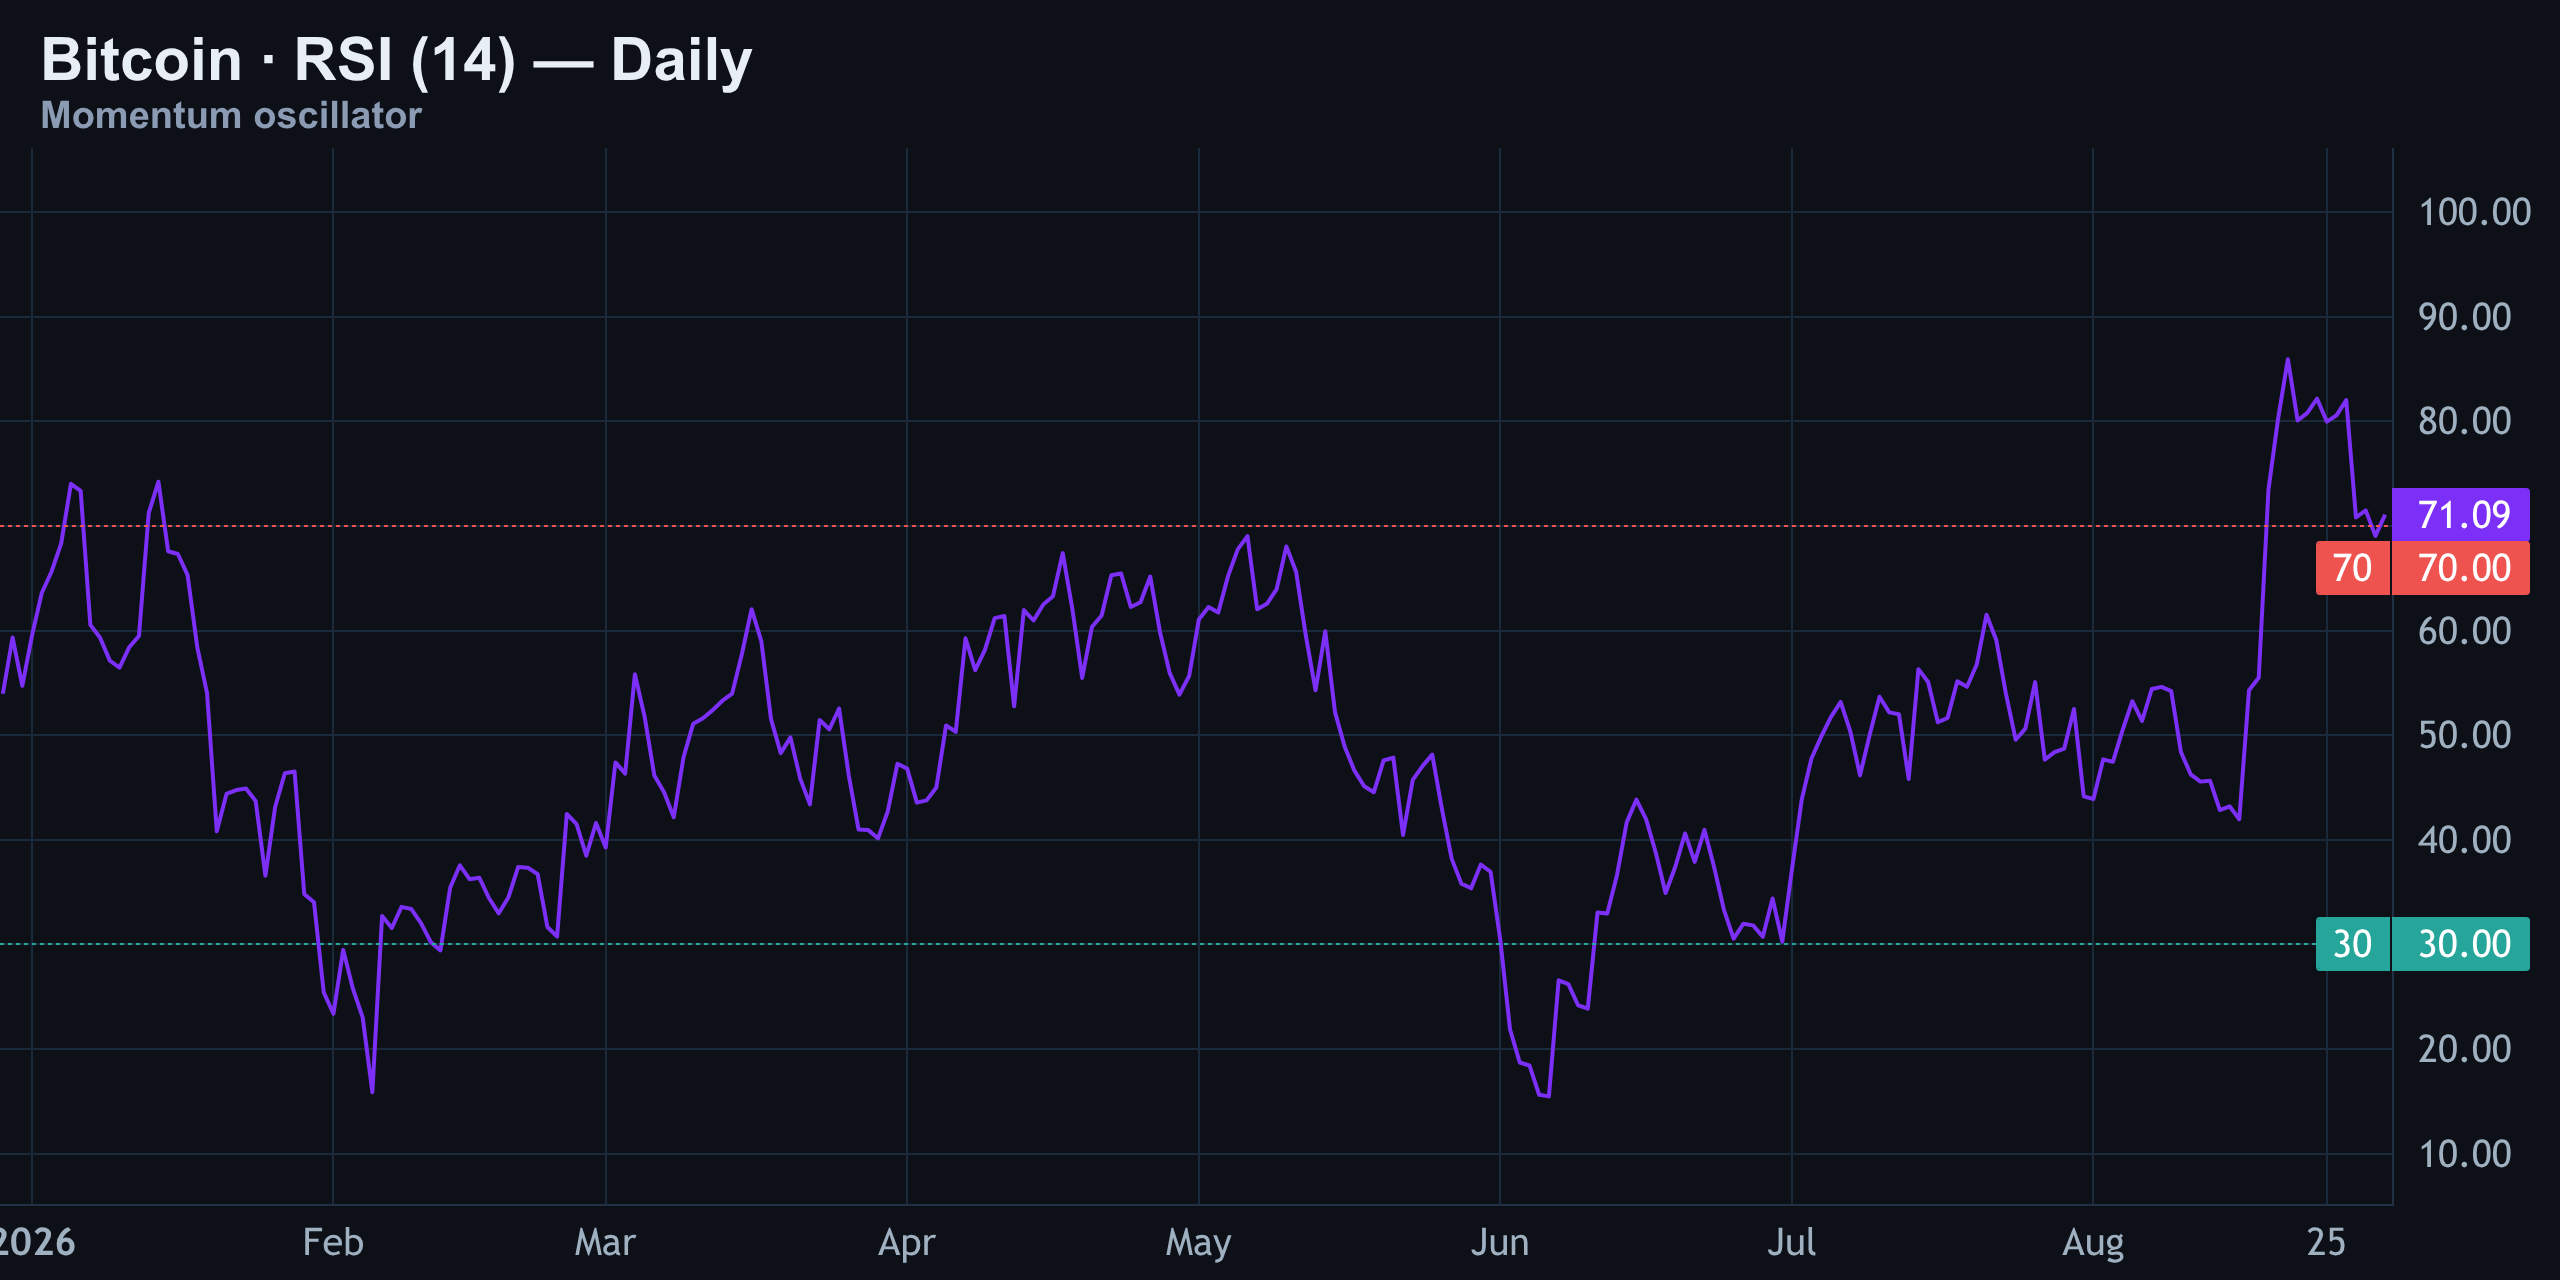
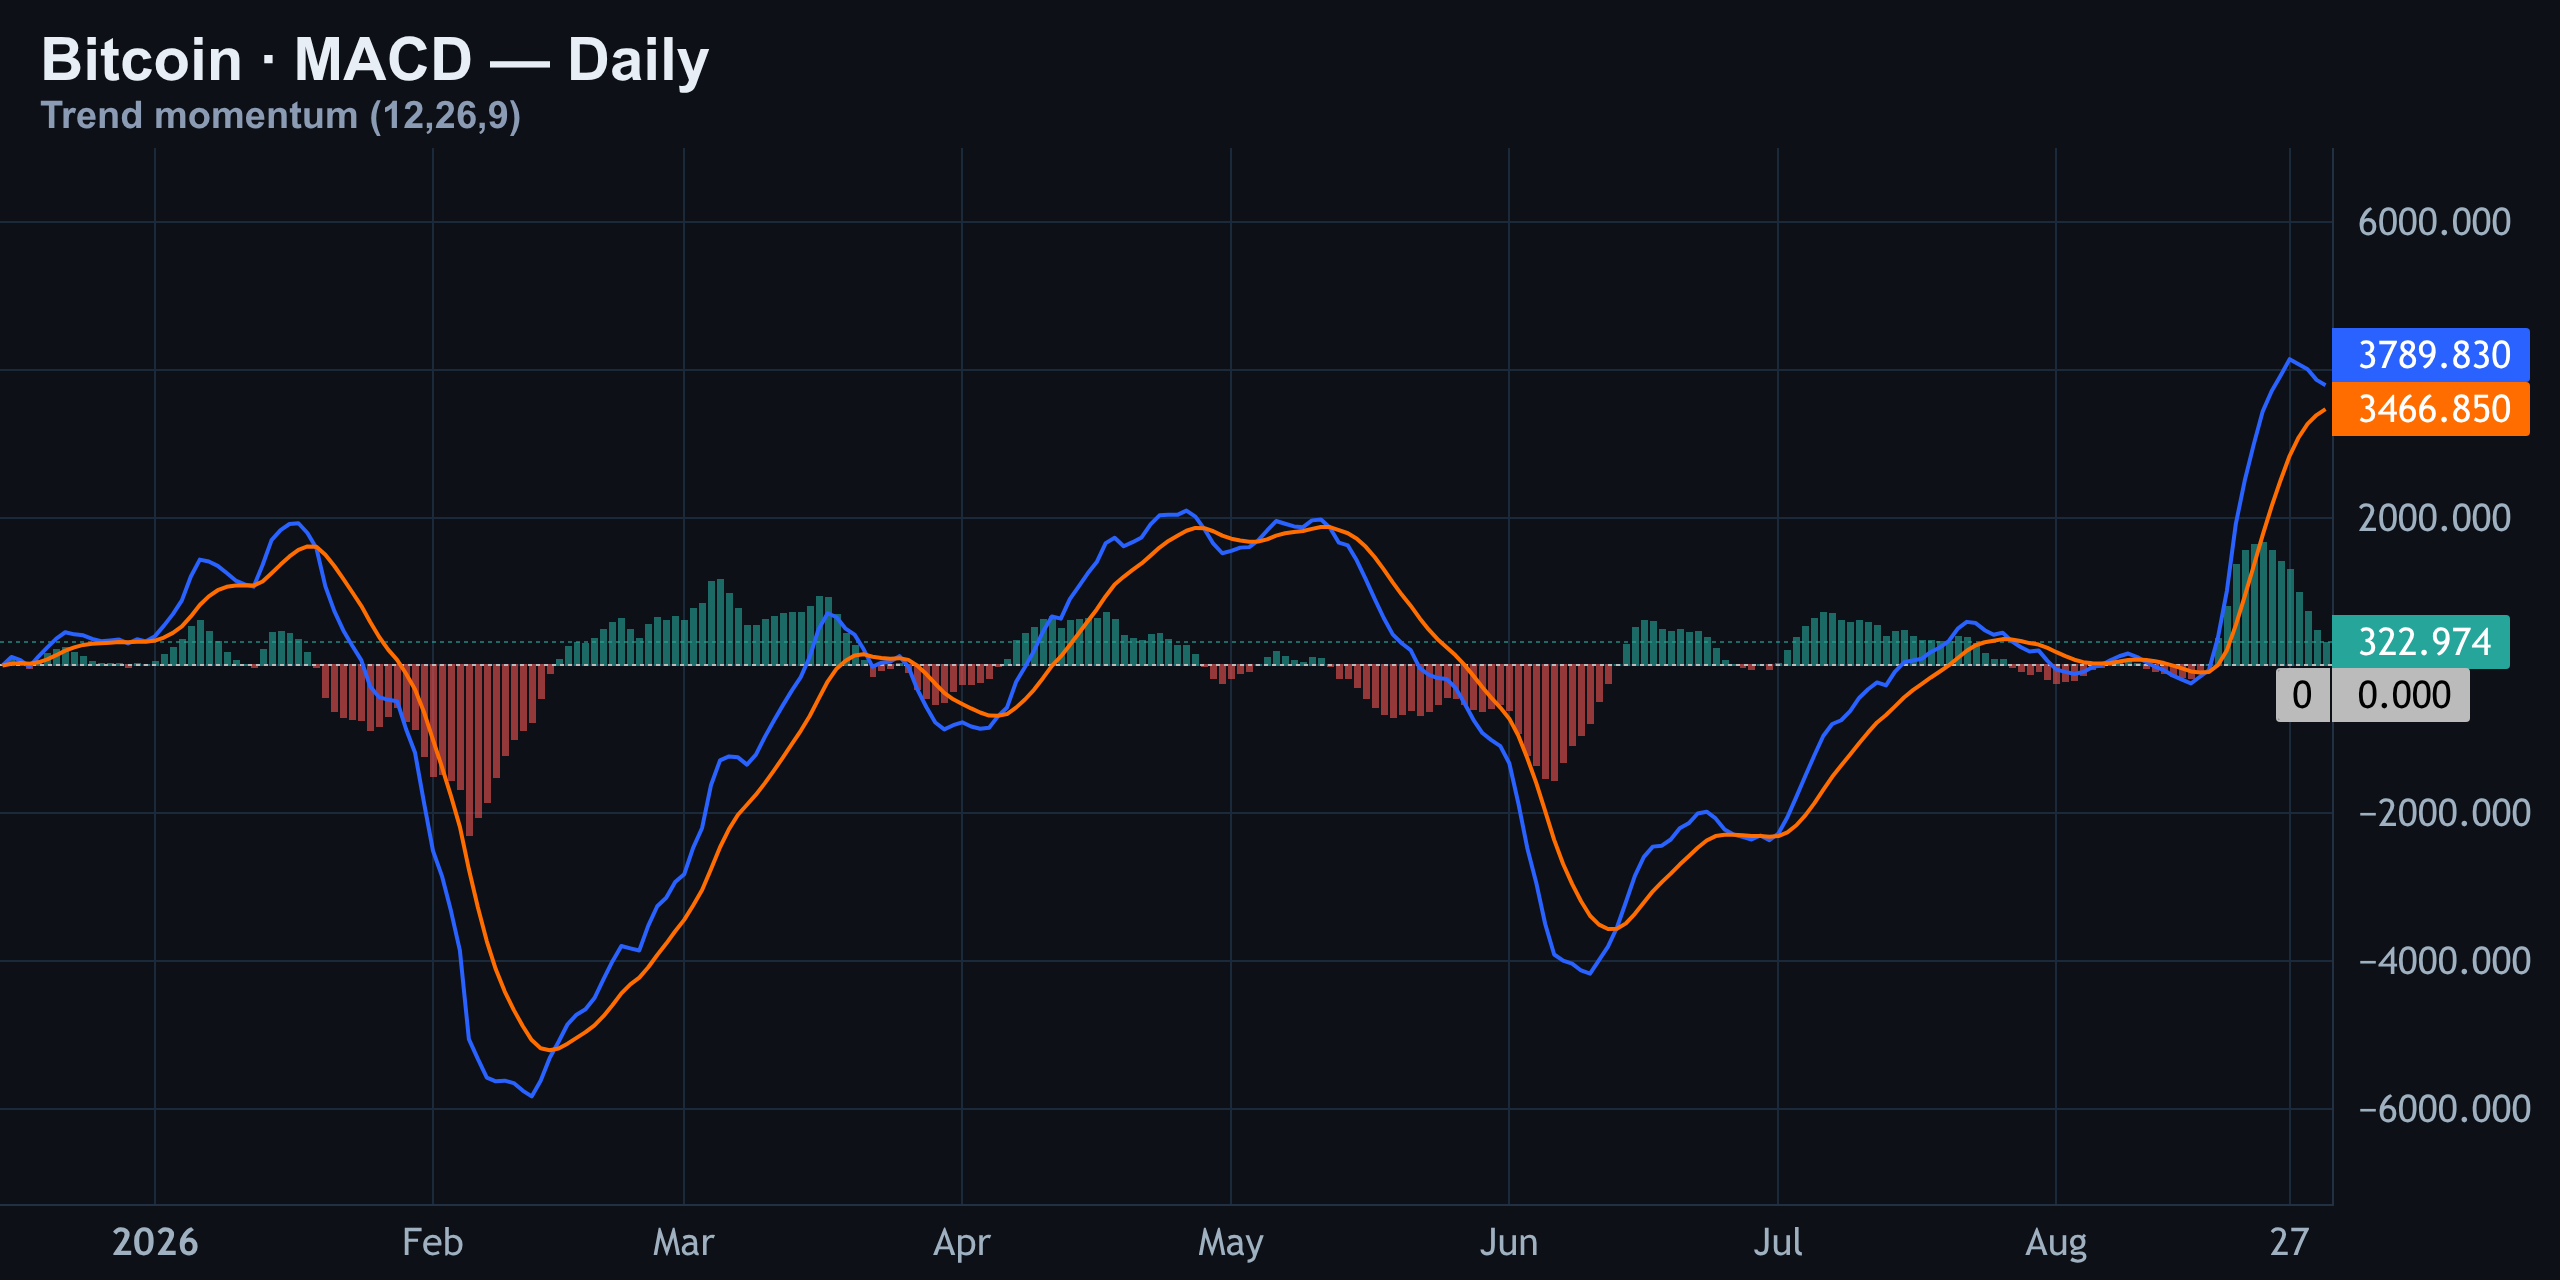
Momentum is strong but no longer cool. RSI is near 71, which is hot and consistent with a powerful trend, not automatically a sell signal. MACD remains positive and continues to lead price, meaning momentum has not yet broken.
The Bearish Pressure: Flow, Funding and Liquidation Risk
The clearest warning is coming from aggressive market flow. Taker buy-to-sell is 0.89, showing that sellers are hitting bids harder than buyers are lifting offers. Coinbase is also trading at a discount, another sign that spot demand is not fully confirming the headline price.
Funding is positive at approximately 0.01%, or roughly 11% annualized. Longs are paying to remain open. Positive funding is not inherently bearish, but it tells us leverage is leaning in one direction. If price breaks support, those long positions can turn from support into forced selling.
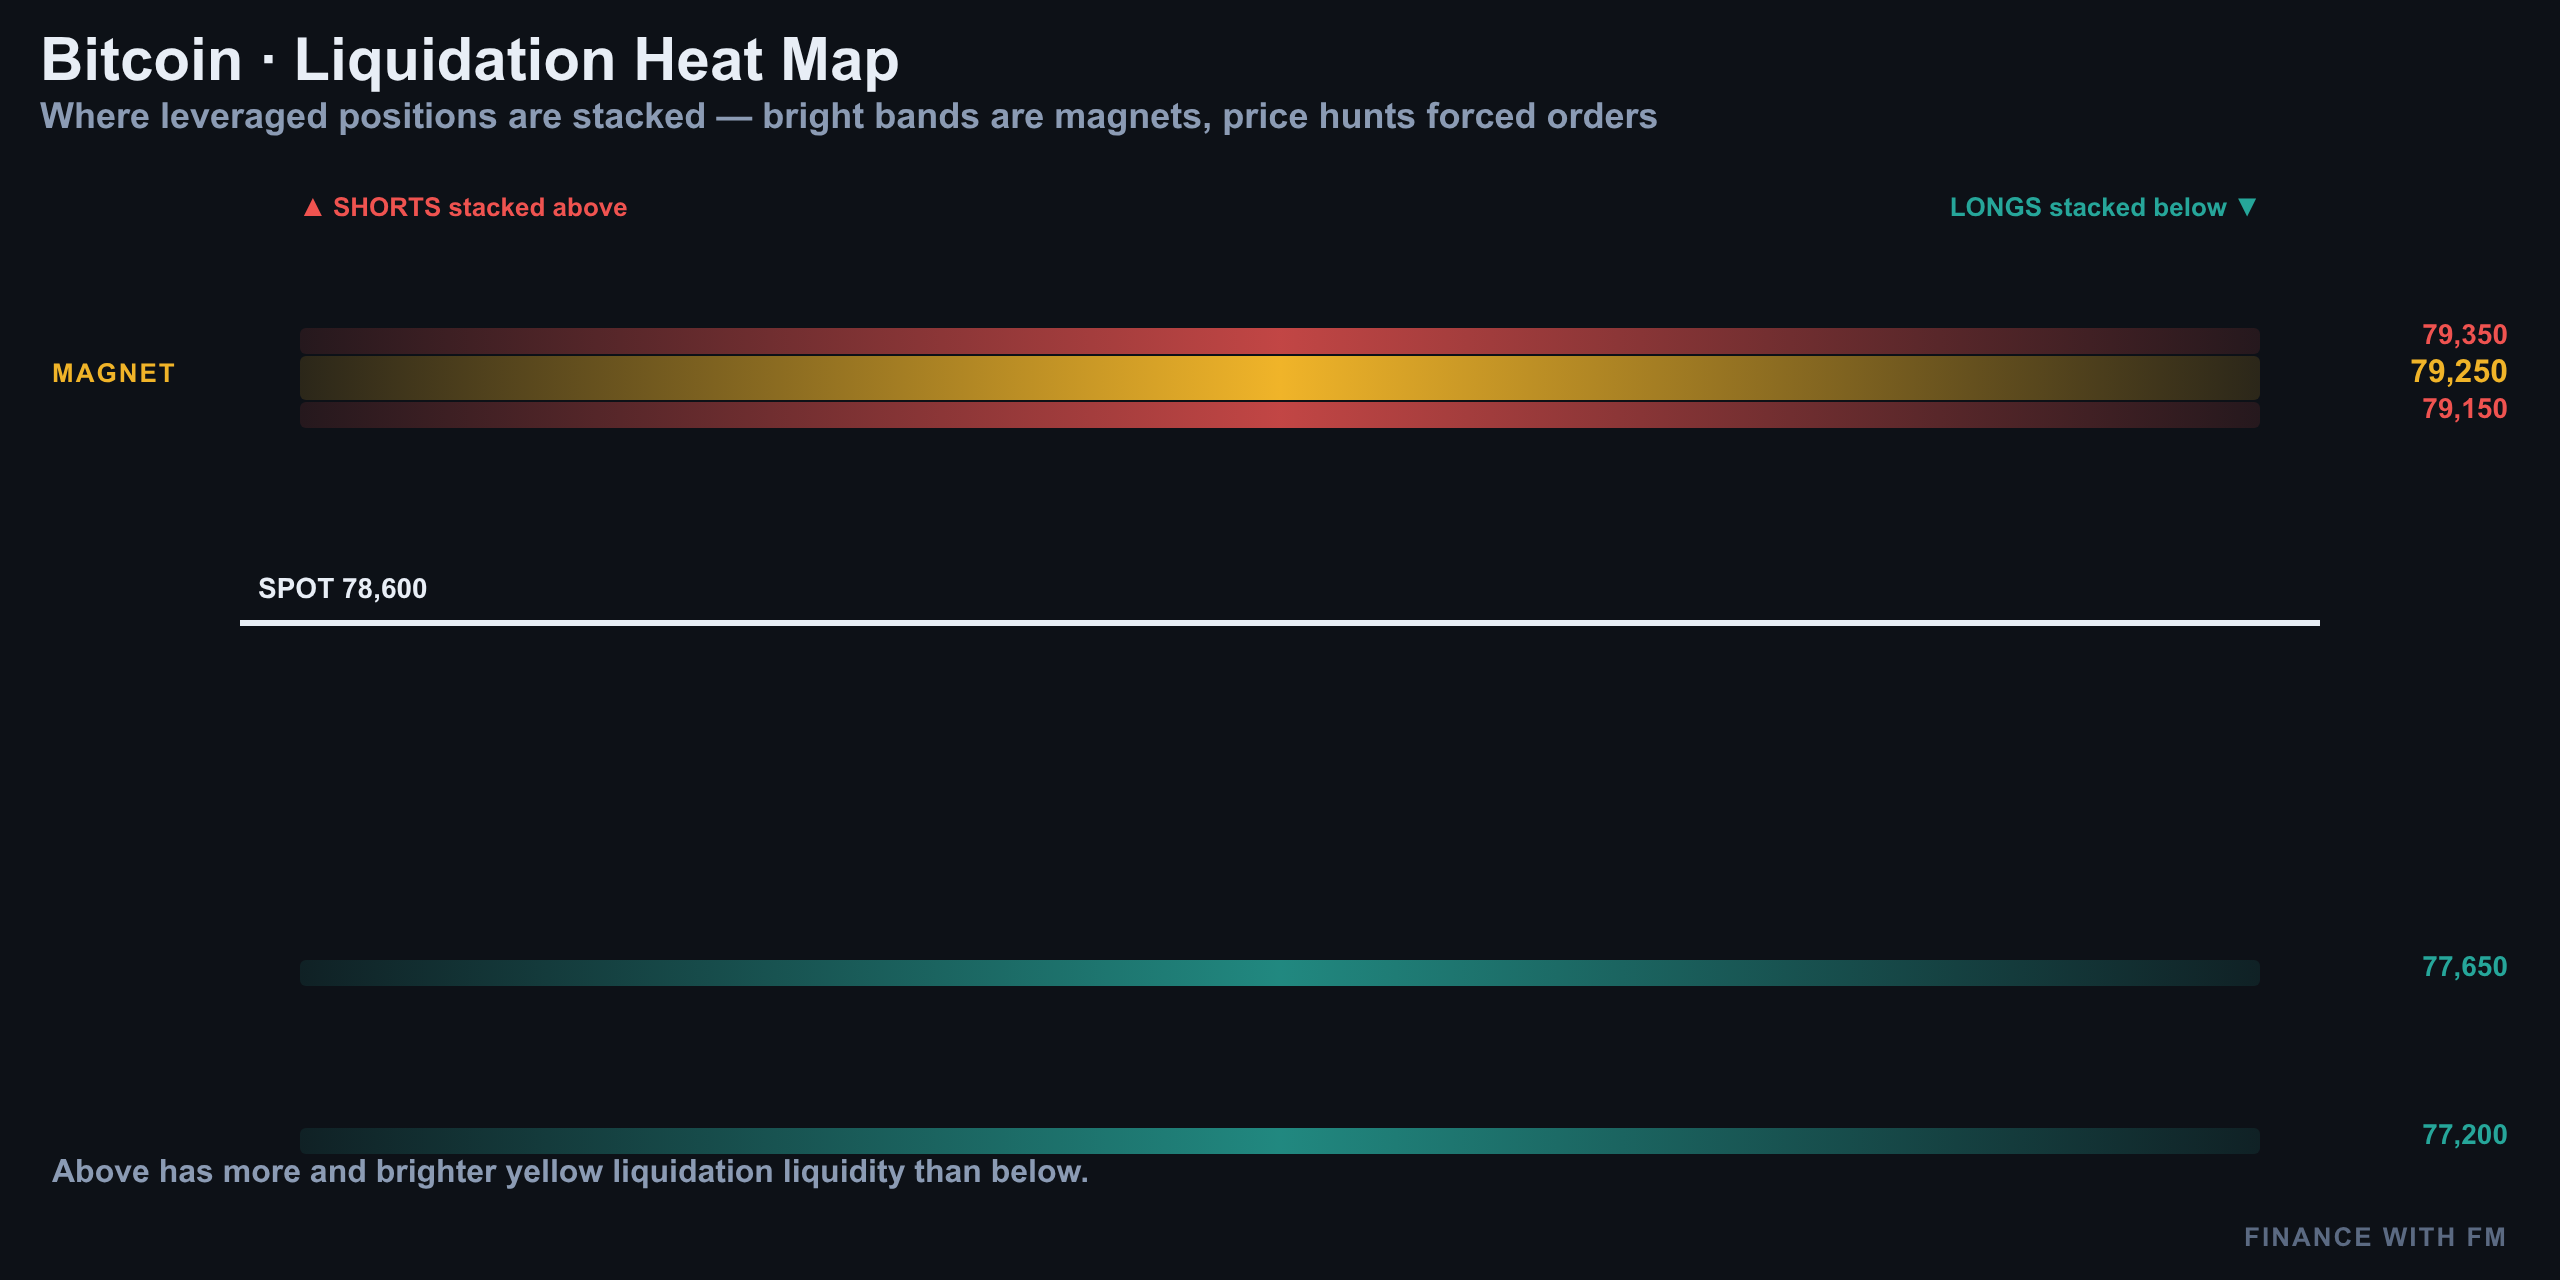
This is the potential trap below Bitcoin. A loss of $77,100 could attract price toward the long-liquidation cluster near $77,071. If selling expands, the next notable magnet is around $75,498. These levels are not predictions; they are areas where forced orders may accelerate an otherwise ordinary pullback.
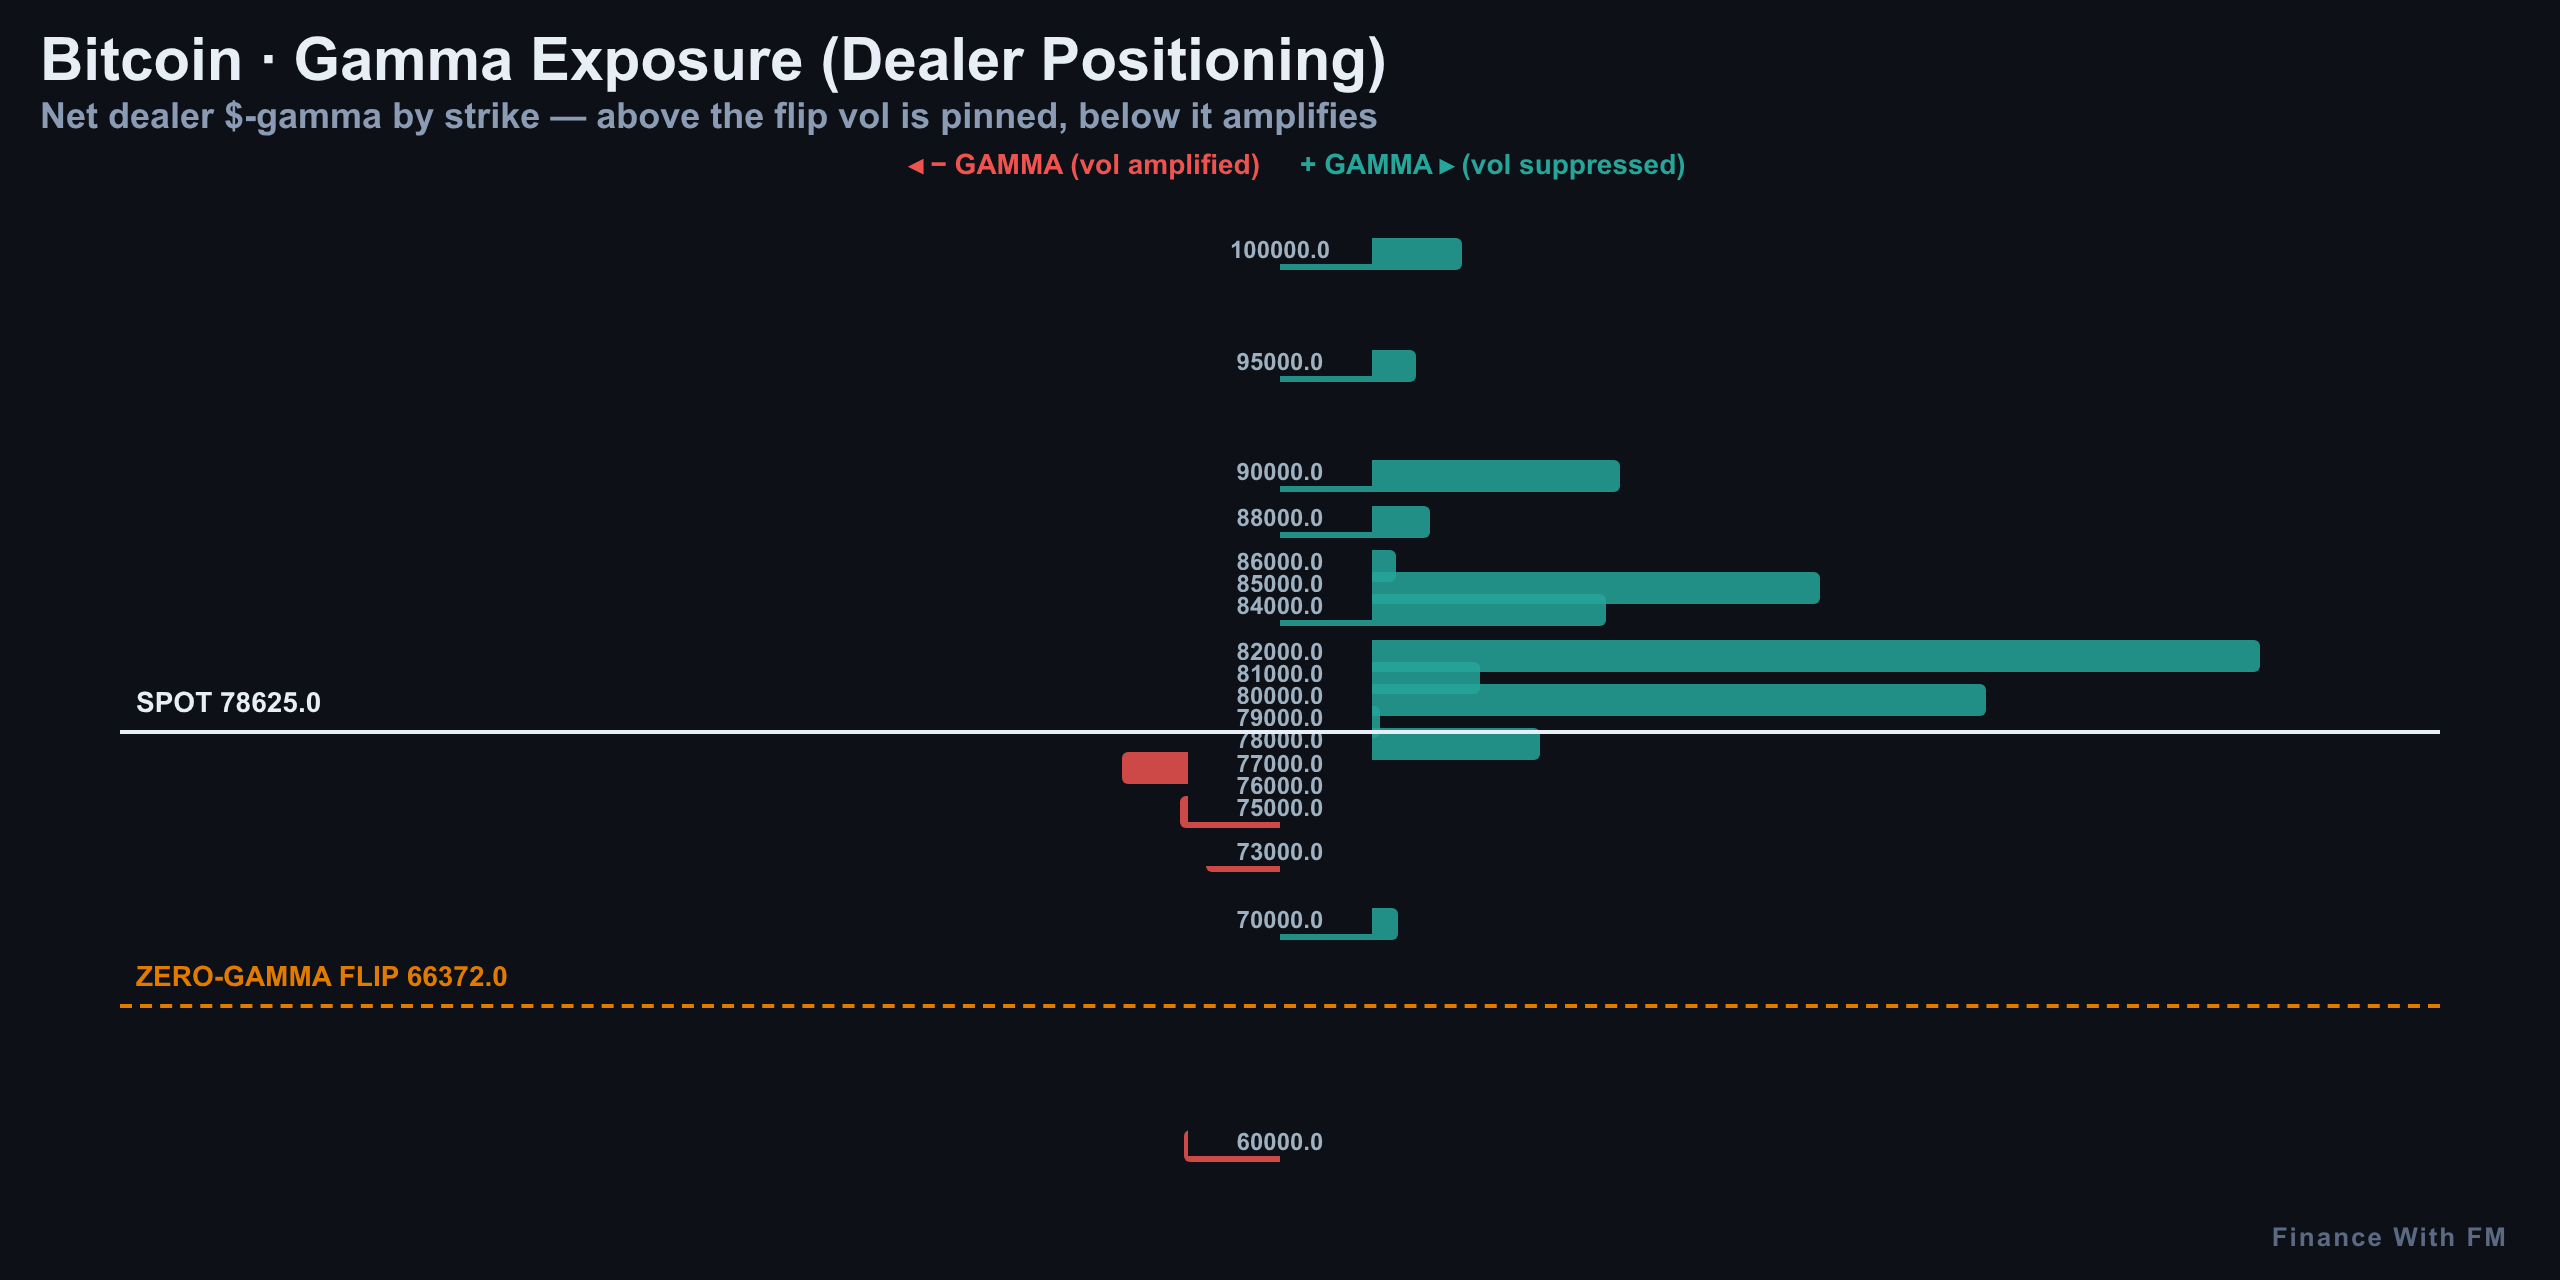
Dealer positioning complicates the picture. Positive gamma tends to dampen movement: dips can be bought and rallies can be sold. The strongest gamma support is near $78,000, while a larger overhead gamma wall sits around $82,000.
Levels That Decide the Next Bitcoin Move
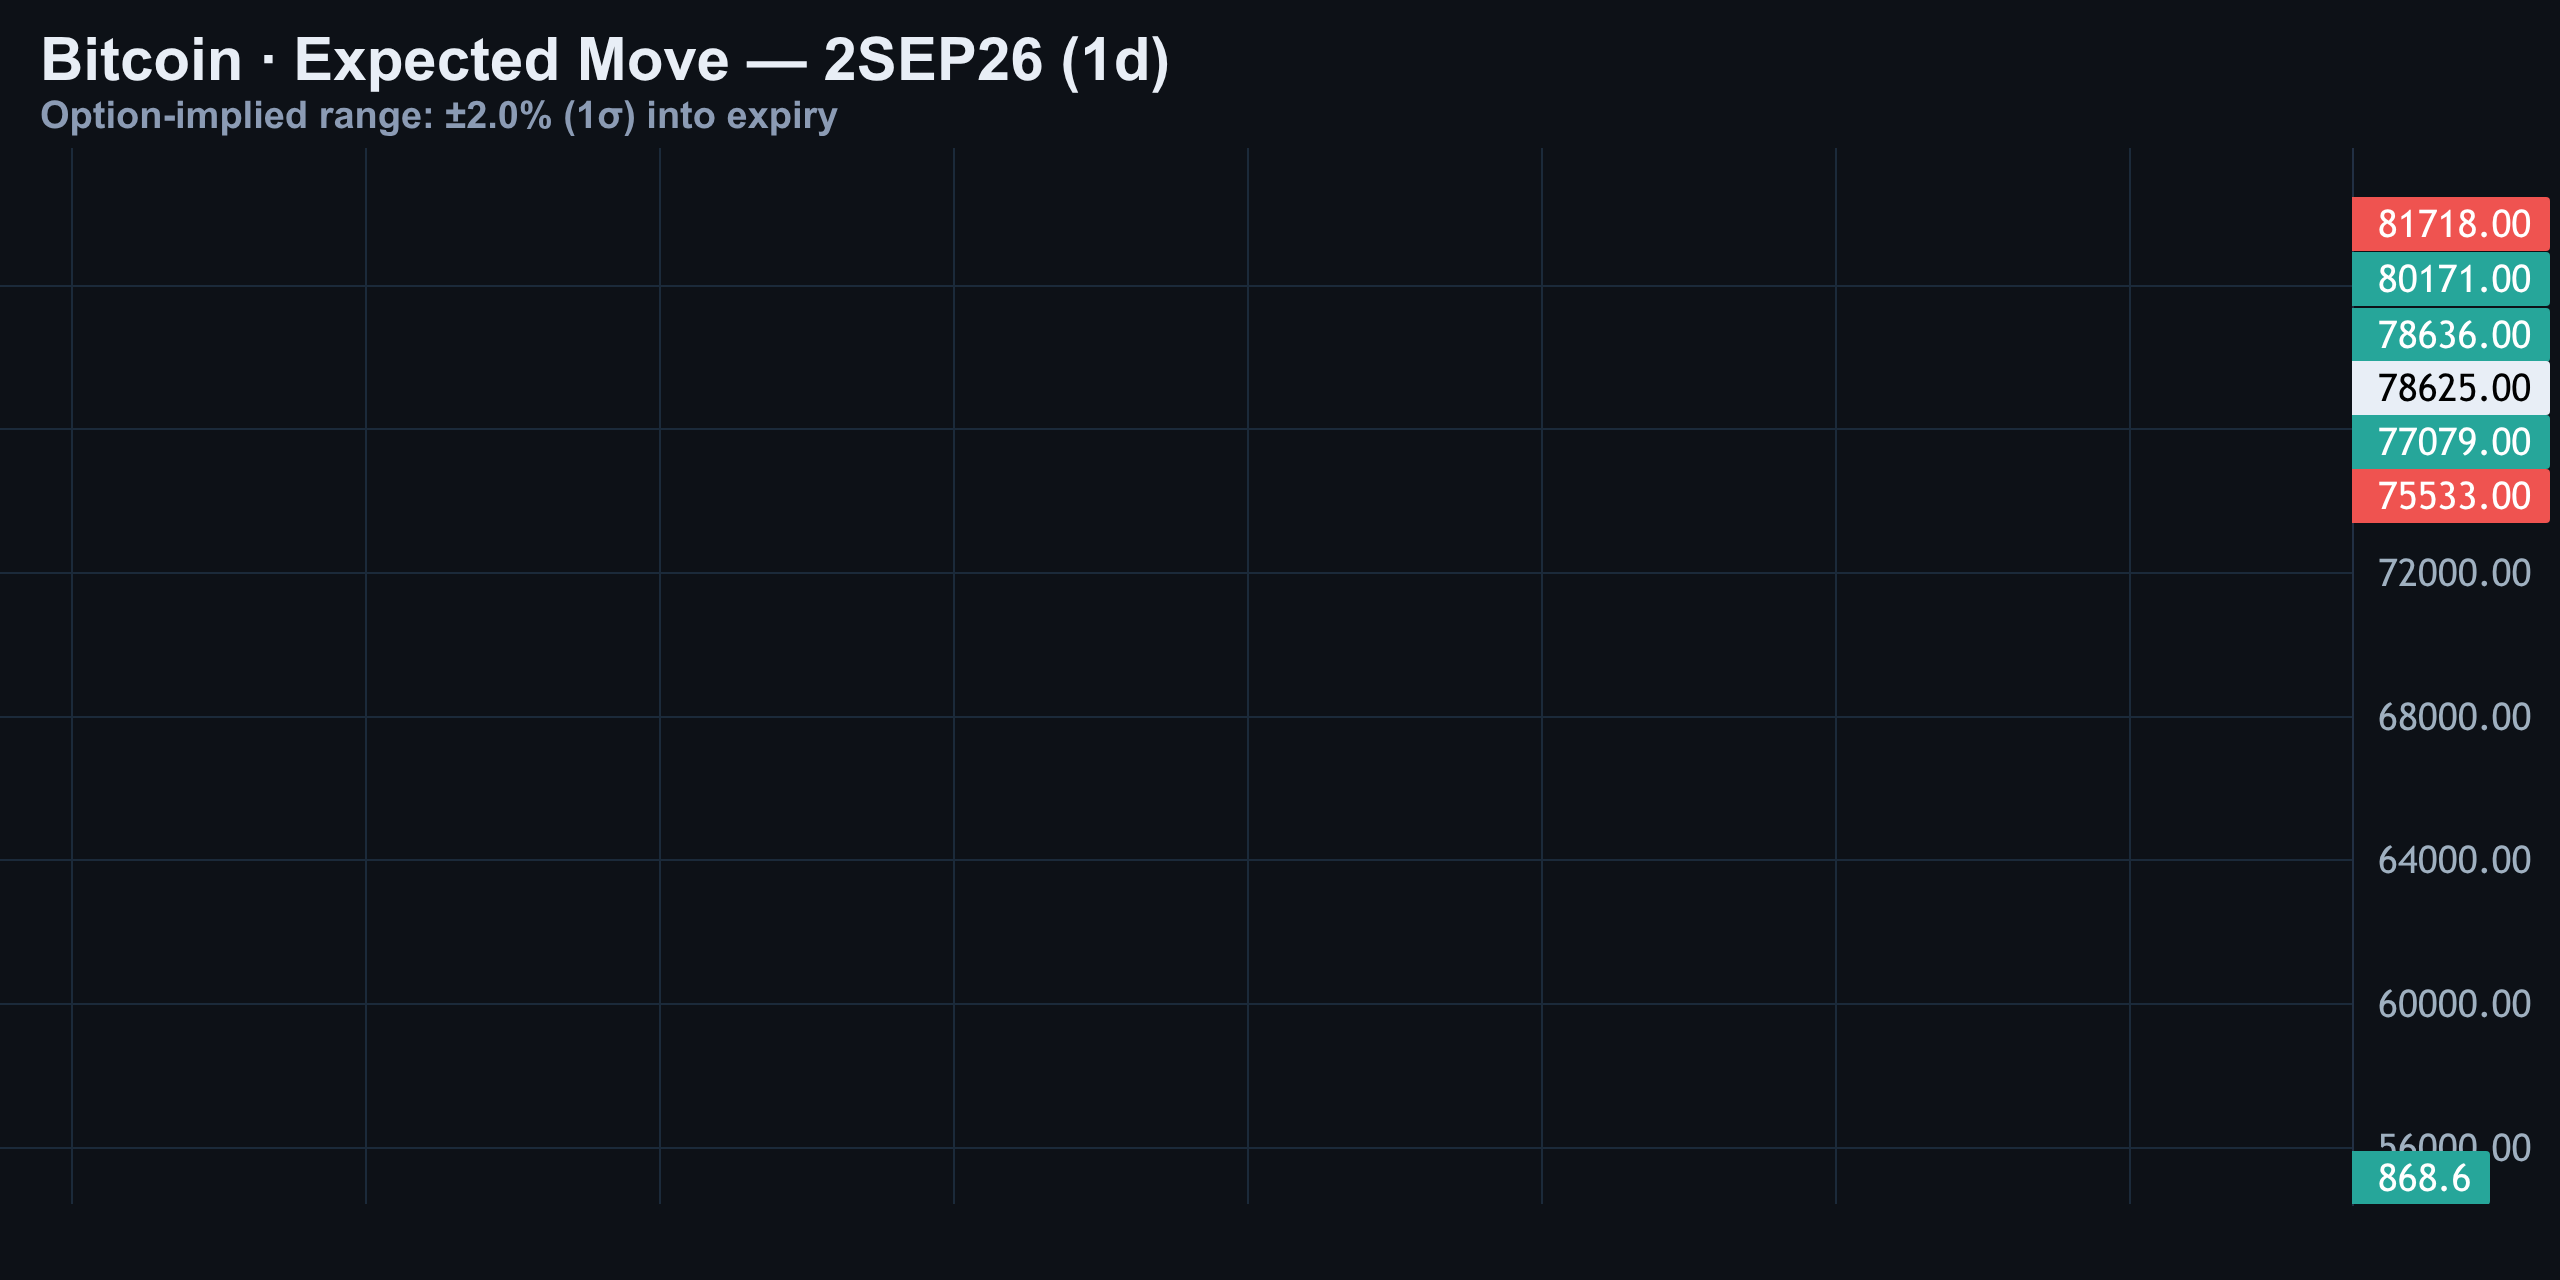
The bullish scenario is straightforward: Bitcoin holds the $77,000-$77,300 support region, reclaims $78,800, and rotates toward $80,000. Structure, positive gamma, the expected move and expiry pinning all support a controlled upside test. The estimated probability for this primary path is approximately 58%, based on the supplied market framework—not a guarantee.
The bearish scenario begins with a decisive loss of $77,100 and becomes technically important on a four-hour close below $77,292. That is the level that kills the immediate bullish setup. A break with expanding volume would suggest the market is no longer simply consolidating and may be seeking lower liquidity.
| Level | Price | Why it matters |
|---|---|---|
| Immediate bid area | $78,619 | Nearby order-book support |
| Gamma support | $78,000 | Potential dip-buying zone |
| Current spot | About $78,700 | Decision area |
| Immediate reclaim | $78,800 | Required for upside continuation |
| Expiry max pain | $78,500 | Potential price magnet |
| Long-liquidation cluster | $77,071 | Downside liquidity target |
| Bullish invalidation | $77,292 | Four-hour close below flips the setup |
| Deeper downside magnet | $75,498 | Next liquidation area |
| Call wall | $80,000 | Primary upside objective and resistance |
| Major gamma wall | $82,000 | Higher resistance zone |
An illustrative, conditional framework—not financial advice—would be an entry near $78,000 only after support is confirmed, a protective stop at $77,292, and an initial target near $79,842. That produces approximately a 1:2.6 risk-to-reward ratio. A push toward $80,000 would be the broader upside objective, while a four-hour close below the invalidation level ends the thesis.
On-Chain Context: Trend Support Beneath the Noise
Price action is only one part of the Bitcoin picture. MVRV helps compare market value with the aggregate cost basis represented by realized value. When MVRV rises, holders are generally sitting on larger unrealized gains; that can confirm strength, but it can also increase the incentive to take profits.
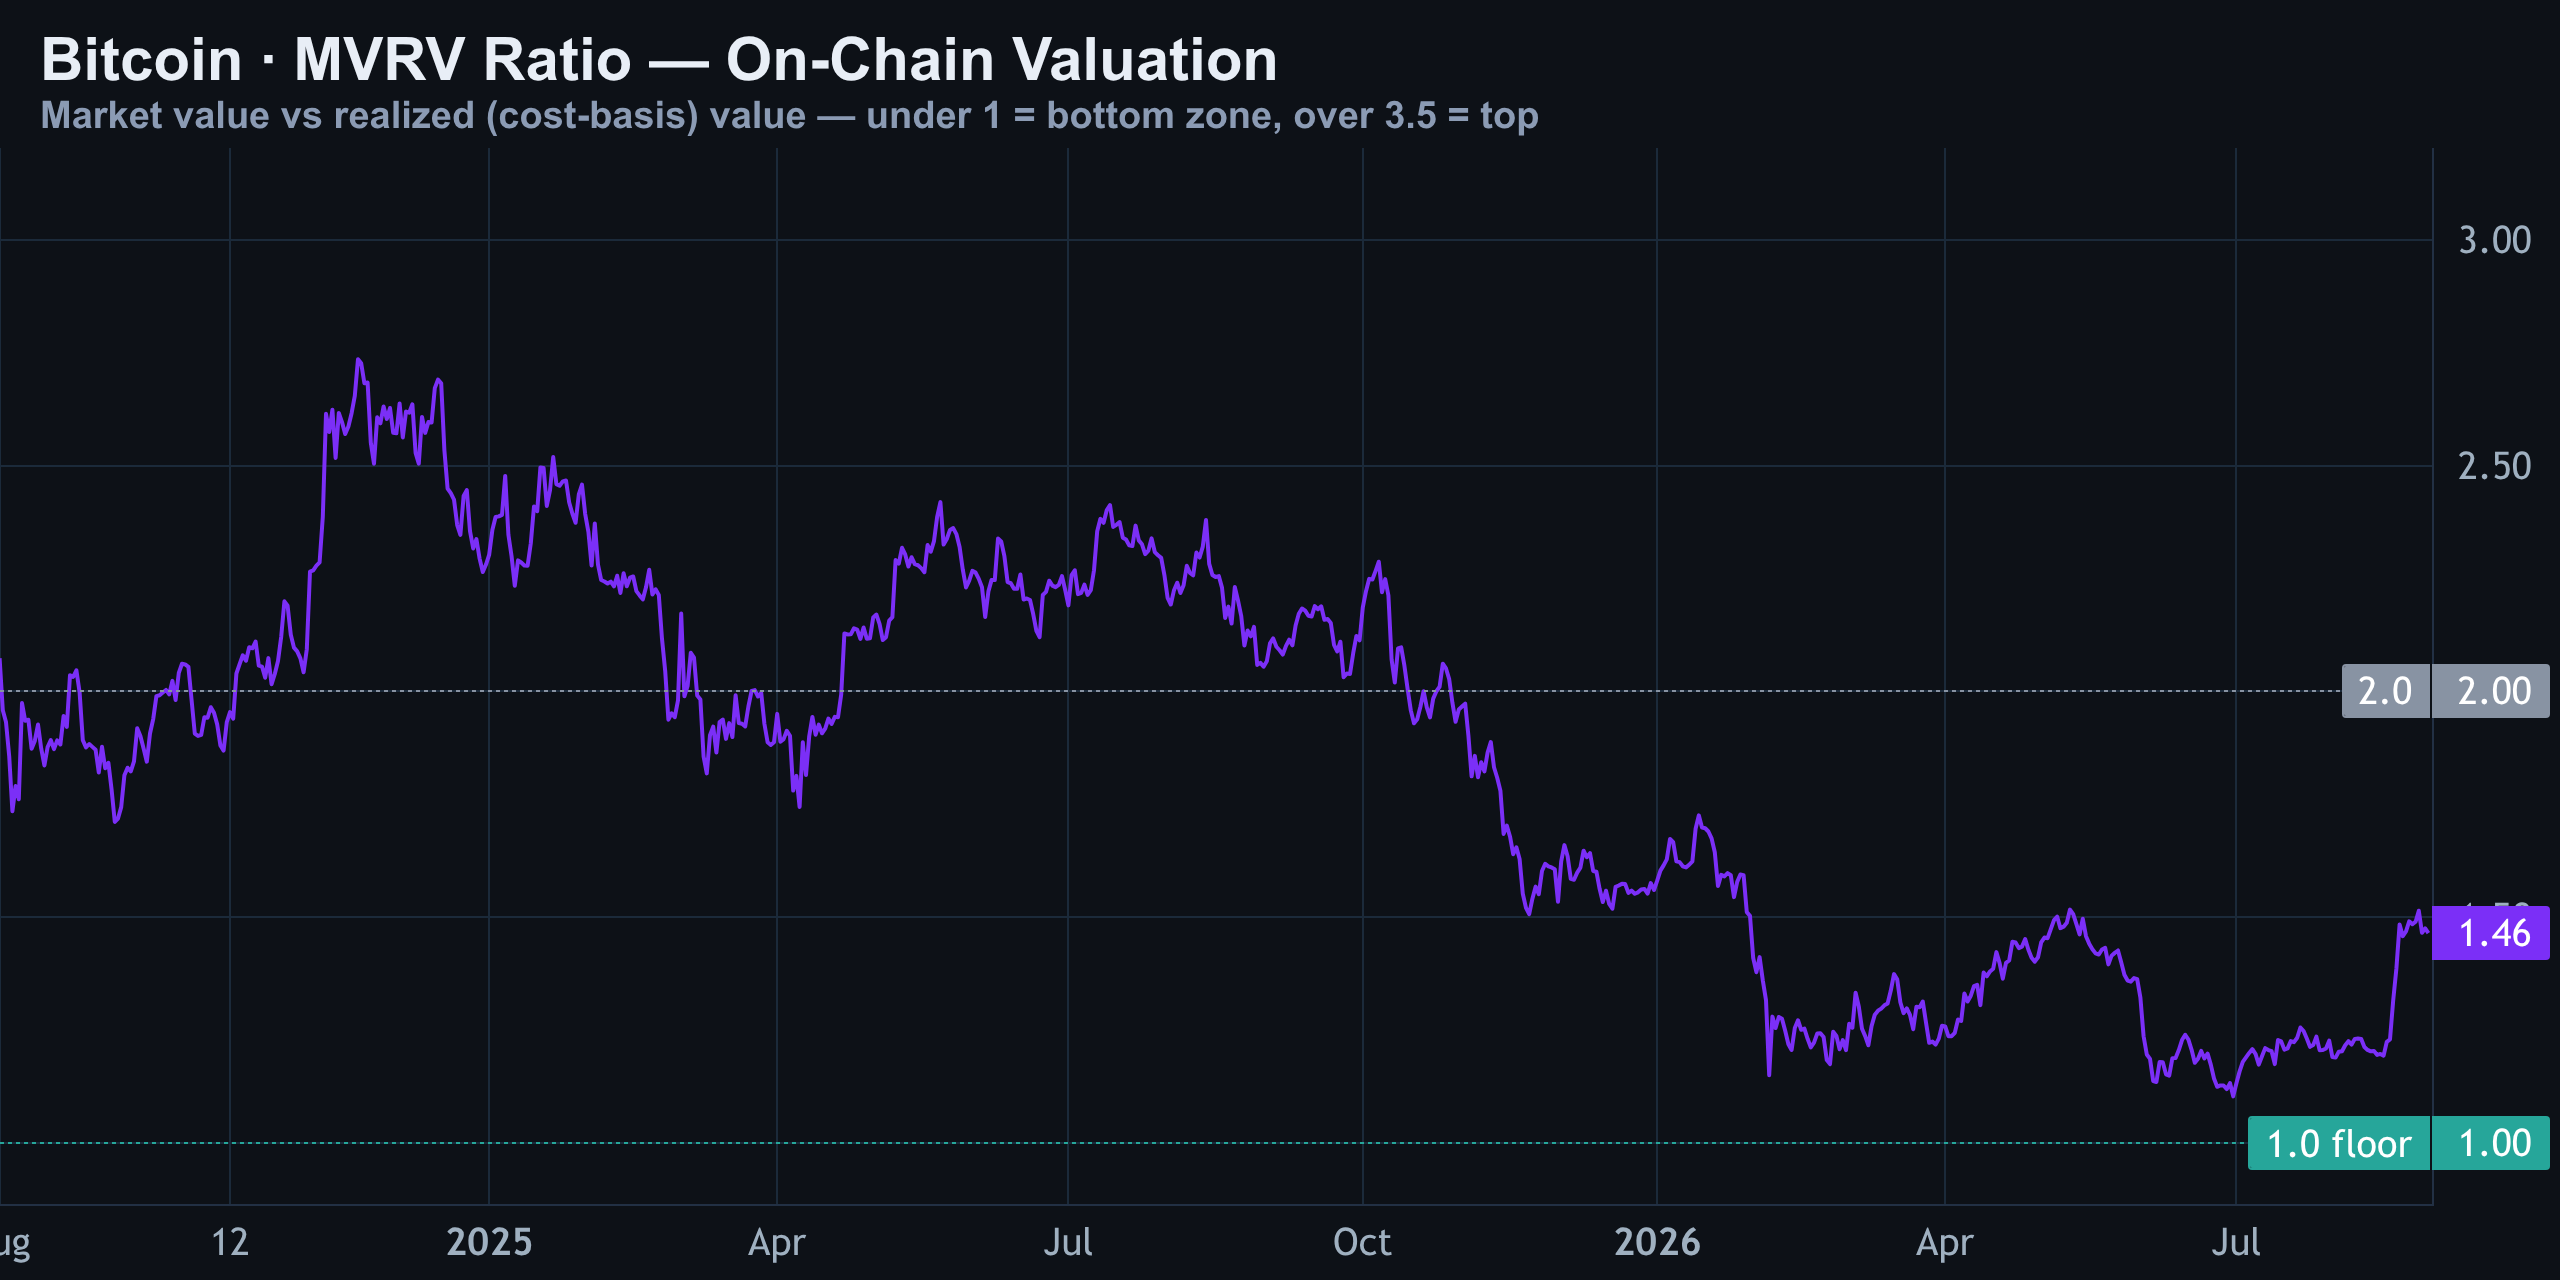
Realized price offers a second reference point by estimating the average price at which coins last moved on-chain. Bitcoin trading above realized price is typically consistent with a healthy broader market regime. It does not prevent corrections, but it helps distinguish a normal pullback from a deeper deterioration in holder cost-basis structure.
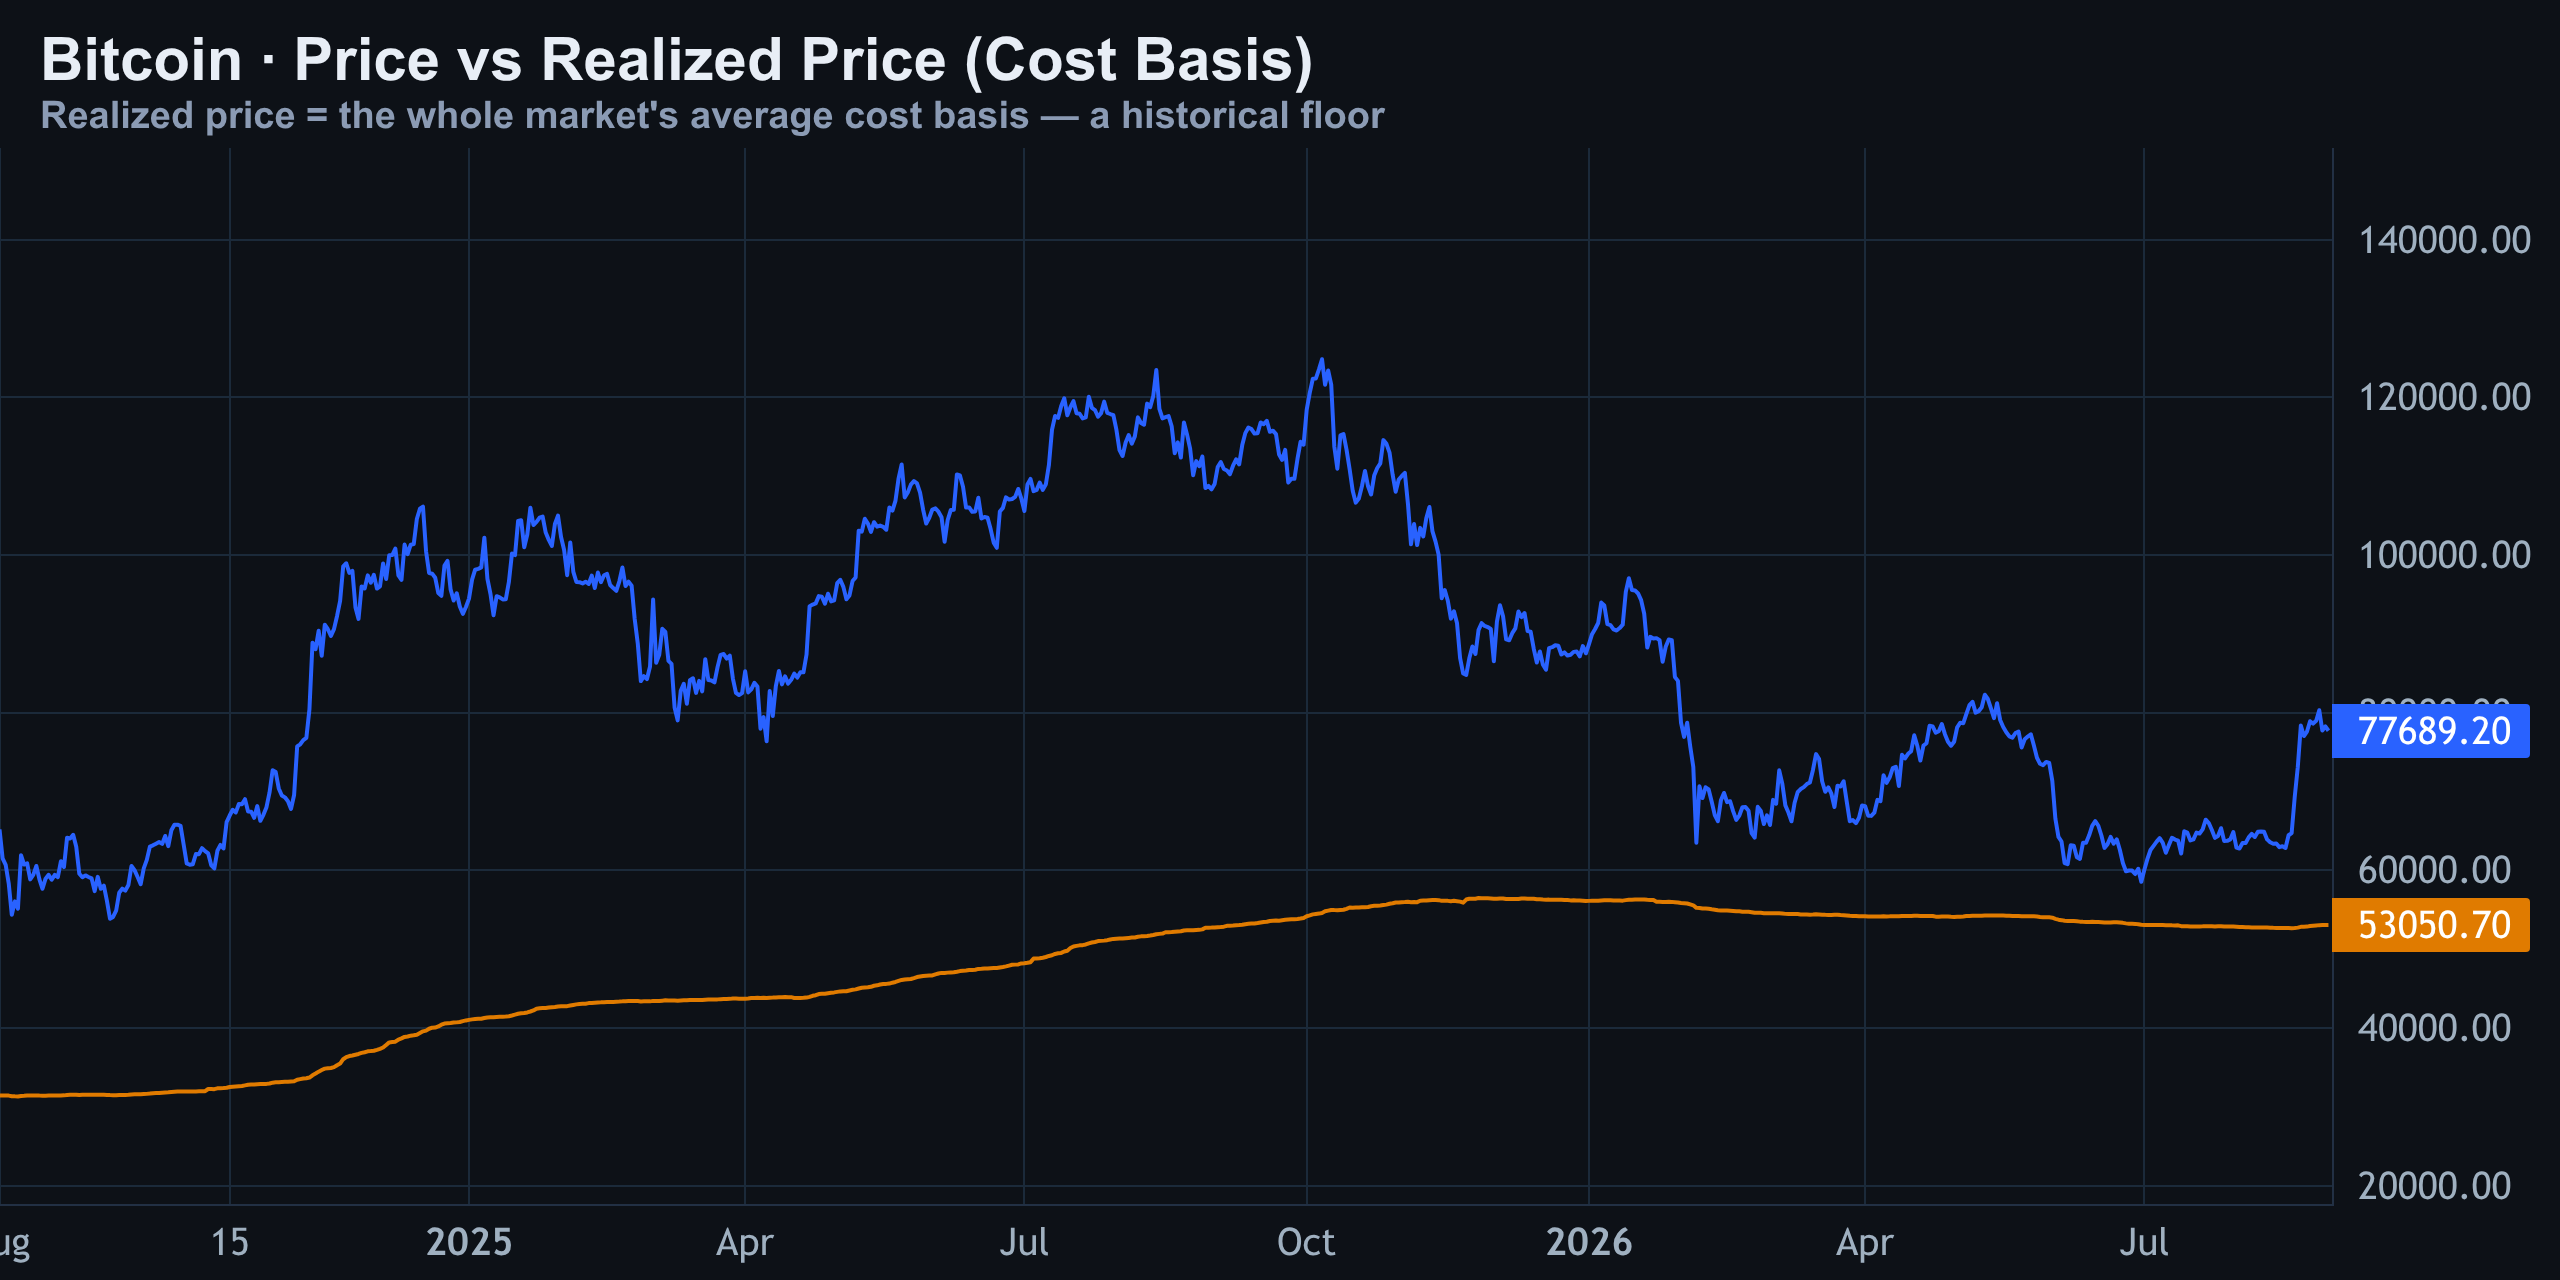
The on-chain message therefore complements—not replaces—the technical picture. Longer-term structure remains bullish, but short-term leverage still needs to reset if sellers continue to dominate taker flow.
Final Outlook for Bitcoin August 31, 2026
Bitcoin is not presenting a clean bullish breakout or a confirmed bearish reversal. It is presenting a bullish structure under bearish pressure. The trend is supported by rising daily structure, moving averages, MACD, positive gamma and a call-heavy options profile. Against that, taker flow is selling, funding is positive, RSI is elevated, downside puts are relatively expensive and liquidation liquidity sits below spot.
The next move is likely to be decided by acceptance, not by a brief wick. Holding the $77,000 area and reclaiming $78,800 would keep the path toward $80,000 open. A sustained four-hour close below $77,292 would invalidate the immediate bullish thesis and increase the odds of a move toward $75,498.
For now, the disciplined approach is to wait for confirmation. Bulls need to show that bids can absorb selling. Bears need to prove that support has failed. Until one side wins that battle, Bitcoin may remain pinned near expiry while leverage builds the conditions for the next sharp move.
Previous days
08/21/2026 — Bitcoin August 21, 2026: Breakout or Trap?
Bitcoin August 21, 2026: Breakout or Trap?
Bitcoin August 21, 2026: The Breakout Has Arrived—But Can It Hold?
Bitcoin is moving quickly. In the supplied August 21, 2026 market snapshot, BTC is trading near $74,439, up approximately 15.6% in two days. Price has broken above a broad six-week range, reclaimed important moving-average structure and pushed through a descending channel. On the surface, that is a meaningful bullish regime change.
The complication is that the cleanest signal on the chart is fighting the most important signal underneath it. Momentum is surging, but daily RSI is stretched. Options positioning appears bullish by call open interest, yet downside protection is expensive. A liquidation pocket remains below spot, while the Coinbase premium signal suggests US spot demand is not leading the move.
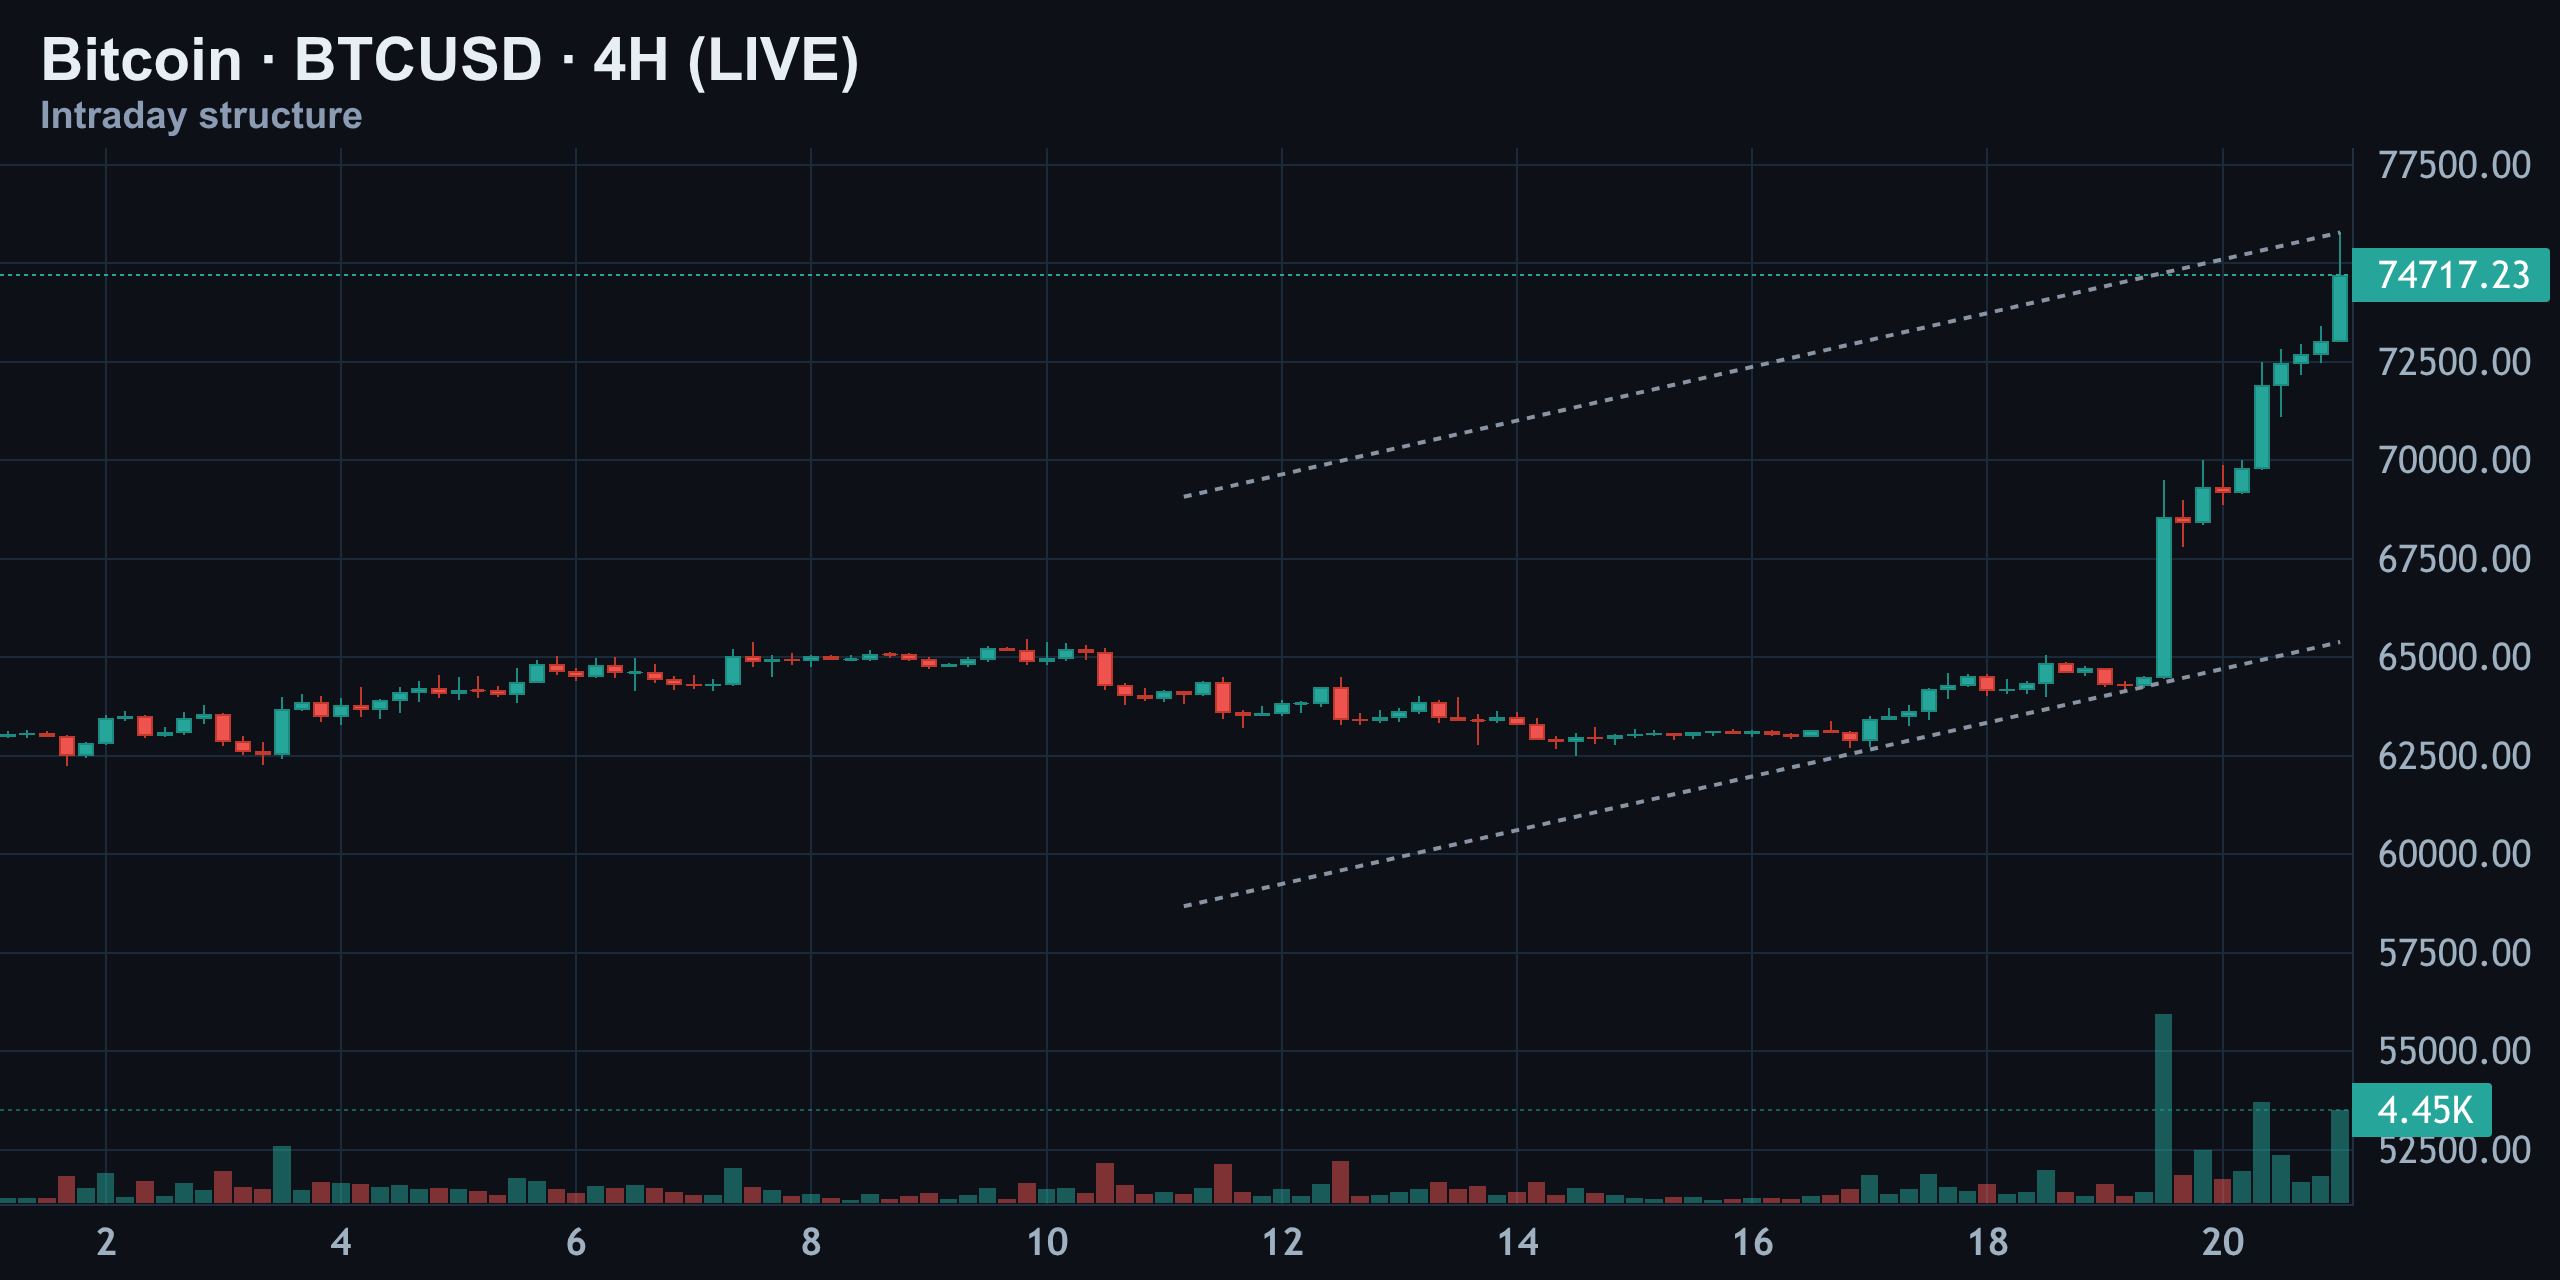
The four-hour chart shows a long base around $64,000, followed by an impulse through the former range ceiling near $70,000. Elevated breakout volume supports the idea that this was not merely a quiet drift higher. However, a 15% move in two days can create its own liquidity event. The first healthy test would be a controlled retracement into the $73,000 area, followed by a hold above $70,000.
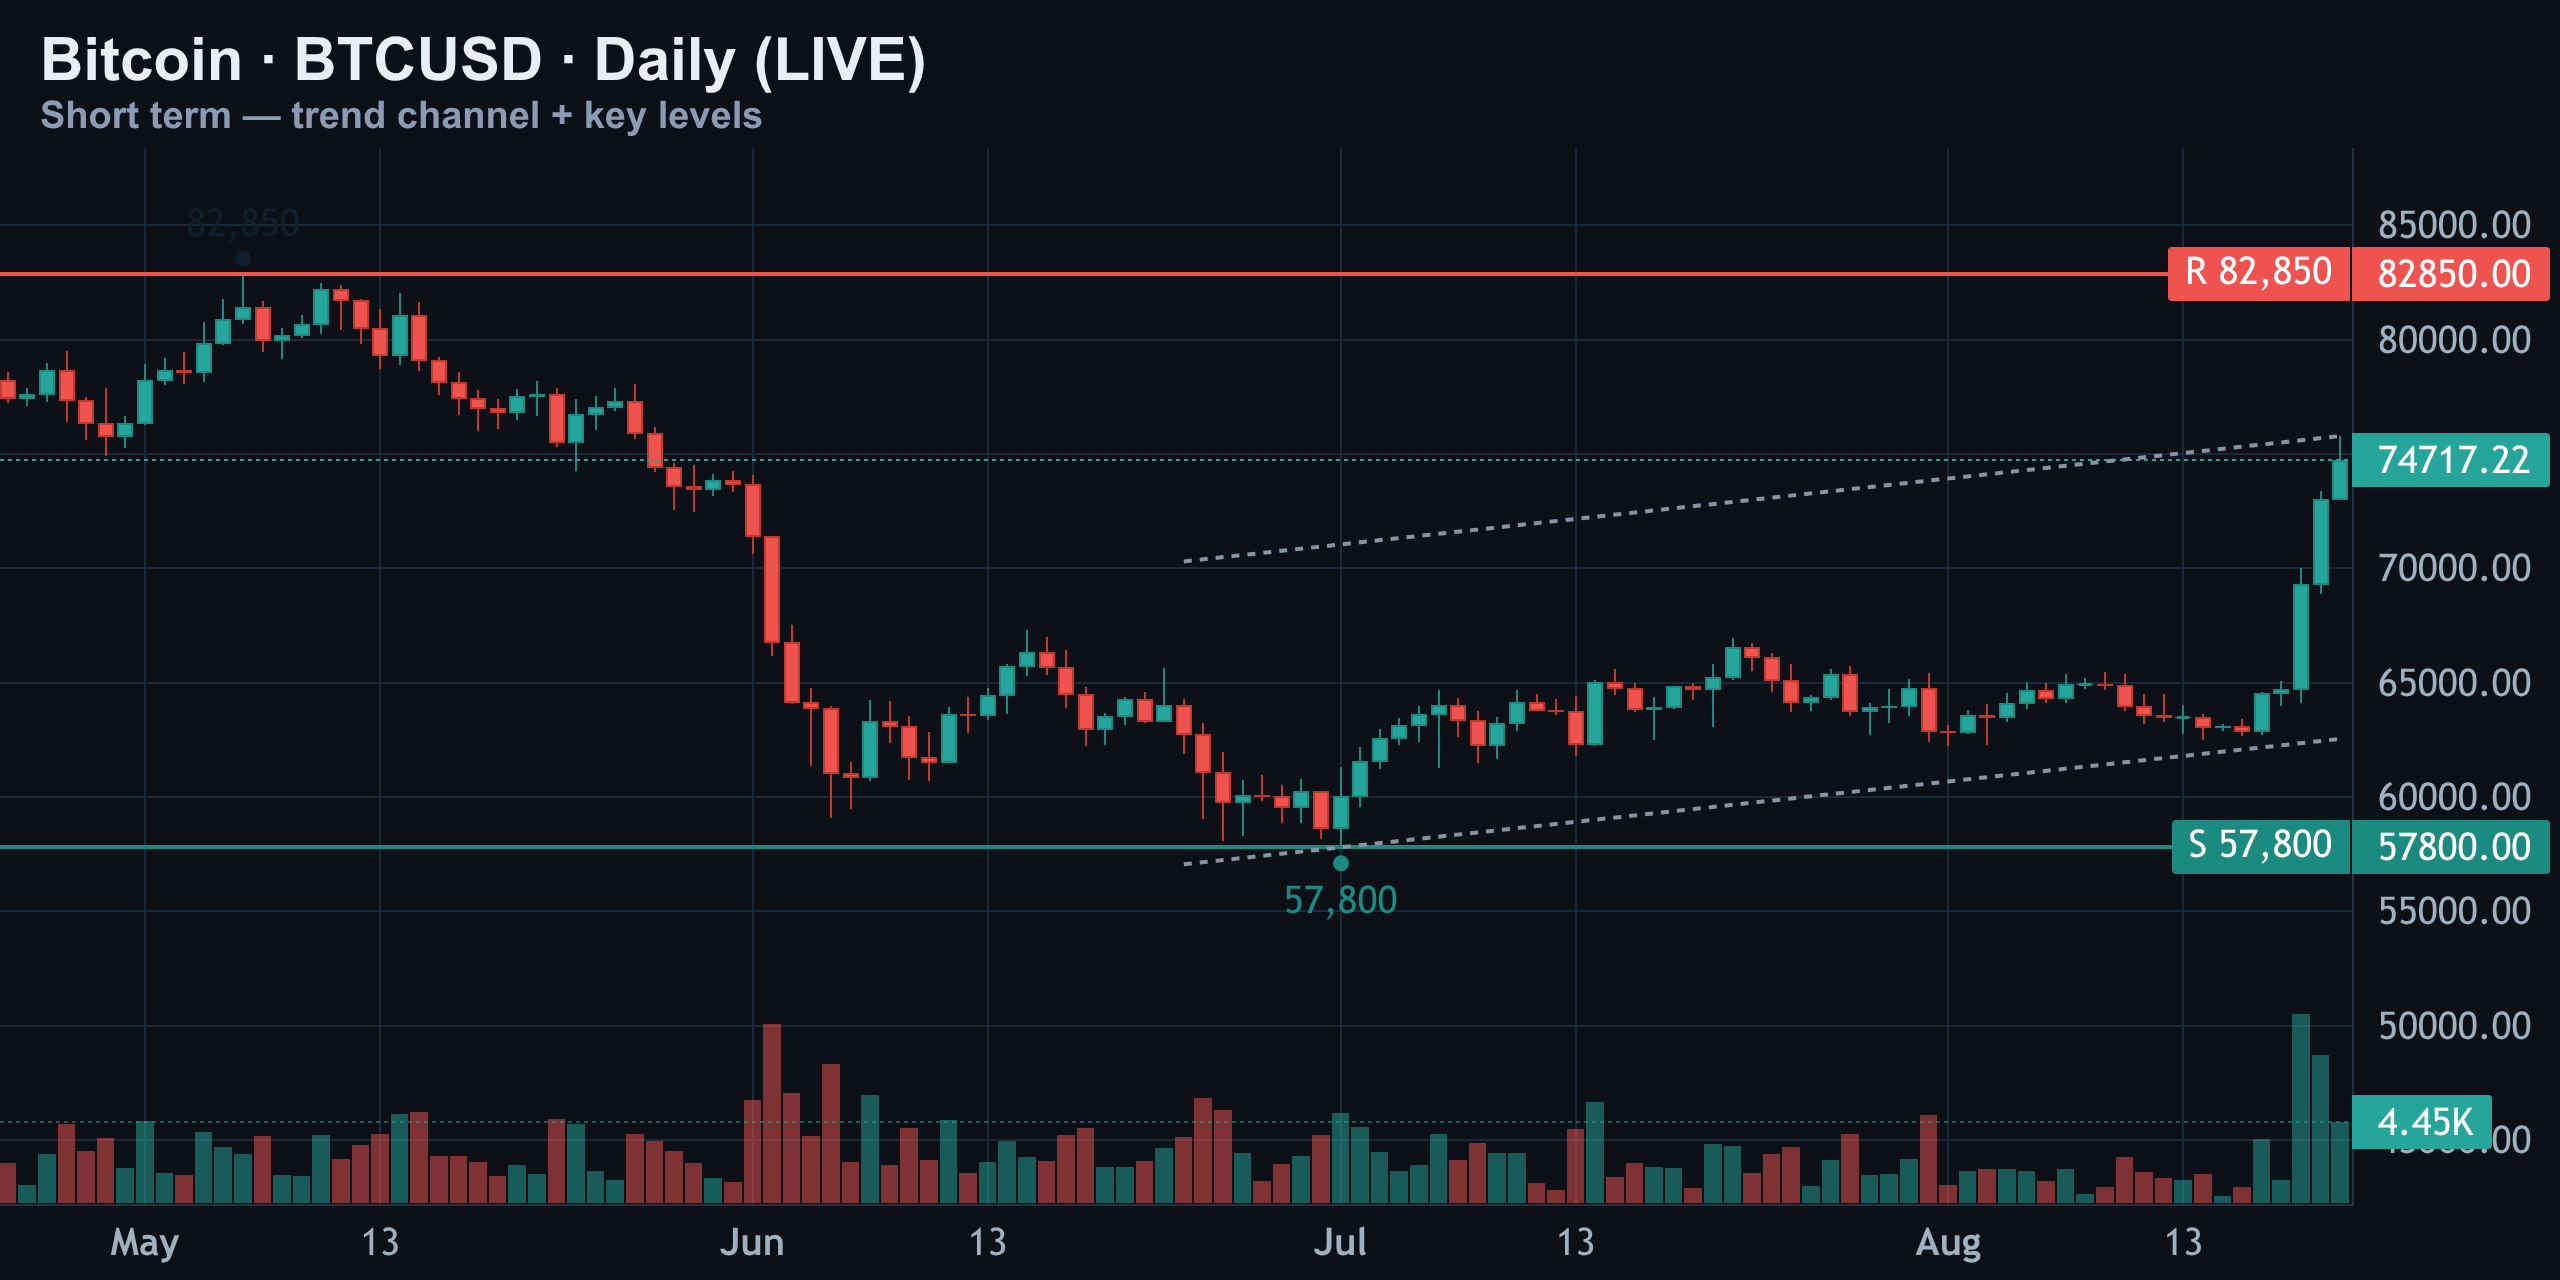
The primary read is therefore bullish continuation with pullback risk, not a risk-free vertical breakout. A decisive four-hour close below $69,622 would invalidate the immediate bullish setup and raise the probability that this move was a liquidity-driven overshoot.
Options Market: Bullish Positioning, Defensive Hedging
Options are giving a more cautious message than spot price. The put-to-call ratio is 0.56 by open interest and 0.46 by today’s volume, showing that calls dominate visible positioning. That is consistent with a bullish directional bias, but it does not prove that traders are unhedged or expecting a straight-line rally.
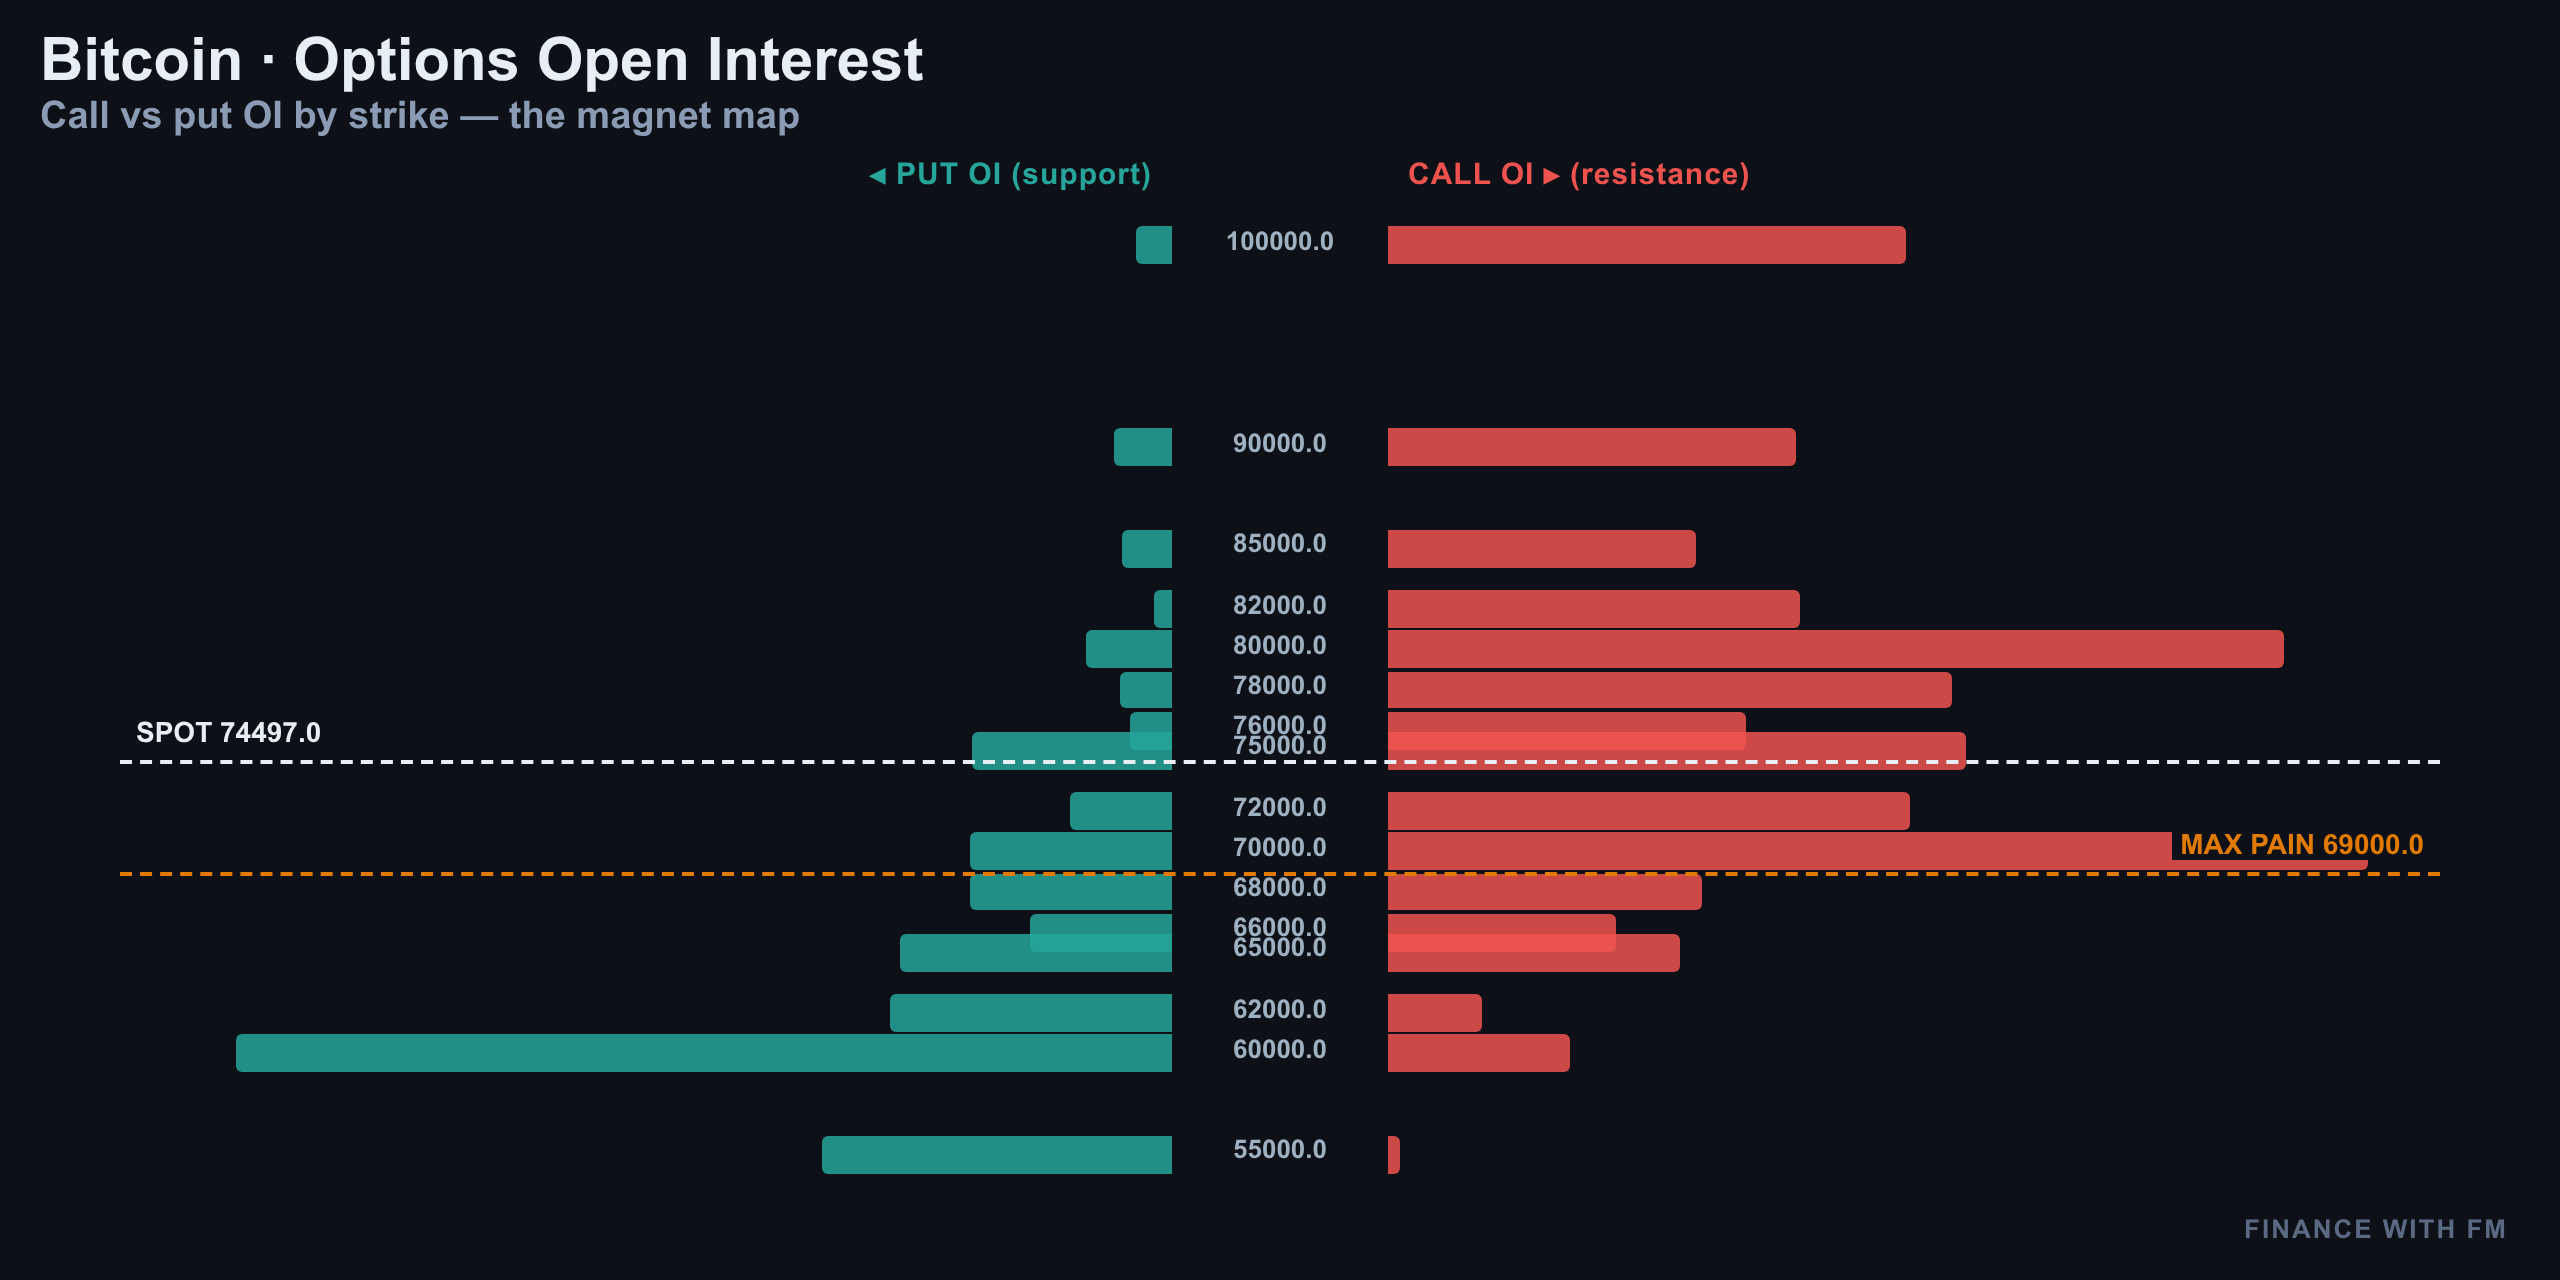
The nearest expiry has max pain near $69,000, which can act as a magnet if momentum fades into expiration. The largest call wall is around $80,000, marking the most important overhead positioning zone. The largest put wall is near $60,000, providing a broader structural downside reference.
| Options reference | Level or reading | Interpretation |
|---|---|---|
| Max pain | $69,000 | Potential expiry magnet |
| Largest call wall | $80,000 | Primary overhead resistance |
| Largest put wall | $60,000 | Structural downside support |
| Put-to-call open interest | 0.56 | Calls dominate visible positioning |
| Put-to-call volume | 0.46 | Call activity leads today |
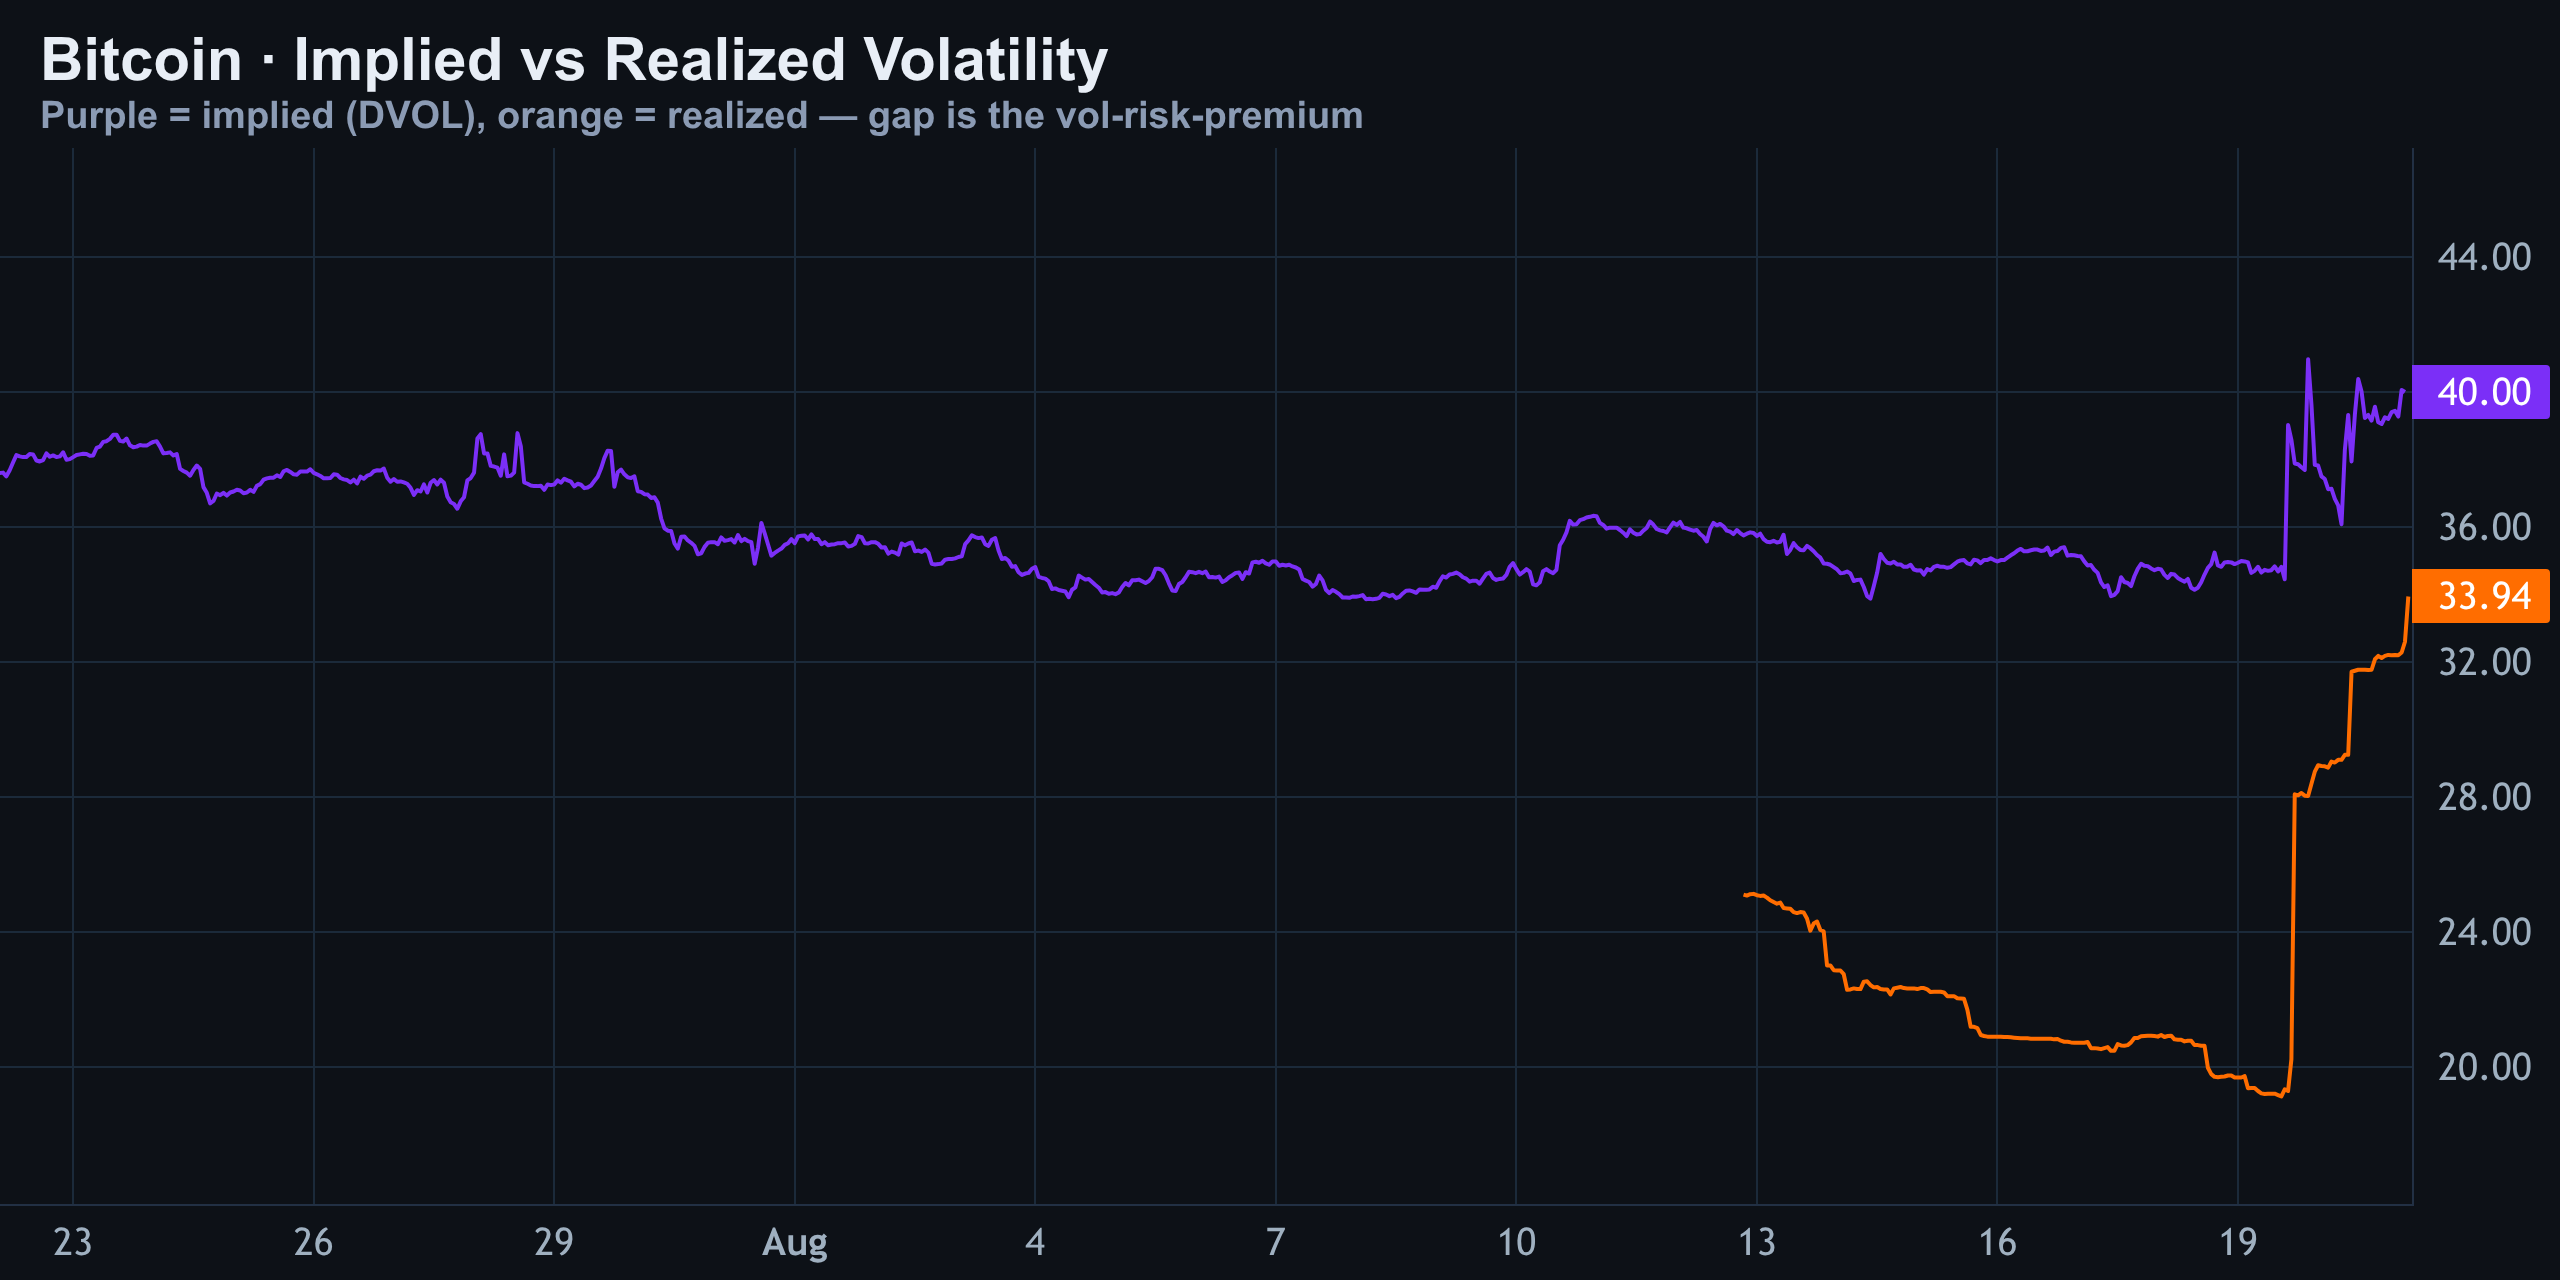
DVOL is approximately 40, compared with realized volatility of 33.9, producing a volatility risk premium of 6.1 percentage points. Options buyers are paying up for protection or convexity. The 25-delta skew is approximately +13.7%, indicating that puts are richer than calls. Near-term implied volatility is also elevated relative to longer maturities, creating backwardation.
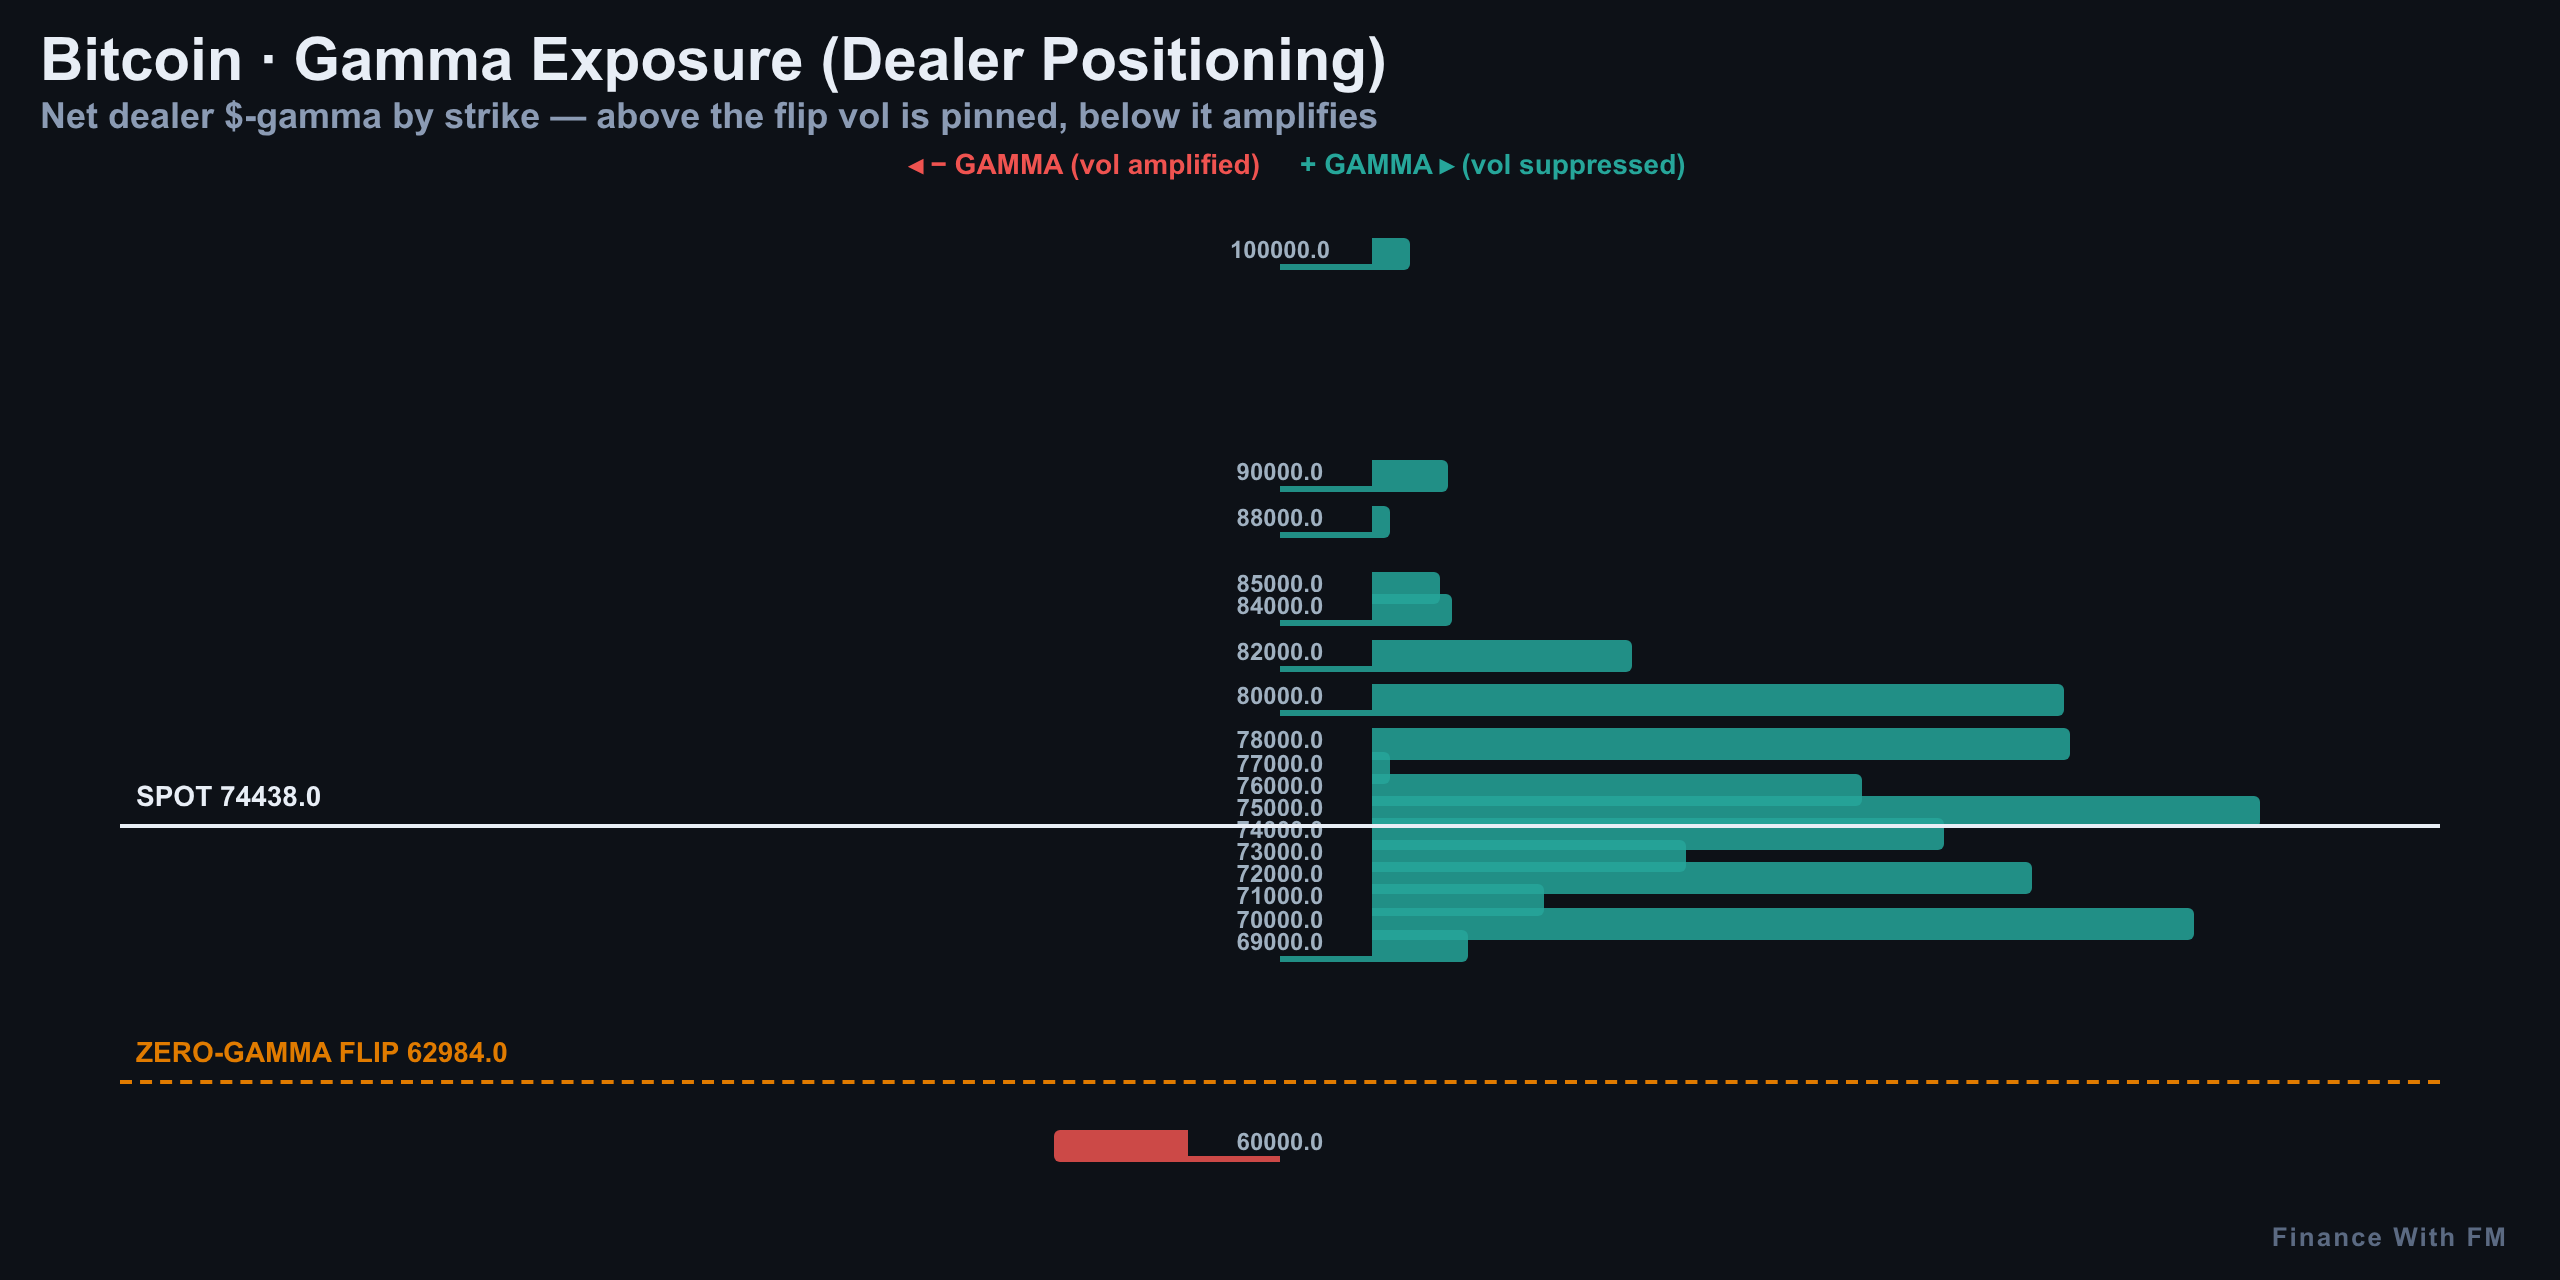
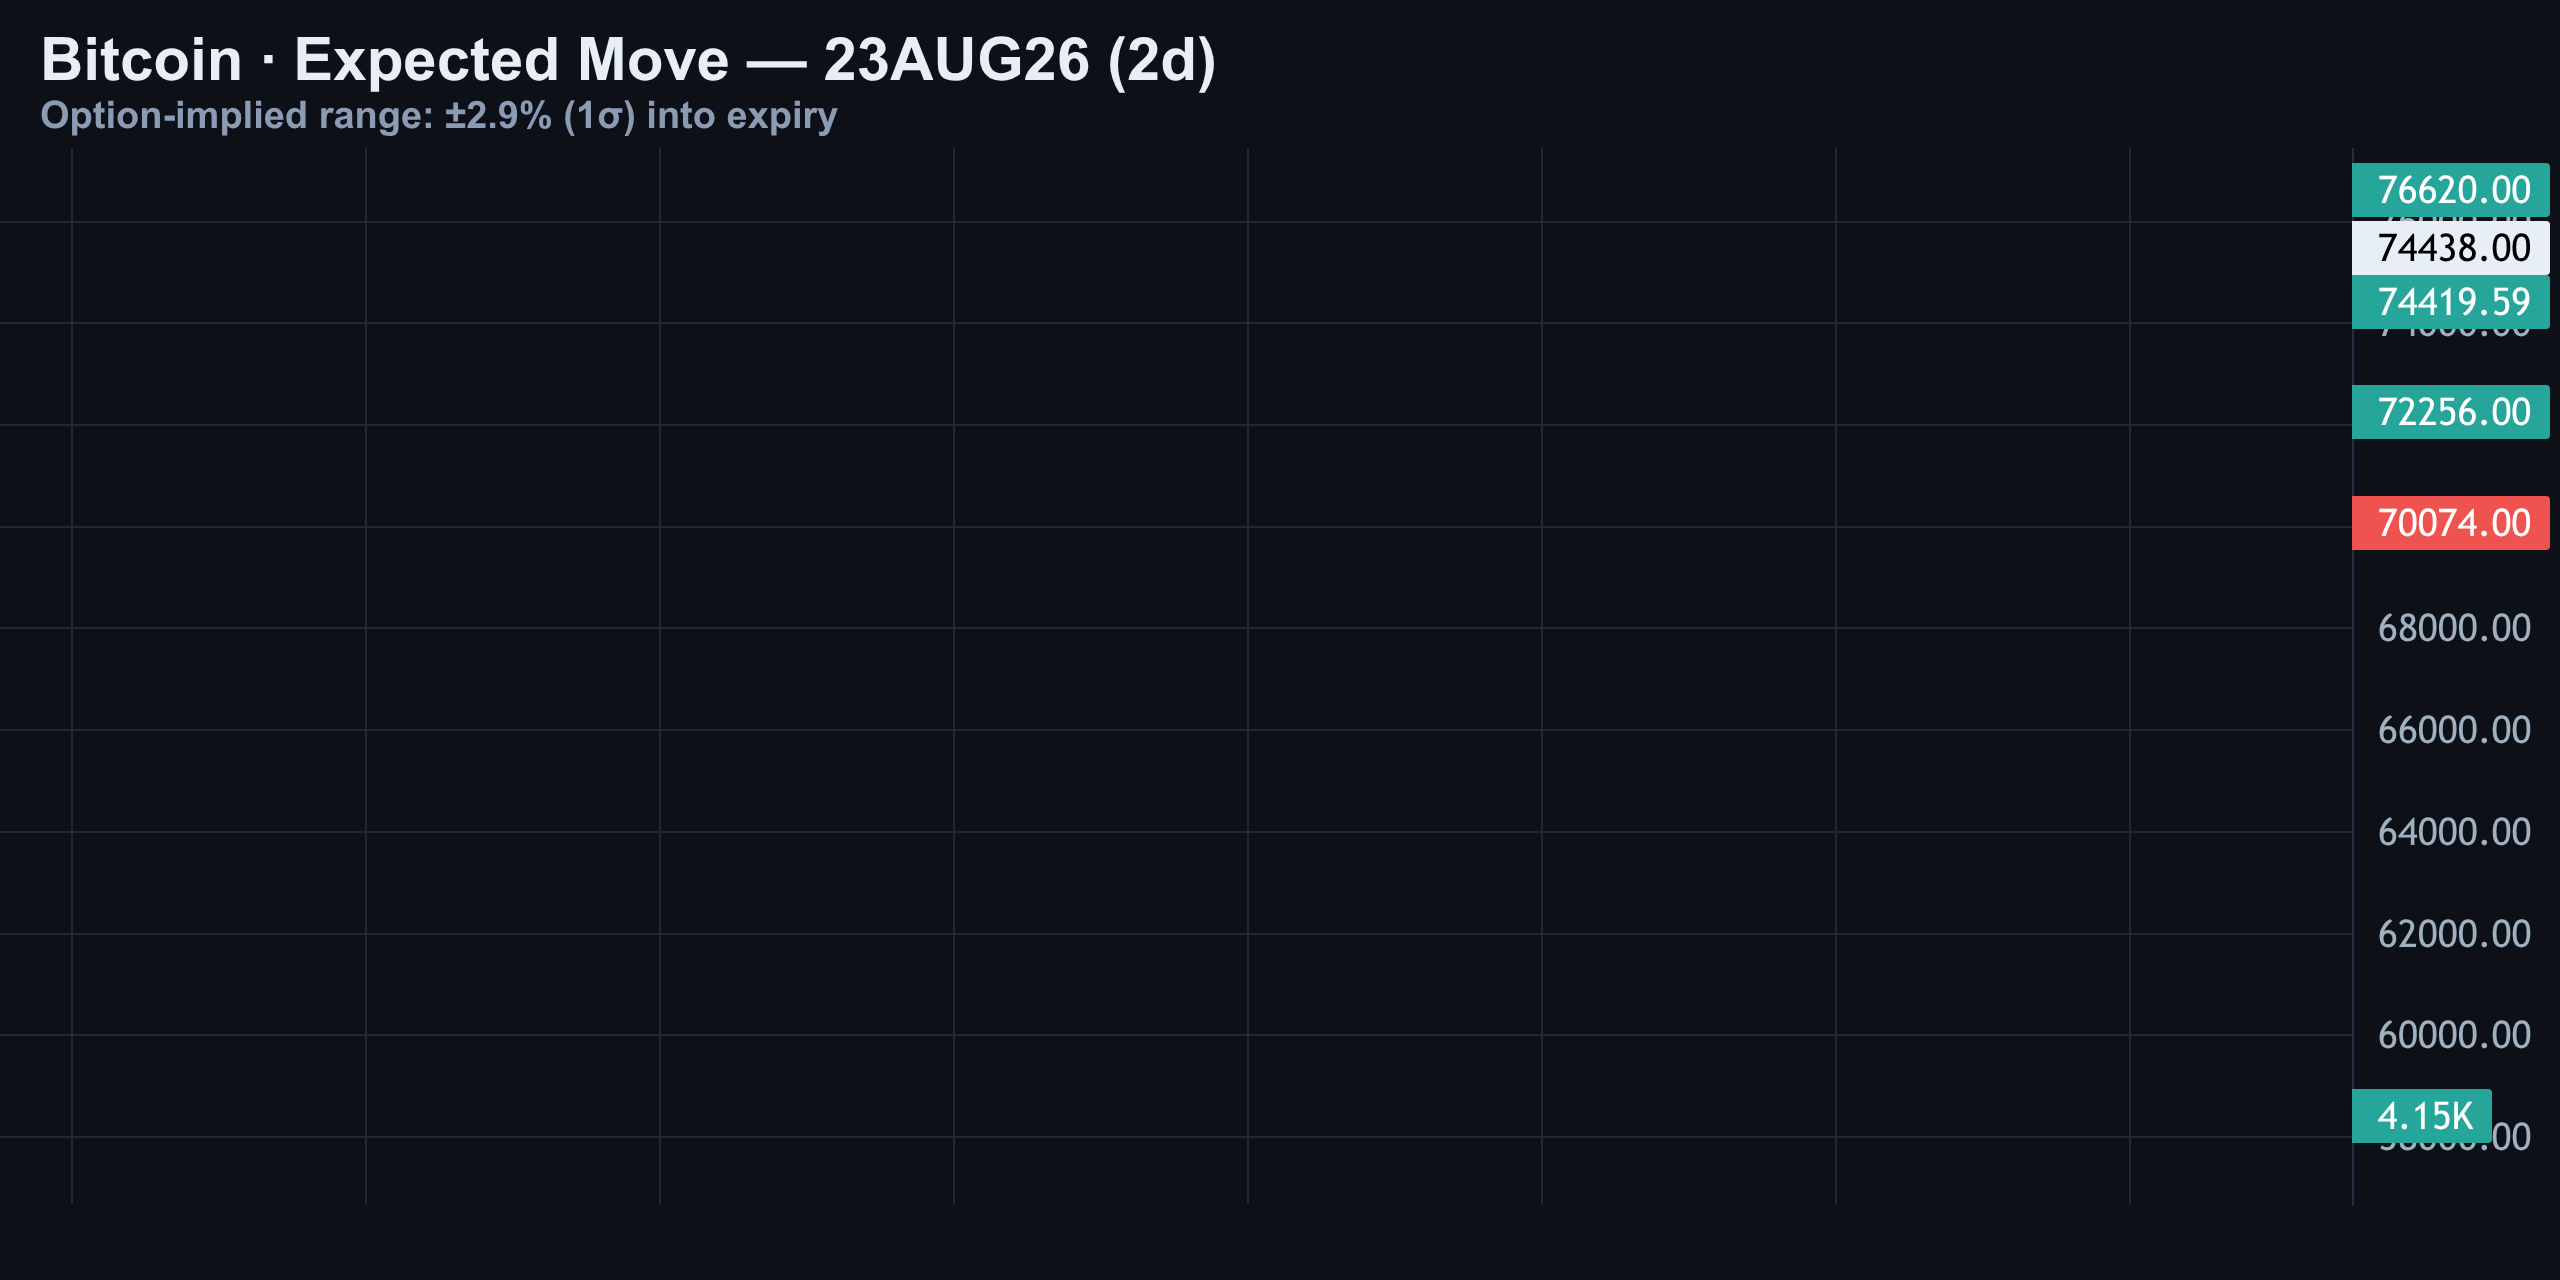
Positive dealer gamma can encourage dip buying and rally selling around major strikes. That supports a controlled move toward $75,000-$80,000, but it also makes a clean vertical advance less likely. The practical takeaway is that chasing short-dated calls after a sharp rally carries an unattractive volatility cost.
The Bigger Chart: Trend Reversal or Temporary Overshoot?
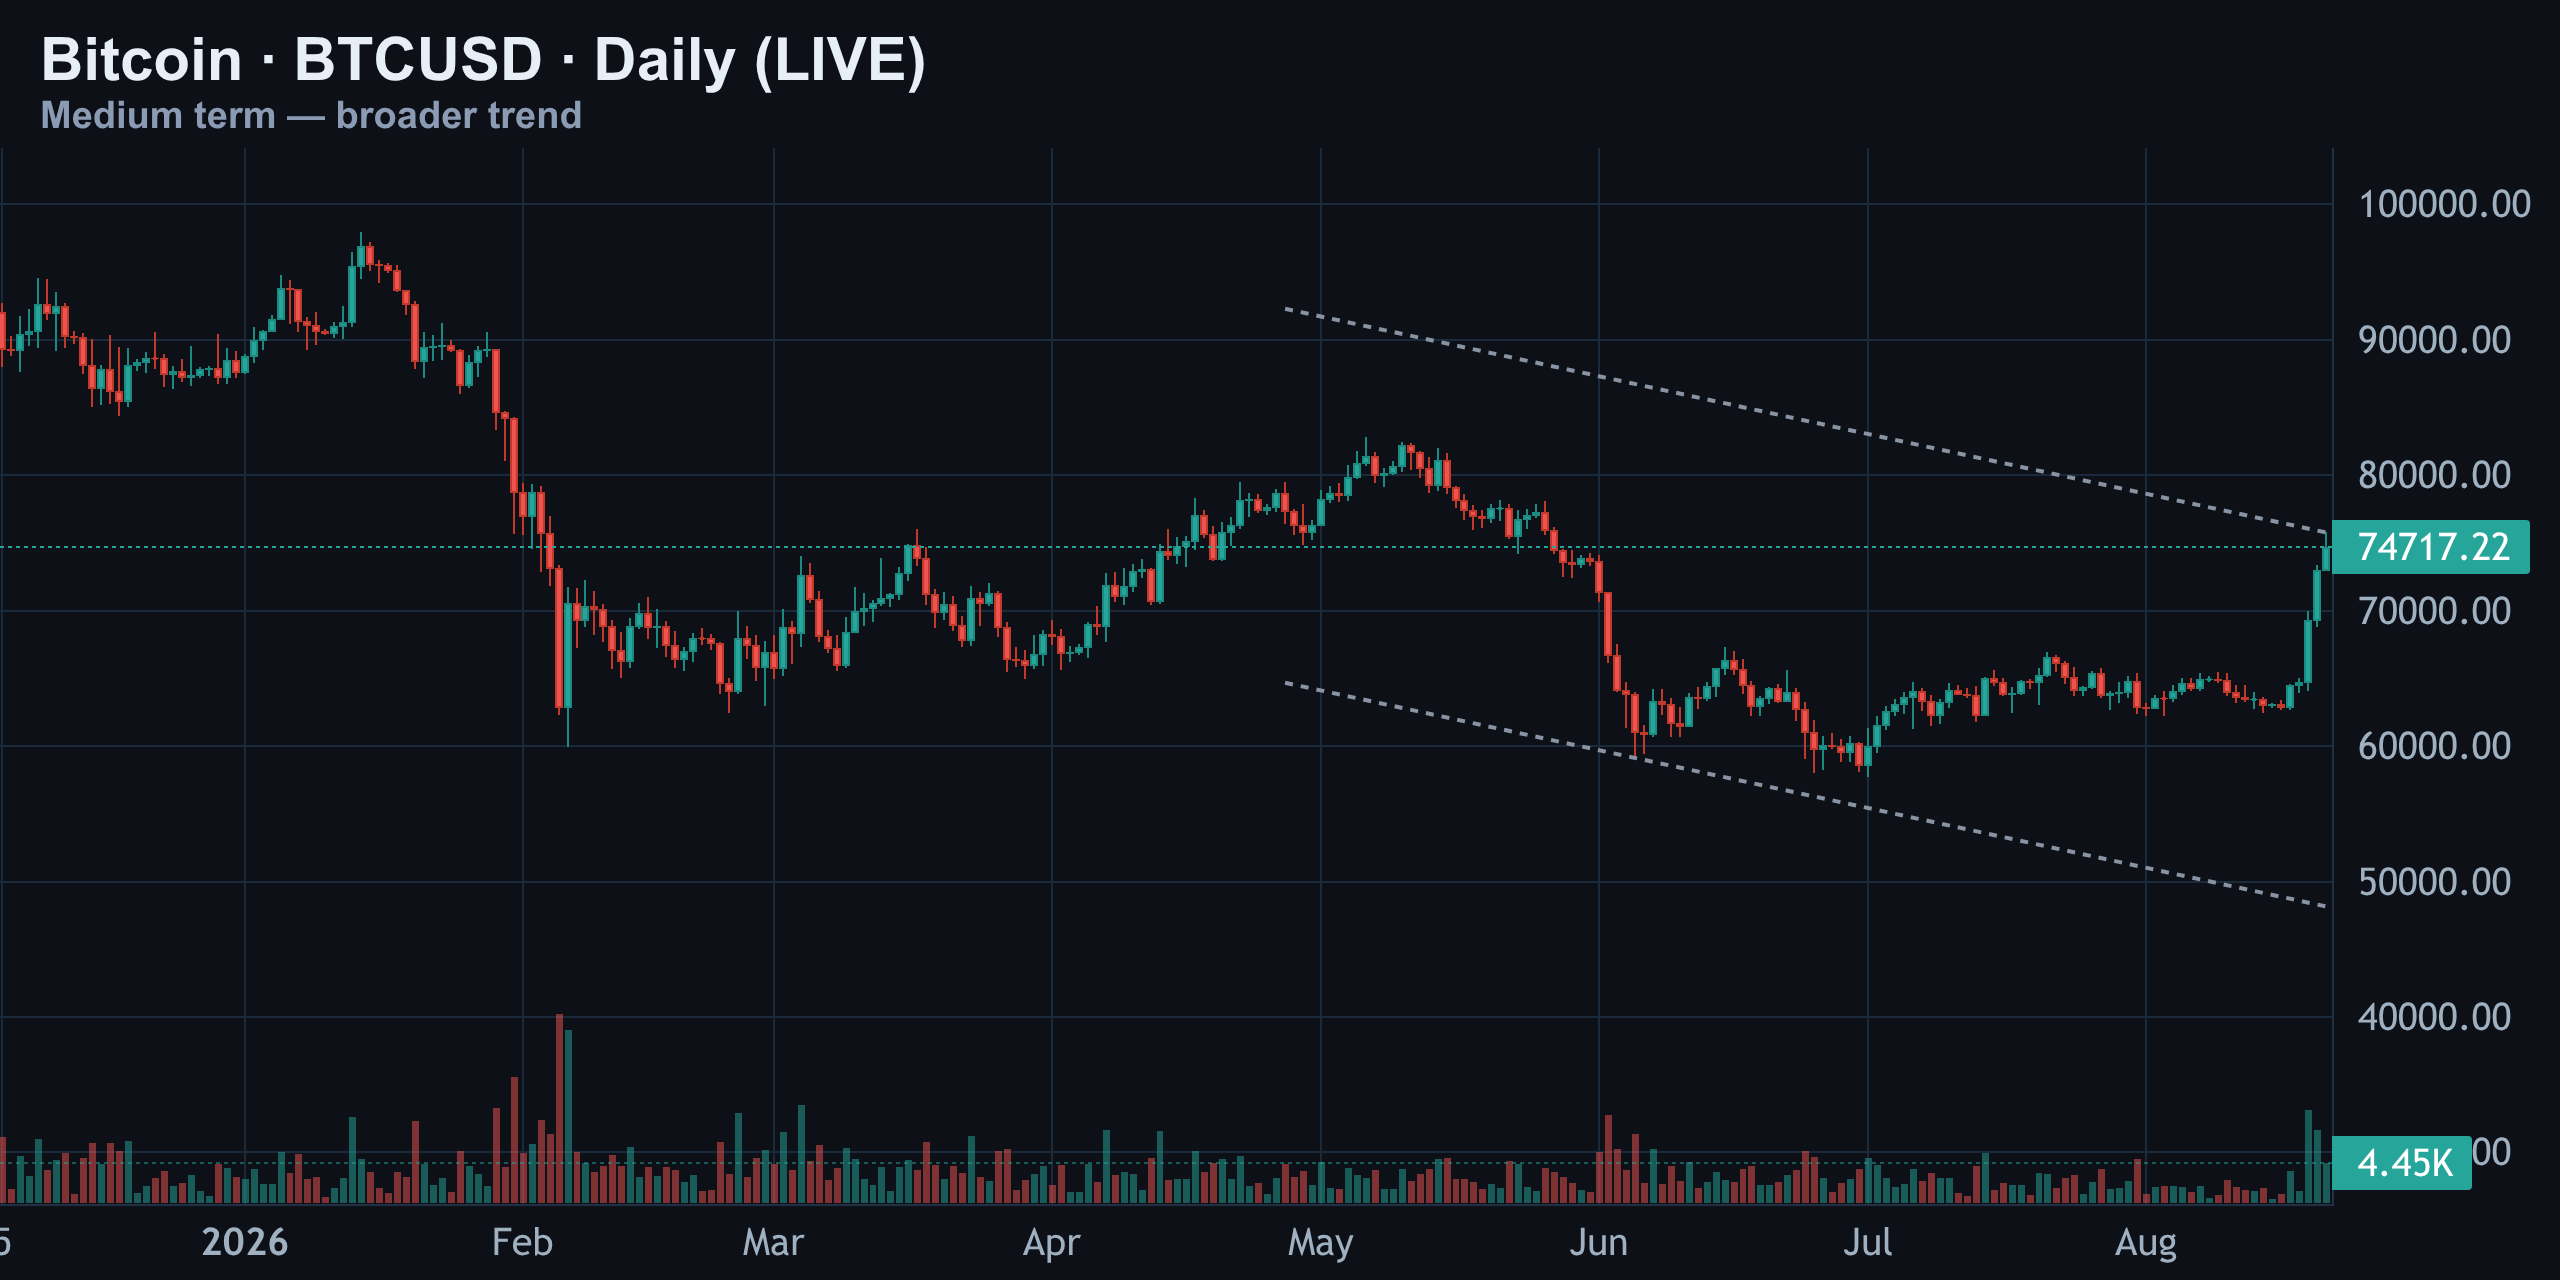
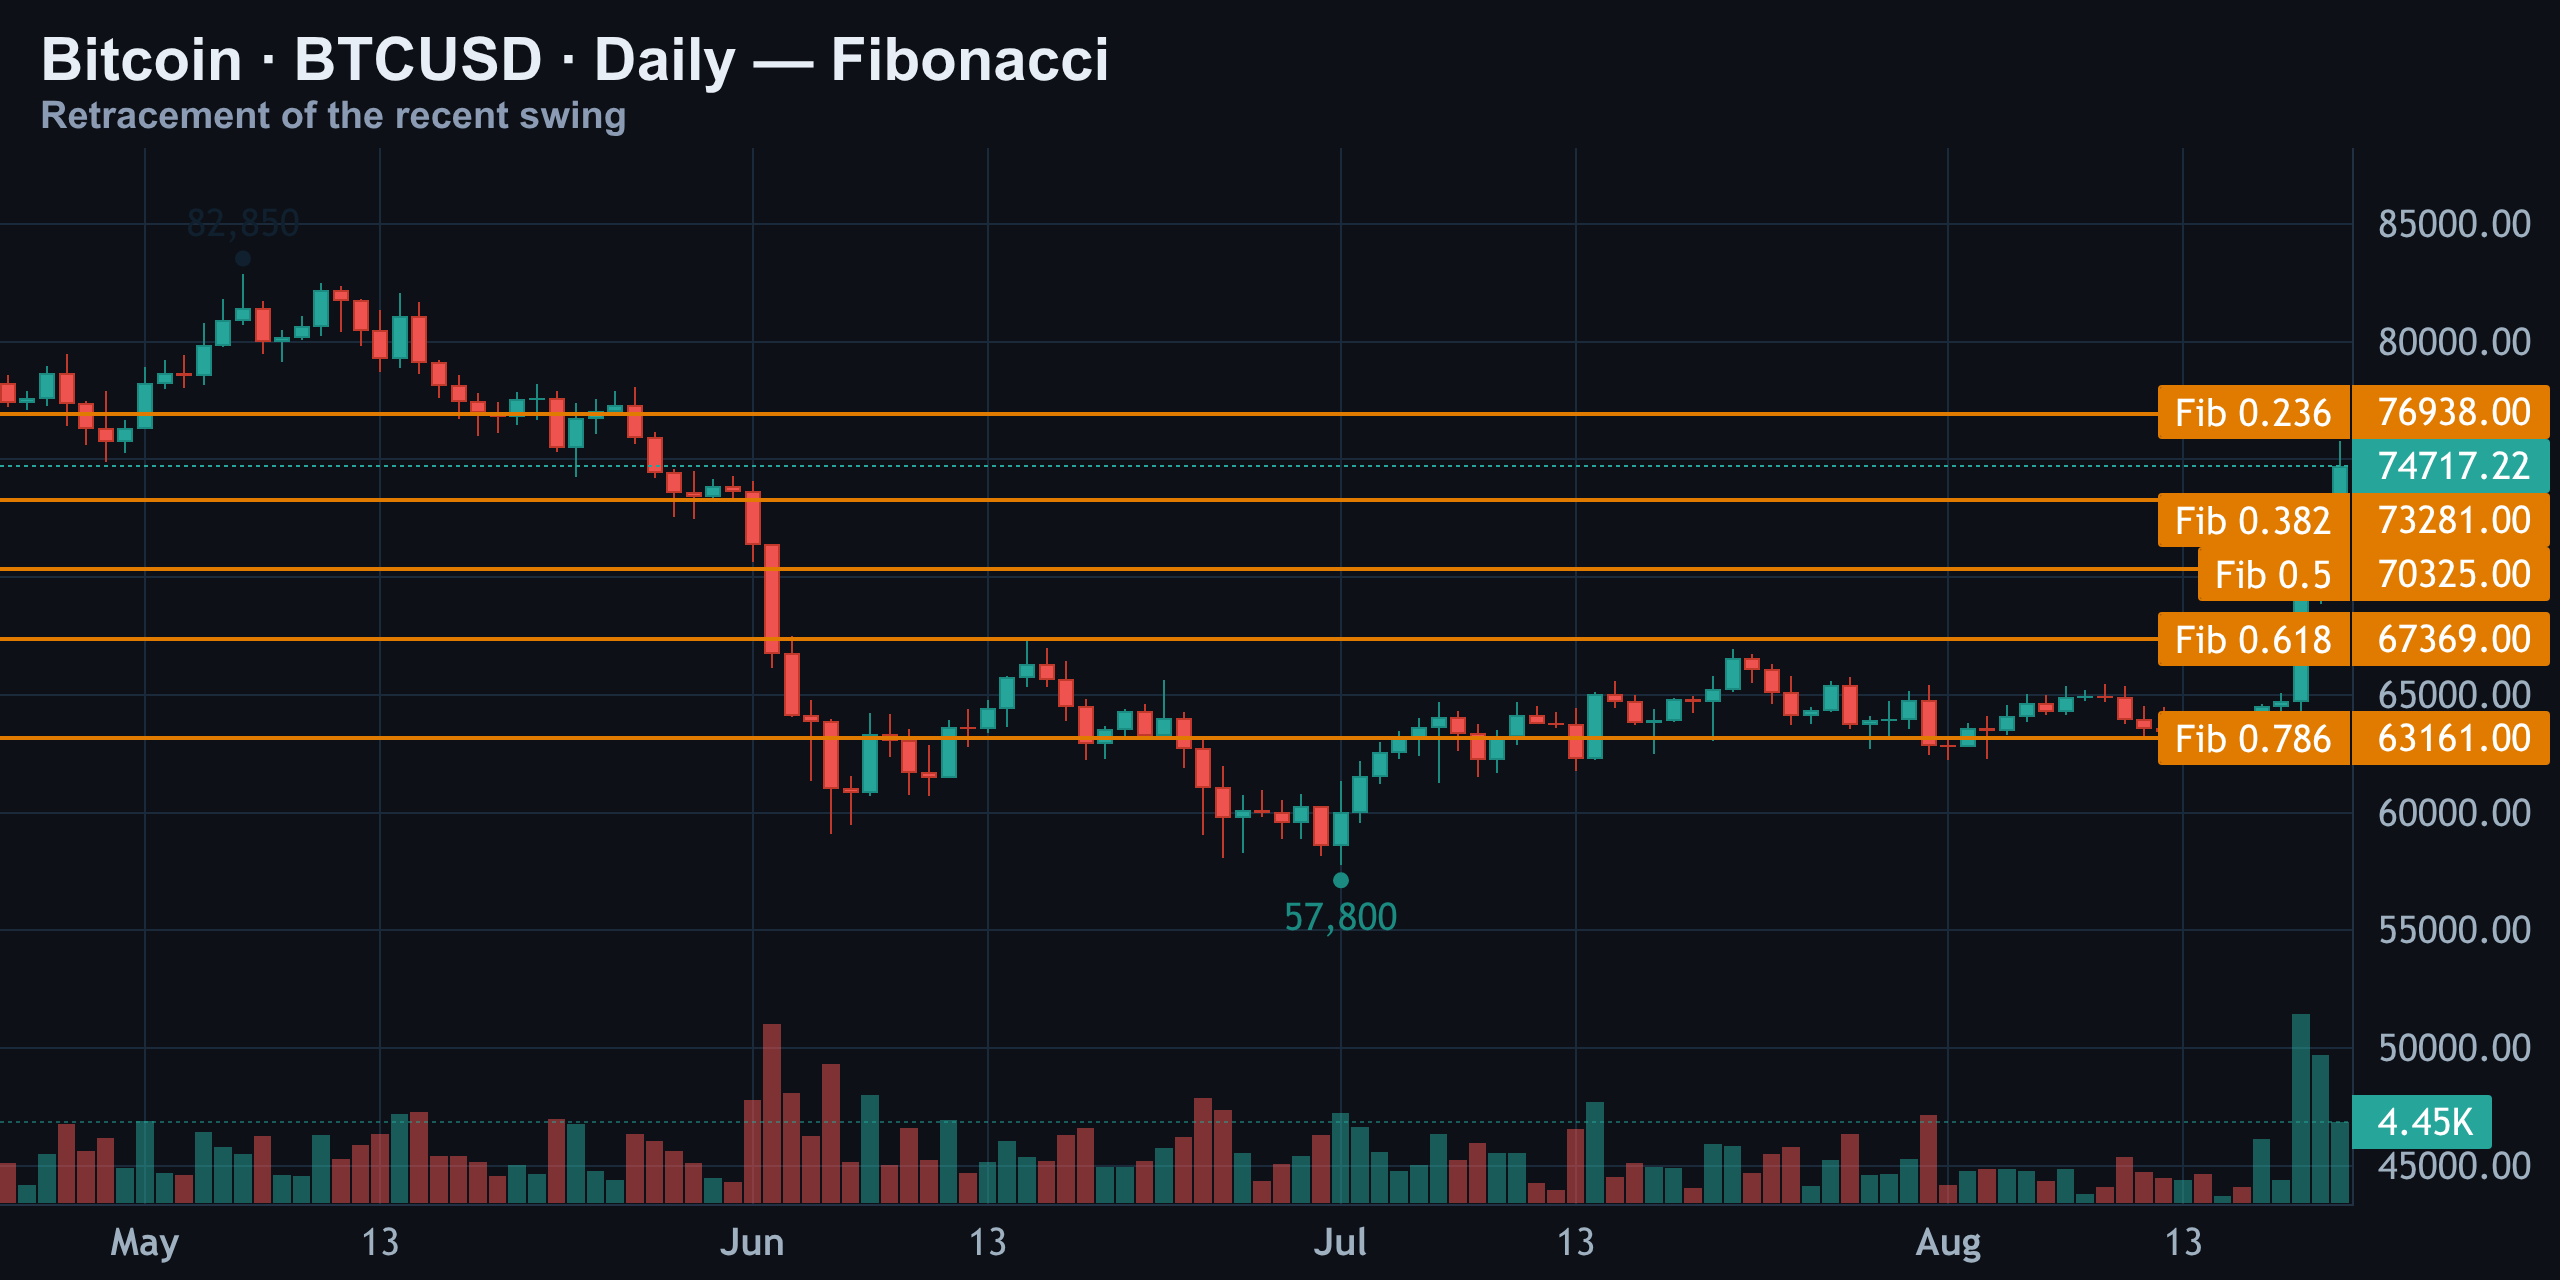
On the medium-term daily chart, Bitcoin has escaped a multi-month descending channel and reclaimed the upper boundary near the mid-$70,000 area. Before this move, the market repeatedly rotated between roughly $60,000 and $65,000, suggesting that sellers were losing their ability to extend the decline. A successful retest would turn that former resistance into support.
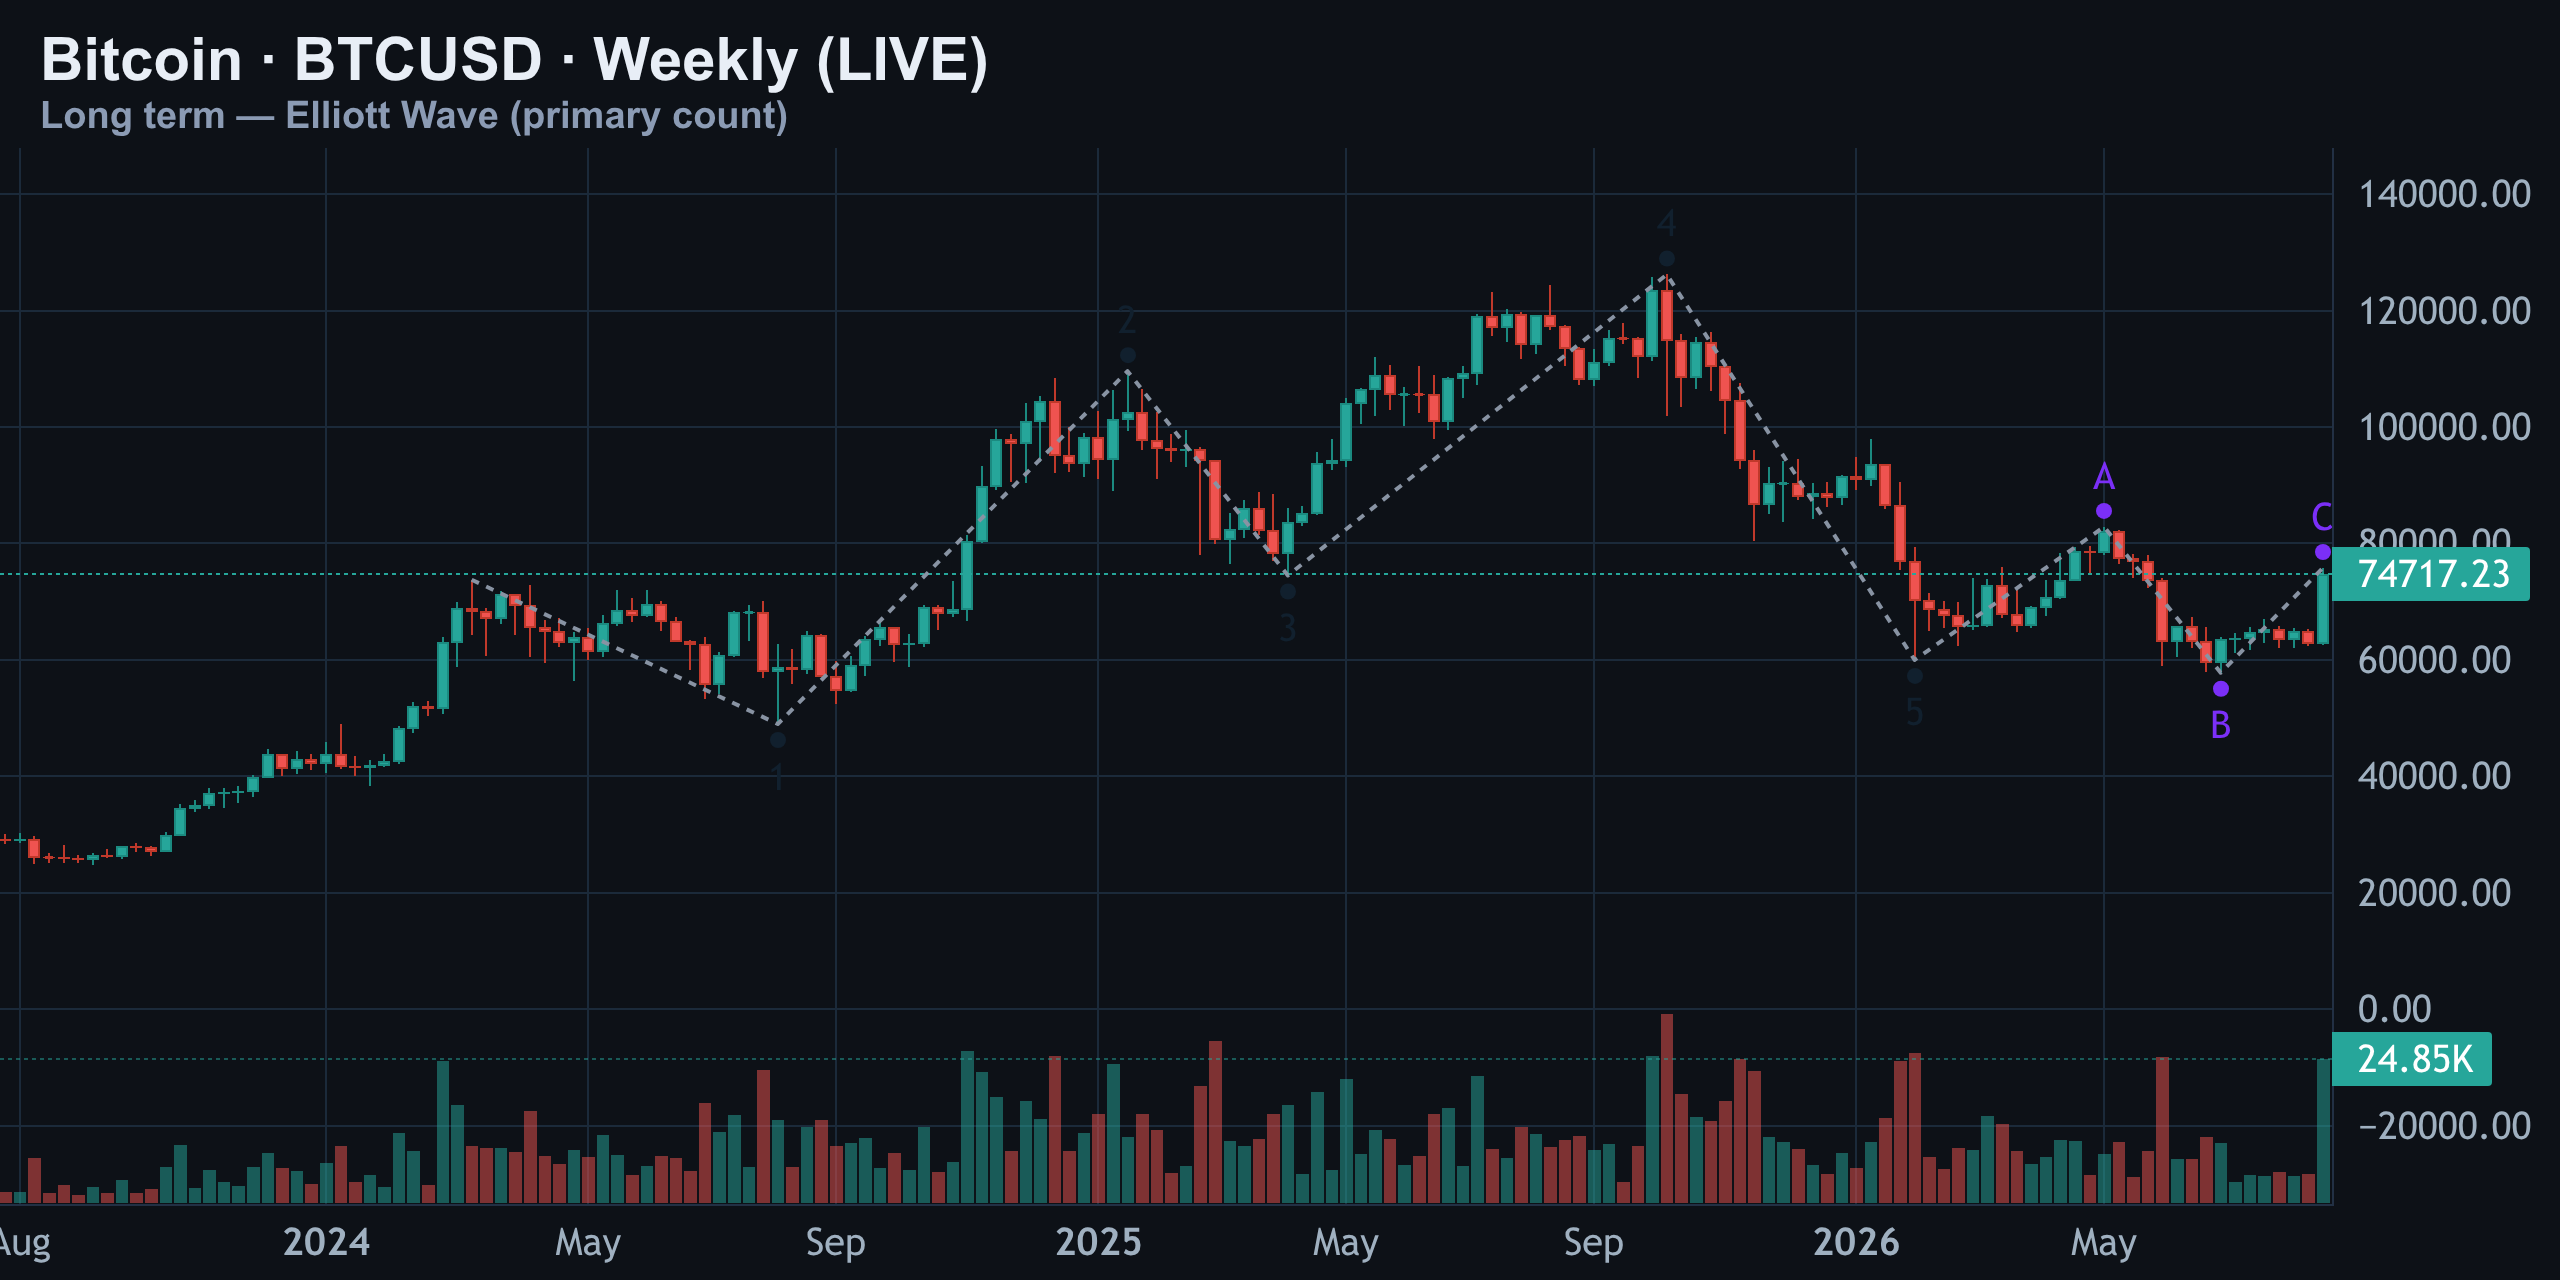
The weekly Elliott Wave view adds an important warning. A recovery wave can be powerful without necessarily becoming a permanent new bull market. Bitcoin may be testing a C-wave recovery zone, where price can continue higher but also encounter aggressive profit-taking. This does not forecast a reversal by itself; it simply argues for confirmation at higher resistance rather than assuming every breakout is the start of an uninterrupted advance.
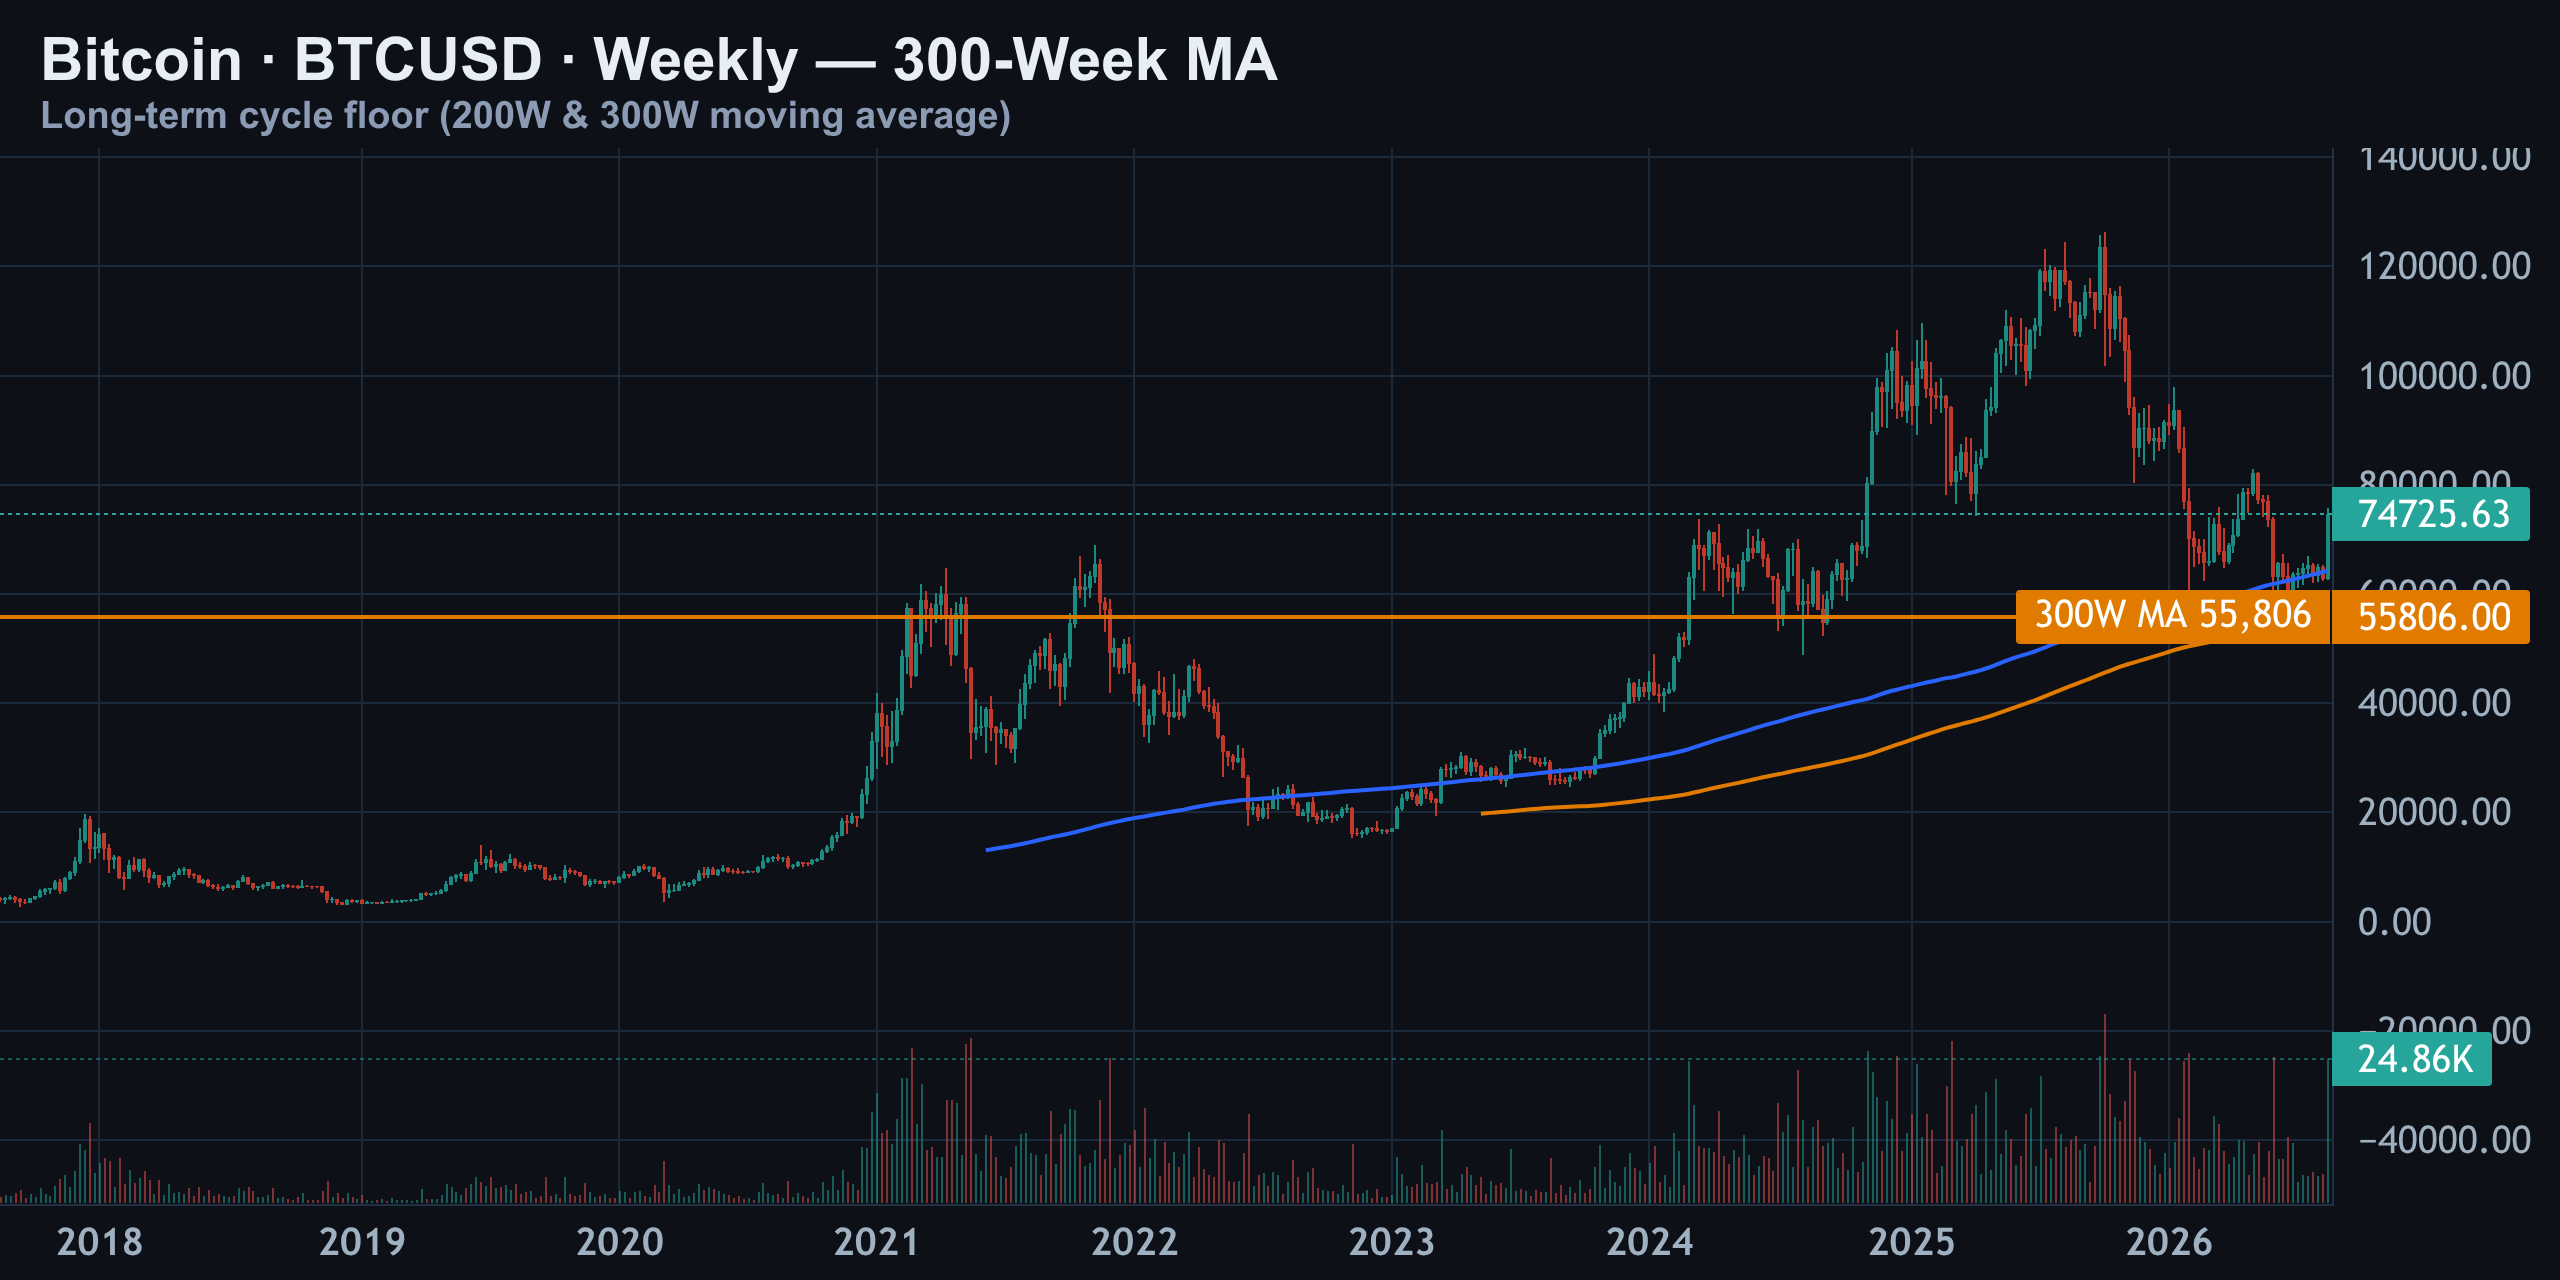
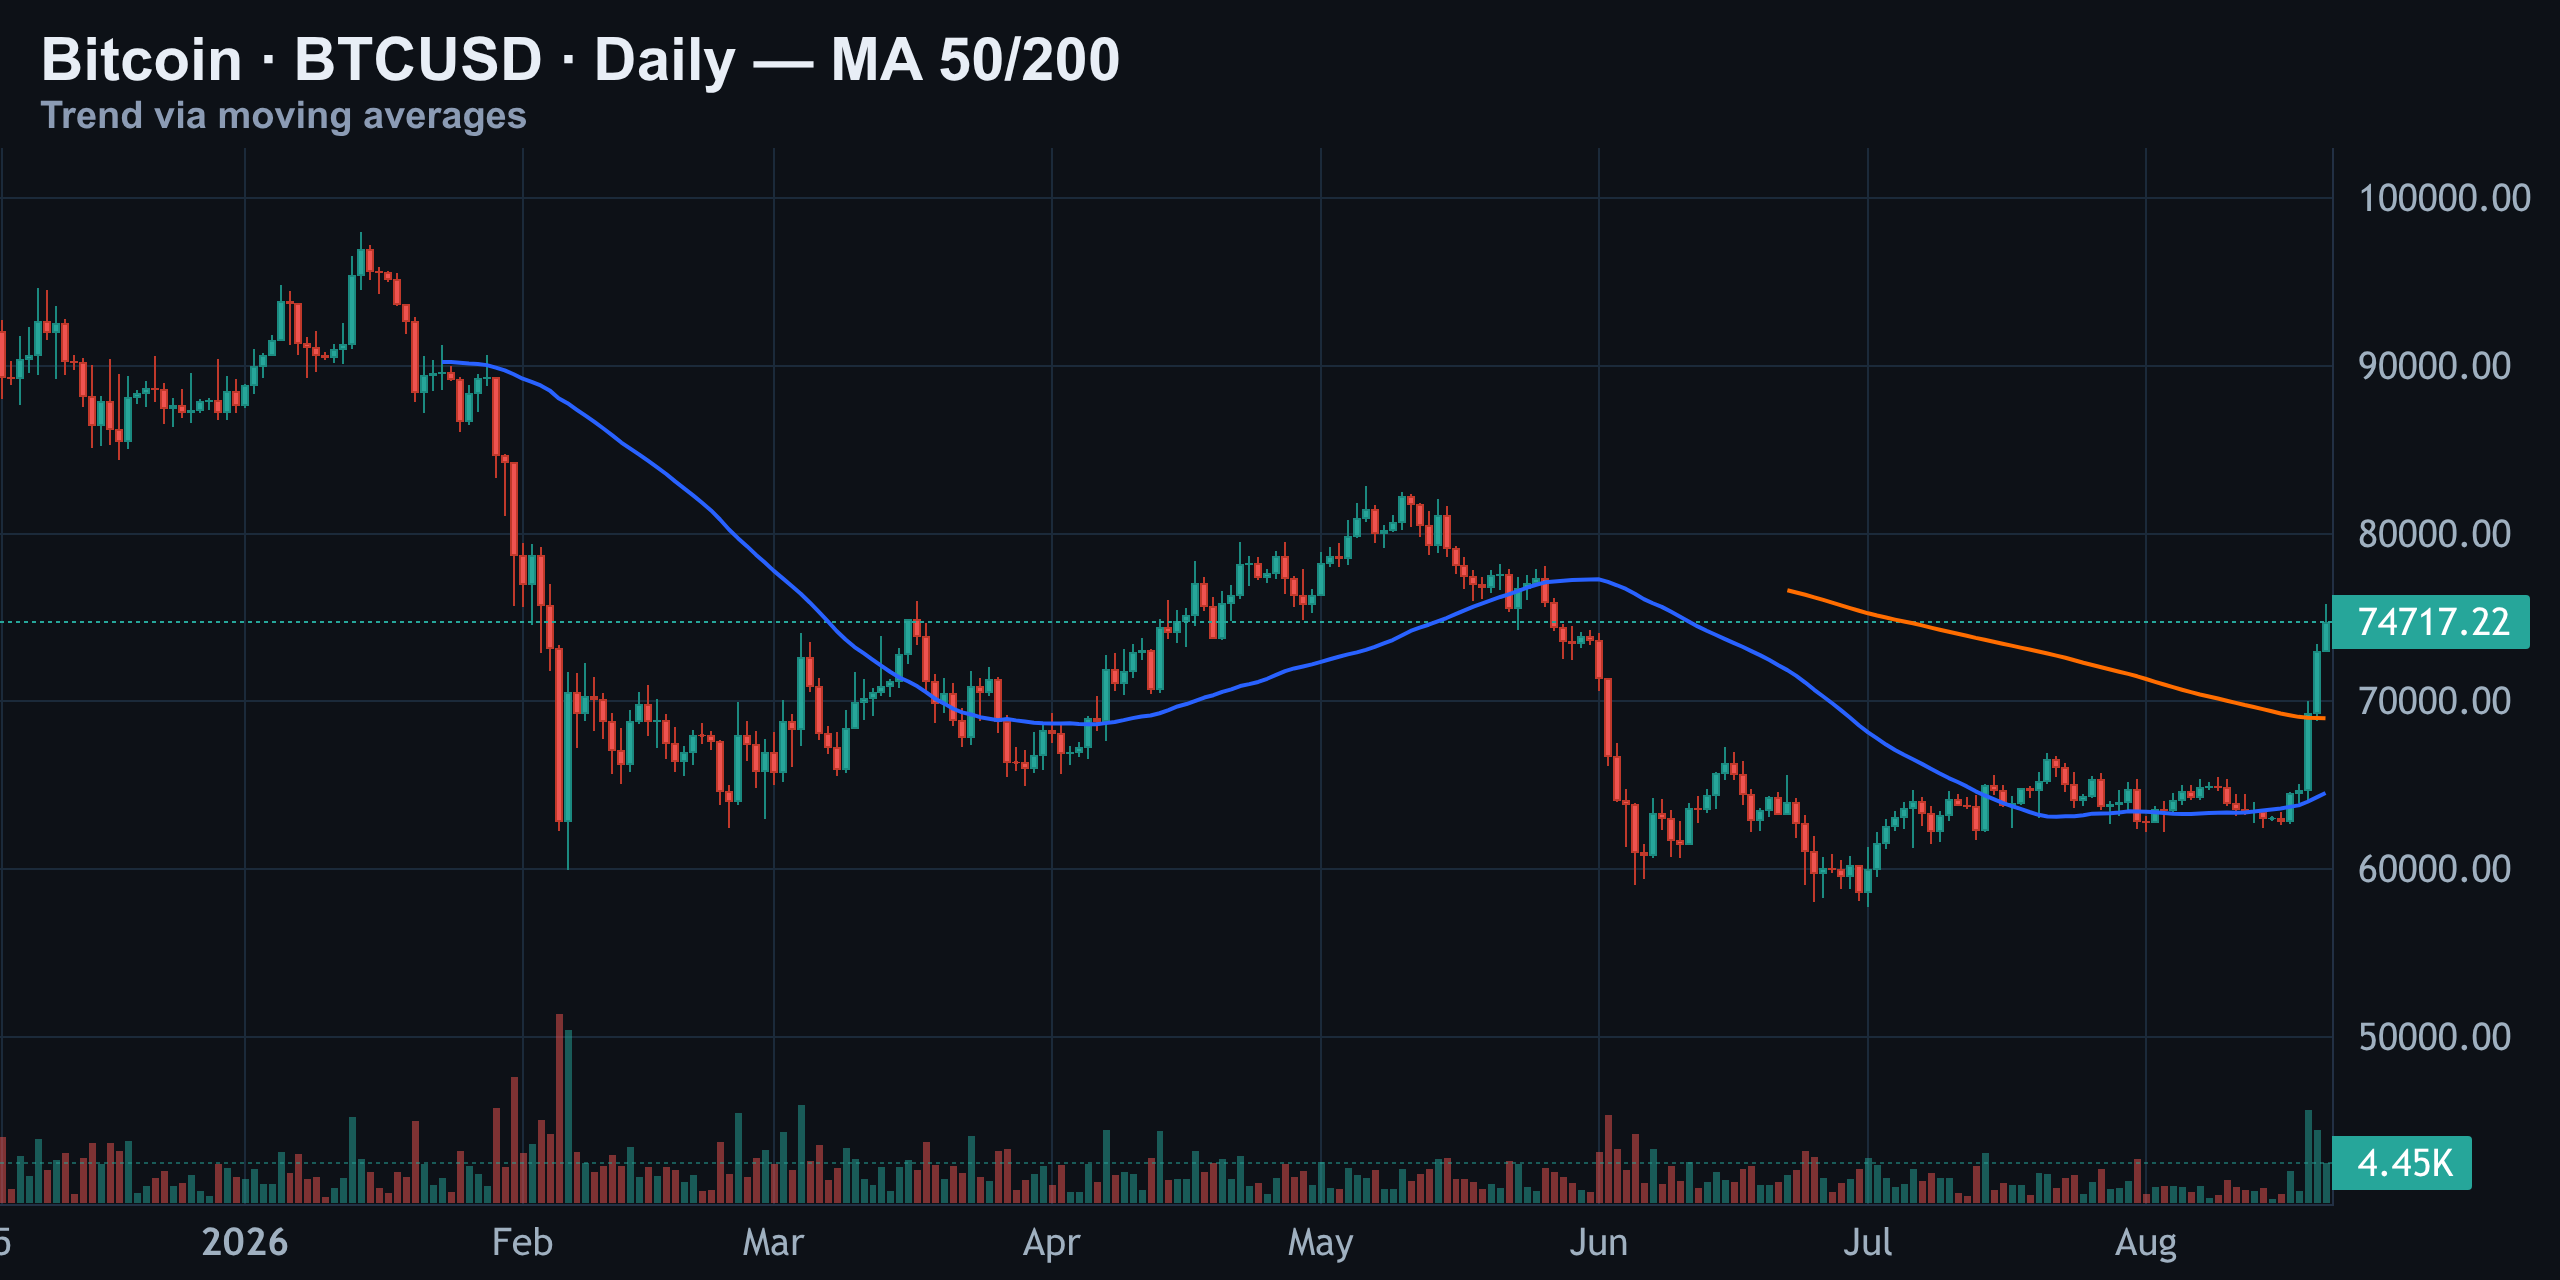
The 300-week moving average remains a useful long-term health check, while the 50-day and 200-day averages help define the medium-term trend. Reclaiming these references strengthens the bullish case, but moving averages are lagging indicators. They confirm what price has already done; they do not remove the risk of a failed retest.
Momentum Is Strong, but Daily Conditions Are Stretched
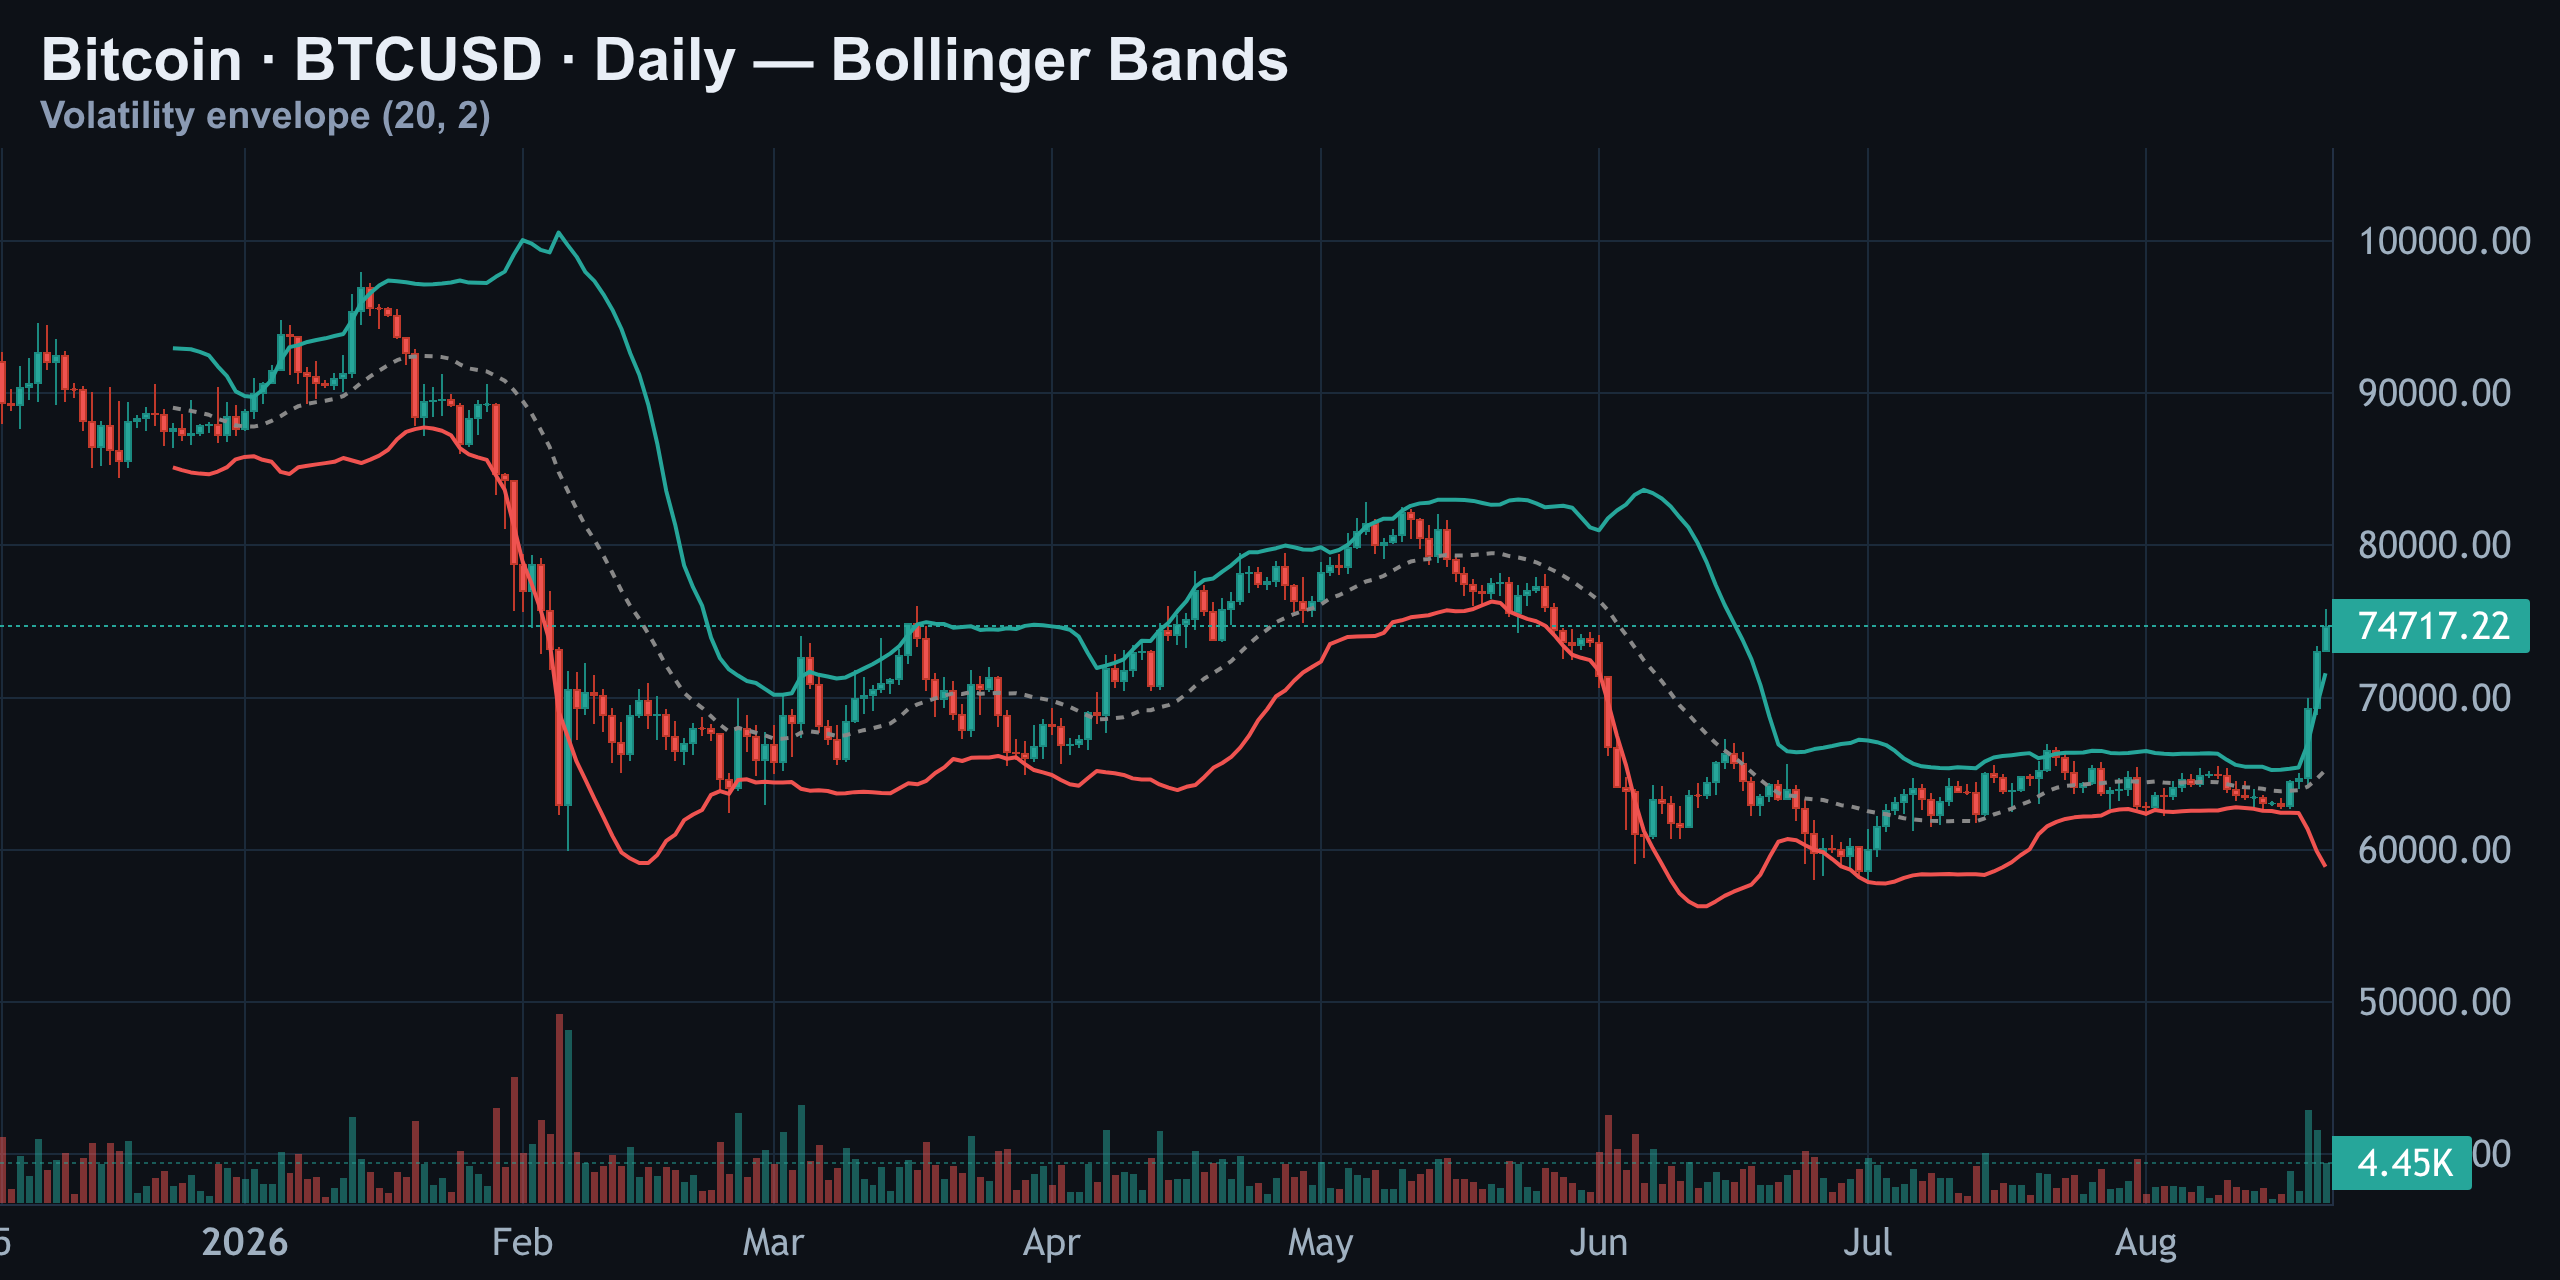
Bitcoin is pressing the upper Bollinger Band after a sharp expansion in volatility. That is often a feature of strong trends, not an automatic sell signal. The risk comes when price closes repeatedly outside the band while volume and follow-through weaken. In that situation, the market can mean-revert toward the middle band or the breakout zone.
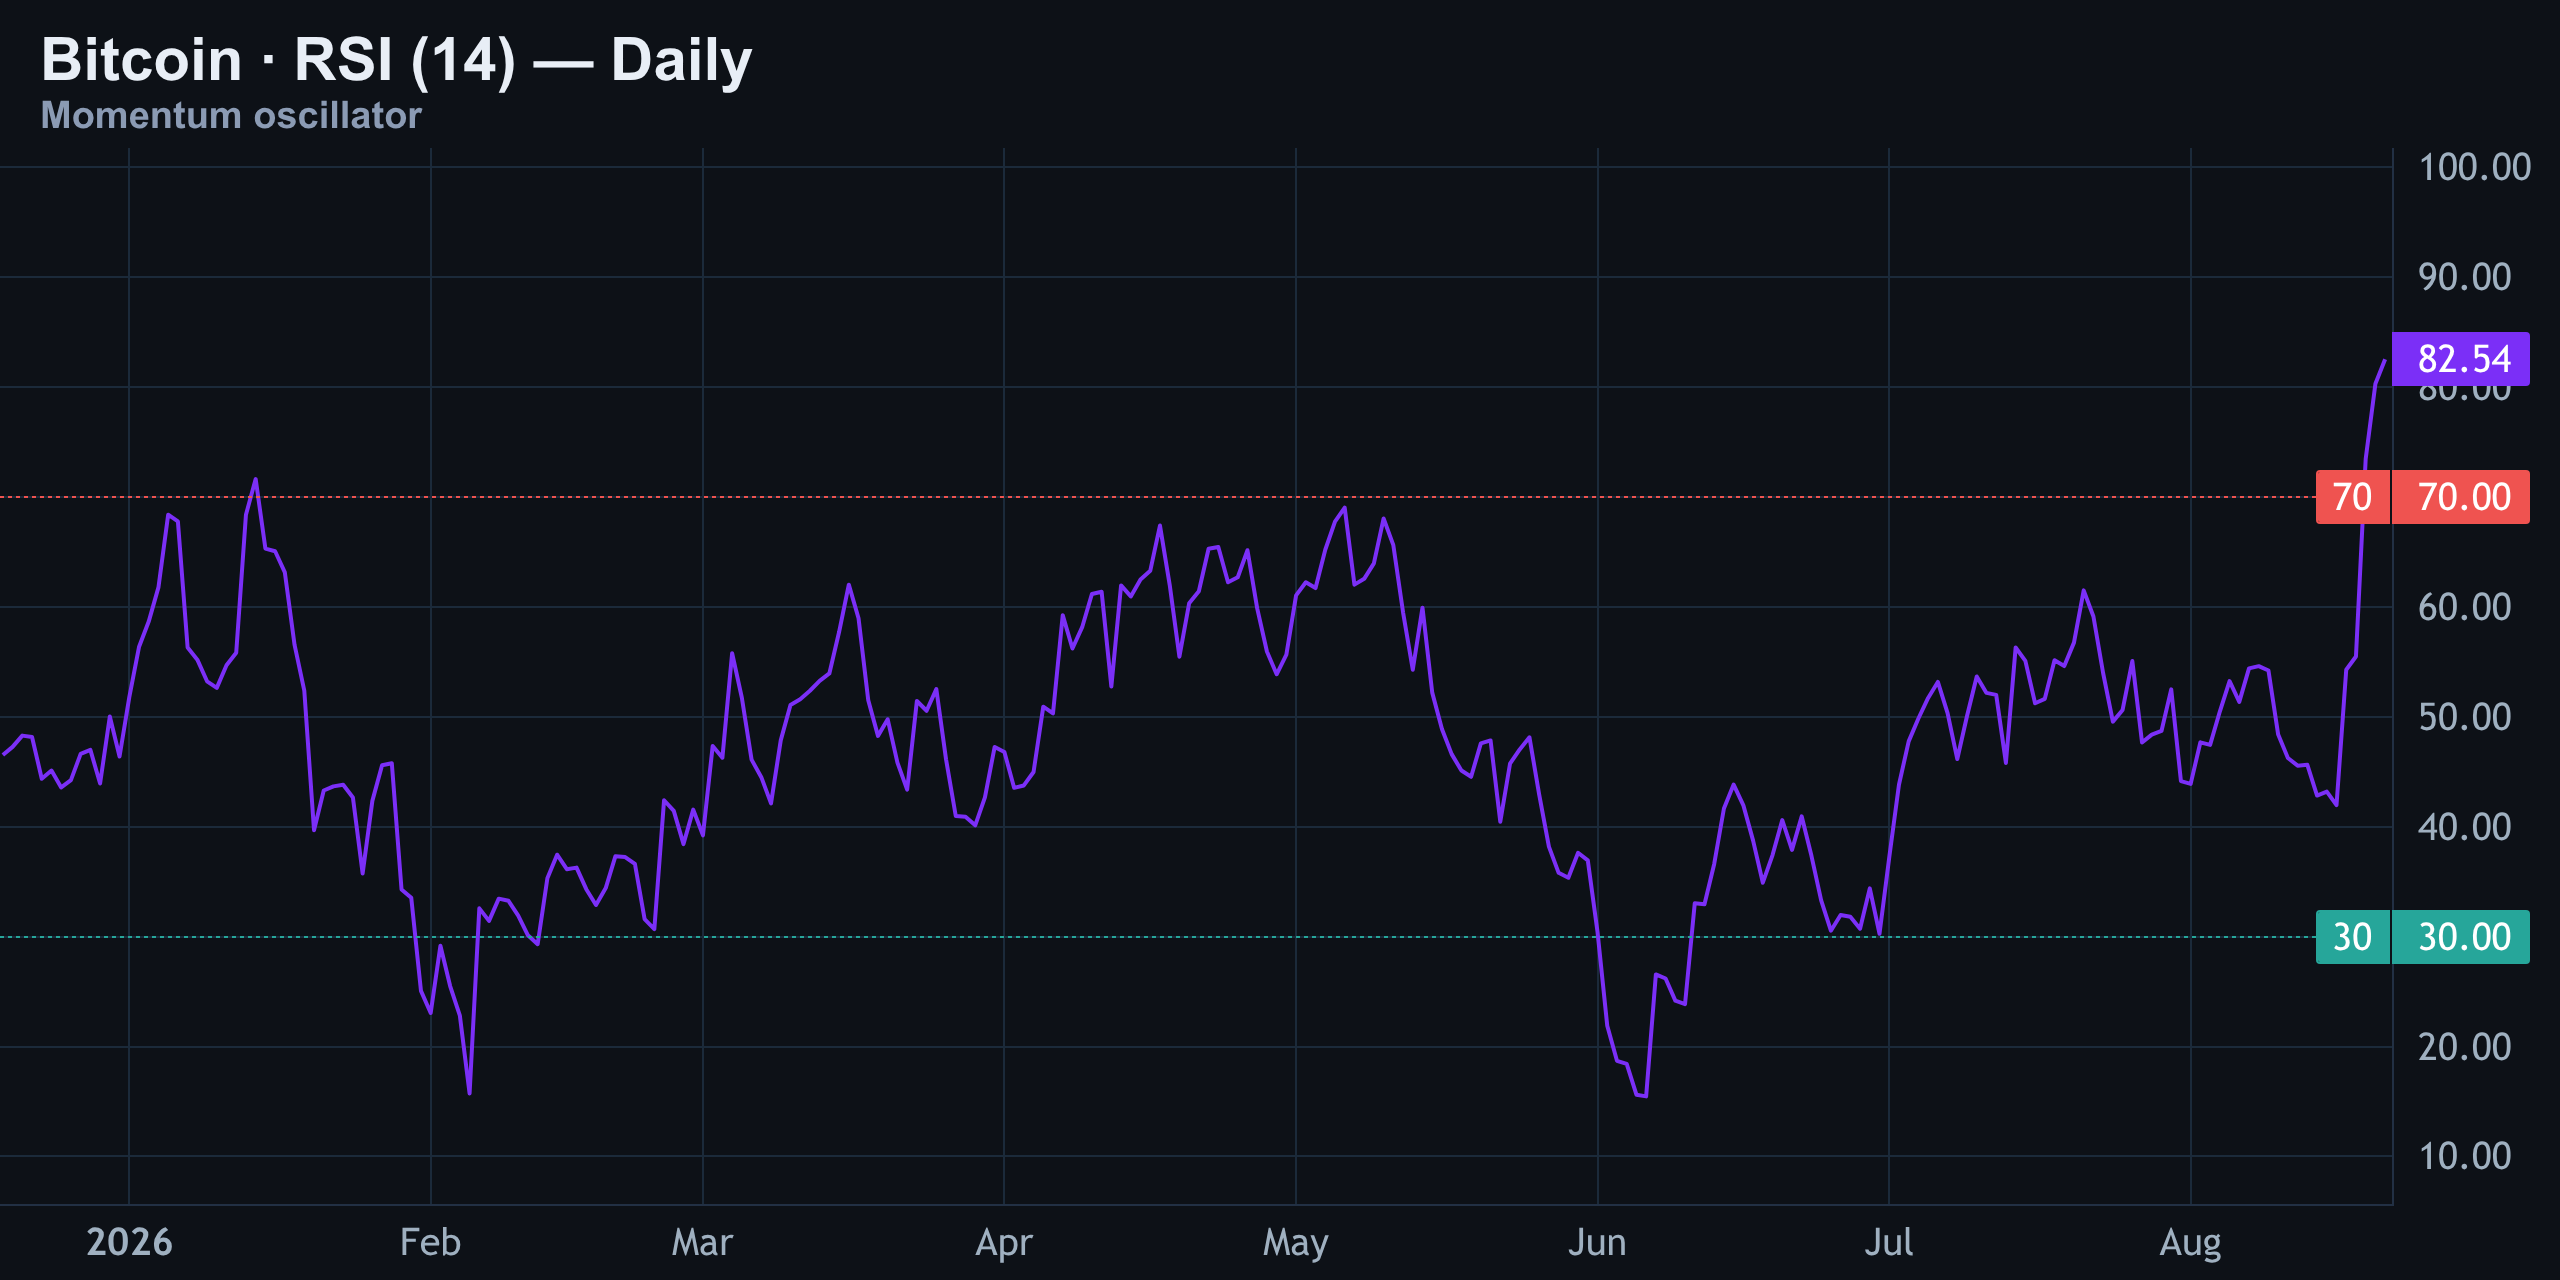
Daily RSI is approximately 83, which confirms exceptional momentum but also shows that the move is stretched. Overbought can persist during a genuine trend, so RSI should be used as a timing tool rather than a standalone short signal. A sideways consolidation would be healthier than an immediate collapse because it could allow RSI to cool without surrendering the breakout.
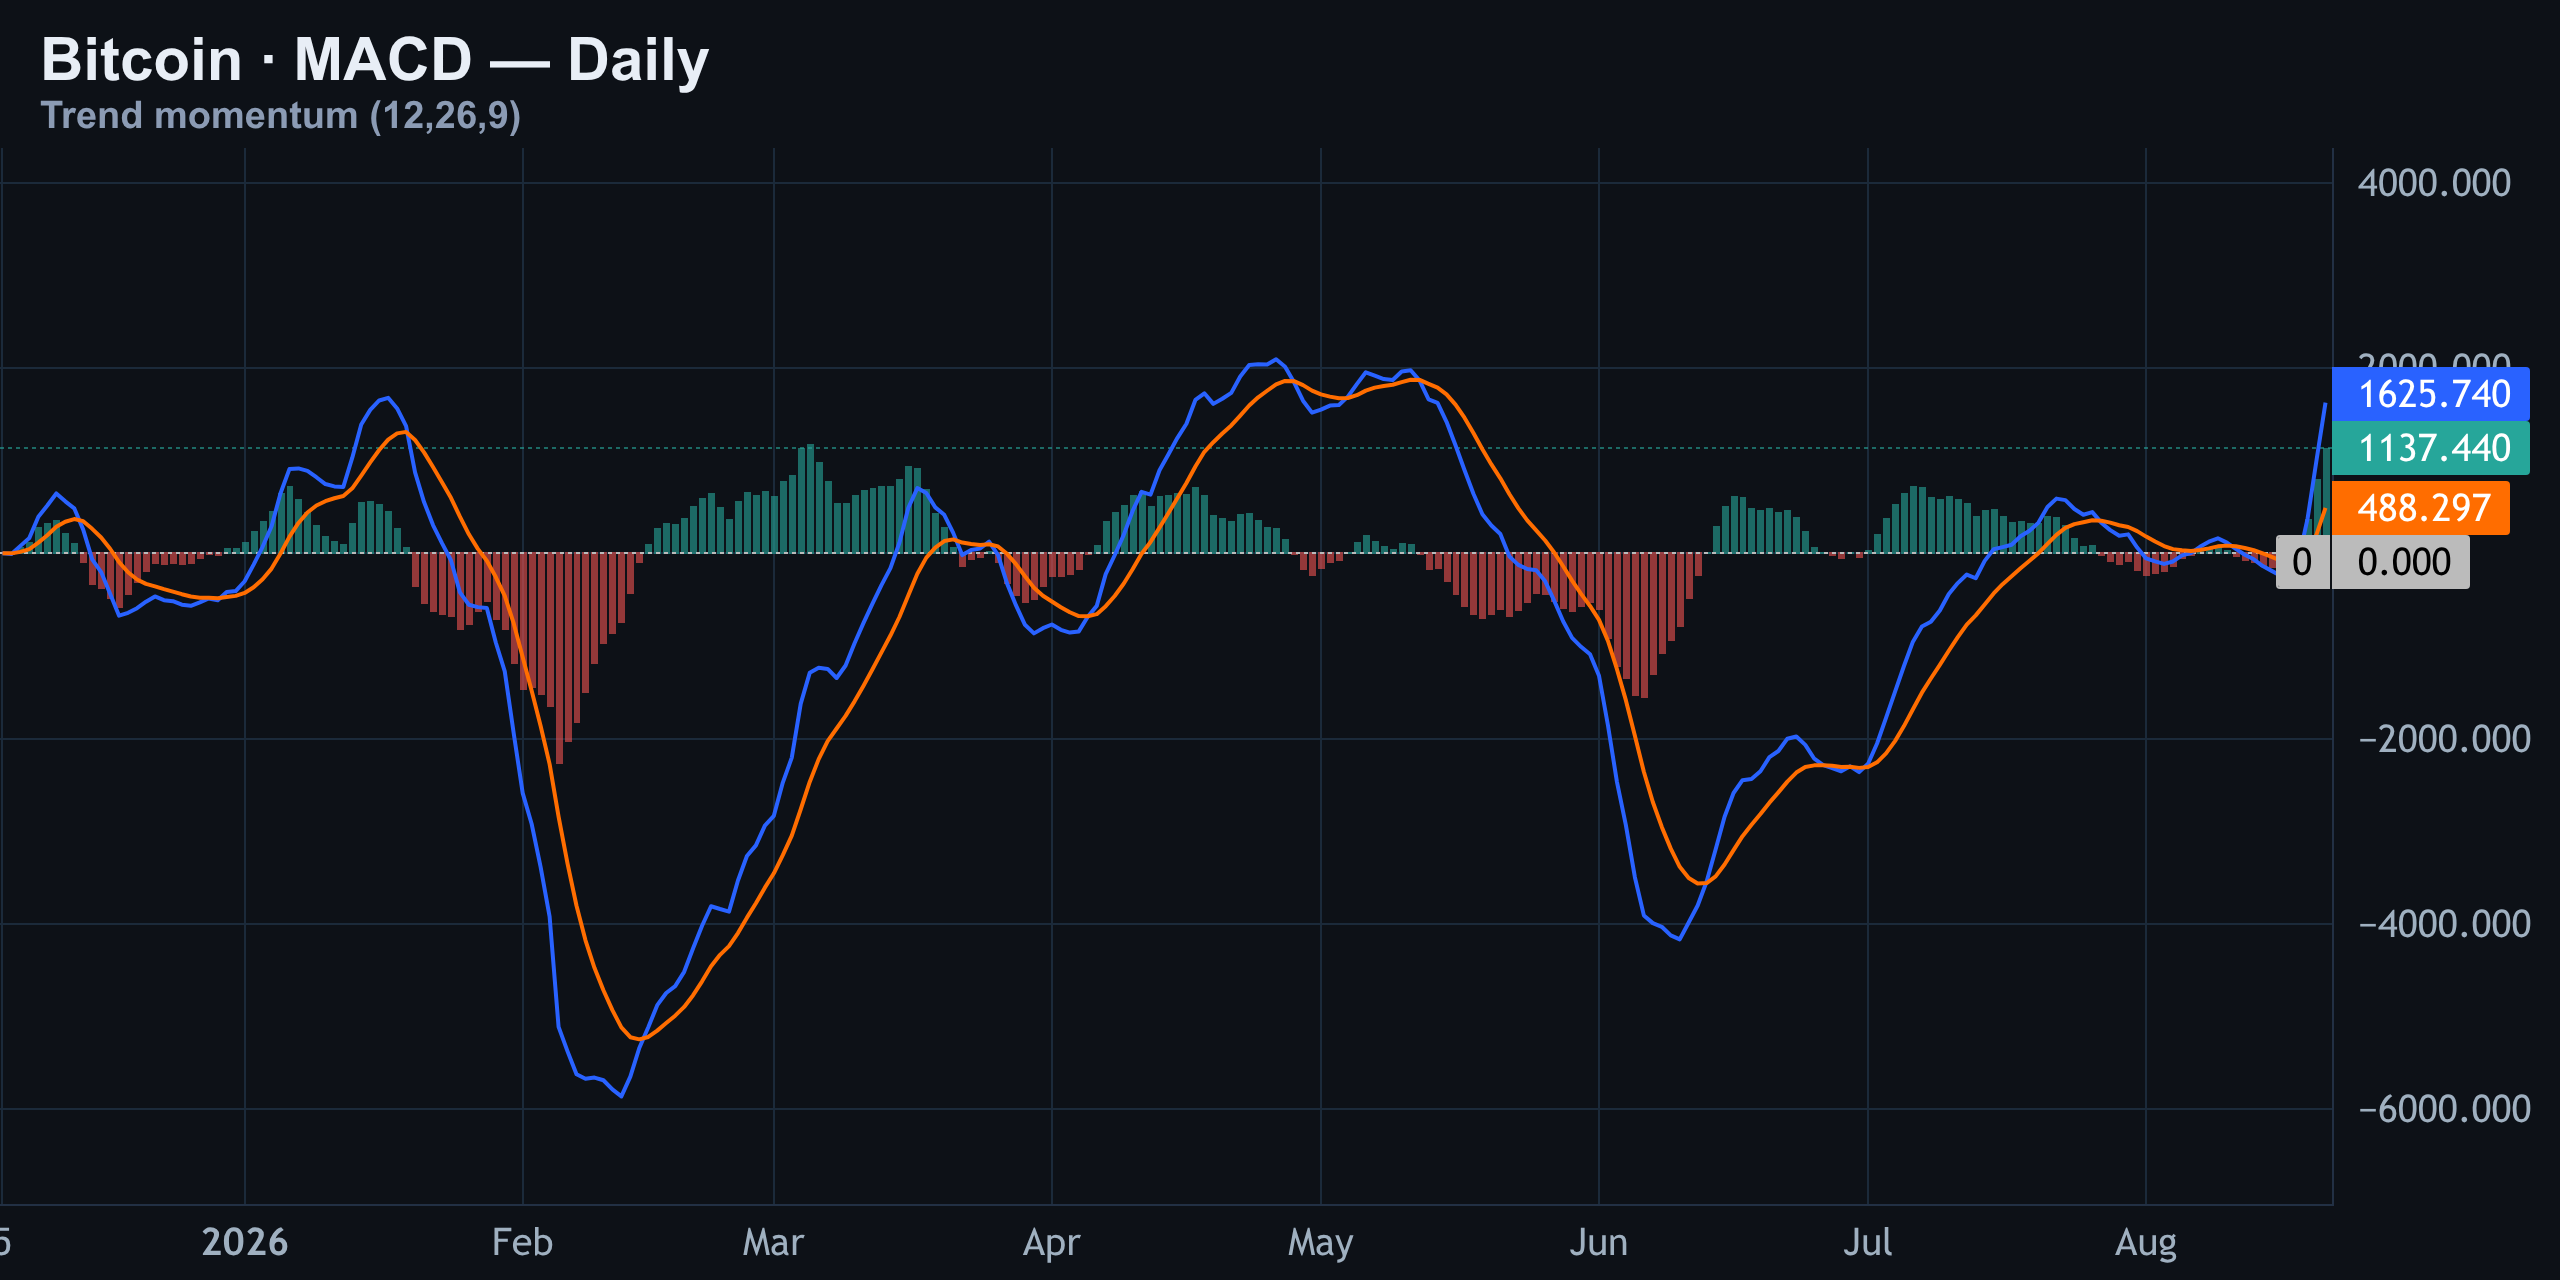
MACD is expanding in the bullish direction, supporting continuation. The strongest confirmation would be a series of higher lows above $70,000 while MACD remains positive. Conversely, a bearish crossover combined with a close below the breakout zone would signal that the impulse is losing control.
| Technical signal | Current read | What it means |
|---|---|---|
| Daily RSI | About 83 | Strong but stretched momentum |
| MACD | Bullish expansion | Momentum confirms the breakout |
| Bollinger Bands | Price near upper band | Trend strength with pullback risk |
| Daily structure | Channel breakout | Potential medium-term reversal |
Liquidity, On-Chain Data and the Trap Beneath Spot
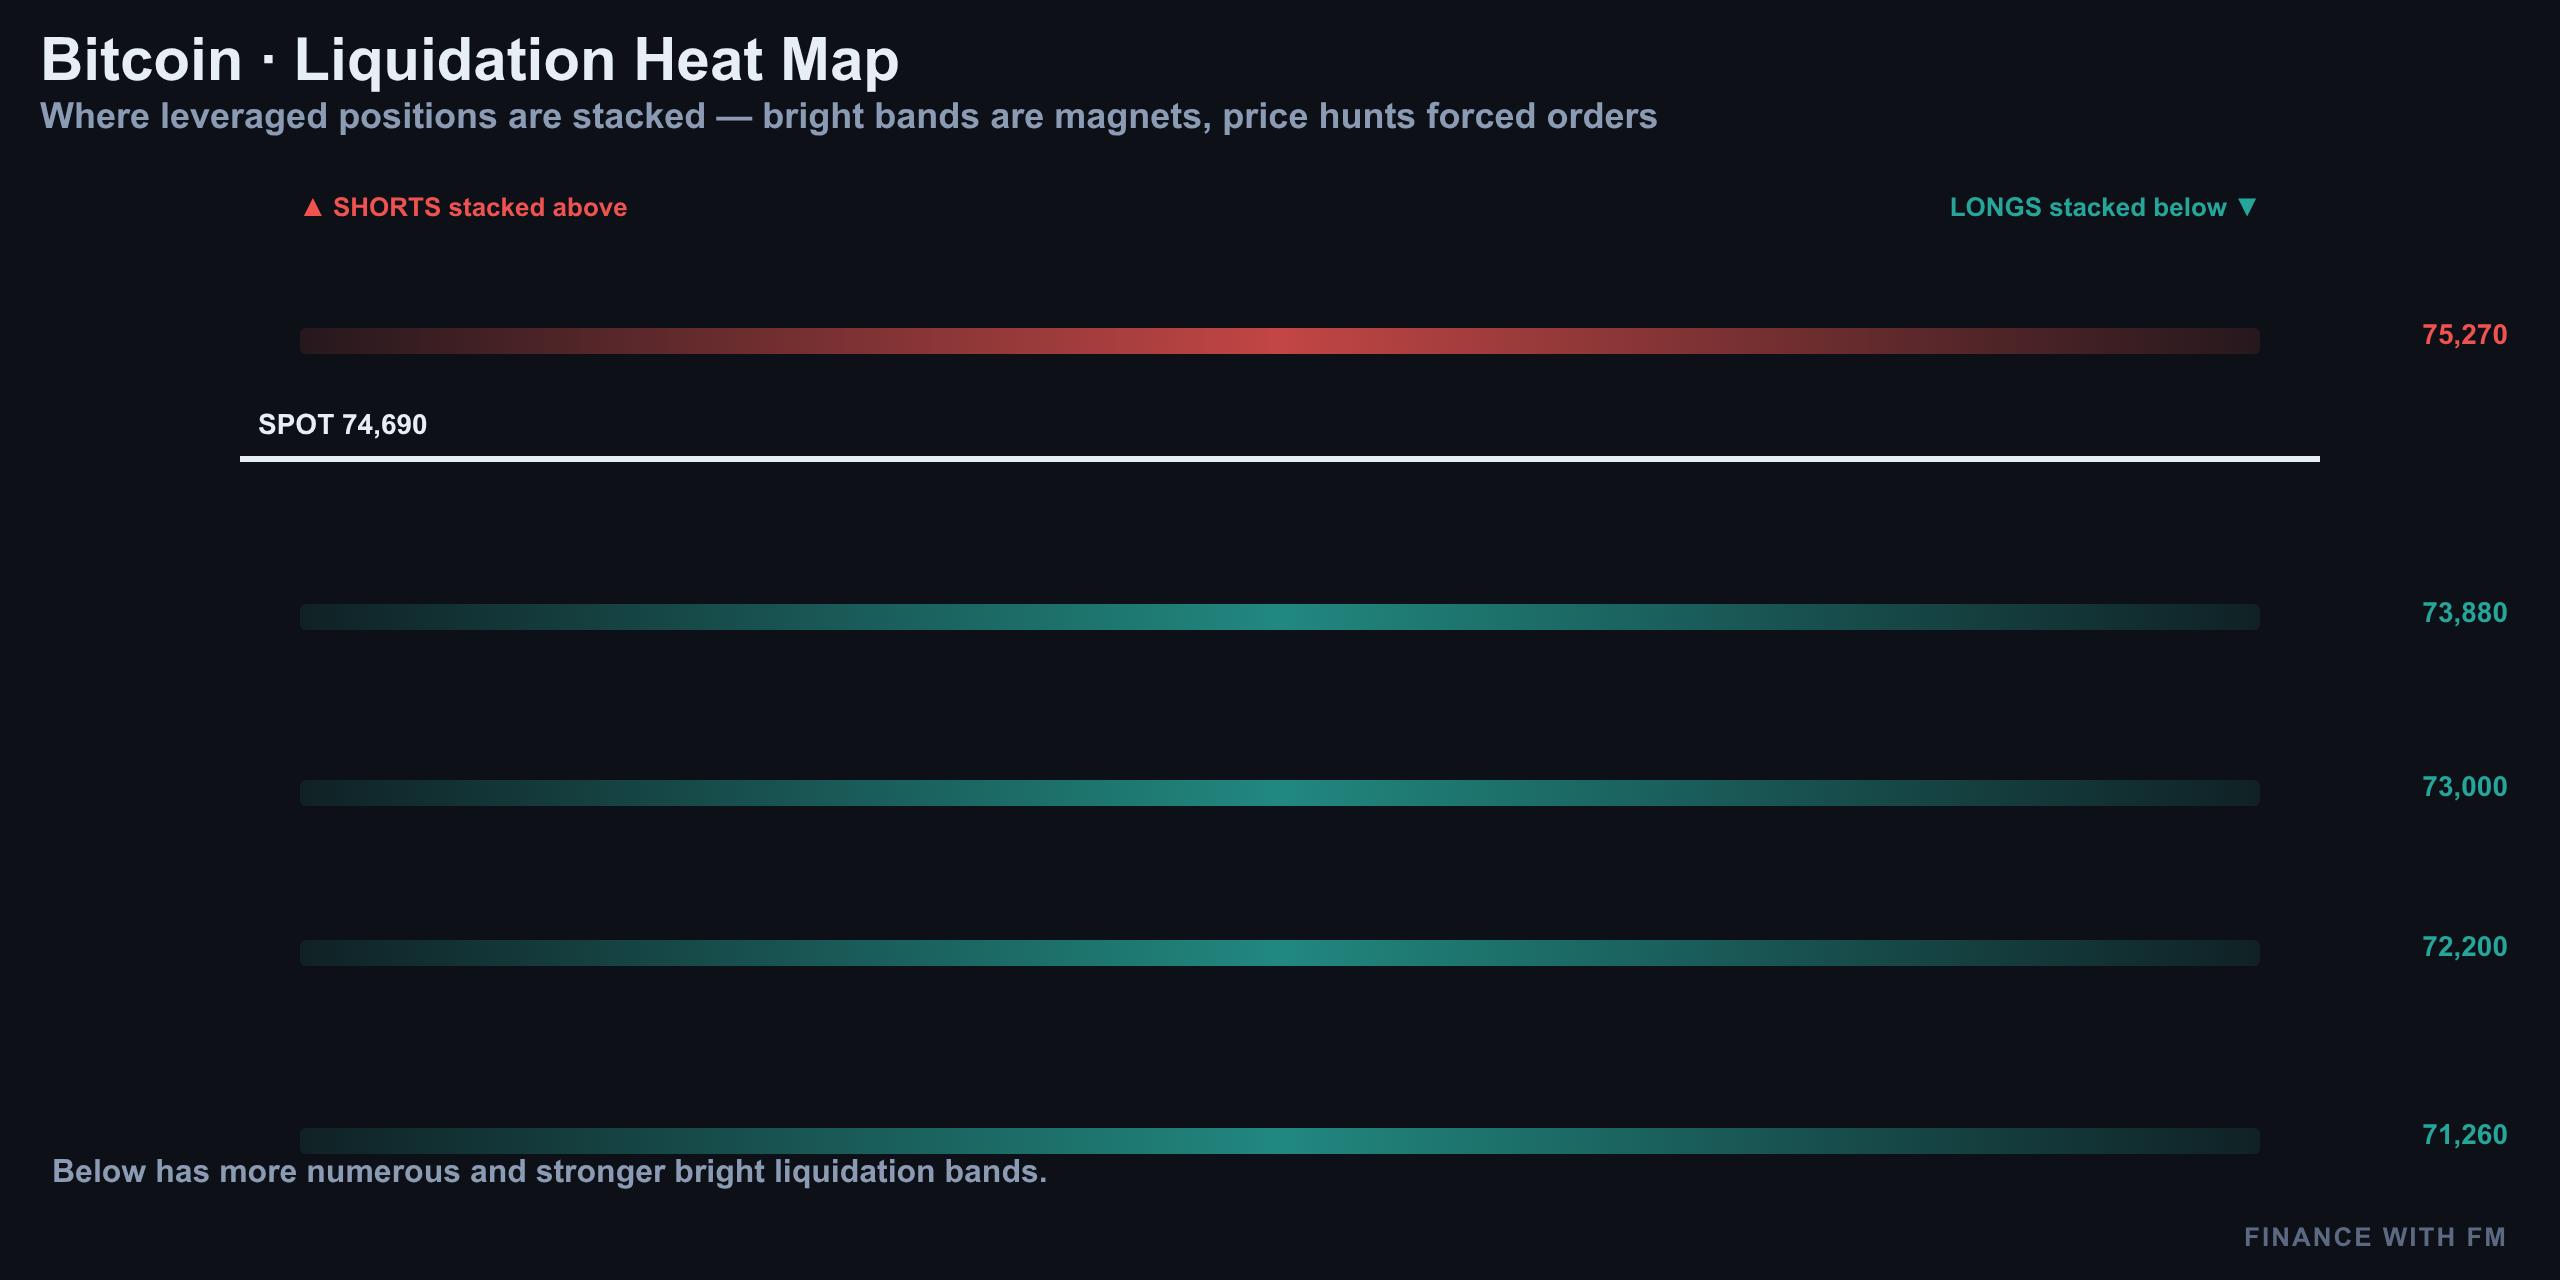
The most important liquidity pocket beneath current price is around $69,124, according to the supplied liquidation map. If Bitcoin pulls back into that area, leveraged long liquidations could temporarily intensify the decline. That does not automatically make the level bearish. If buyers absorb the forced selling and reclaim the breakdown area quickly, the liquidation event could create a higher-quality reset.
The danger is a decisive failure through the broader $69,000-$70,000 region. That would turn a breakout retest into a failed breakout, potentially opening the way toward lower support. This is why liquidation maps should be treated as potential acceleration zones, not precise predictions.
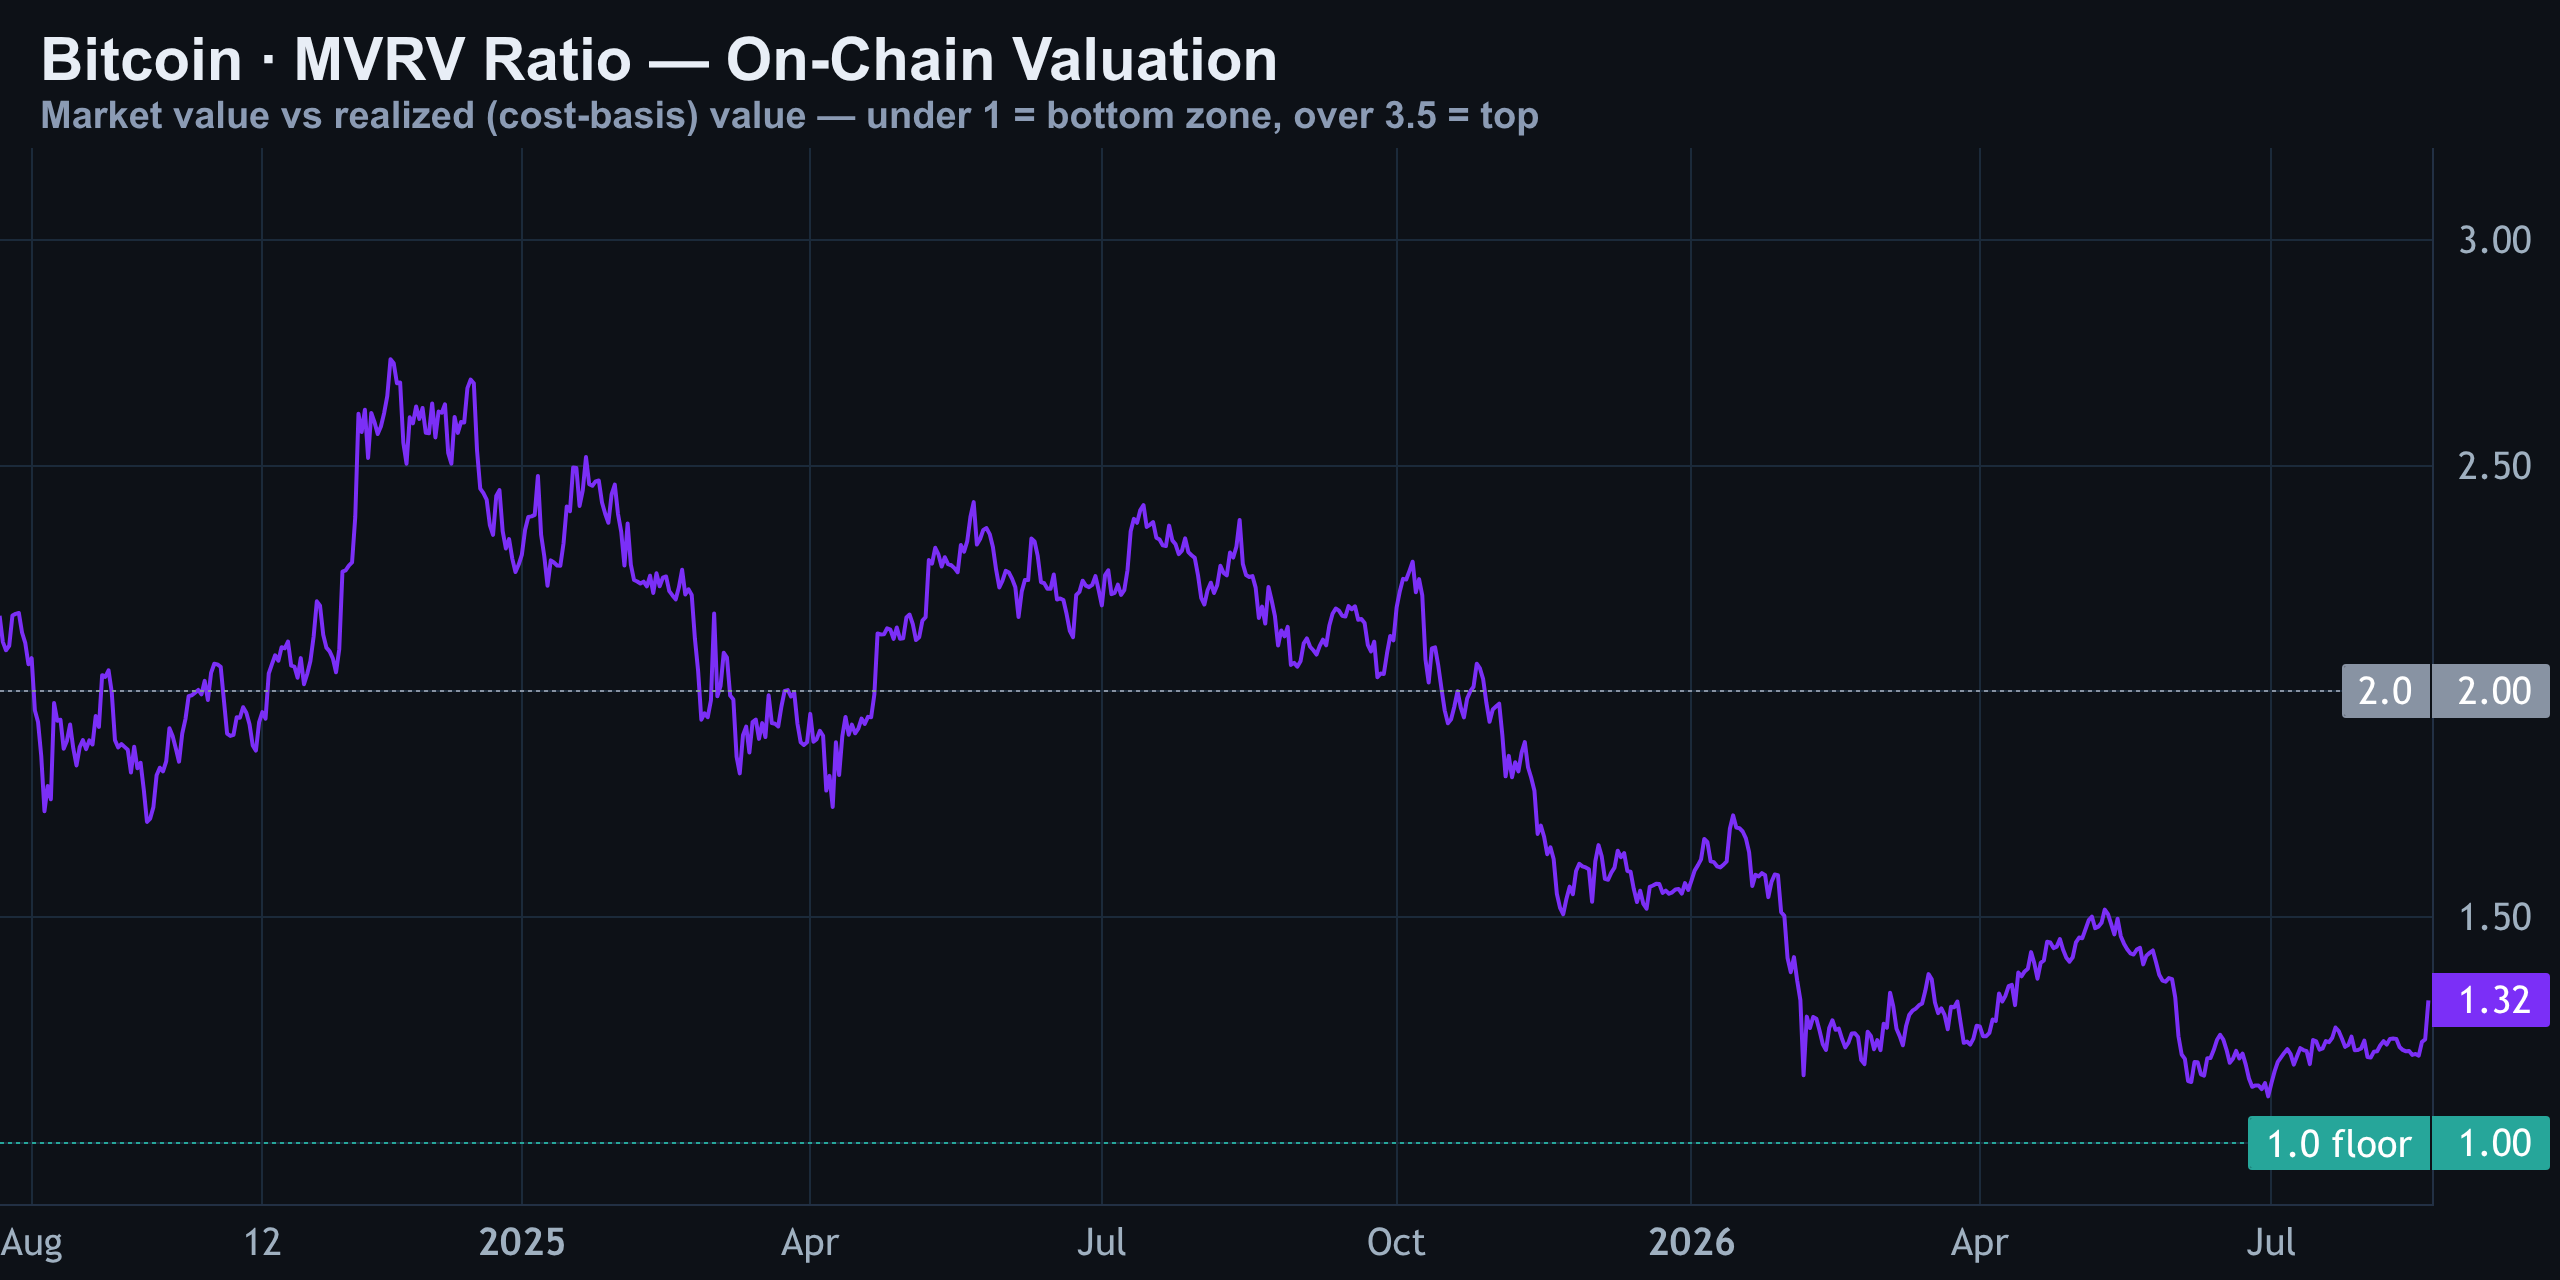
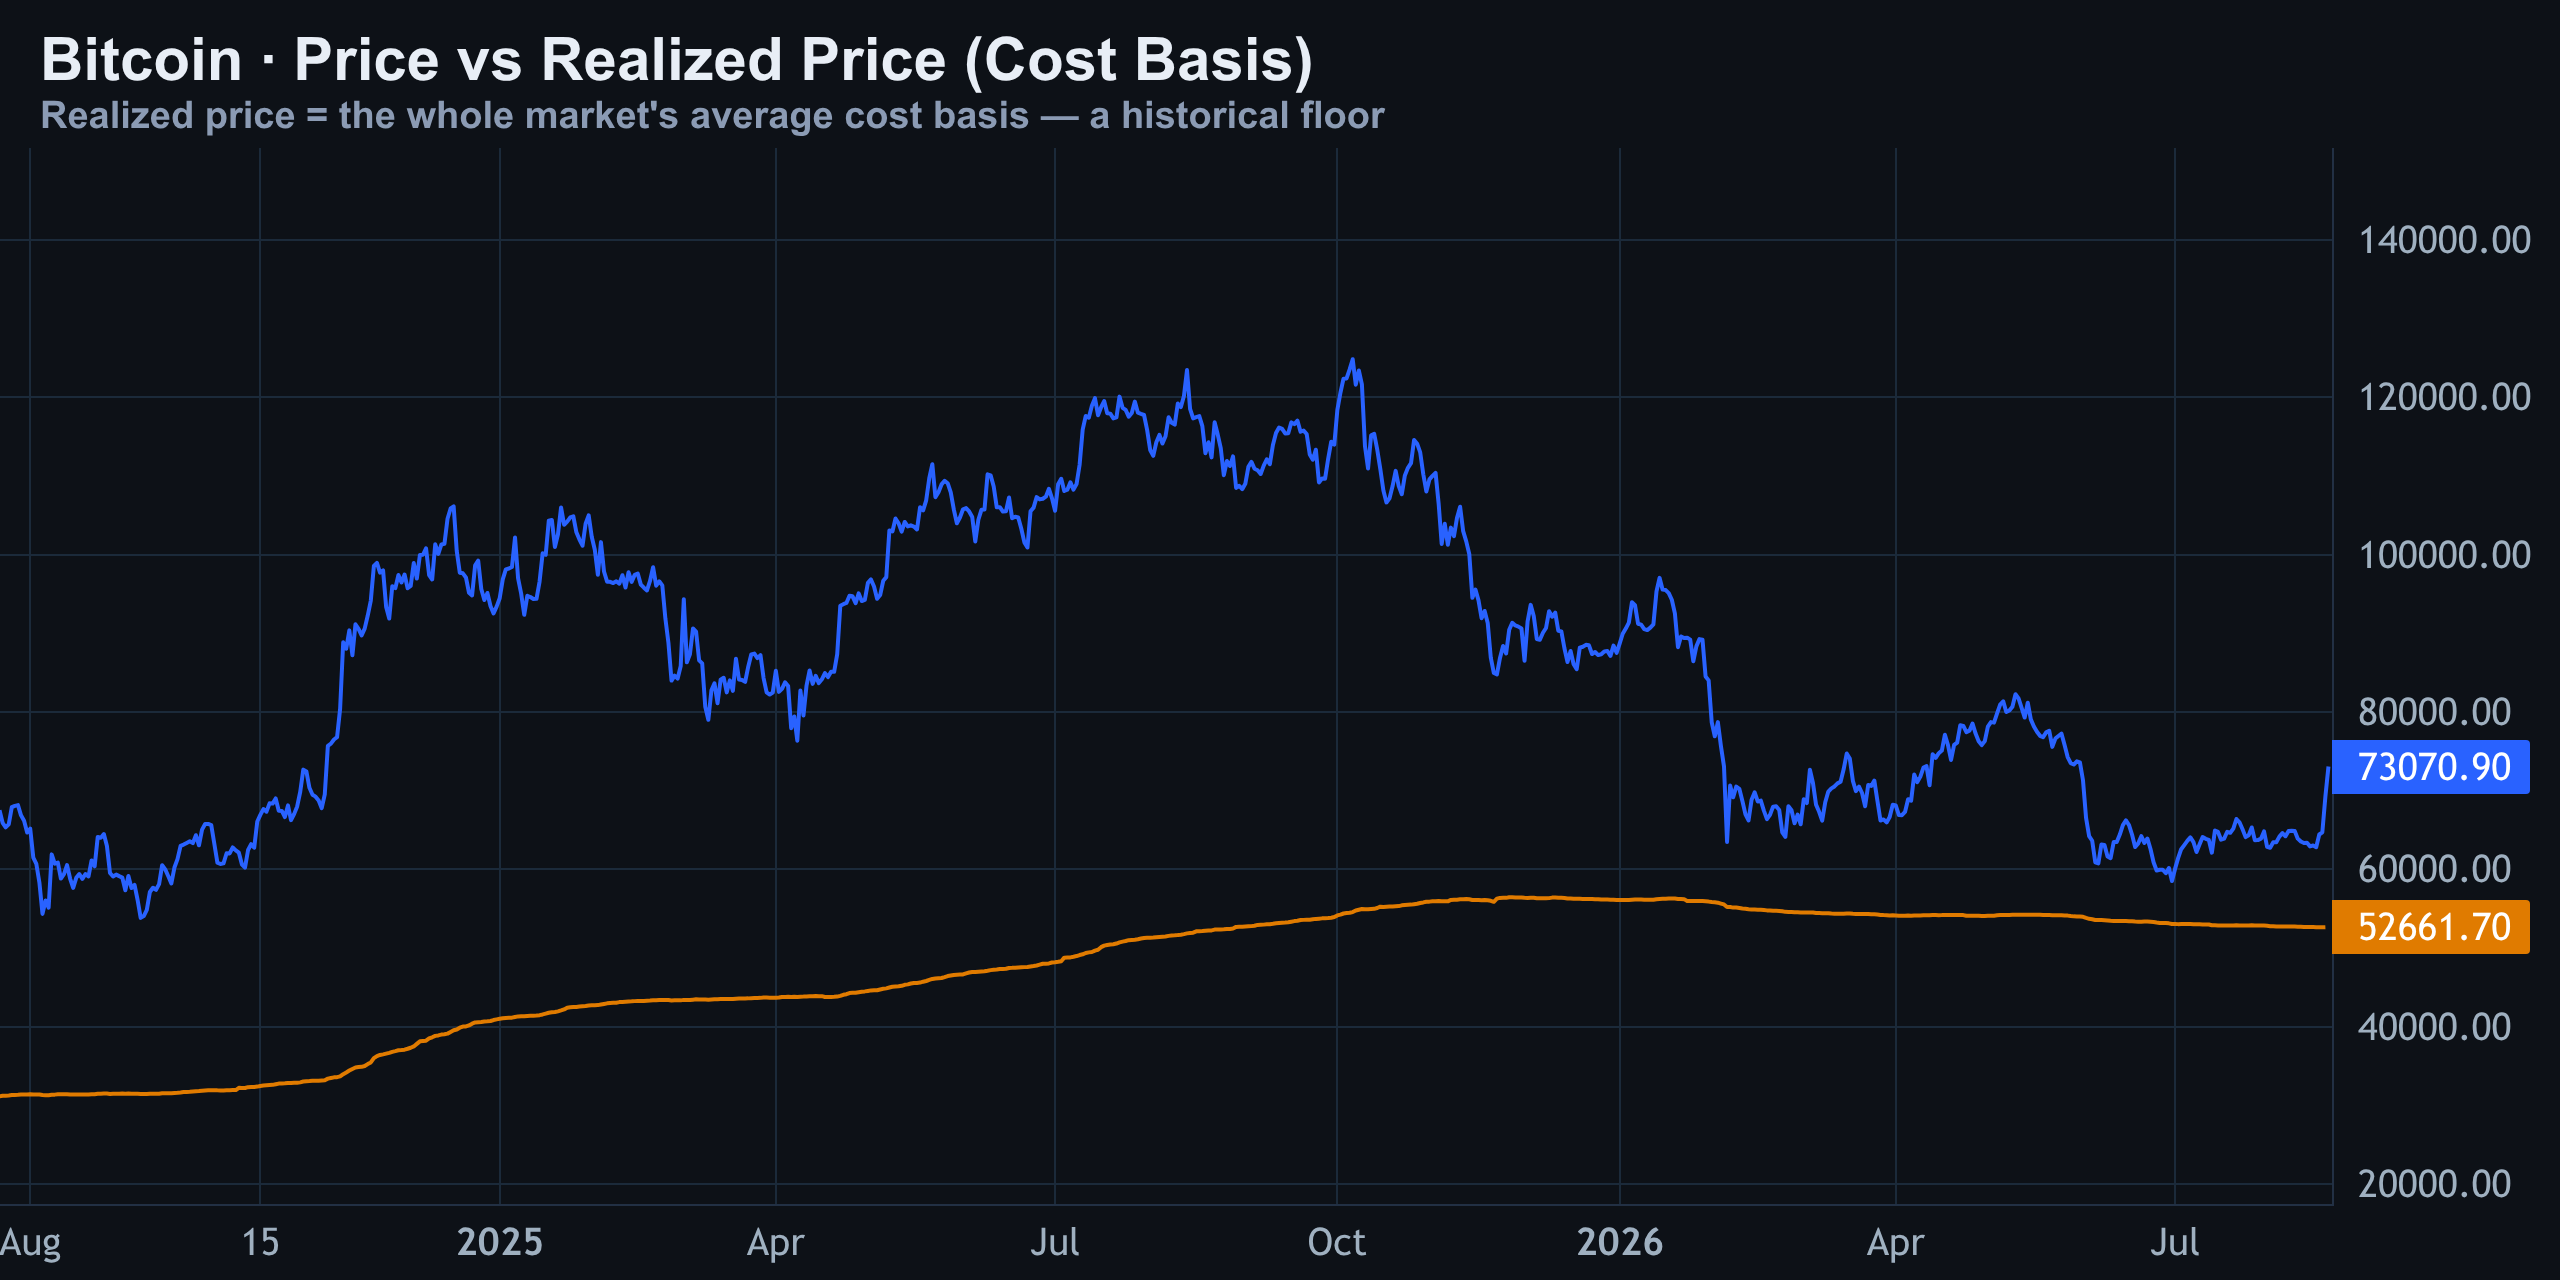
MVRV and realized price add context that price-only analysis cannot provide. A rising MVRV can confirm that market participants are moving into profit, but elevated profitability can eventually increase distribution risk. Realized price is a slower-moving cost-basis reference and is more useful for judging cycle structure than for selecting an intraday entry.
The cross-market picture is mixed: the dollar is softer, but Treasury yields and volatility are higher while equities are weaker. In addition, the Coinbase discount indicates that American spot demand is not leading the rally. Whale flow is reportedly net bearish through call selling and put buying. These are divergences against price, not proof of an immediate collapse—but they make confirmation more valuable than excitement.
Levels, Scenarios and a 1:2.5 Risk Framework
For traders building a plan around the Bitcoin August 21, 2026 setup, the most disciplined approach is to define the invalidation before considering the upside. The example below is a framework, not a recommendation. Position size should be based on the distance to the stop and the amount of capital that can genuinely be risked.
| Reference | Price | Role |
|---|---|---|
| Current snapshot | $74,439 | Approximate spot price |
| Near-term pullback zone | $73,000 | First area for a controlled retest |
| Gamma support / breakout base | $70,000 | Key level bulls need to defend |
| Hard invalidation | $69,622 | Four-hour close below ends the immediate bullish setup |
| Liquidation pocket | $69,124 | Potential flush and reset zone |
| Near-term resistance | $75,000 | First major overhead gamma area |
| Prior A-wave high | $82,850 | Upside continuation target |
| Major call wall | $80,000 | Important resistance and profit-taking zone |
Primary bullish scenario
Bitcoin pulls back toward $73,000 or retests $70,000, holds the breakout structure and then resumes higher. In that path, the first resistance is the $75,000 gamma area, followed by the $80,000 call wall and the prior swing reference near $82,850.
Liquidity-trap scenario
Price fails to hold $70,000, accelerates through the dense liquidation zone near $69,124 and closes below $69,622 on the four-hour timeframe. That would suggest that late breakout buyers were trapped and that the market needs a deeper reset before another sustained attempt higher.
| Example plan component | Illustrative level |
|---|---|
| Entry concept | Pullback that holds above $70,000 |
| Stop or invalidation | Four-hour close below $69,622 |
| First upside area | $75,000 |
| Extended target | $80,000-$82,850 |
| Risk-to-reward objective | Approximately 1:2.5 |
Final Verdict: Bullish Bias, Selective Execution
The evidence currently leans bullish, but the best expression is buyable weakness rather than chaseable strength. The range breakout, higher volume, improved moving-average structure and bullish MACD all support continuation. Options positioning also shows visible upside interest, with $80,000 acting as the major call wall.
At the same time, daily RSI near 83, a positive volatility risk premium, rich downside skew, the Coinbase discount and mixed macro conditions warn that the rally is event-loaded. Positive gamma may pin price around major strikes, but the liquidation pocket beneath spot could still produce a fast shakeout.
The cleanest bullish confirmation is a pullback that holds above $70,000, followed by renewed acceptance above $75,000. The non-negotiable line for the immediate setup is a four-hour close below $69,622. Above it, the breakout remains valid. Below it, the probability of a liquidity trap rises materially.
For live derivatives, open interest and implied-volatility references, traders can compare data from CoinGlass, Deribit and TradingView. On-chain context can be reviewed through CryptoQuant. Data can change rapidly, so verify levels before acting.
08/19/2026 — Bitcoin Daily Pulse Aug 19: The $64,616 Trap Holds
Bitcoin Daily Pulse Aug 19: The $64,616 Trap Holds
Where We Left It — Yesterday's Call, Today's Reality
Bitcoin has drifted higher since our last update, moving from around $64,161 to roughly $64,383–$64,680 depending on the exact snapshot — call it up a third of a percent, nothing dramatic. Other trackers have BTC printing closer to $64,680–$64,722 on the day as it recovers from a recent dip near $62,679. CoinDesk's live feed puts it slightly differently again, noting Bitcoin is holding firm above $64,000 even as external markets — South Korea's Kospi sank 5.8% overnight — wobble around it.
Yesterday's call on Finance With FM was simple: stand aside, because there was no clean 1:2.5 risk-reward setup on the table. No target was hit. No stop was triggered. Because no trade was ever placed. That call is still technically live today, and the level we flagged as the trap — $64,616 — is still exactly where price wants to camp out.
Options Positioning: Quietly Bullish, But Someone Is Paying Up for Protection
Start with open interest. On Deribit, the put-call ratio by open interest sits at 0.56 — meaningfully more calls open than puts, which on its face reads bullish-leaning. But the volume ratio today runs hotter at 0.67, which tells you traders are actively hedging short-term even while the longer-dated book stays call-heavy.
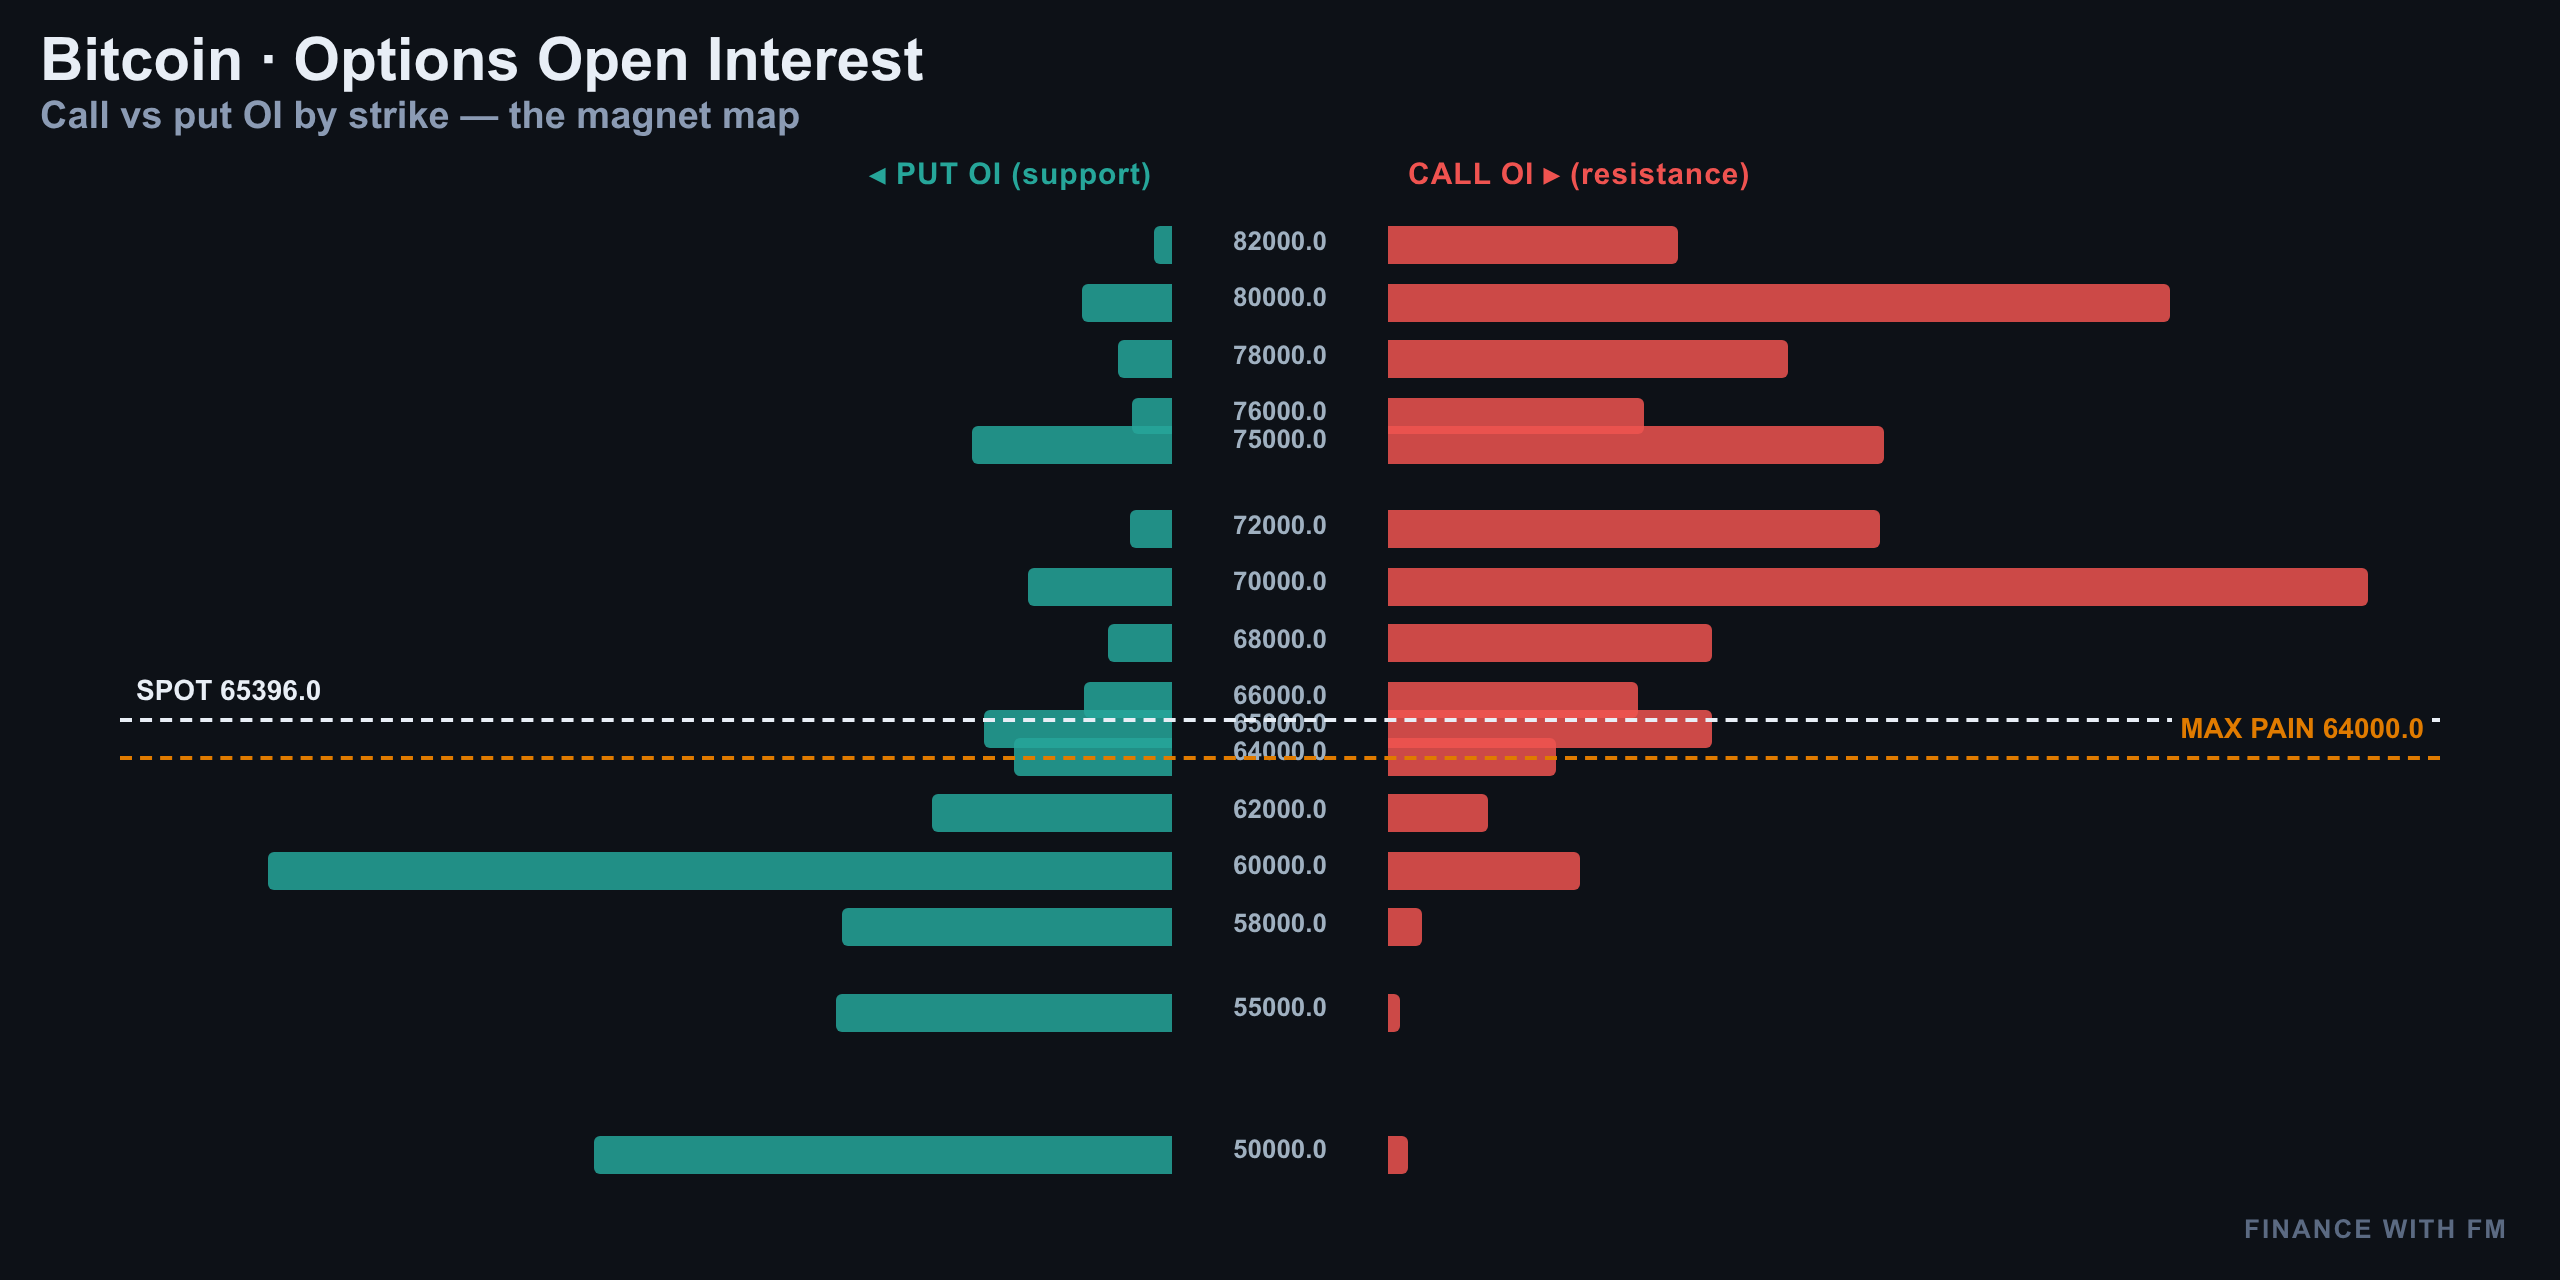
Max pain for the nearest expiry sits right at $64,000, acting like a magnet into today's close. Above spot, the biggest call wall looms way up at $70,000. Below, the strongest put wall — where sellers are defending a floor — sits at $60,000.
Volatility Is Pricing More Chaos Than the Market Has Delivered
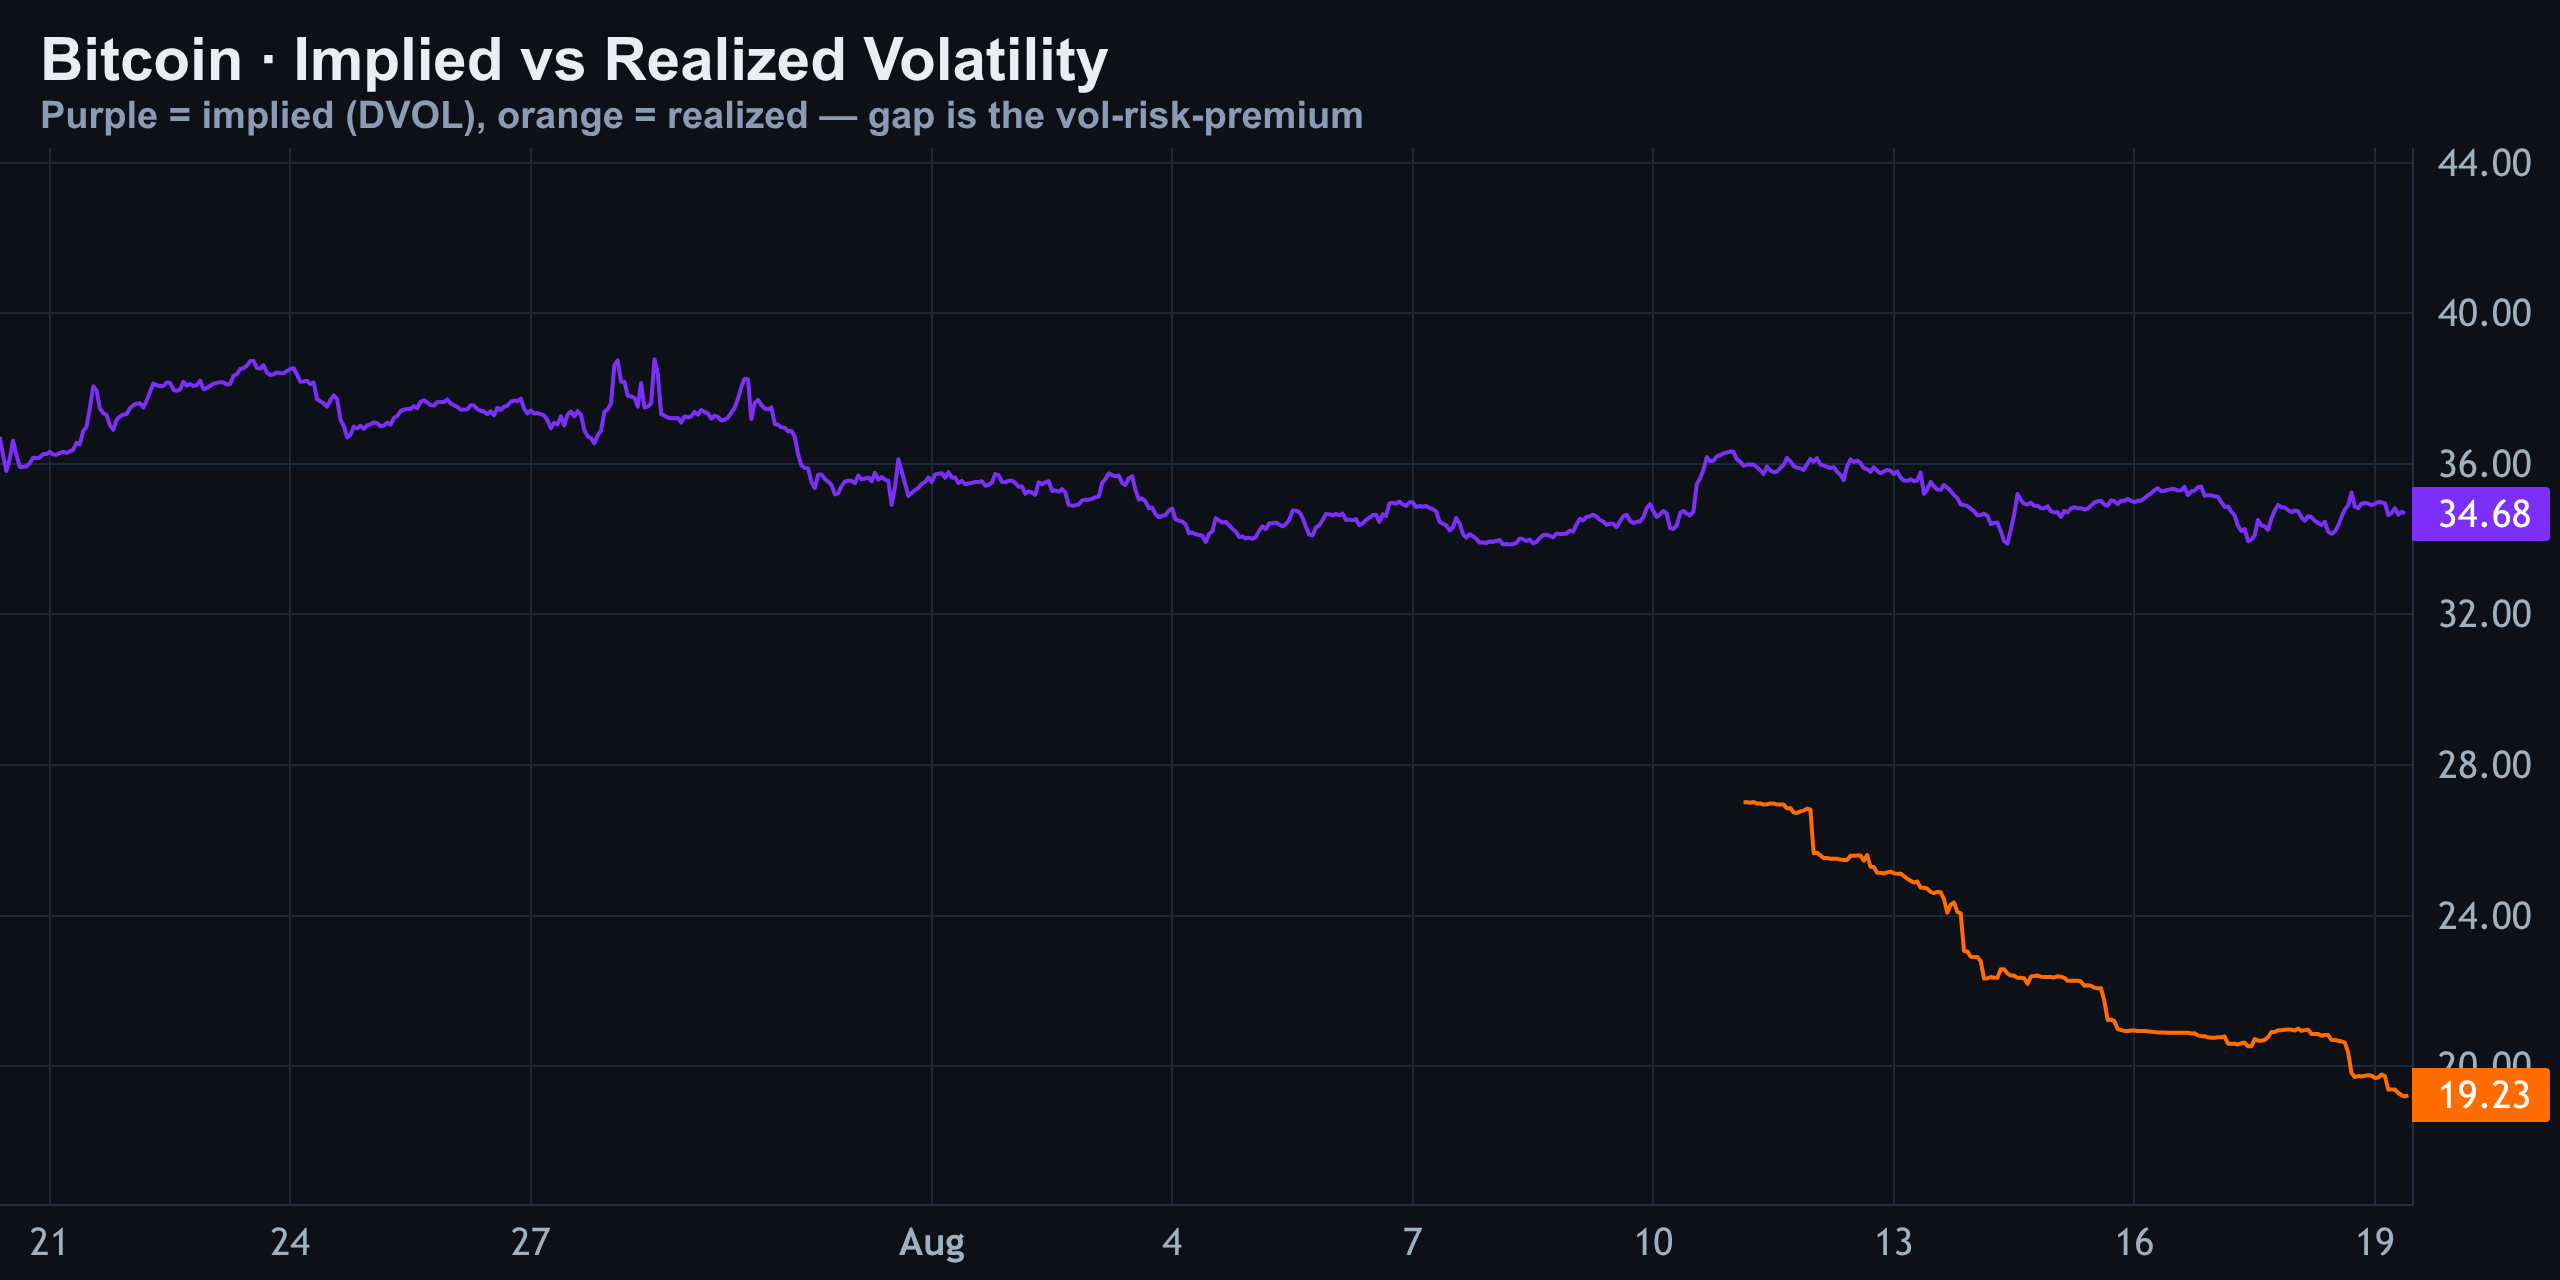
Implied volatility on the DVOL index is running at 34.7, against realized volatility of just 19.2. That's a vol-risk-premium of roughly 15.5 points — options are pricing in far more turbulence than actual price action has shown. That's expensive insurance right now, and it's a classic sign of a market that's coiling rather than trending.
The Skew Tells a Different Story Than the Ratio
Here's the part that matters most: the 25-delta skew is +13.9%, meaning puts are trading at a real premium to calls at equivalent distance from the money. Visually, that shows up as a steeper left wing on the smile — the market paying more for downside protection than upside exposure, even while spot chops sideways.
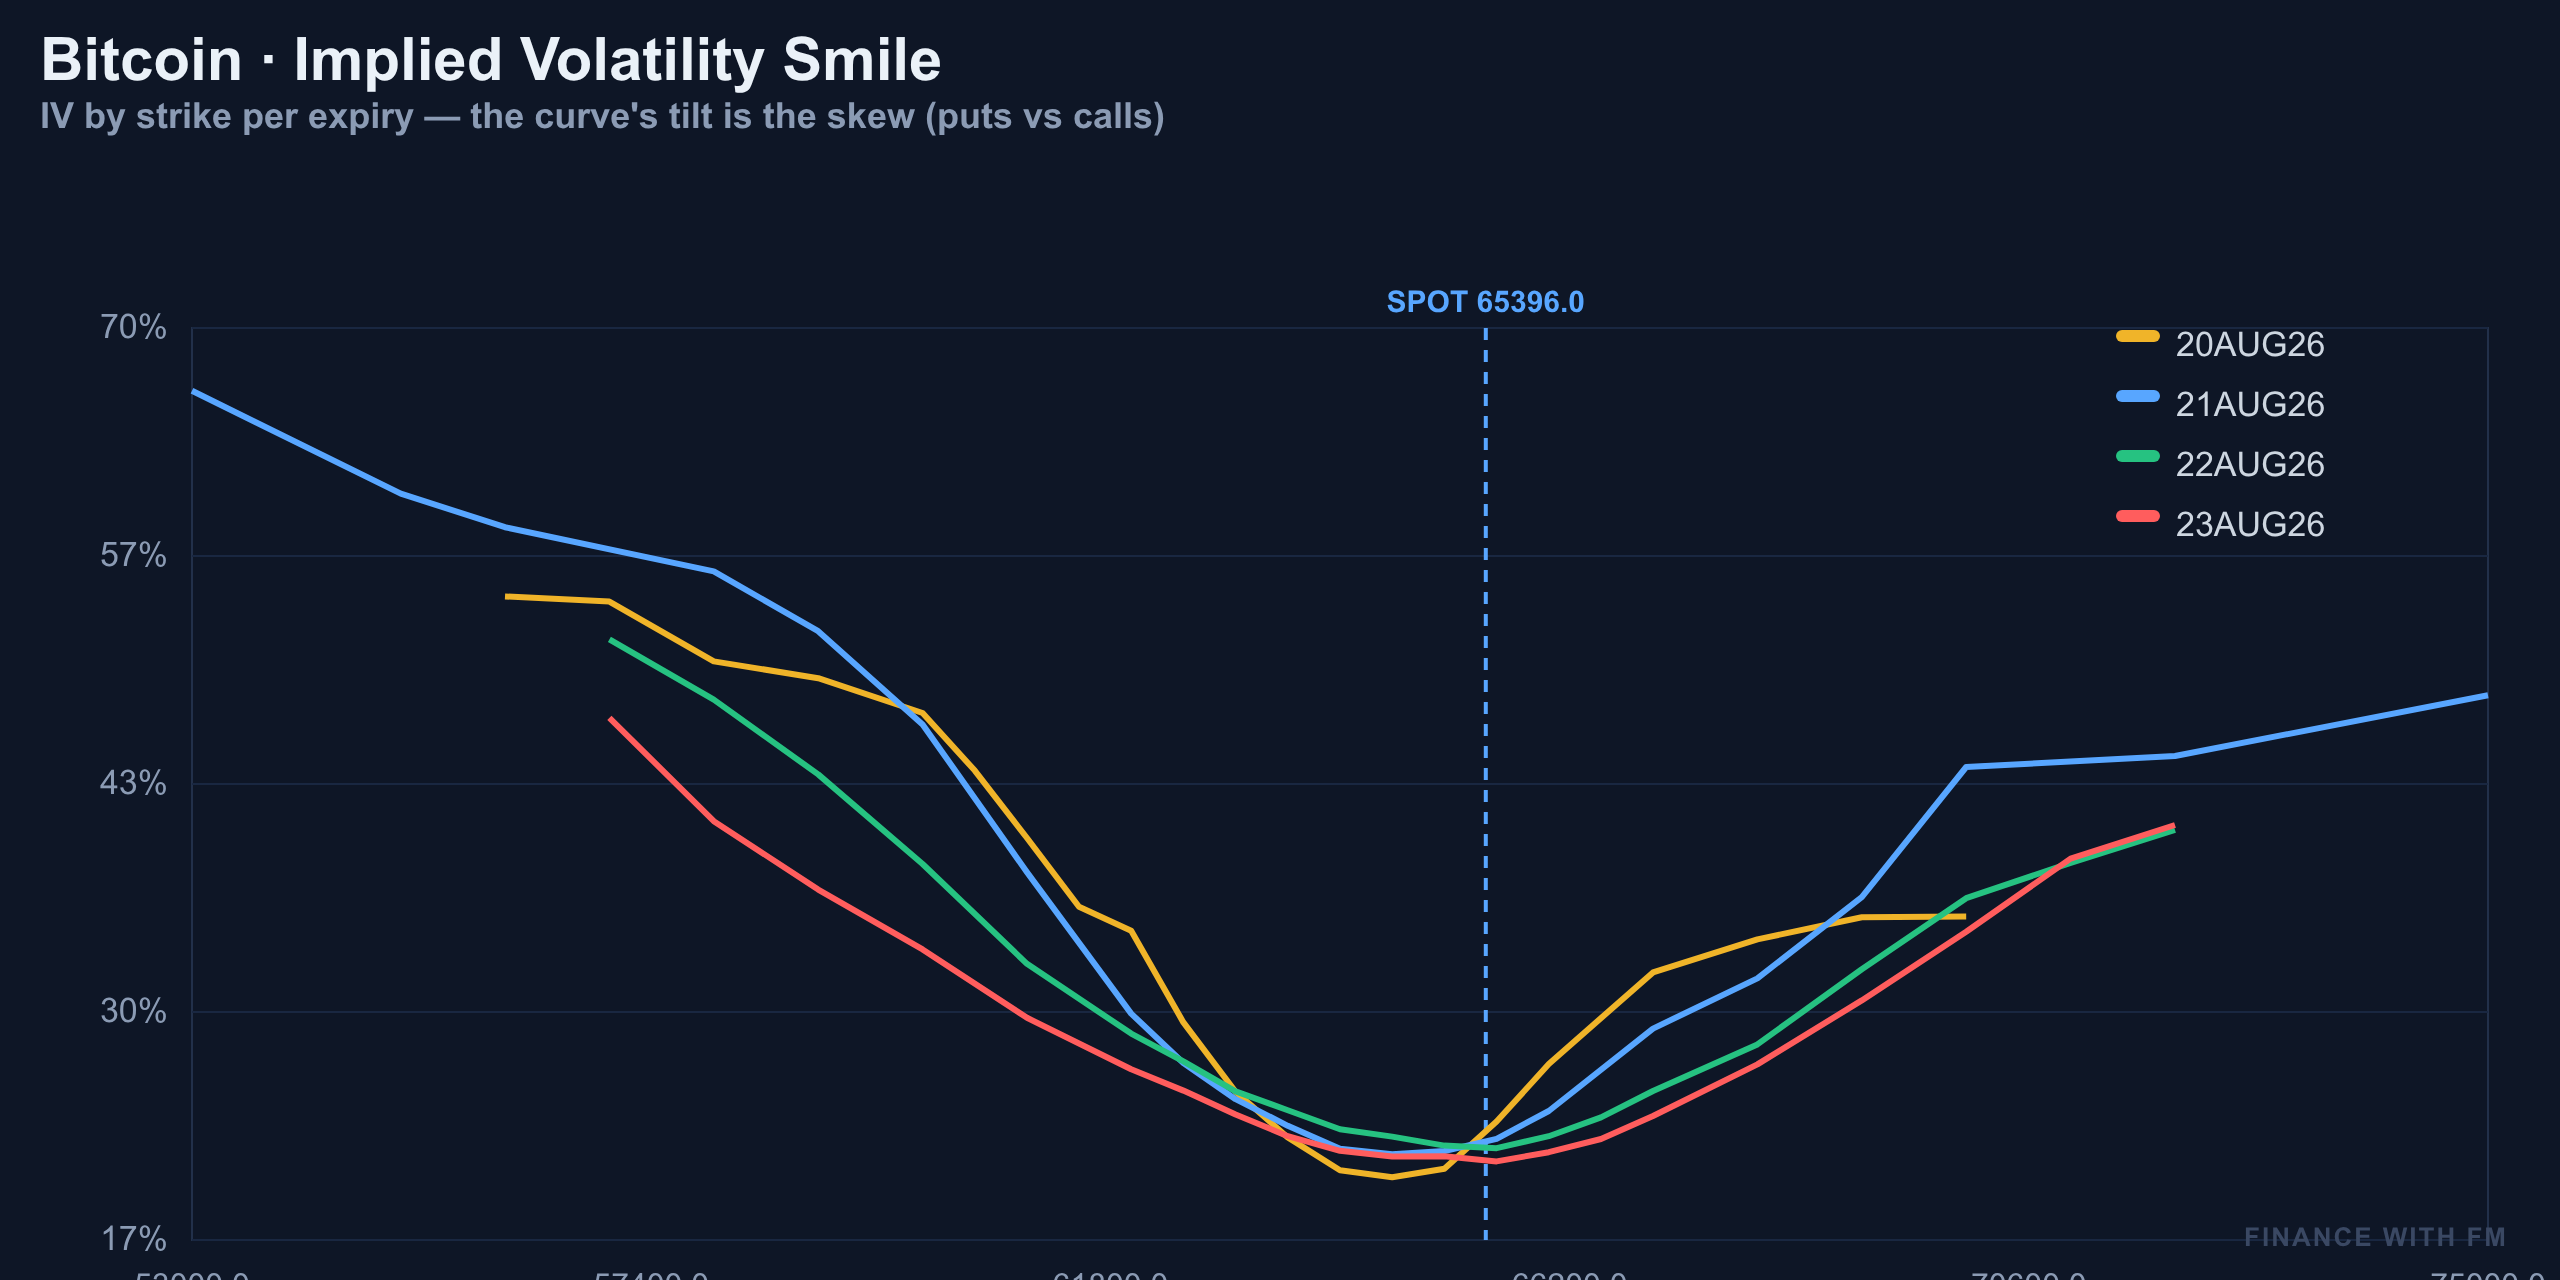
This isn't panic pricing. It's the signature of smart money hedging into an event rather than fleeing a trend. When the smile tilts this way while price stays flat, treat it as insurance-buying, not a directional signal on its own.
The Probability Curve: A Hard Ceiling and a High-Odds Range
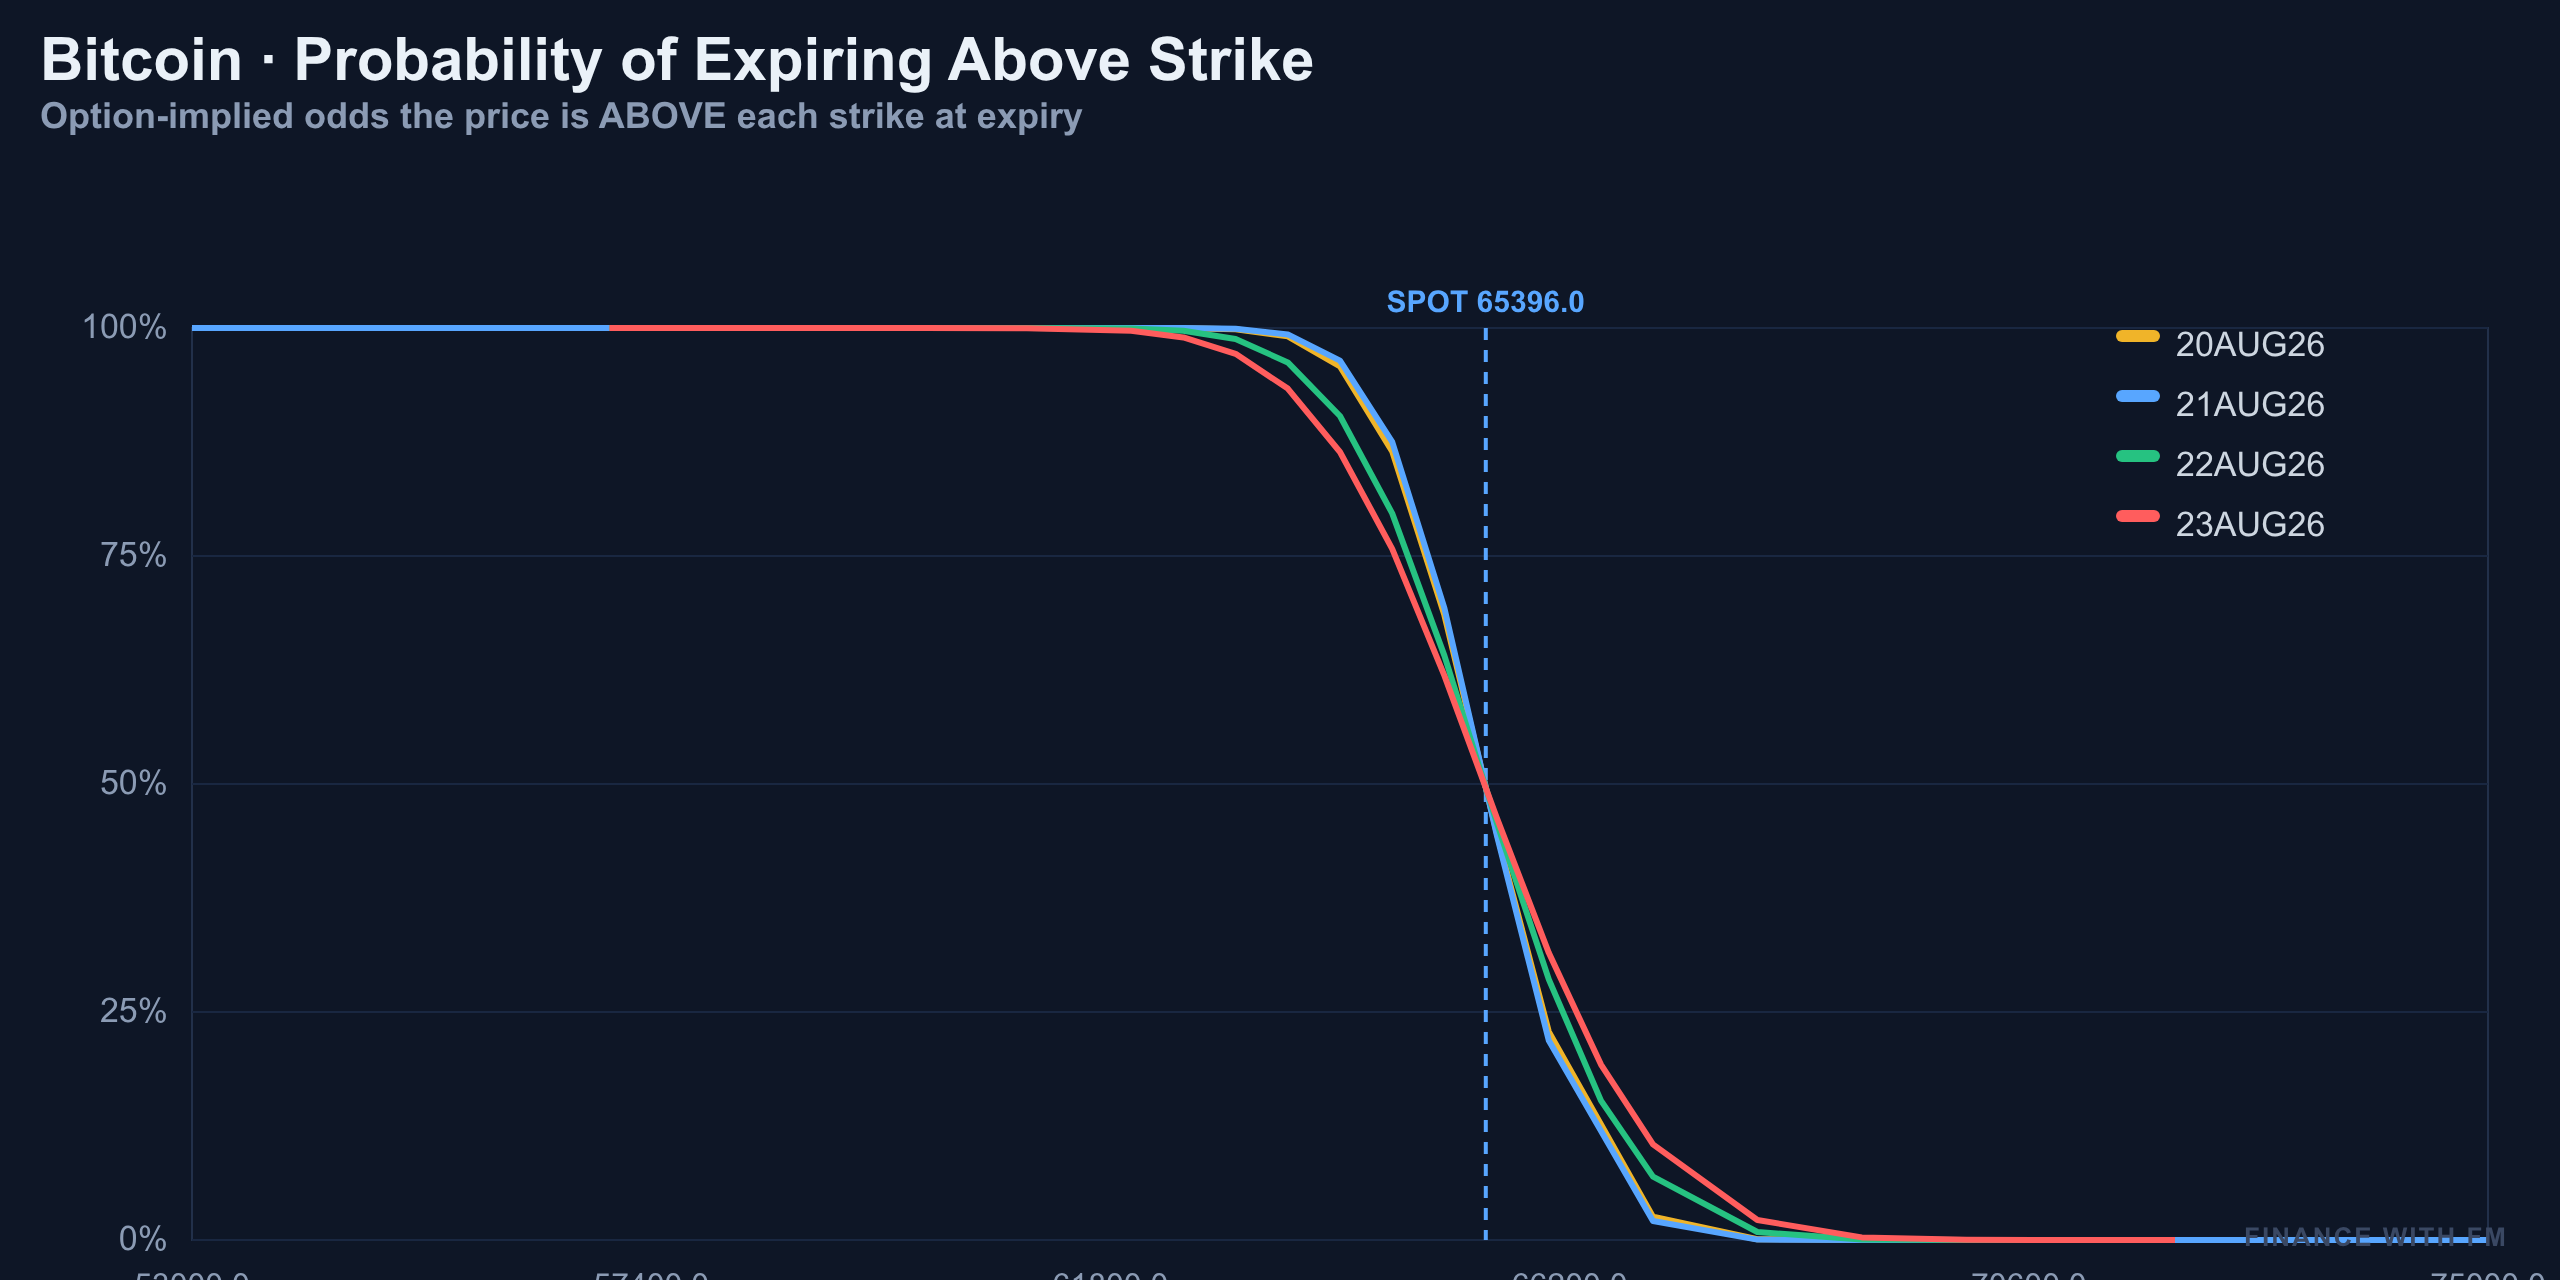
Zooming into the August 23 expiry, the options market is pricing essentially zero probability of Bitcoin trading above $72,000 by then — a hard ceiling in the market's own pricing. Nearer term, with spot around $64,300–$64,700, the high-probability bet is holding inside the expected two-day range.
Whales Are Positioning for Later, Not for Today
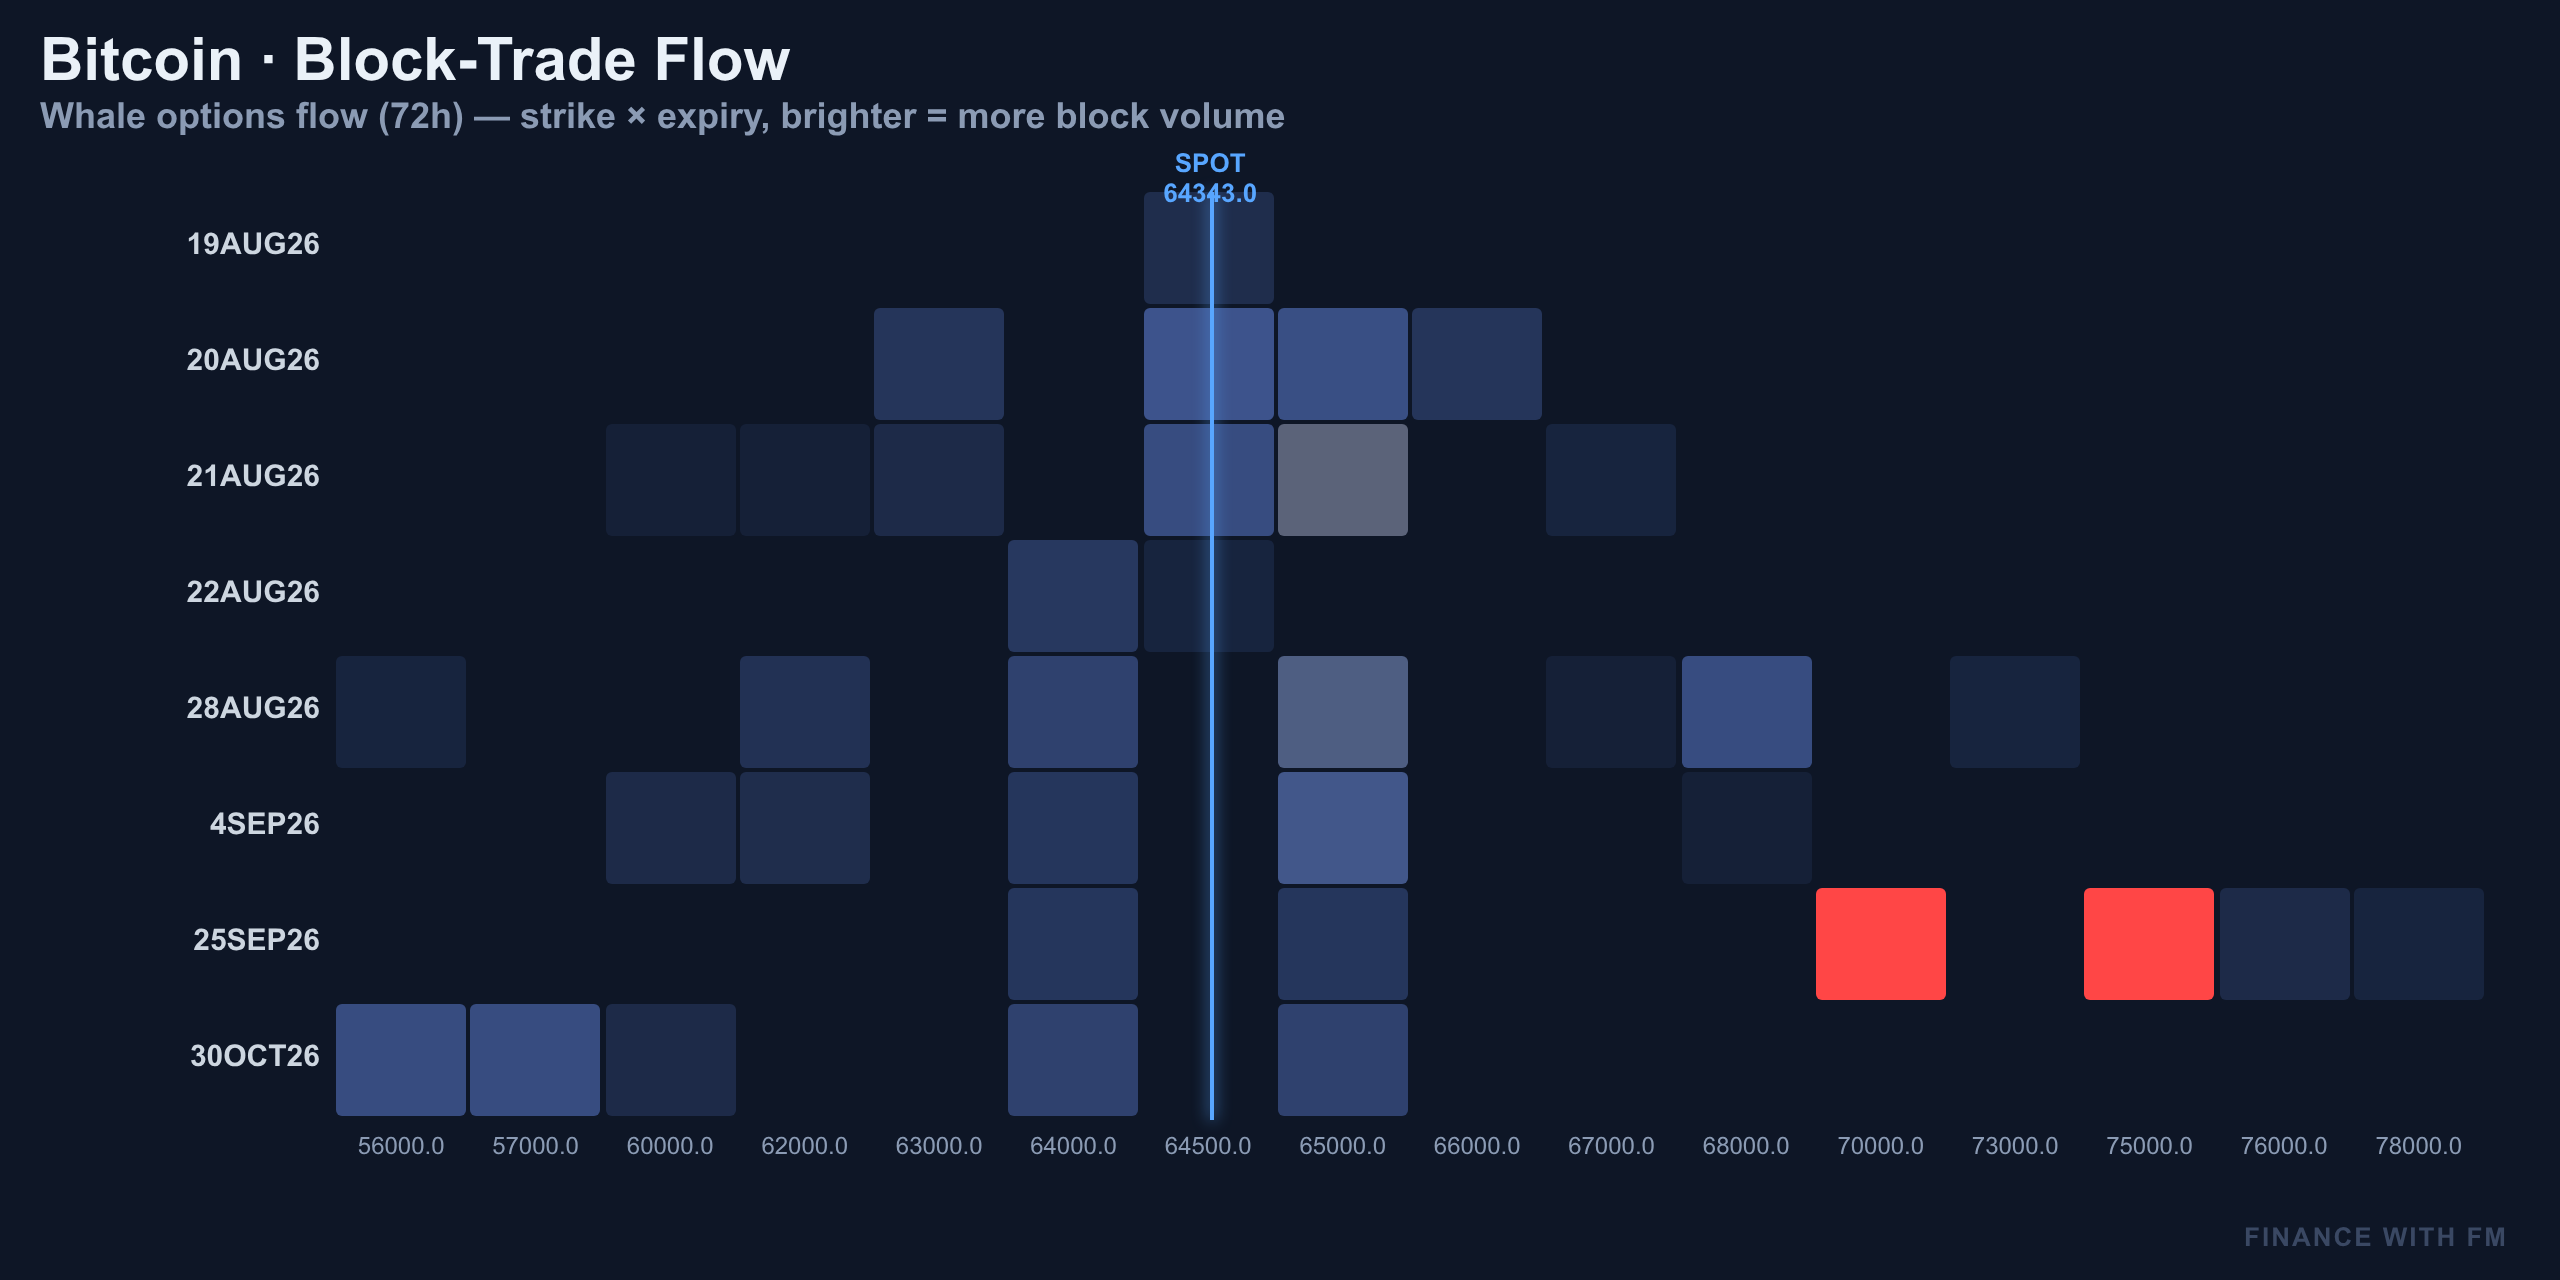
Block flow over the last 72 hours tells a longer-dated story. Whales are stacking size at $40,000 and $110,000 on the March 2027 expiry, and $40,000 and $130,000 on June 2027 — roughly 550 contracts apiece. Net direction is clearly bullish: 2,026 calls bought versus 839 sold, and 1,496 puts bought versus 593 sold, favoring calls overall.
Full Options Board
| Metric | Reading |
|---|---|
| Implied Volatility (DVOL) | 34.7 |
| Realized Volatility | 19.2 |
| Vol-Risk-Premium | +15.5 |
| Put/Call Ratio (Open Interest) | 0.56 |
| Put/Call Ratio (Volume) | 0.67 |
| 25-Delta Skew | +13.9% |
| Max Pain | $64,000 |
| Call Wall | $70,000 |
| Put Wall | $60,000 |
Price Action: Coiled, Not Committed
Bitcoin is trading around $64,300–$64,700 right now depending on the feed, essentially flat to slightly higher on the day. Momentum is neutral, volatility is being suppressed by dealer positioning, and price remains sandwiched between the 50-day and 200-day moving averages. This is a market in balance, not in a trend.
15-Minute Chart: Spike, Fade, Chop
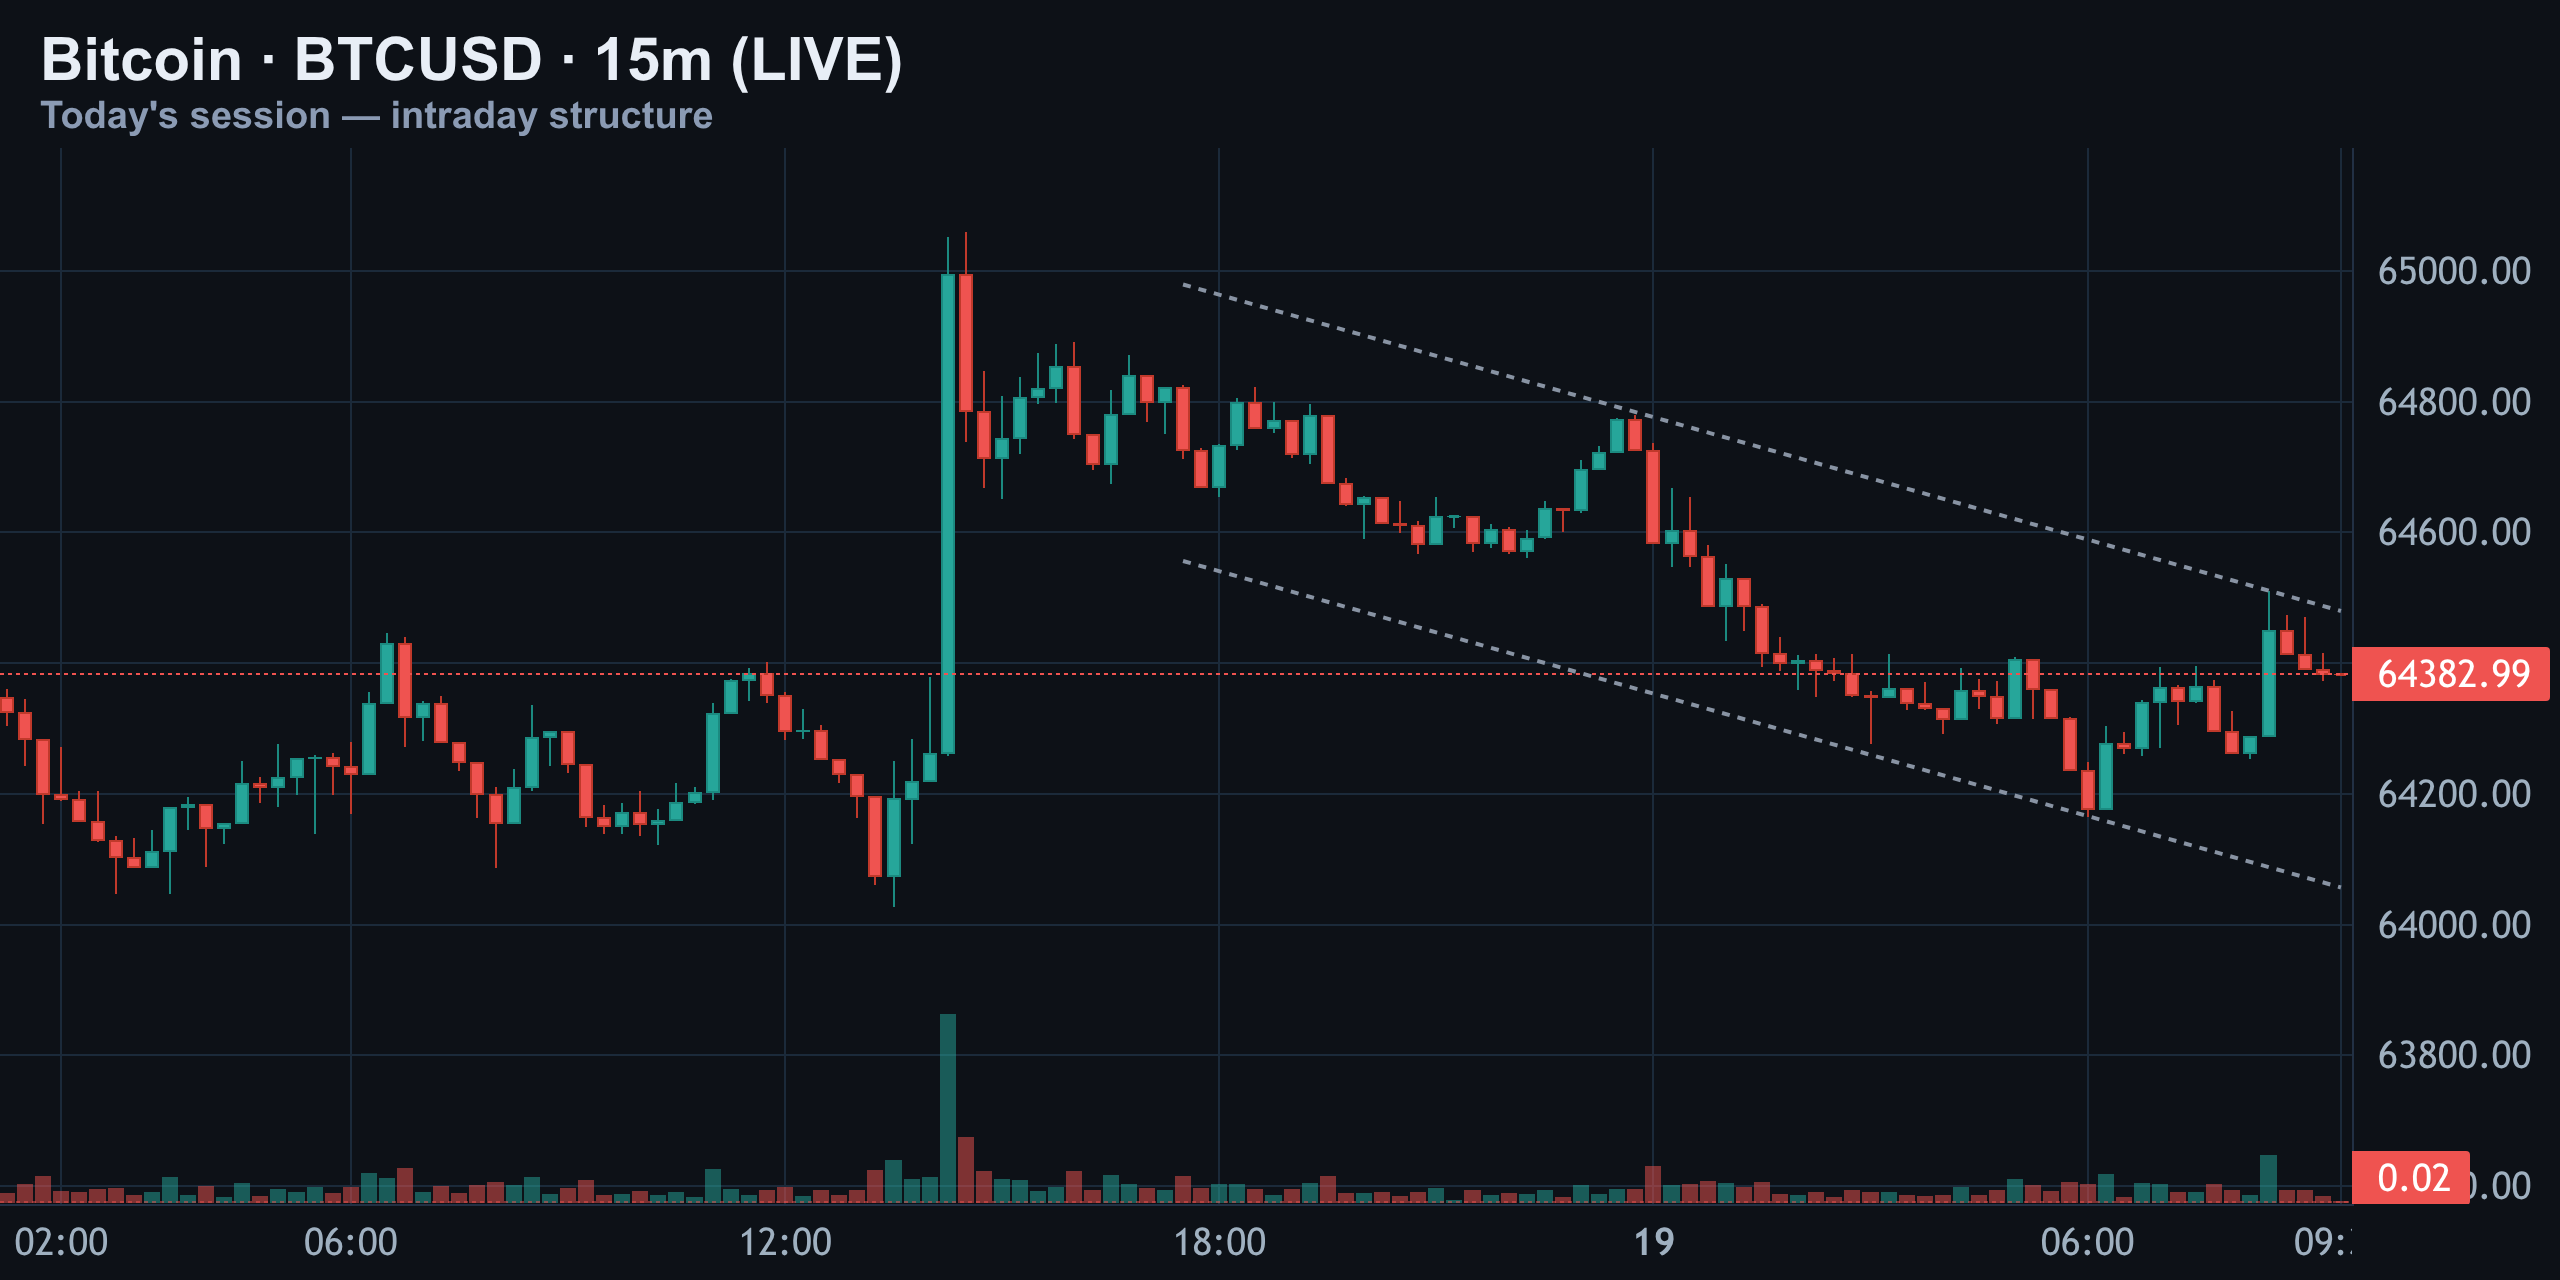
On the 15-minute timeframe, Bitcoin spiked to almost $65,000 on a volume pop, then immediately faded into a descending channel that's held for most of the session. Price is now sitting right on the $64,383 line, which has acted like a magnet for hours. Classic pin-action — sharp move, quick fade, then chop. No breakout yet in either direction.
4-Hour Chart: A Lower High Inside the Same Range
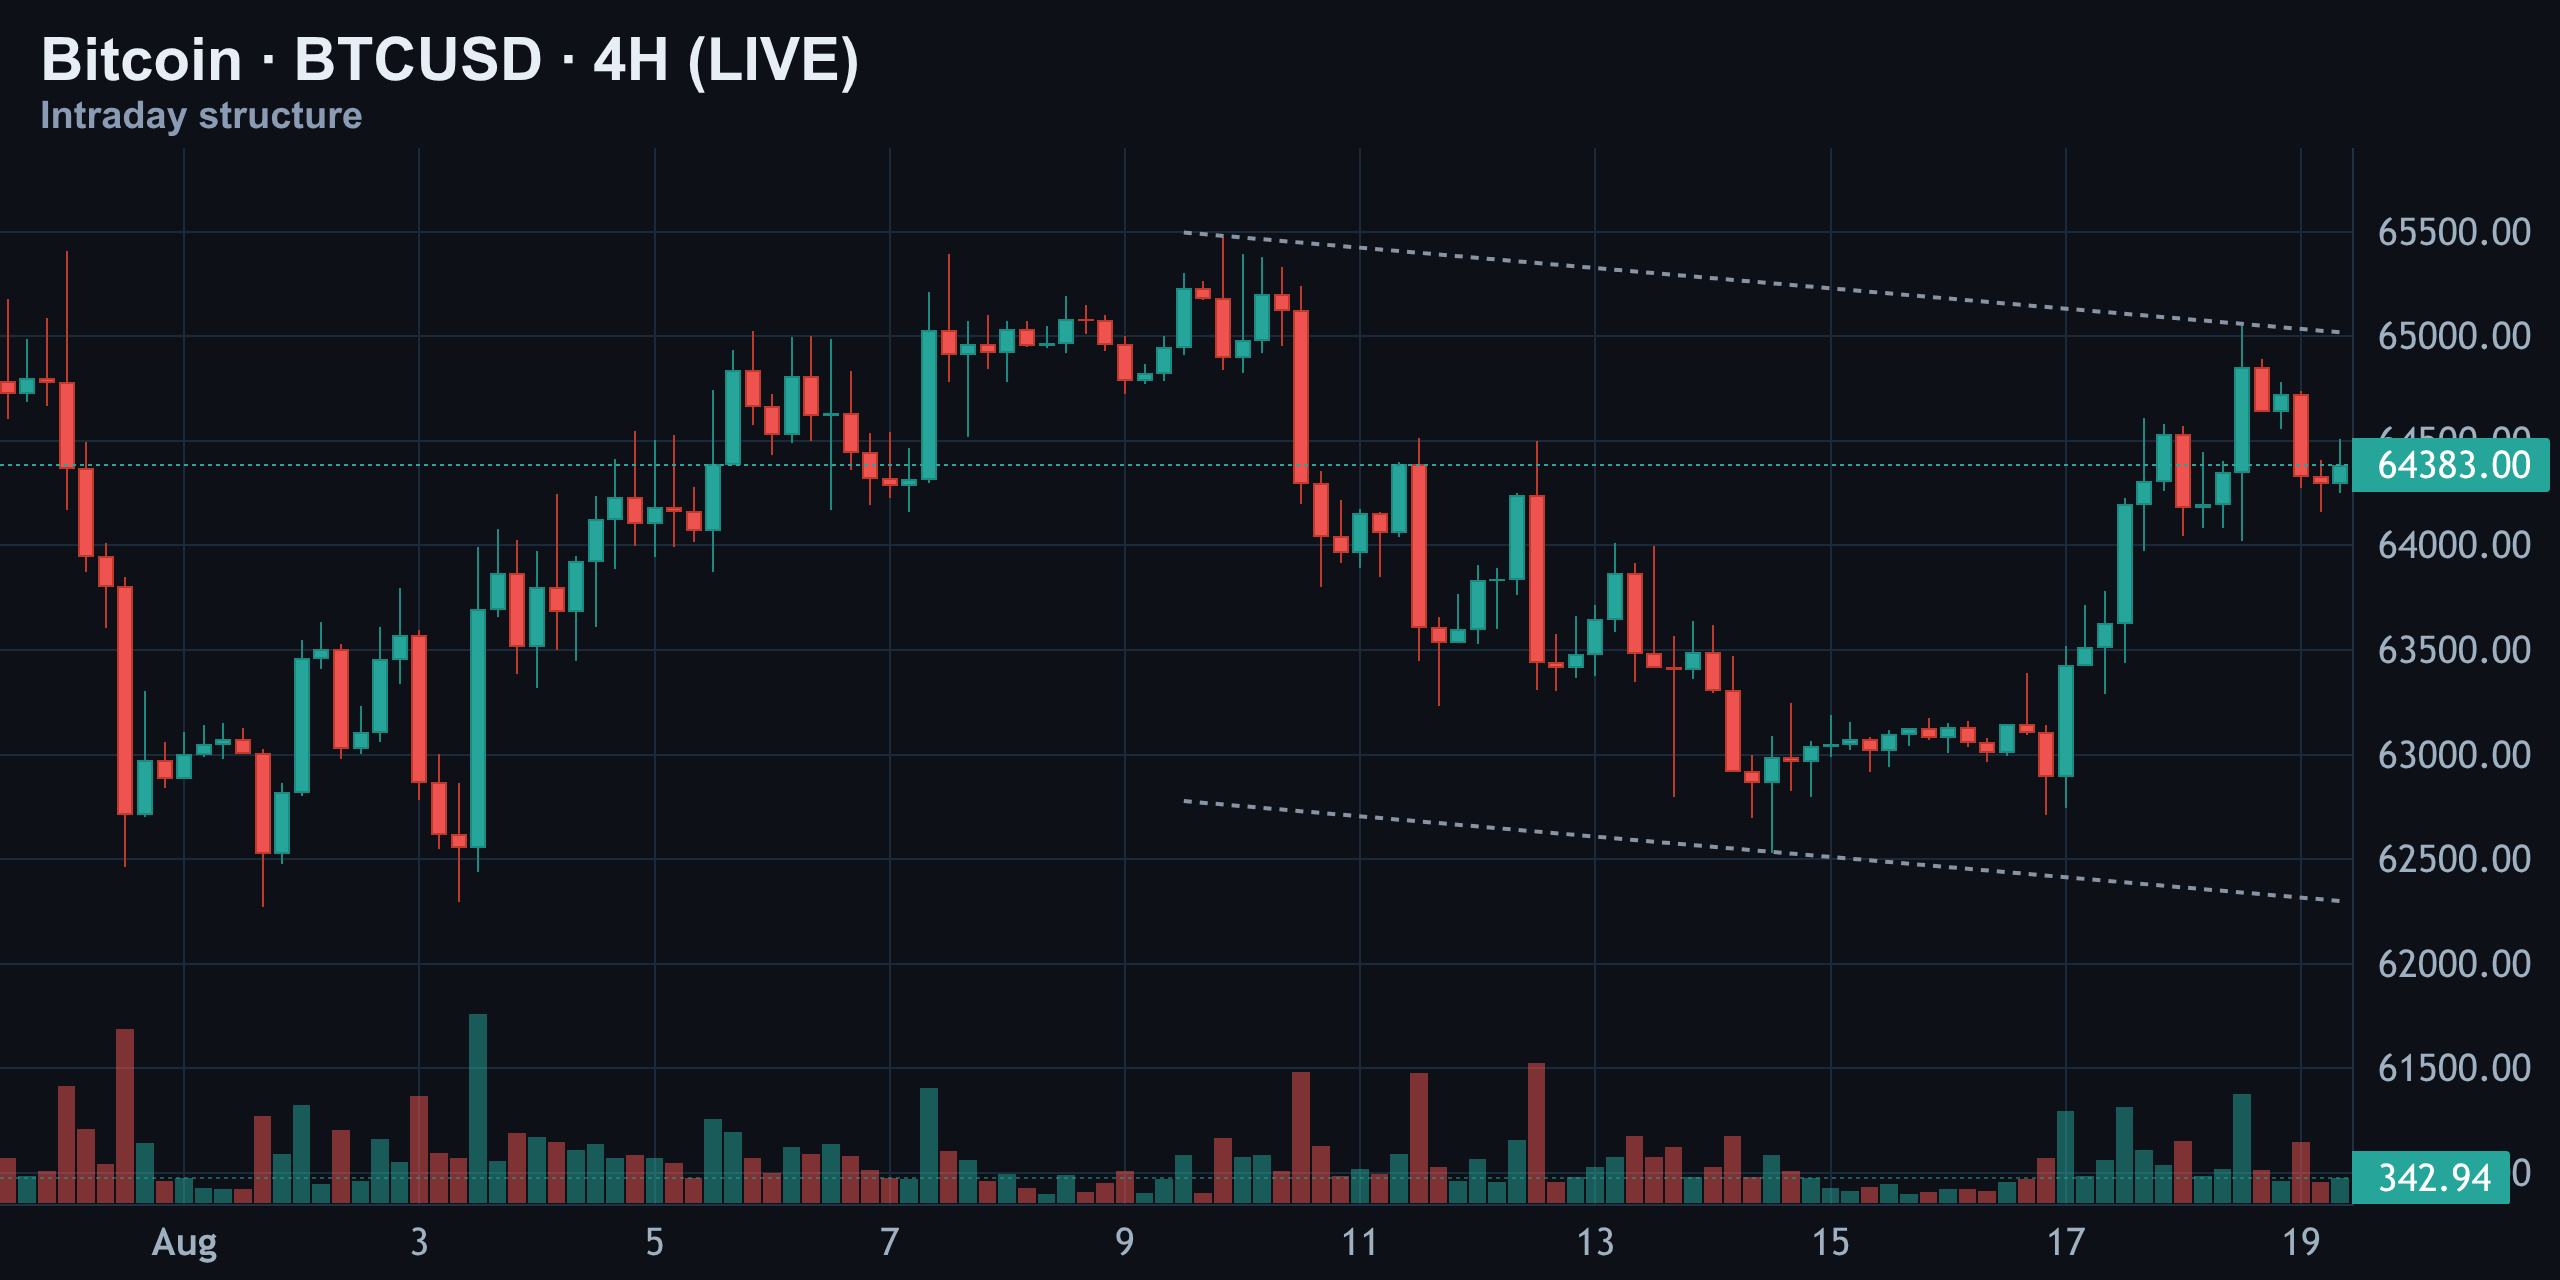
The bigger picture on the four-hour chart is a slow grind higher inside a rising channel — but every rally since August 10 has been capped by a descending trendline near $65,500. Price just tagged that upper resistance zone and pulled back, printing a lower high inside the same broader range.
Daily Chart: Stuck Between the Extremes
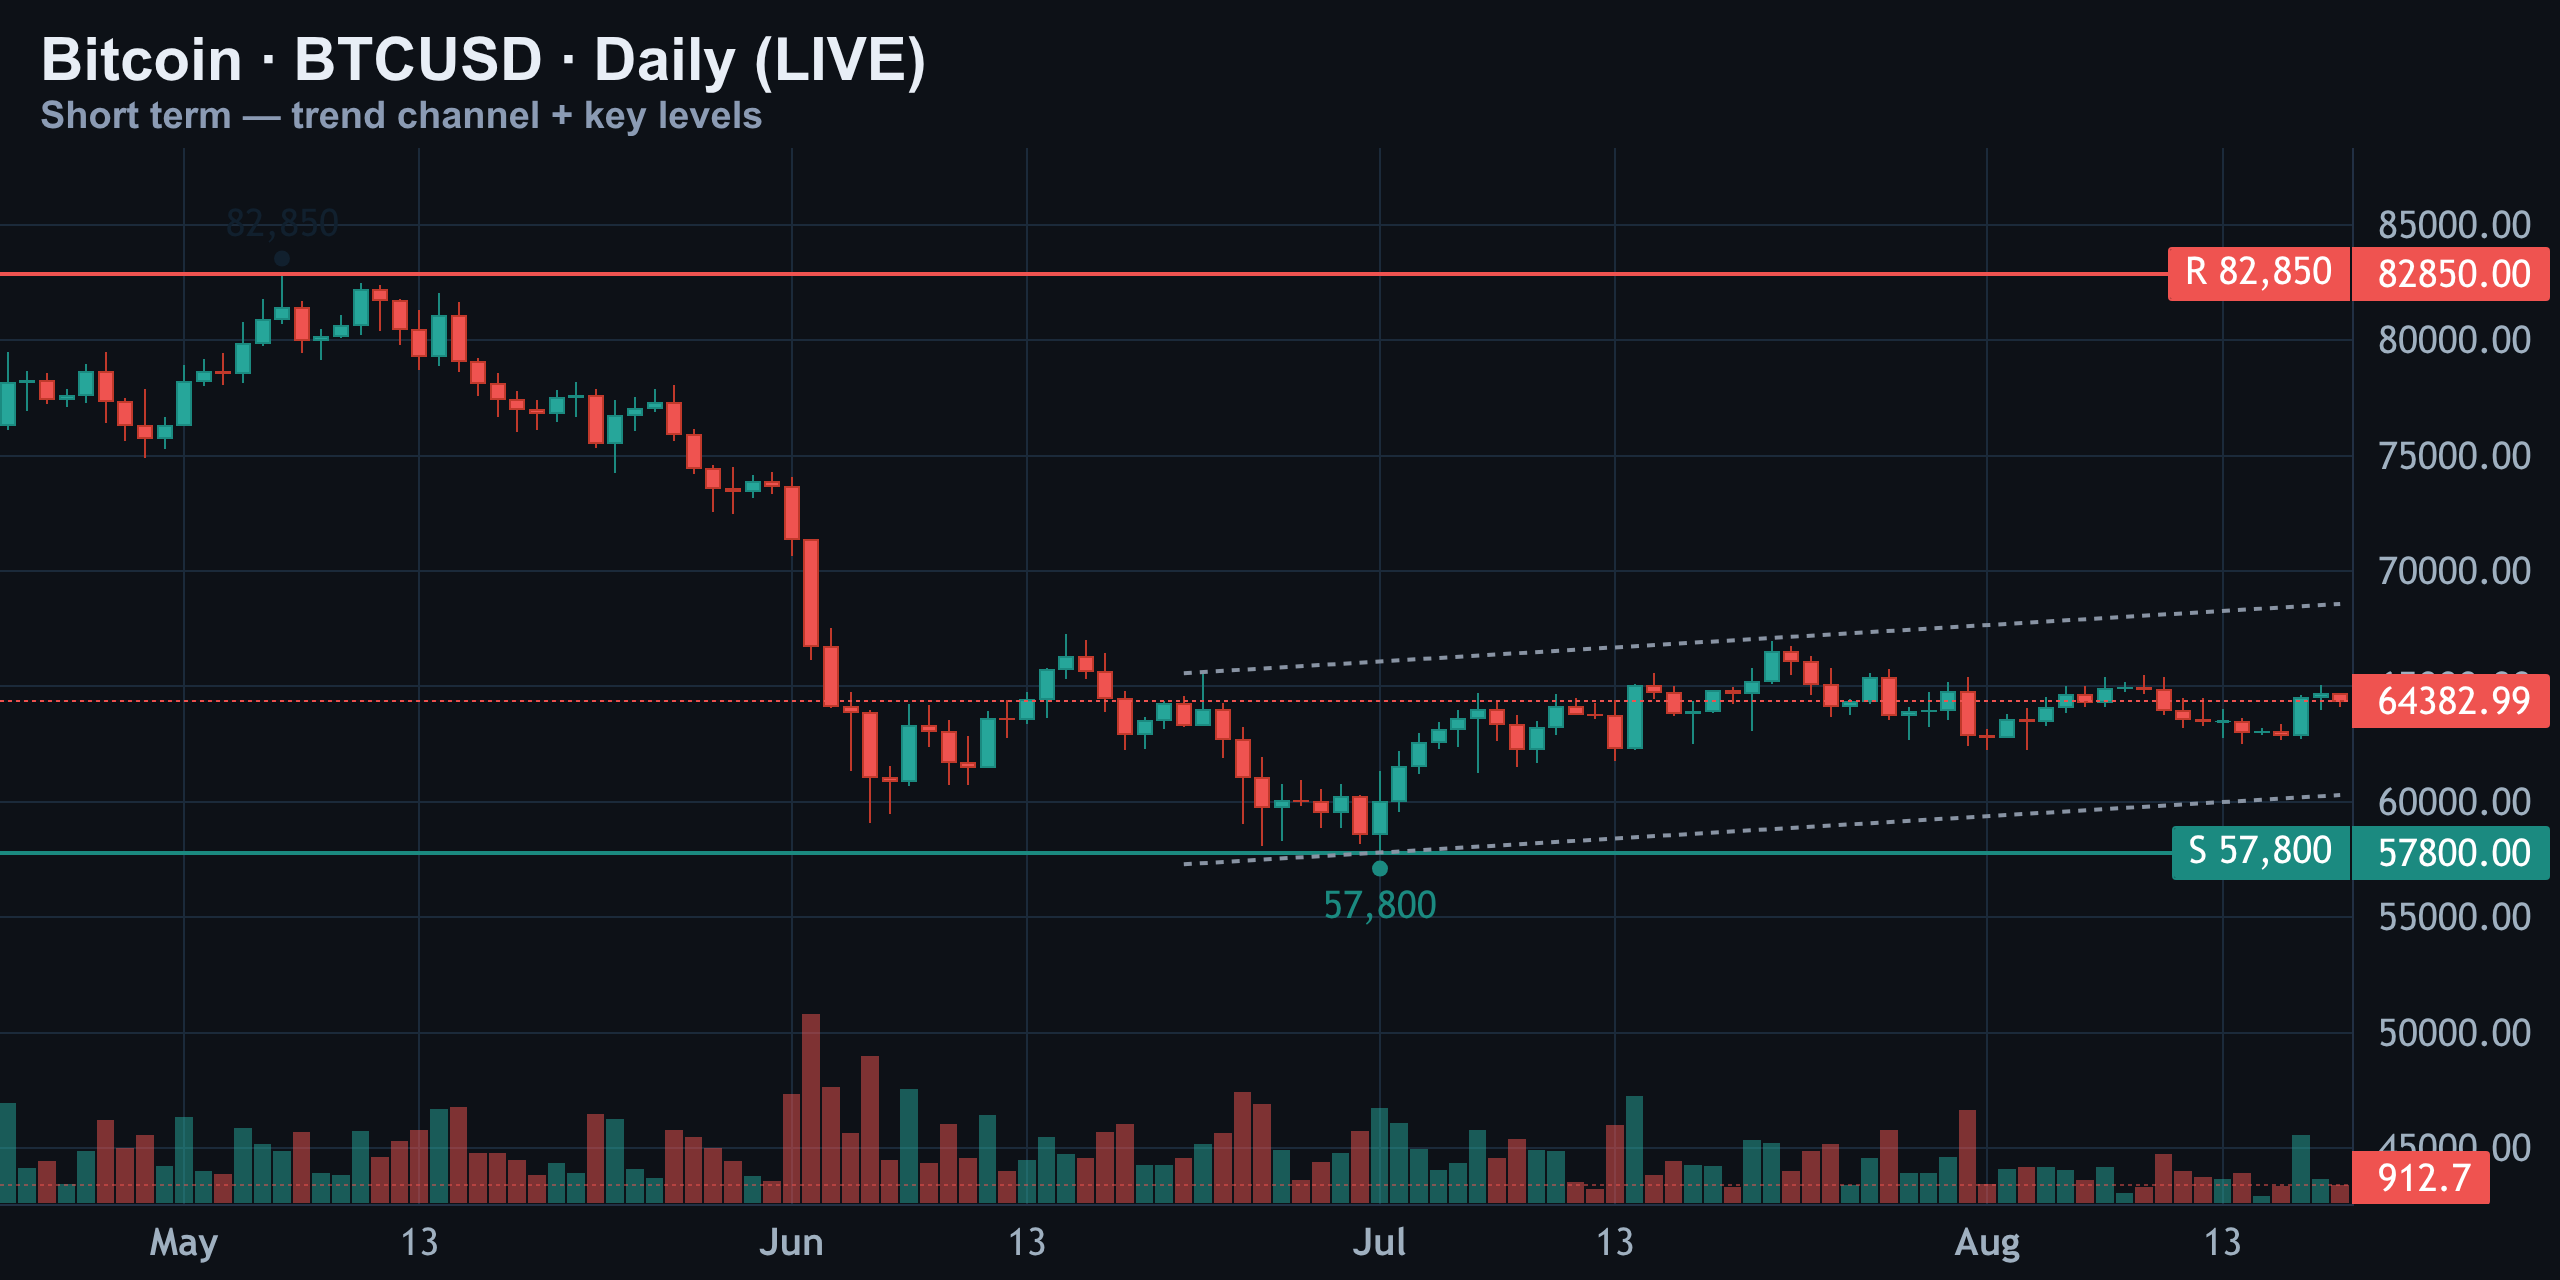
Zoomed out to the daily, Bitcoin is trading between two major moving averages that have flattened out and converged near current price — neither bulls nor bears have control of the tape. That squeeze is exactly why nothing decisive has happened for days.
Momentum and Liquidations: Neutral on the Surface, Loaded Underneath
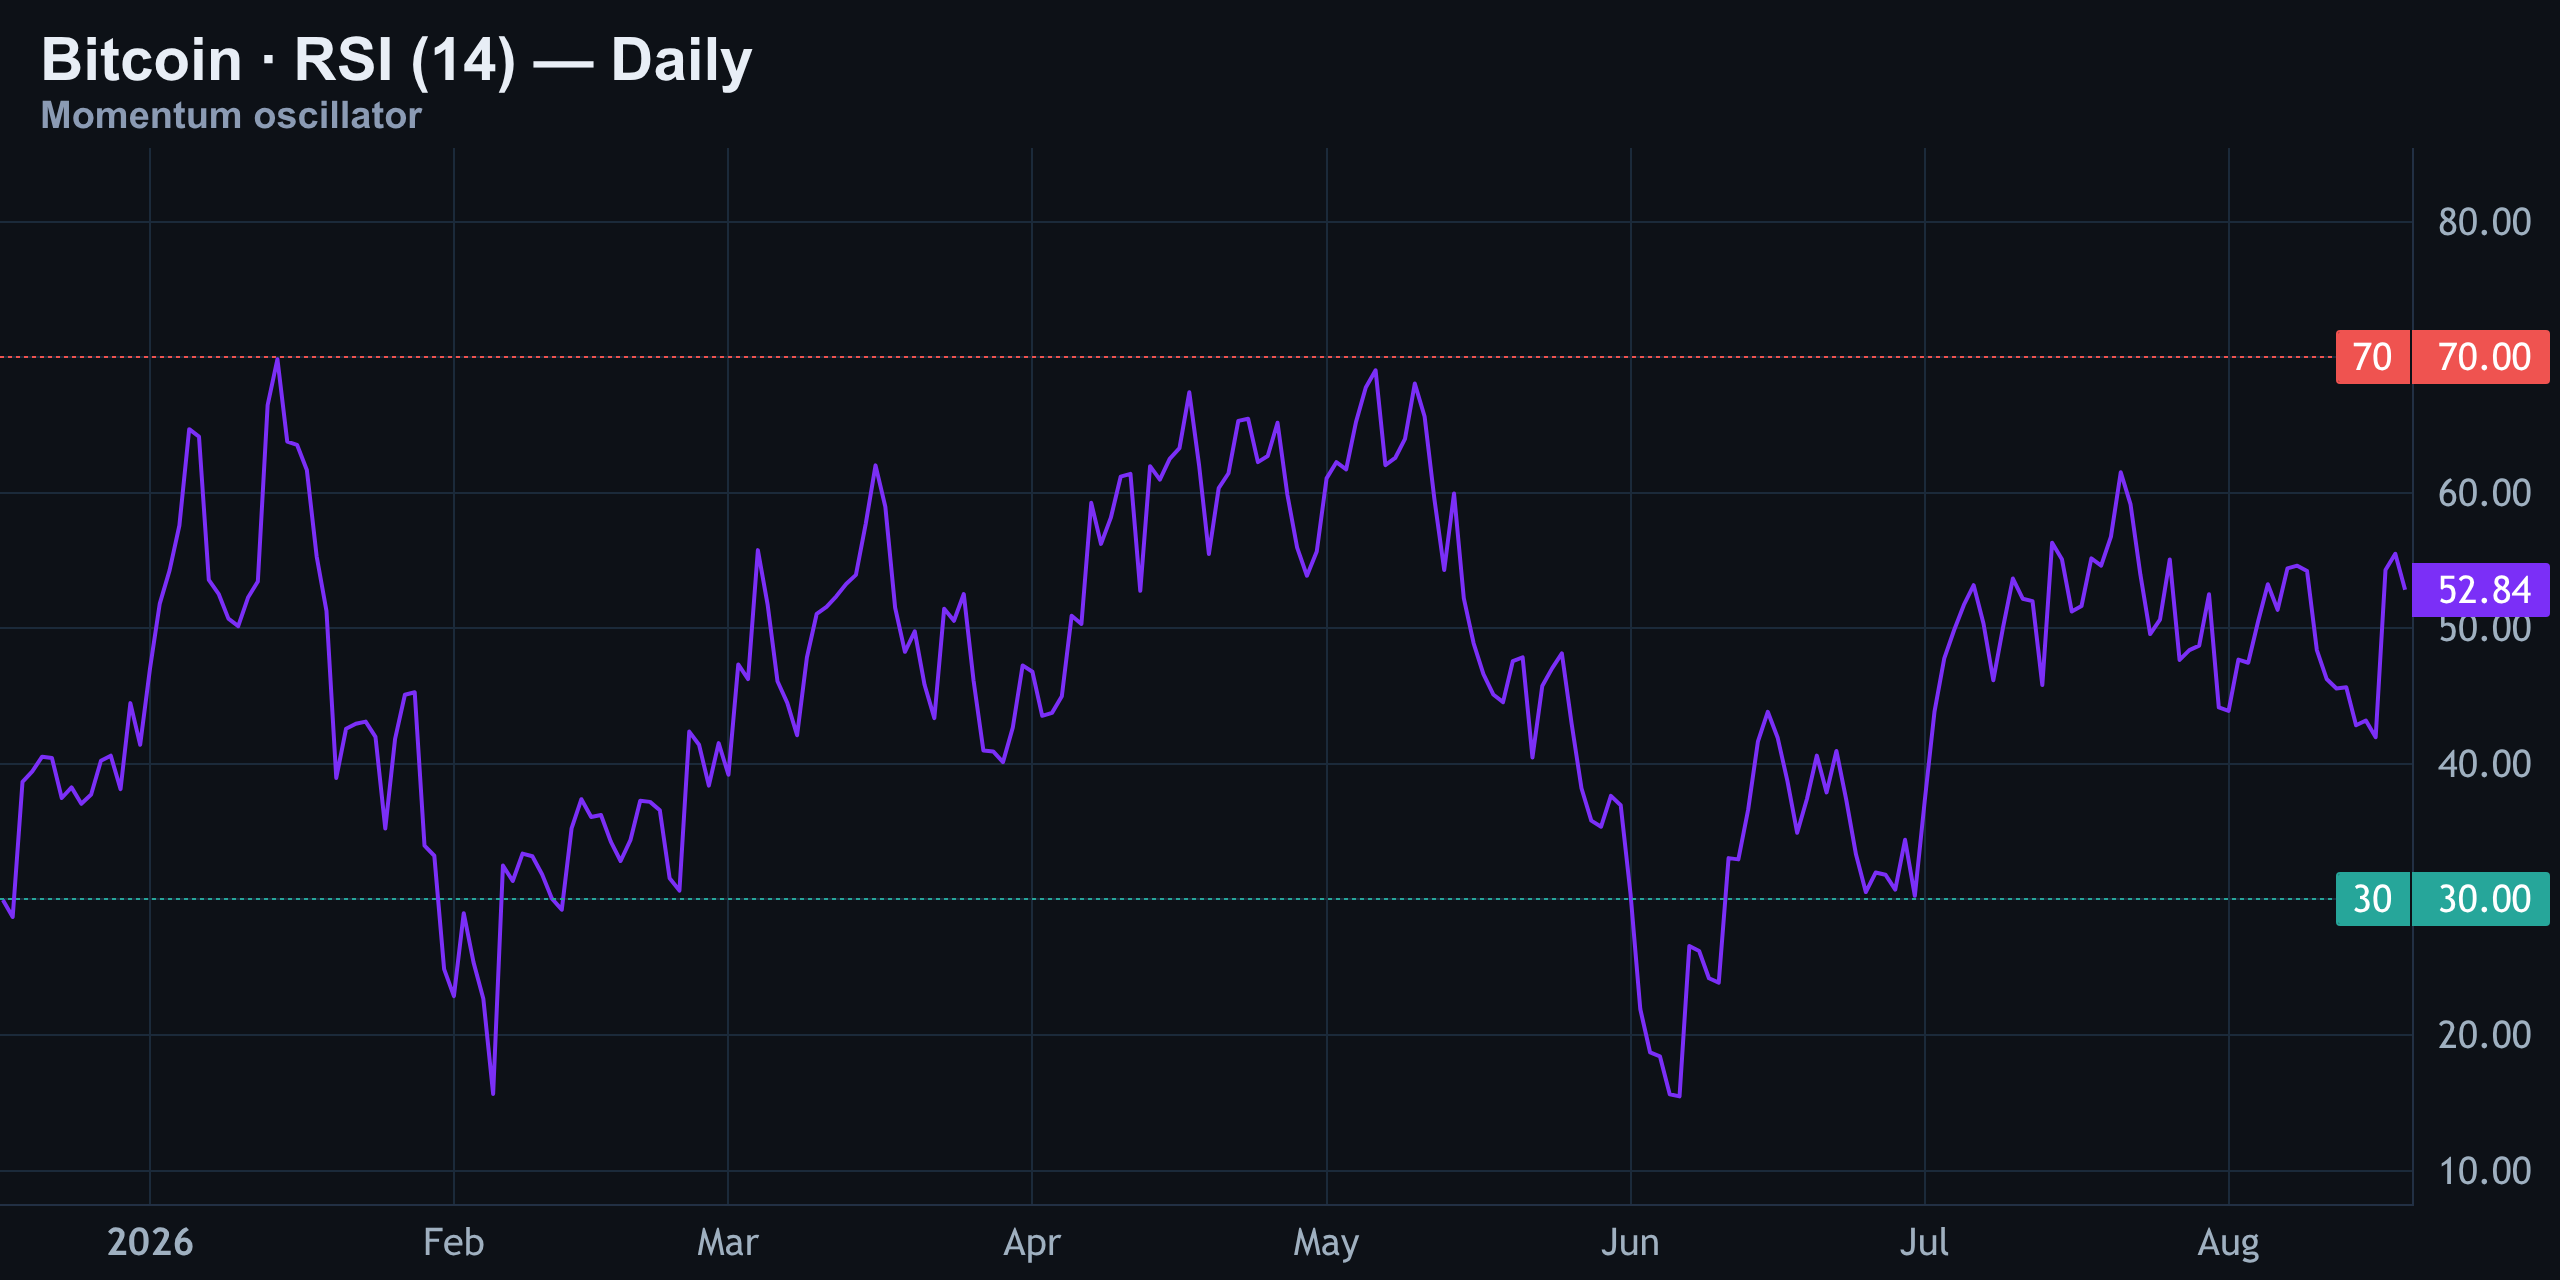
RSI (14) is sitting dead-center neutral, offering no directional edge on its own — it's neither overbought nor oversold, just parked in the middle of its range.
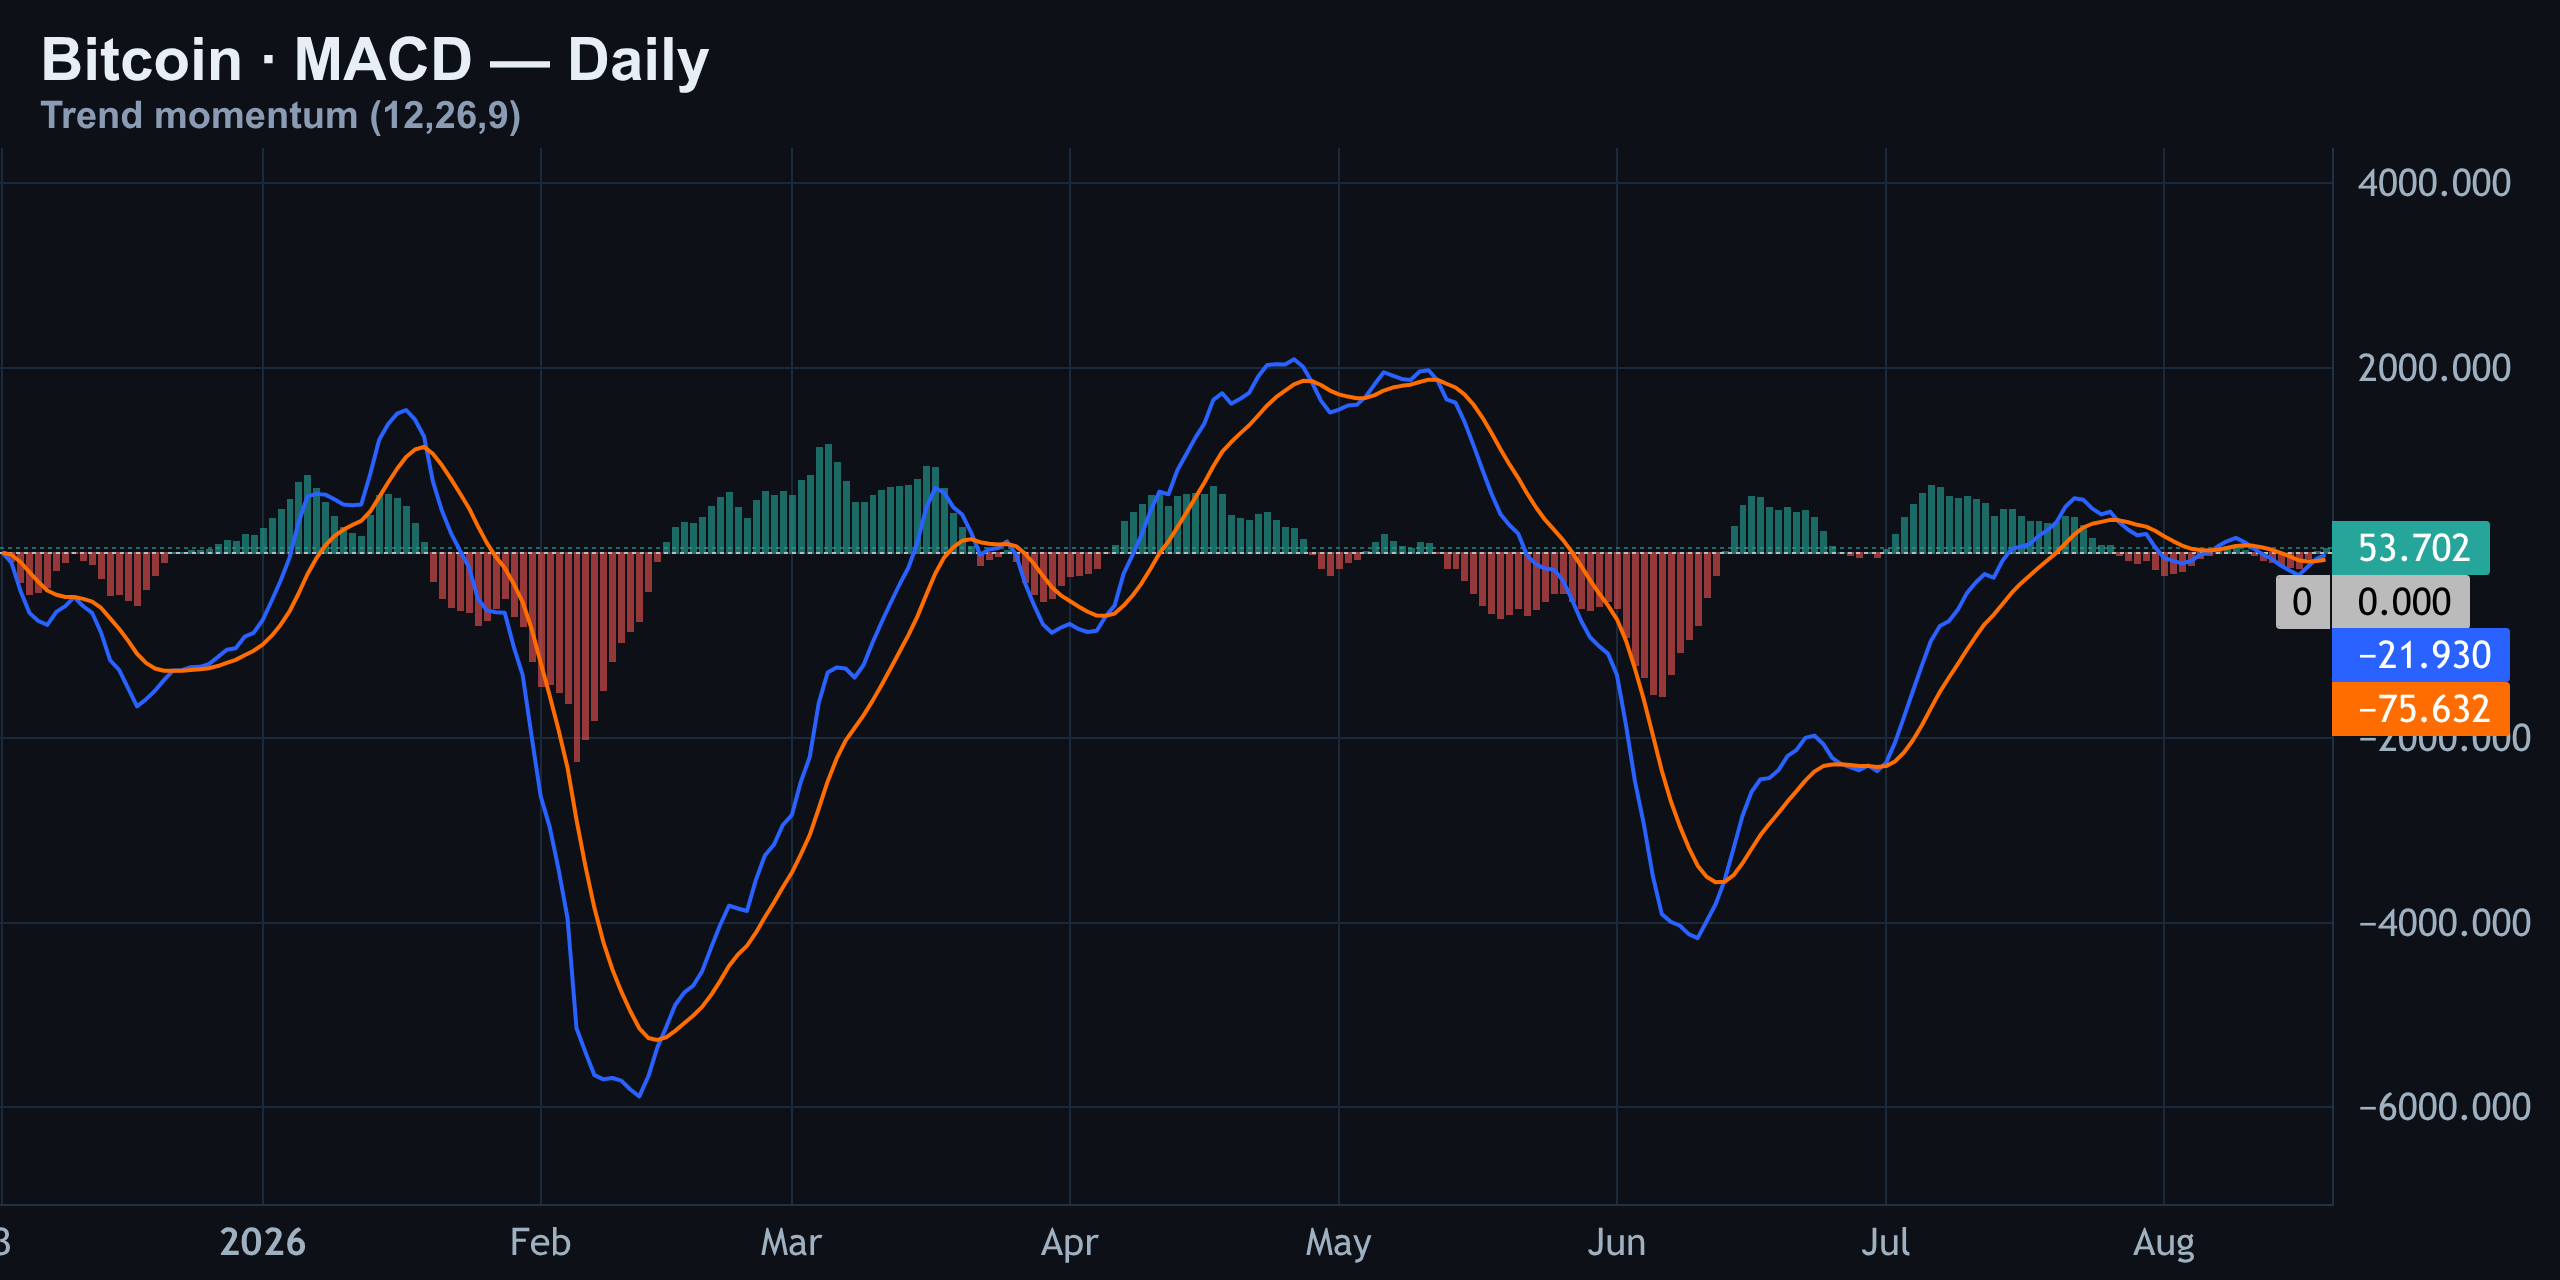
MACD is still quietly positive, but the histogram is losing steam, meaning the mild uptrend that's carried price off recent lows is running out of energy rather than accelerating.
The Liquidation Sandwich
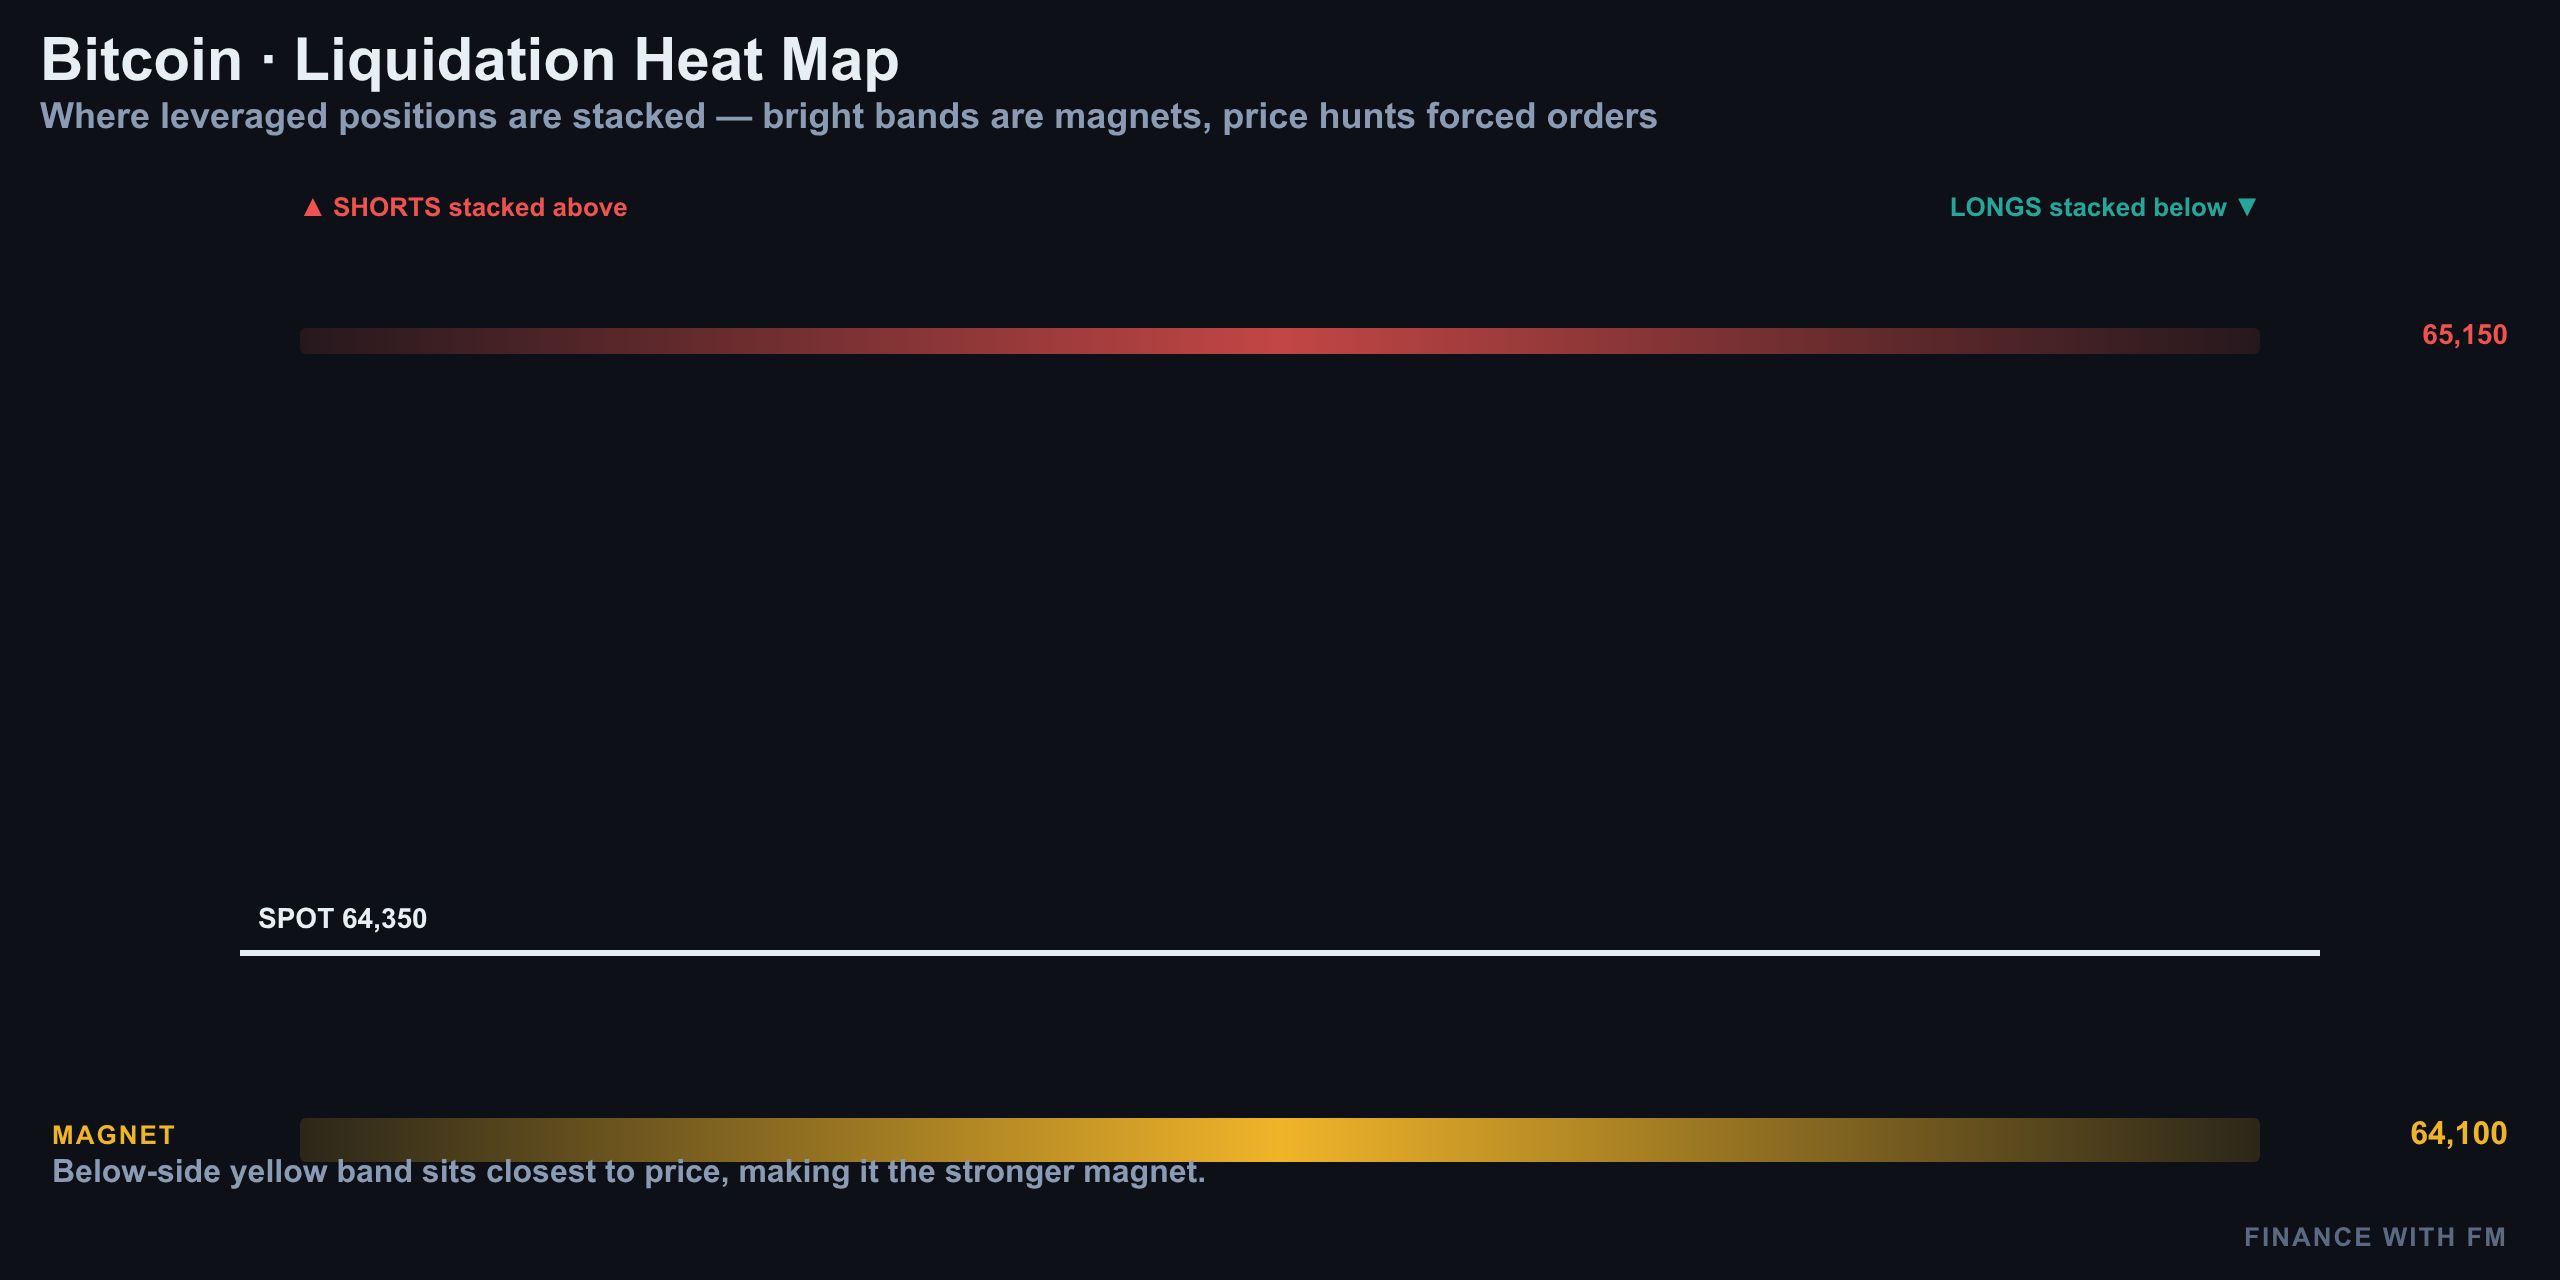
The liquidation heatmap shows leveraged positions stacked on both sides of spot — a classic sandwich formation. That means a sharp move in either direction risks a fast cascade, because there's fuel for a squeeze whether price breaks up through $65,500 or down through the low-$63,000s.
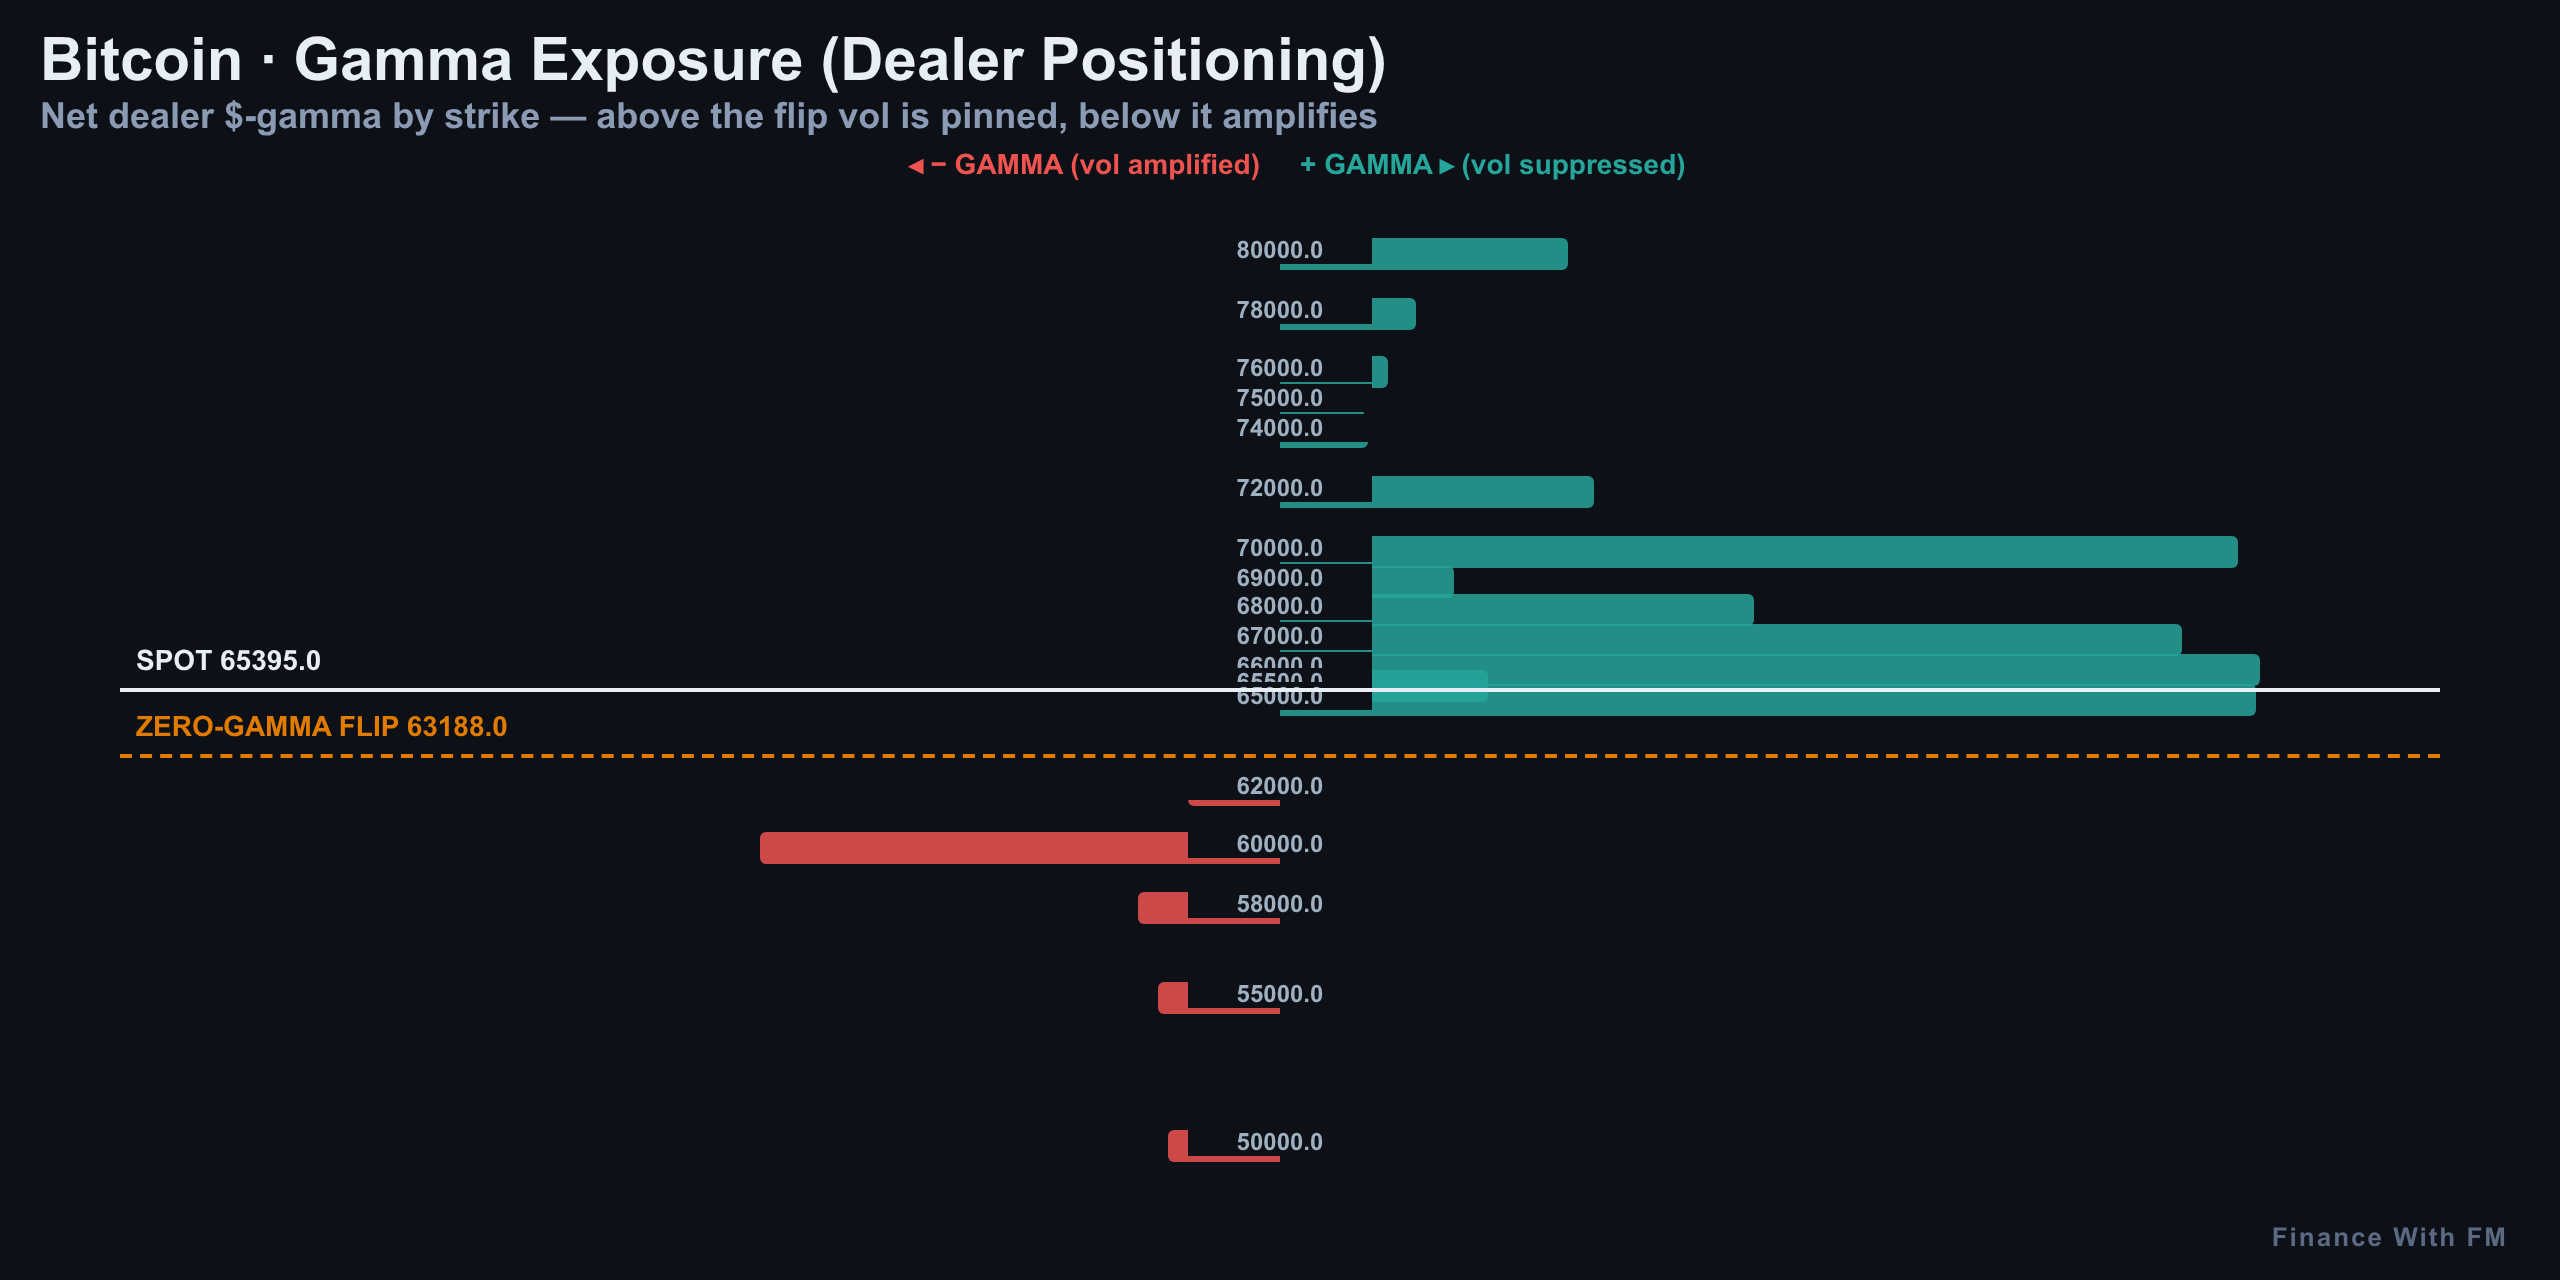
Gamma Exposure and the Expected Move: The One Level That Decides Tomorrow
Dealers are sitting in positive gamma right now, which mechanically means they're buying dips and selling rips to stay hedged — the exact reason price keeps getting pinned inside a tight band instead of trending. Positive gamma is a volatility-suppressing force, and it's the biggest reason today feels calm even with a hedging skew underneath.
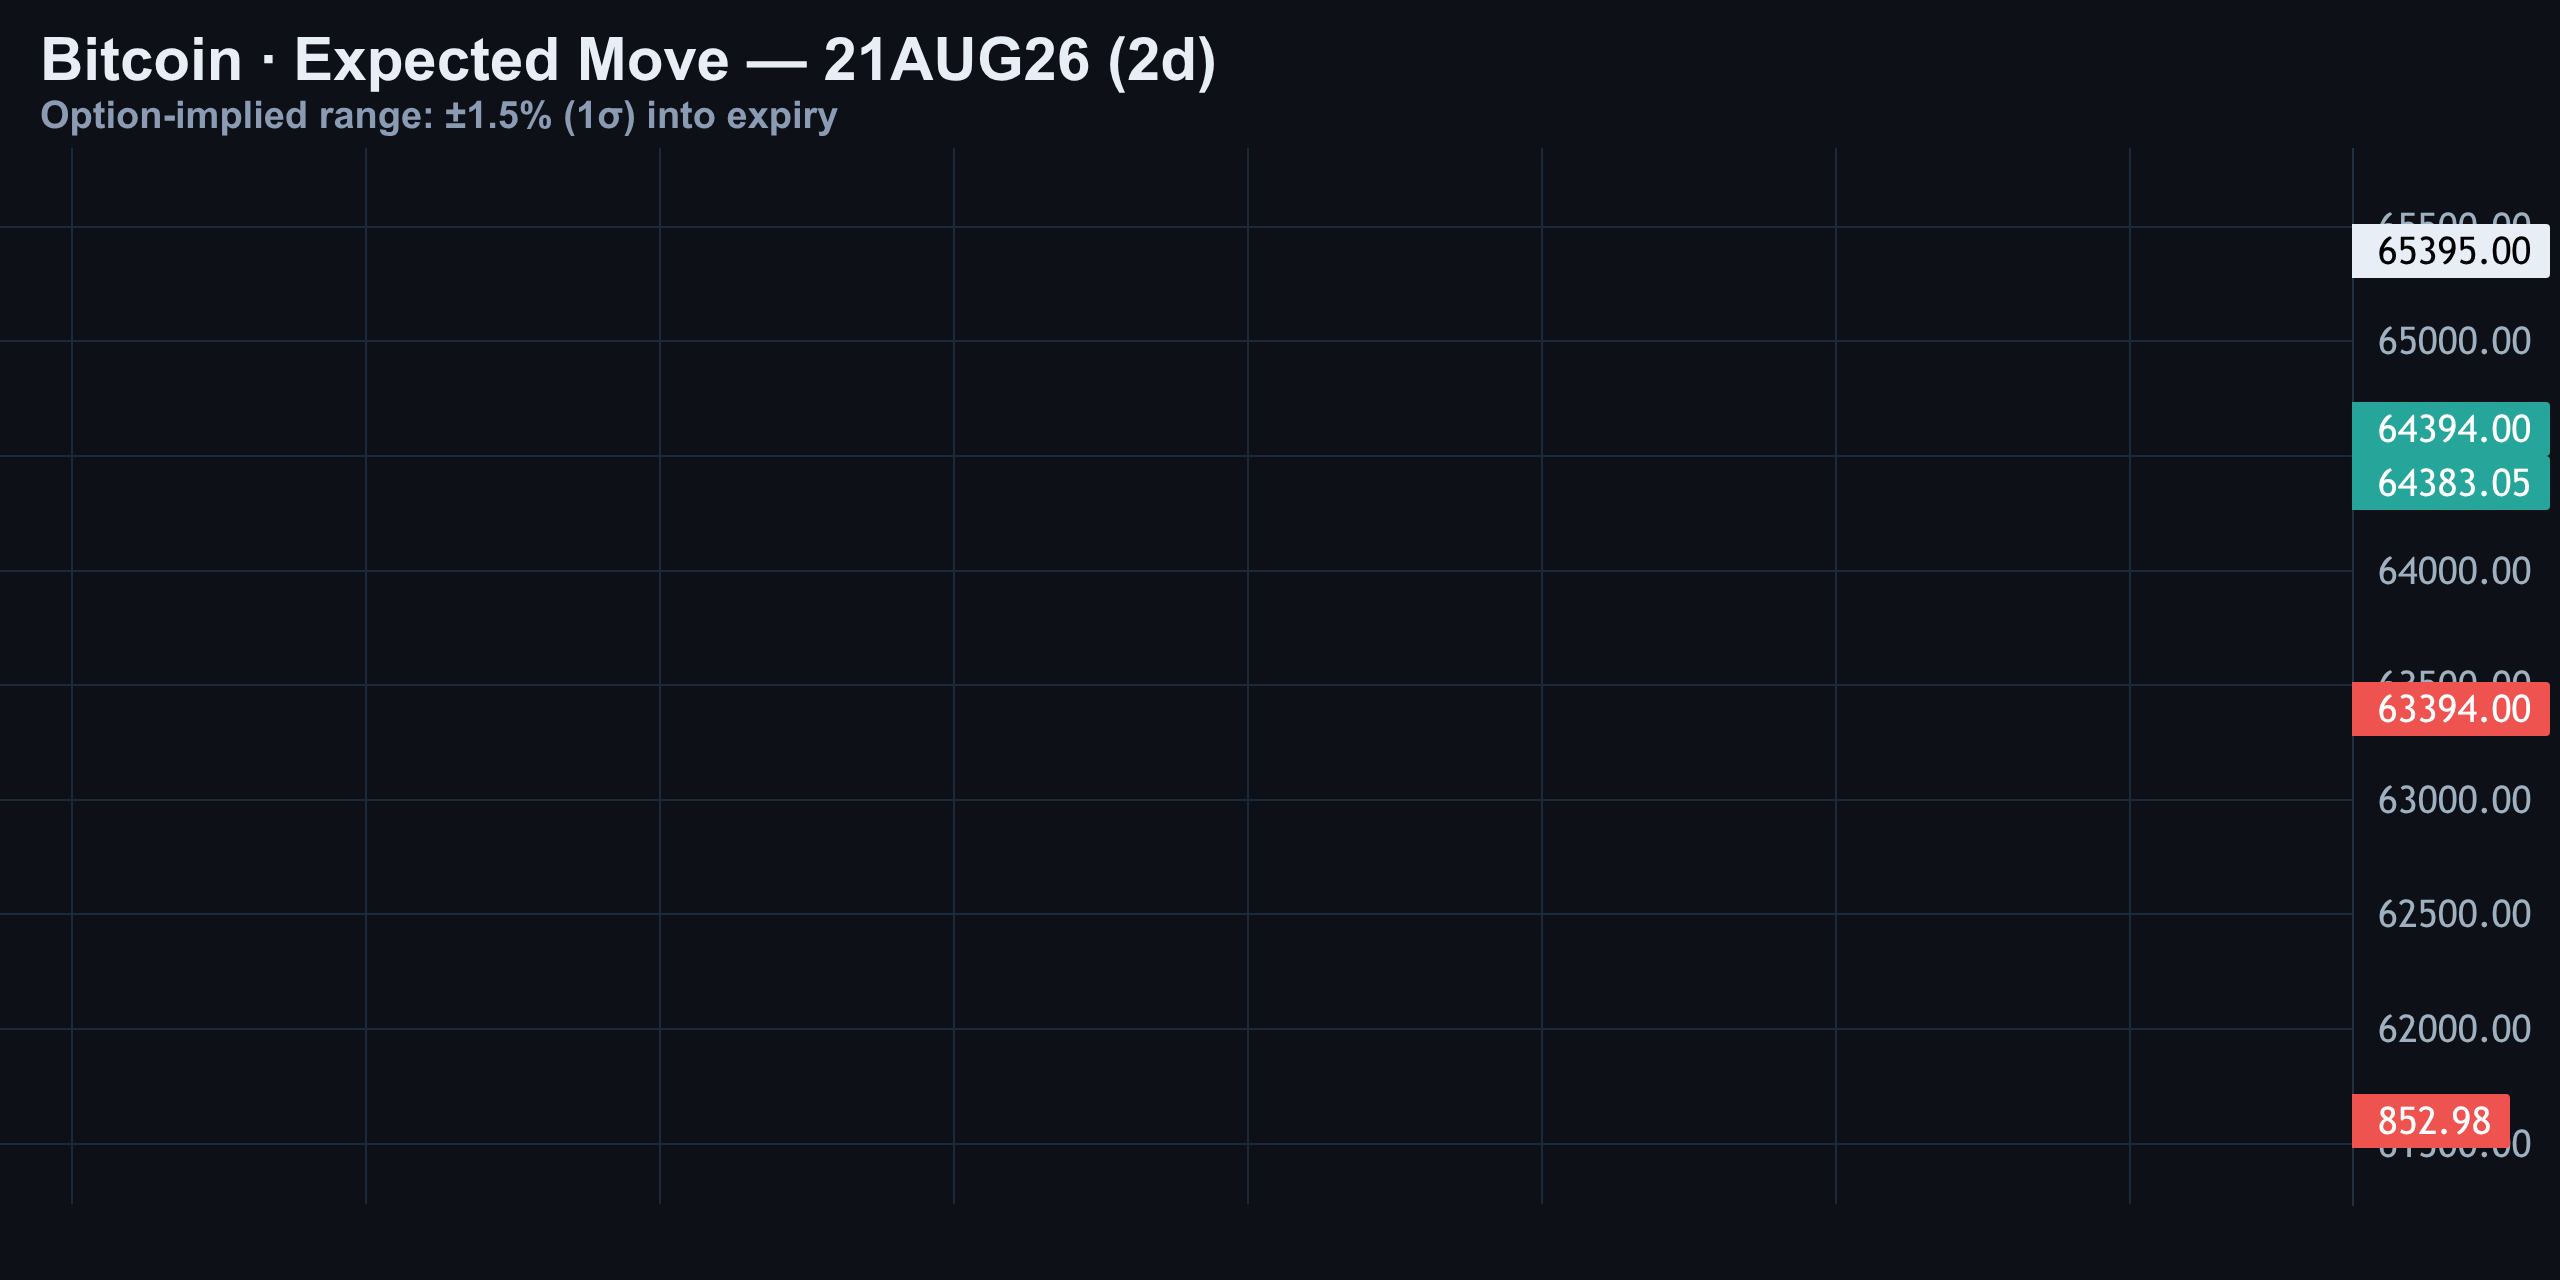
For the two-day window, the expected move sits roughly between $64,400 and $66,400, with the wider two-sigma band running from about $63,400 to $67,400. Staying inside the tighter band is the high-probability outcome; anything outside the wider band is a genuine tail event.
| Band | Range |
|---|---|
| 1-sigma expected move (2-day) | $64,400 – $66,400 |
| 2-sigma tail range | $63,400 – $67,400 |
| Max pain magnet | $64,000 |
| Nearest resistance / trap level | $64,616 |
| 4H resistance ceiling | ~$65,500 |
| Call wall | $70,000 |
| Put wall | $60,000 |
The Desk Call: Still No Clean 1:2.5 Trade
Put it all together and today looks a lot like yesterday. Options are pricing calm — implied vol running hot above realized, dealers pinned in positive gamma, price boxed between two major moving averages on the daily. But underneath that surface calm, the skew says whales are quietly buying downside protection, and the liquidation map shows leverage stacked on both sides of spot, ready to cascade if either wall breaks.
- Upside path: a clean break and hold above the $65,500 descending trendline opens room toward the $66,400 expected-move ceiling, and eventually the $70,000 call wall further out.
- Downside path: a break below $64,000 max pain risks a slide toward the $63,400 tail and the liquidation cluster below it.
- Base case: continued chop inside the $64,400–$66,400 box while dealers keep the lid on volatility.
None of these paths currently offer a 1:2.5 risk-reward entry with a defined invalidation level that isn't sitting right in the middle of the liquidation sandwich. That's the entire reason the desk stood aside yesterday, and it's the reason we're standing aside again today. The $64,616 trap holds — until price closes decisively outside the $64,000–$65,500 box on volume, this stays a range to respect, not a range to trade.
Summary: What to Watch Into Tomorrow
Bitcoin sits around $64,300–$64,700 as of this update, up modestly on the day, with markets elsewhere adding noise — notably a sharp 5.8% drop in South Korea's Kospi that hasn't visibly dented BTC's floor above $64,000. The setup is unchanged in spirit from yesterday: no trend, a magnet at $64,000 max pain, a trap at $64,616, and a hard ceiling near $70,000 in the market's own options pricing.
| Key Level | Price | Why It Matters |
|---|---|---|
| Max pain magnet | $64,000 | Pulls price into close on nearest expiry |
| The trap level | $64,616 | Yesterday's and today's decision point |
| 4H resistance | ~$65,500 | Descending trendline capping every rally since Aug 10 |
| Expected move ceiling | $66,400 | 1-sigma upper bound, 2-day window |
| 2-sigma tail (down) | $63,400 | Genuine breakdown territory |
| Put wall / floor | $60,000 | Sellers defending downside |
| Call wall / hard ceiling | $70,000 | Near-zero probability of a close above this by Aug 23 |
Until one of these levels gives way with conviction, this remains a market to watch, not one to force a position in. We'll be back tomorrow with the next Bitcoin Daily Pulse to see whether the $64,616 trap finally breaks — or holds for a third straight day.
More on Bitcoin: elliott wave
Analysis and education, not investment advice. See our editorial policy.