Daily market analysis
Thesandbox (SAND) technical analysis today
Last updated
SAND Daily Pulse Aug 13, 2026: Trapped Under $0.0388
Where We Left It: Yesterday's Short Target Got Tagged
Welcome back to Finance With FM. It's August 13, 2026, and SAND is doing exactly what the charts said it would do yesterday — just a little faster than expected.
Yesterday's call was a short from $0.0408, stop at $0.0416, target $0.0388. That target got tagged clean. Since then, price has fallen roughly 2.6%, moving from around $0.03984 down to today's session low near $0.0379, with spot currently sitting around $0.0387 according to live market data.
| Metric | Value |
|---|---|
| Yesterday's entry | $0.0408 (short) |
| Stop used | $0.0416 |
| Target | $0.0388 — tagged |
| Price move since call | -2.6% |
| Current spot (approx.) | $0.0387 |
The Big Picture: A Grind, Not a Squeeze
SAND is trading around $0.0388, down close to 3% on the day after tagging a fresh low near $0.0379. Coingecko has SAND printing a -3.81% intraday move against a 24-hour volume of roughly $8.9 million — thin enough that a single large order can still move the tape.
The four-hour structure shows lower highs inside a falling channel, RSI sits near 32 — weak, but not oversold — and MACD stays below its signal line with a negative histogram. Funding is barely negative and open interest is flat, so this isn't shaping up as a violent squeeze setup. It's a grind, and right now the grind favors the bears.
| Data point | Reading |
|---|---|
| 24h change | -3.81% |
| Session low | ~$0.0379 |
| 24h volume | ~$8.9M |
| Funding rate | -0.0076% (mildly negative) |
| Open interest (7d) | +1.6% (flat) |
15-Minute Intraday: A Rangebound Fight Between Two Walls
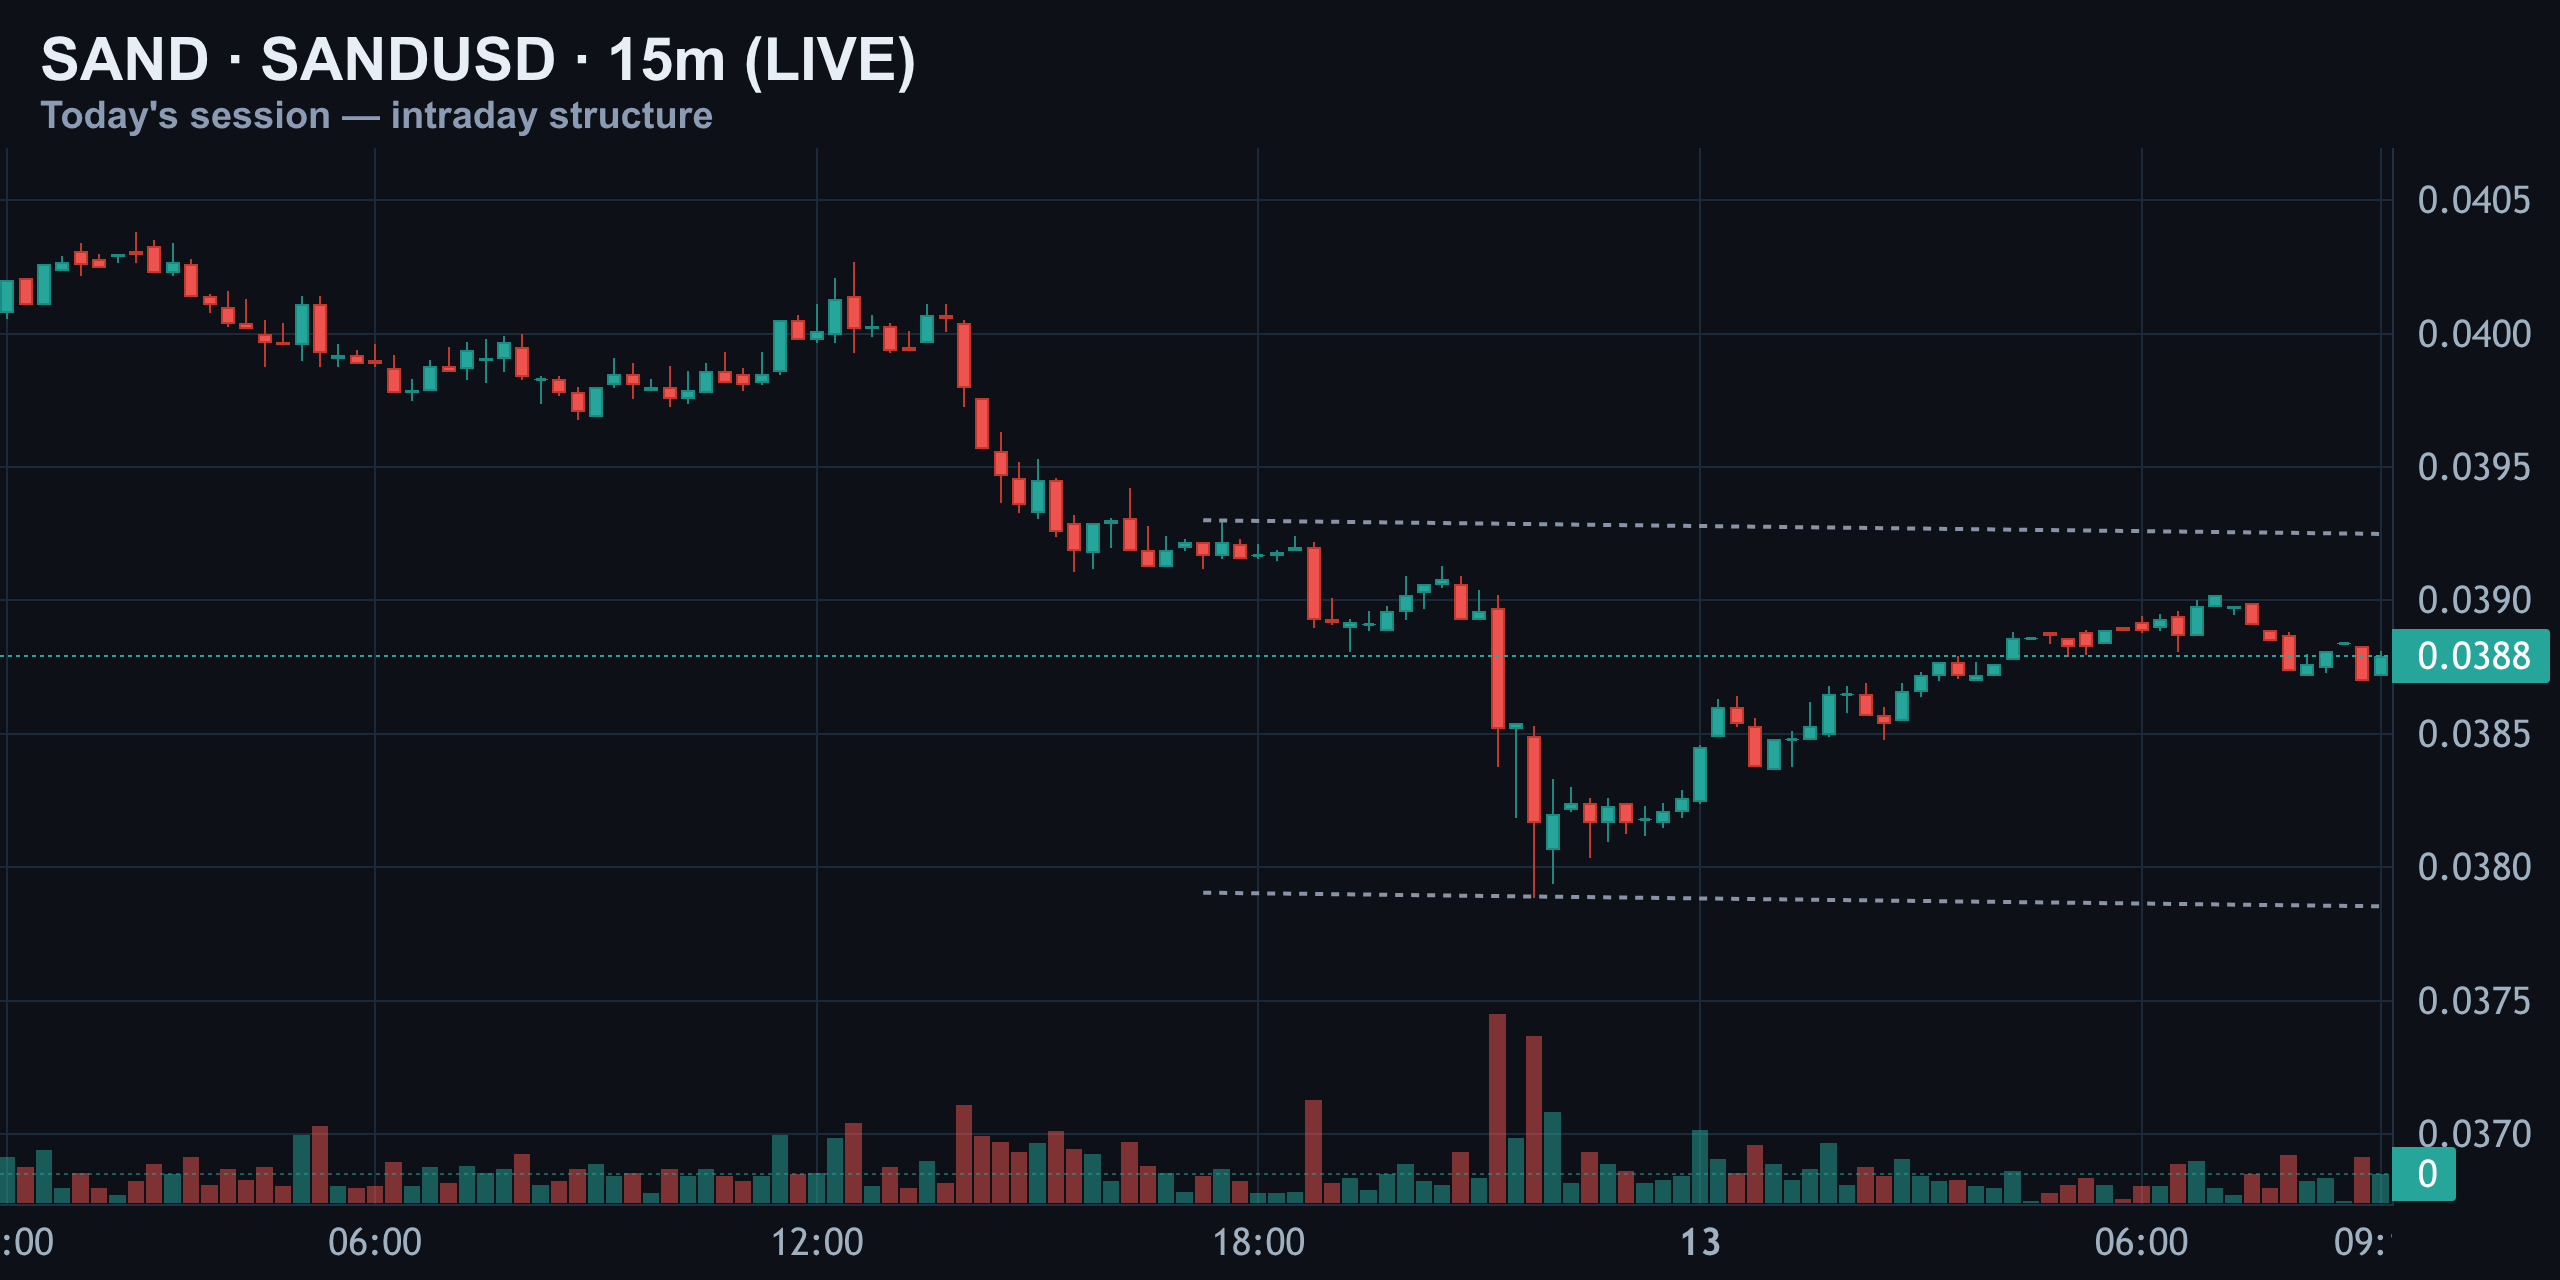
Zoom into the 15-minute chart and the day's fight is obvious. SAND rallied into the $0.0393 resistance line twice this session and got rejected both times. That rejection triggered a sharp flush down toward $0.038 support, where a volume spike marked capitulation.
Since then, price has been grinding back up in small, choppy candles, now sitting right on the $0.0388 pivot. It's a rangebound tape — buyers are defending the low, but they haven't reclaimed the resistance line yet.
4-Hour Structure: The Falling Channel Is Still Intact
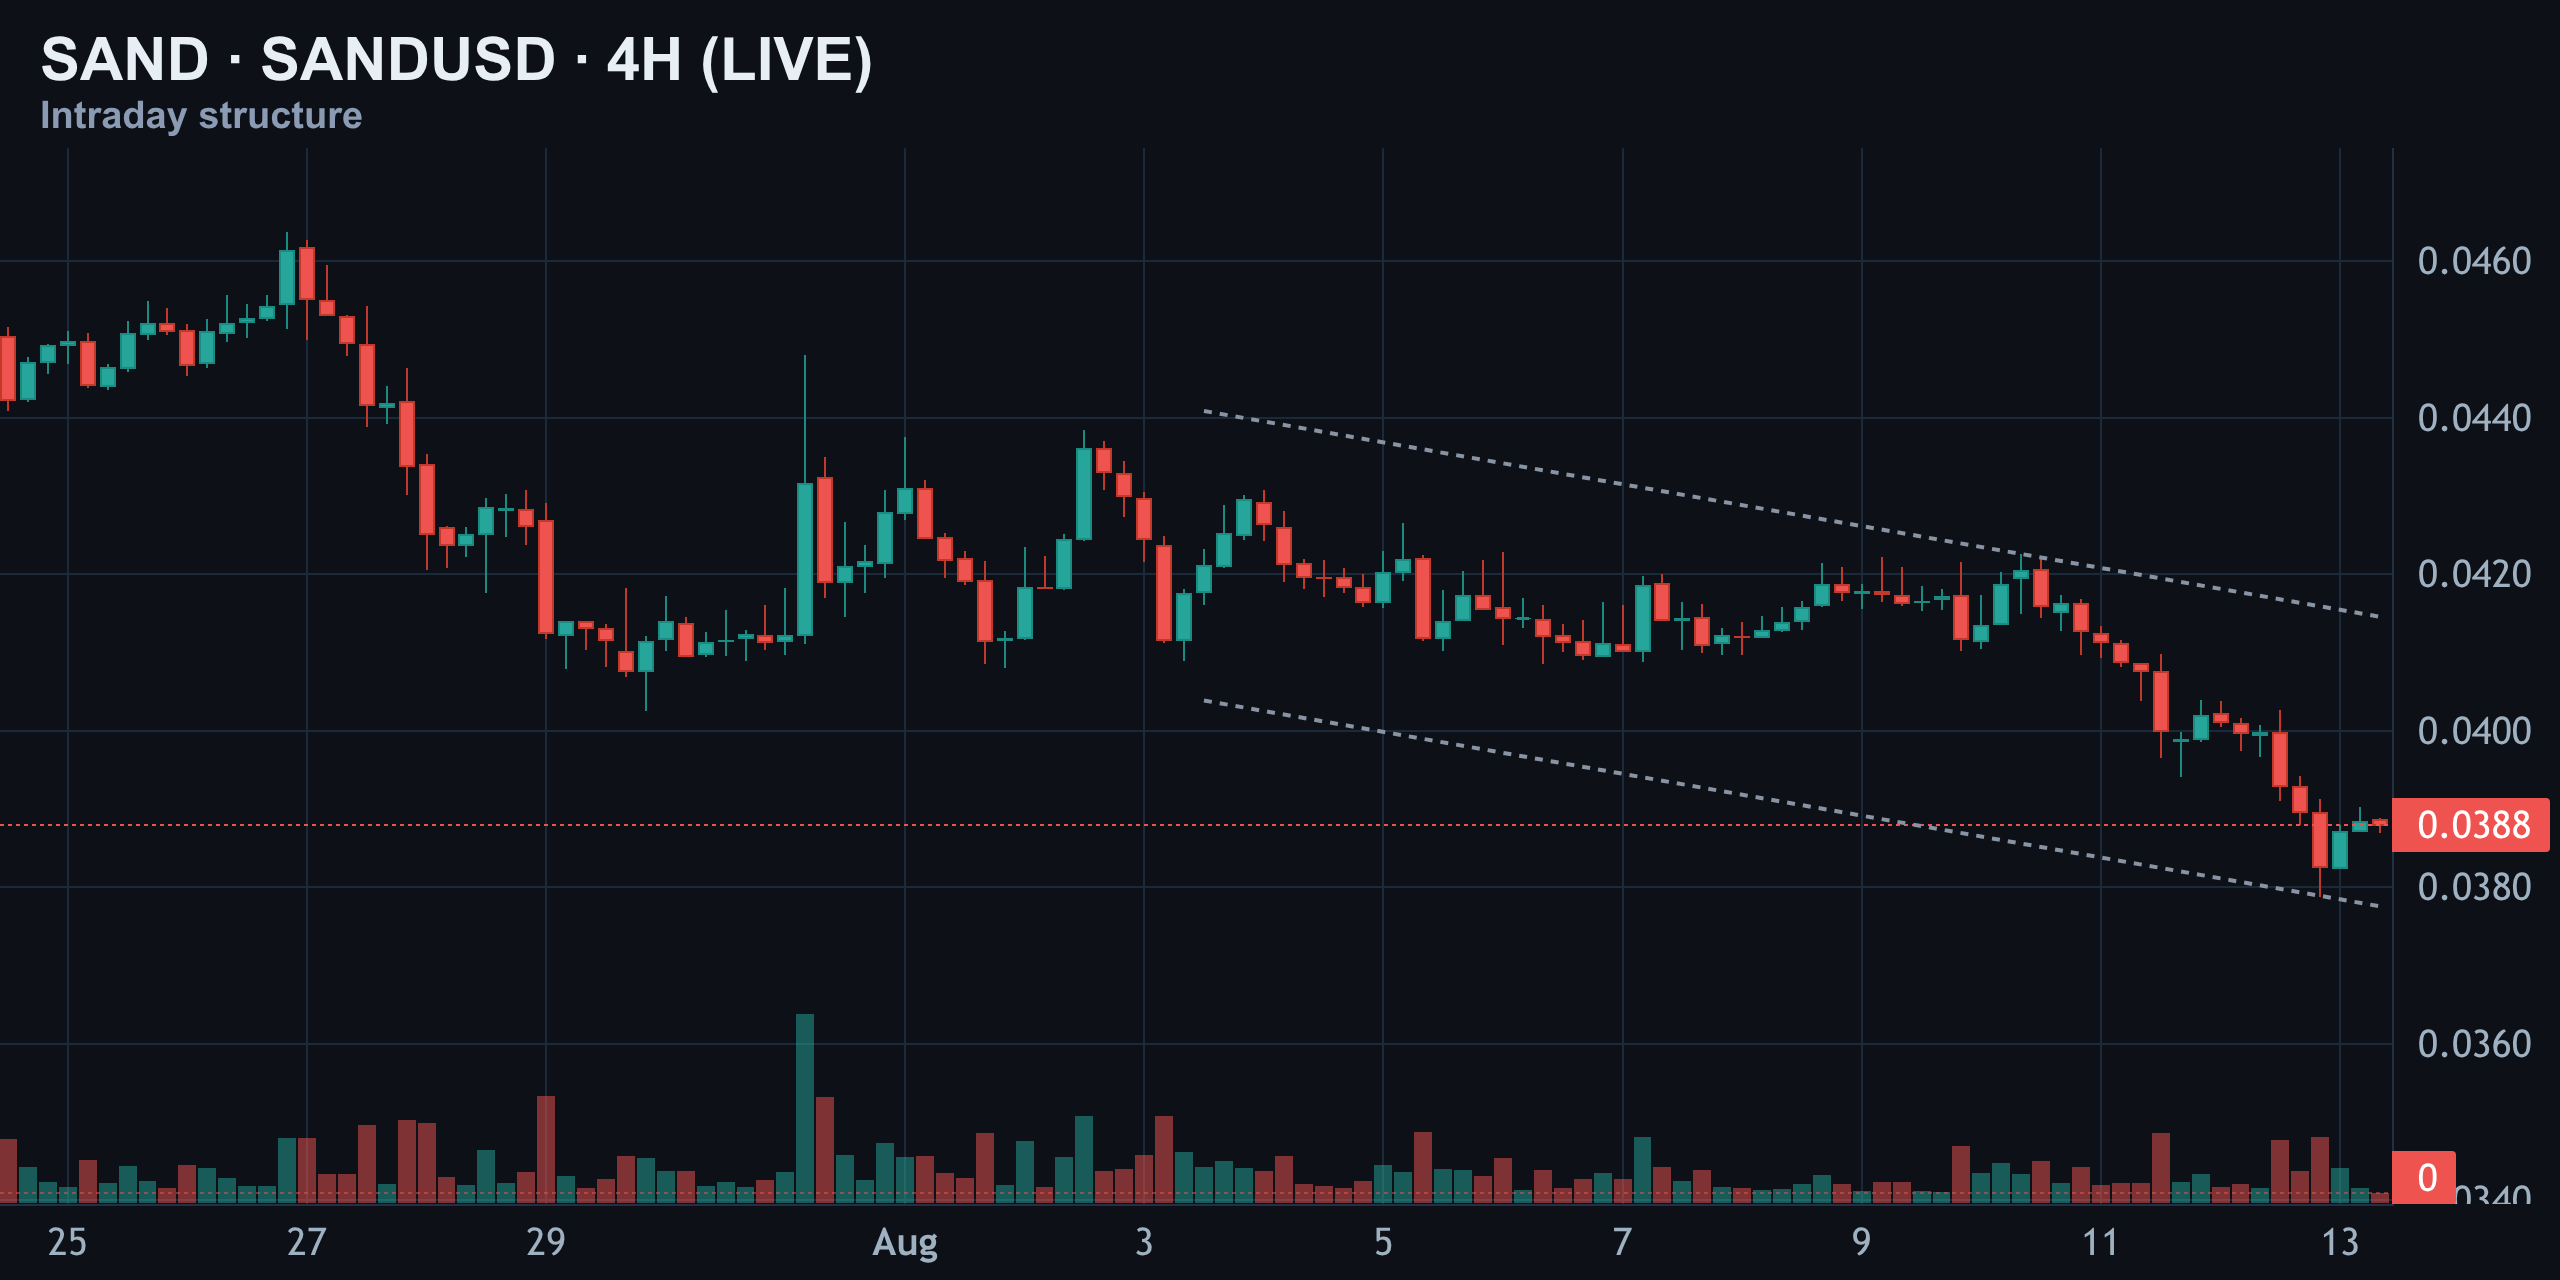
On the four-hour, the picture is less forgiving. SAND has carved a clean descending channel since the start of August, capped by resistance sloping down and support sloping down beneath it. Price broke below the $0.0388 pivot line a few candles back and is now hovering right on top of it, undecided.
Every bounce inside this channel has been sold so far. Until SAND reclaims the upper channel line, the four-hour trend structure stays bearish — and that's the frame the trade setup below is built from.
Daily Chart: Testing the Range Floor
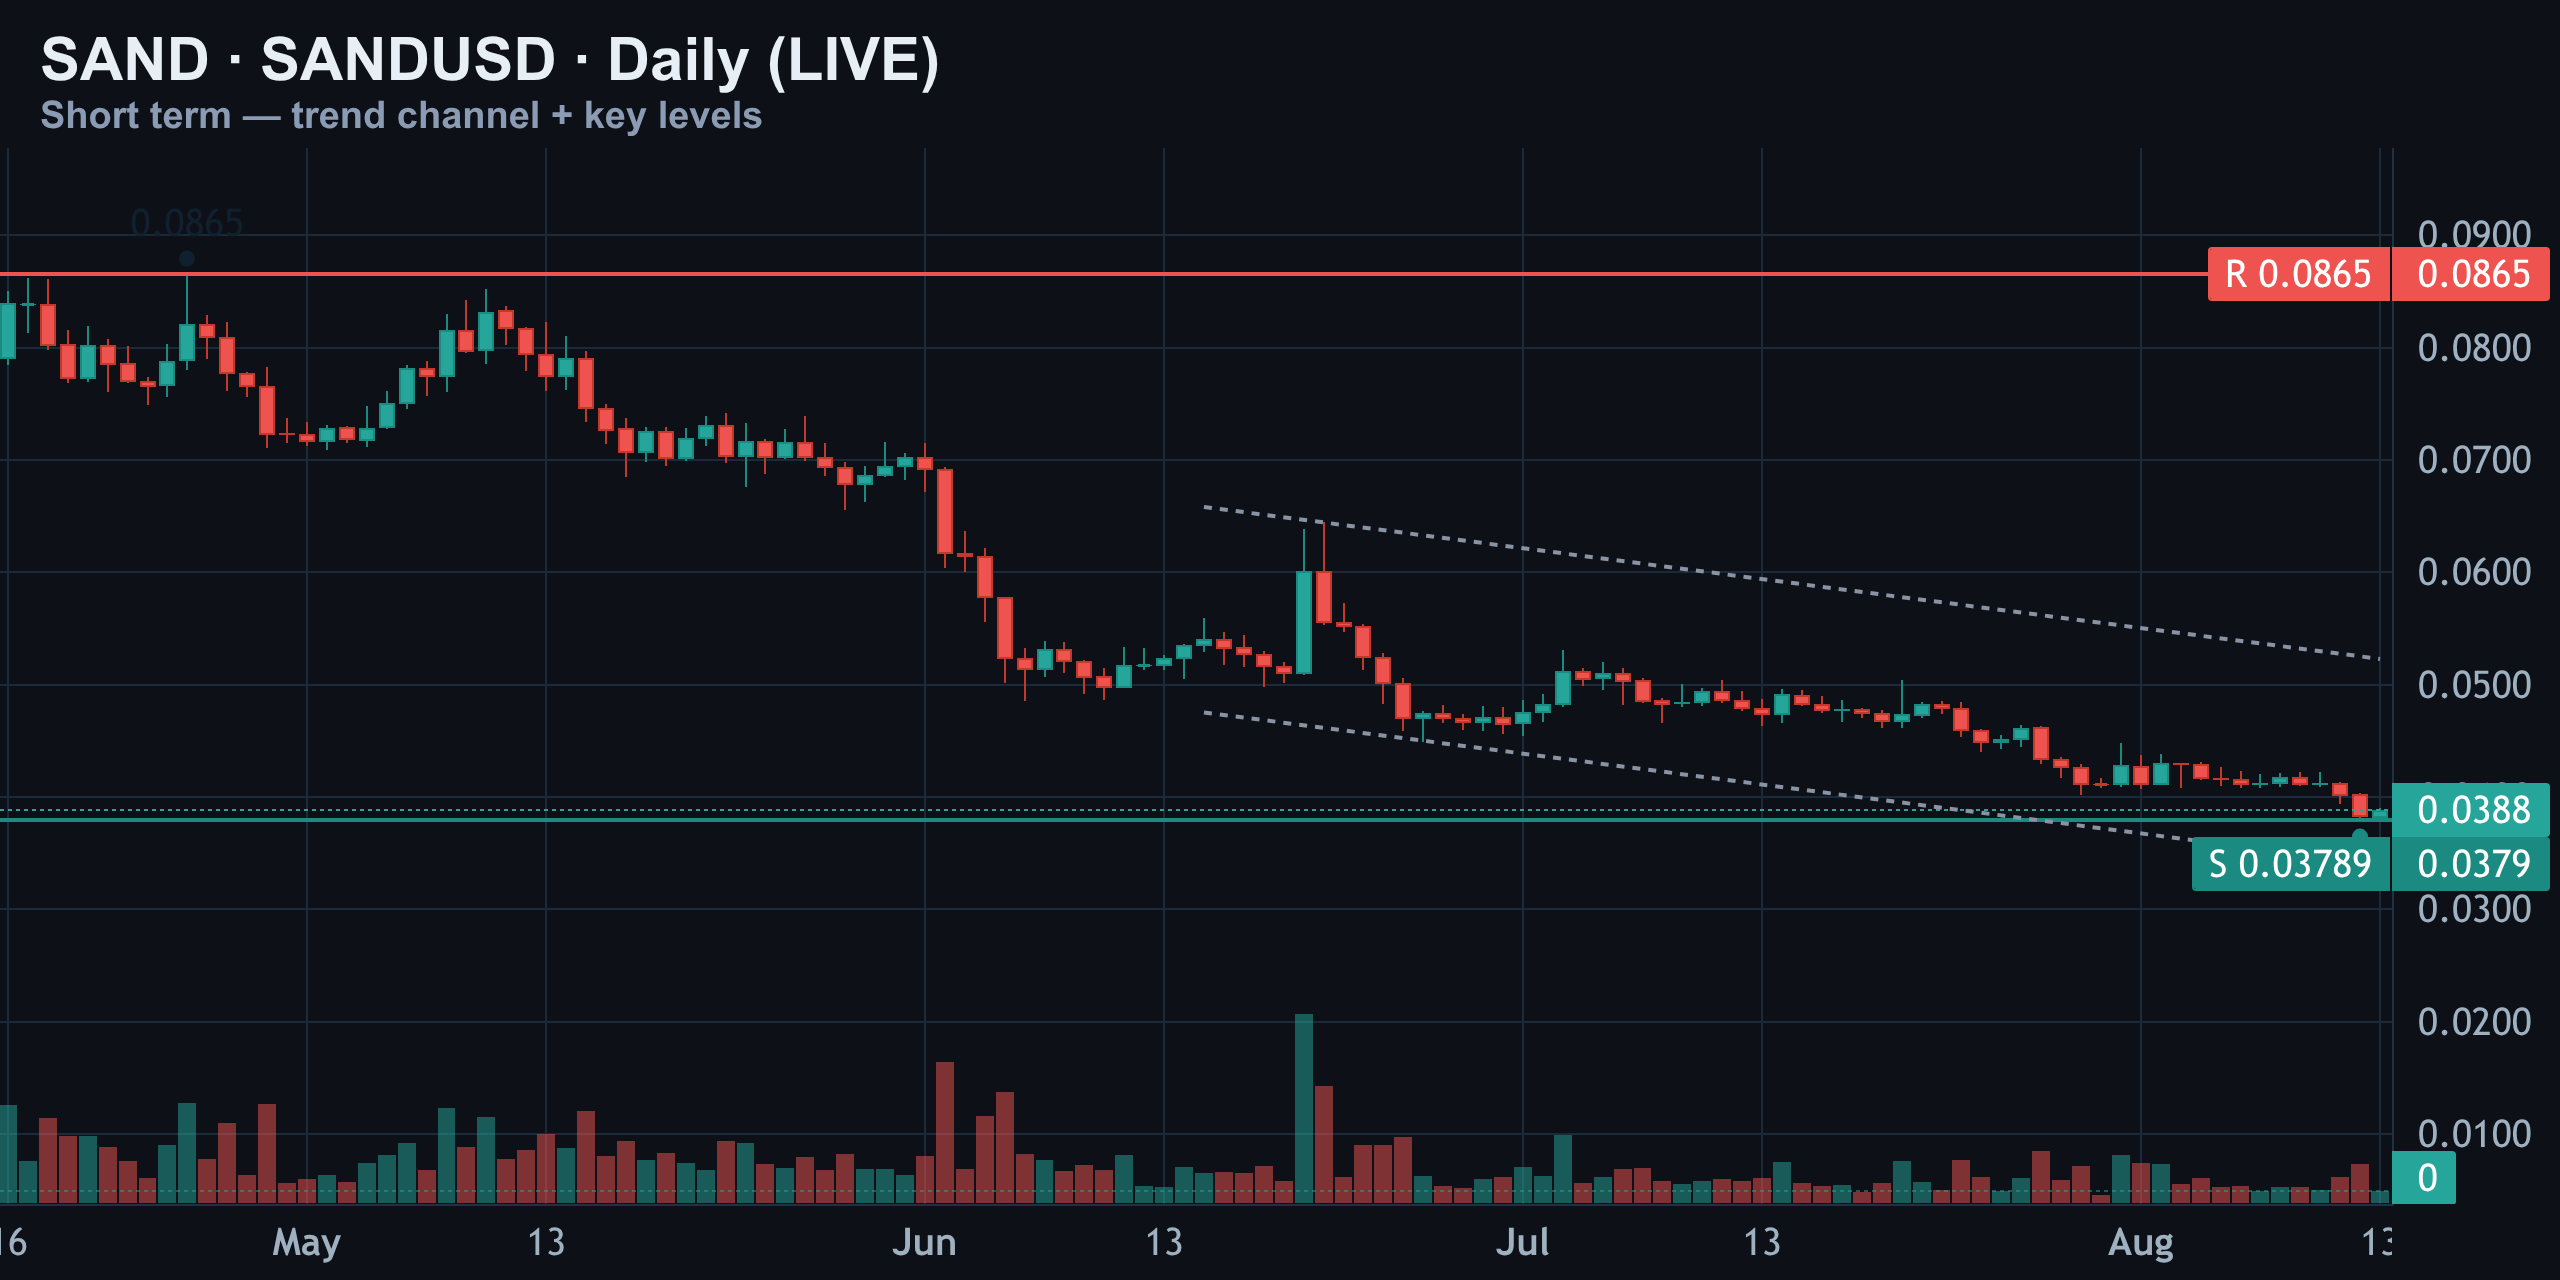
Stepping back to daily, SAND has been in a relentless downtrend since May, and it's now testing the $0.03789 support shelf almost exactly. That's the same trend channel that's guided price lower since late July, and price is sitting right on its lower rail.
The $0.0865 resistance up top is ancient history at this point — not a factor for today's setup. Some forecast models still reference levels near $0.0396–$0.0408 for the broader August range, underscoring how far price has slipped from even recent expectations. What matters right now is whether this support shelf holds or gives way to a fresh leg down into fresh lows.
RSI and MACD: Weak Momentum, No Divergence Yet
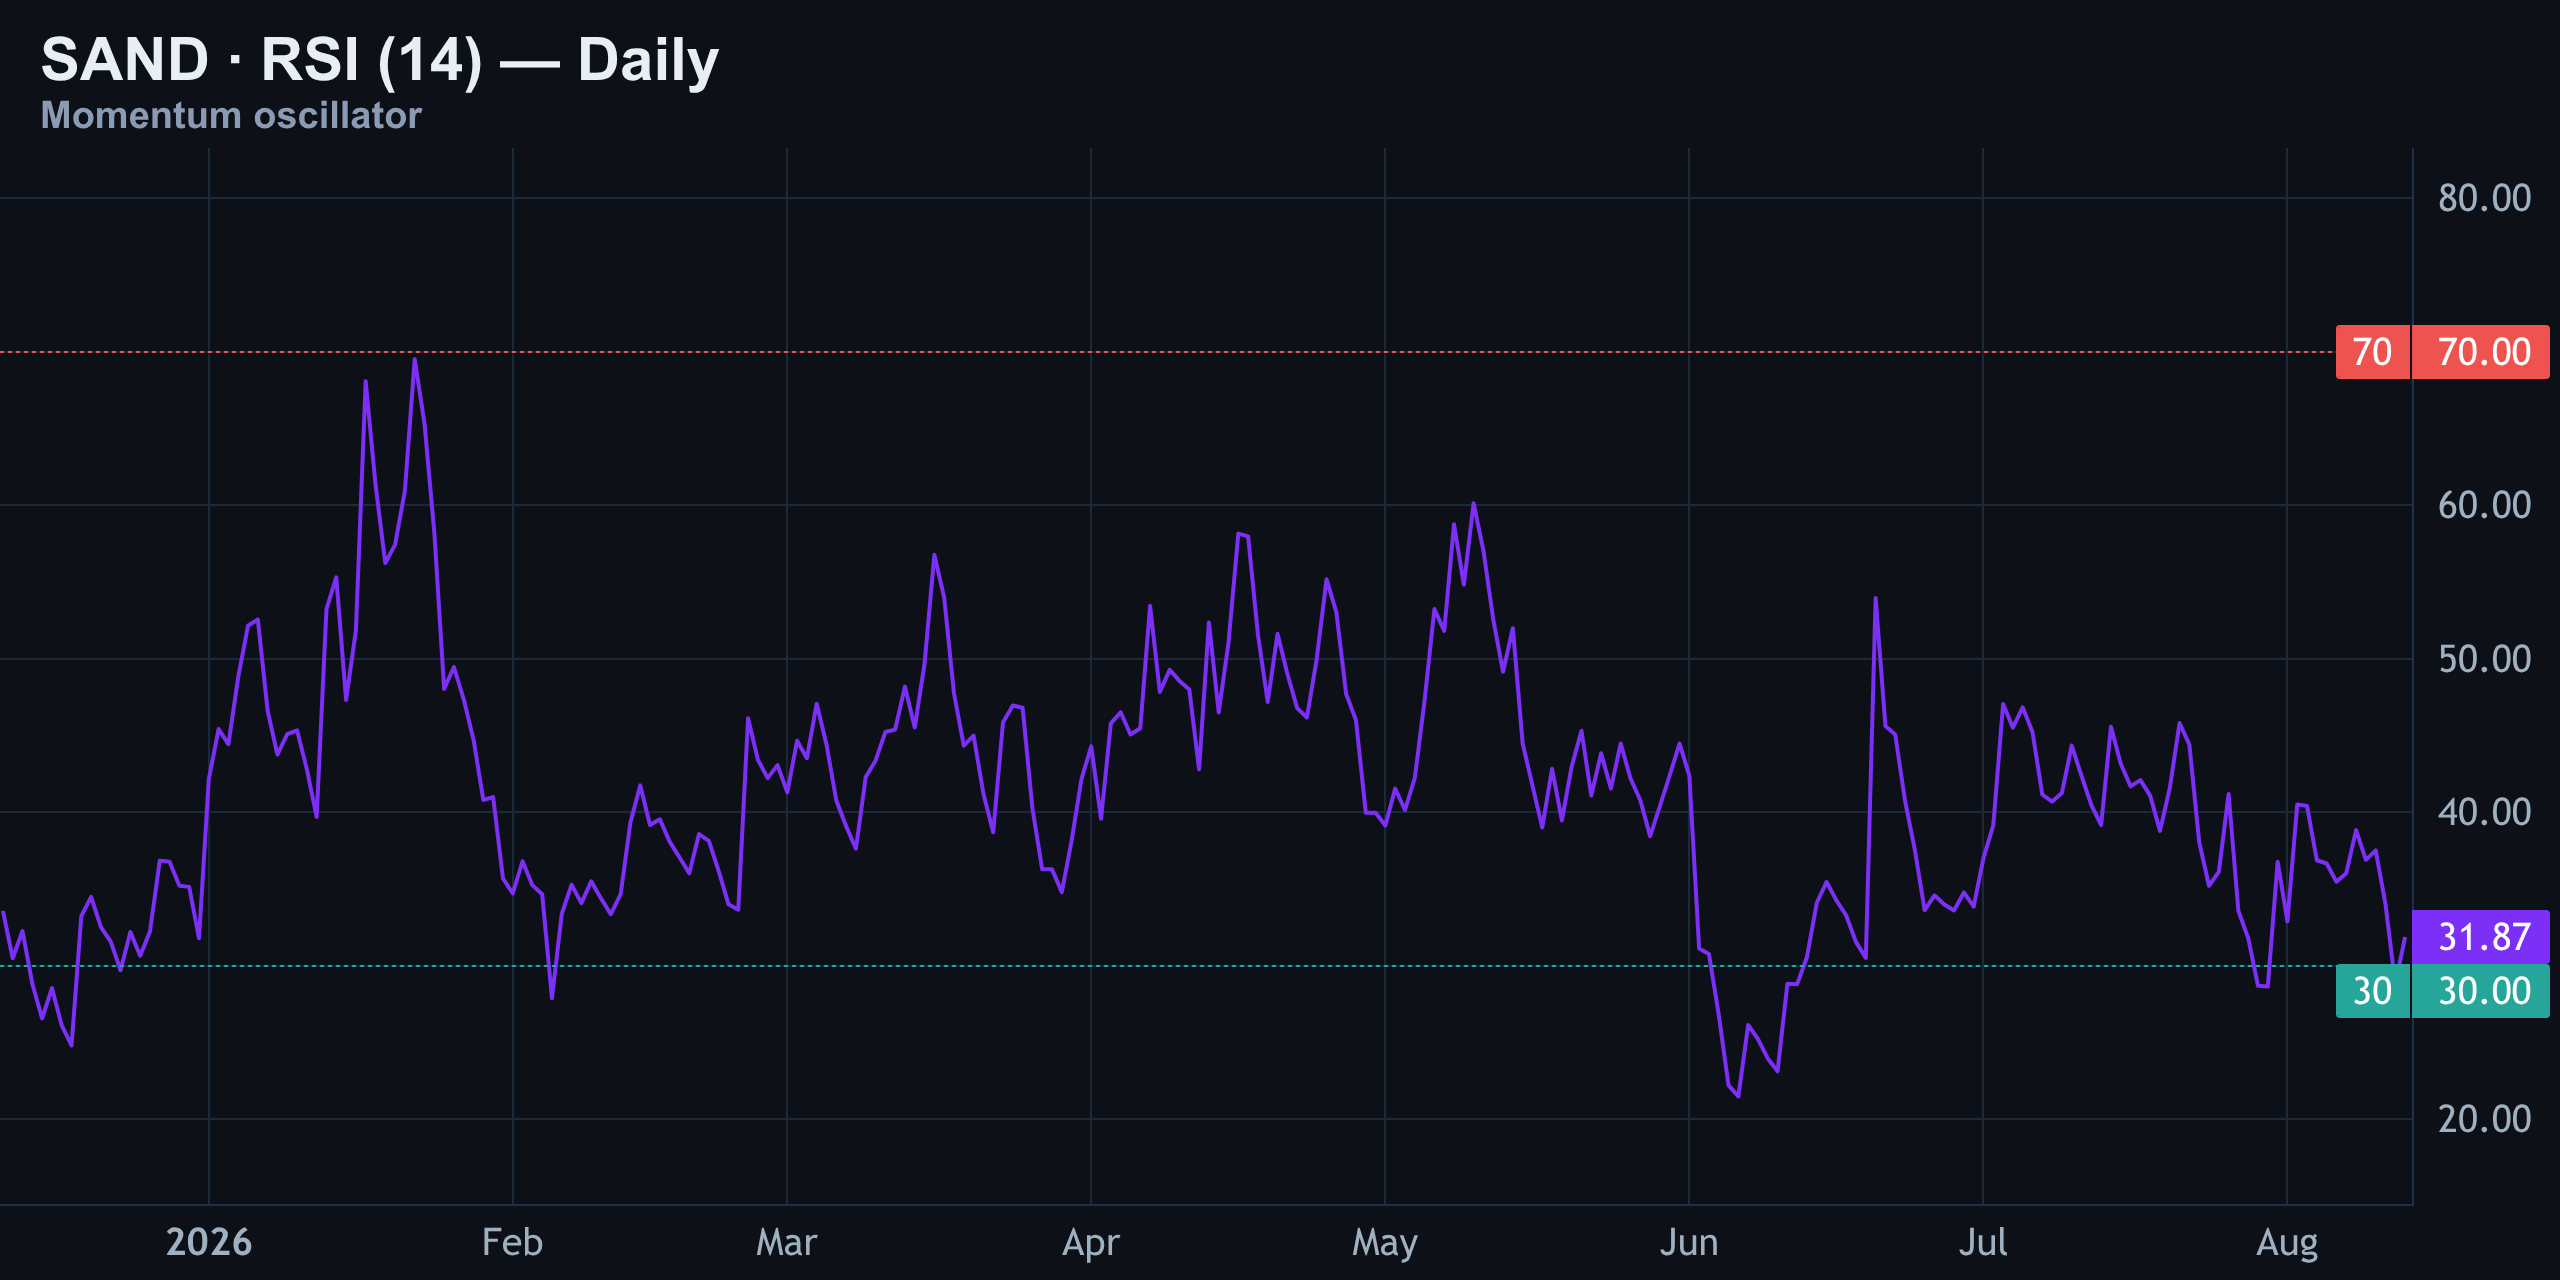
RSI on the daily sits at 31.87. That's weak momentum, but it's not deep oversold territory yet — there's room for this to fall further before it gets truly stretched. More importantly, there's no bullish divergence here. Price is making a fresh low and RSI is right there with it, not diverging higher like it did back in early June before that squeeze move played out. That tells you sellers still have control of momentum, not just price.
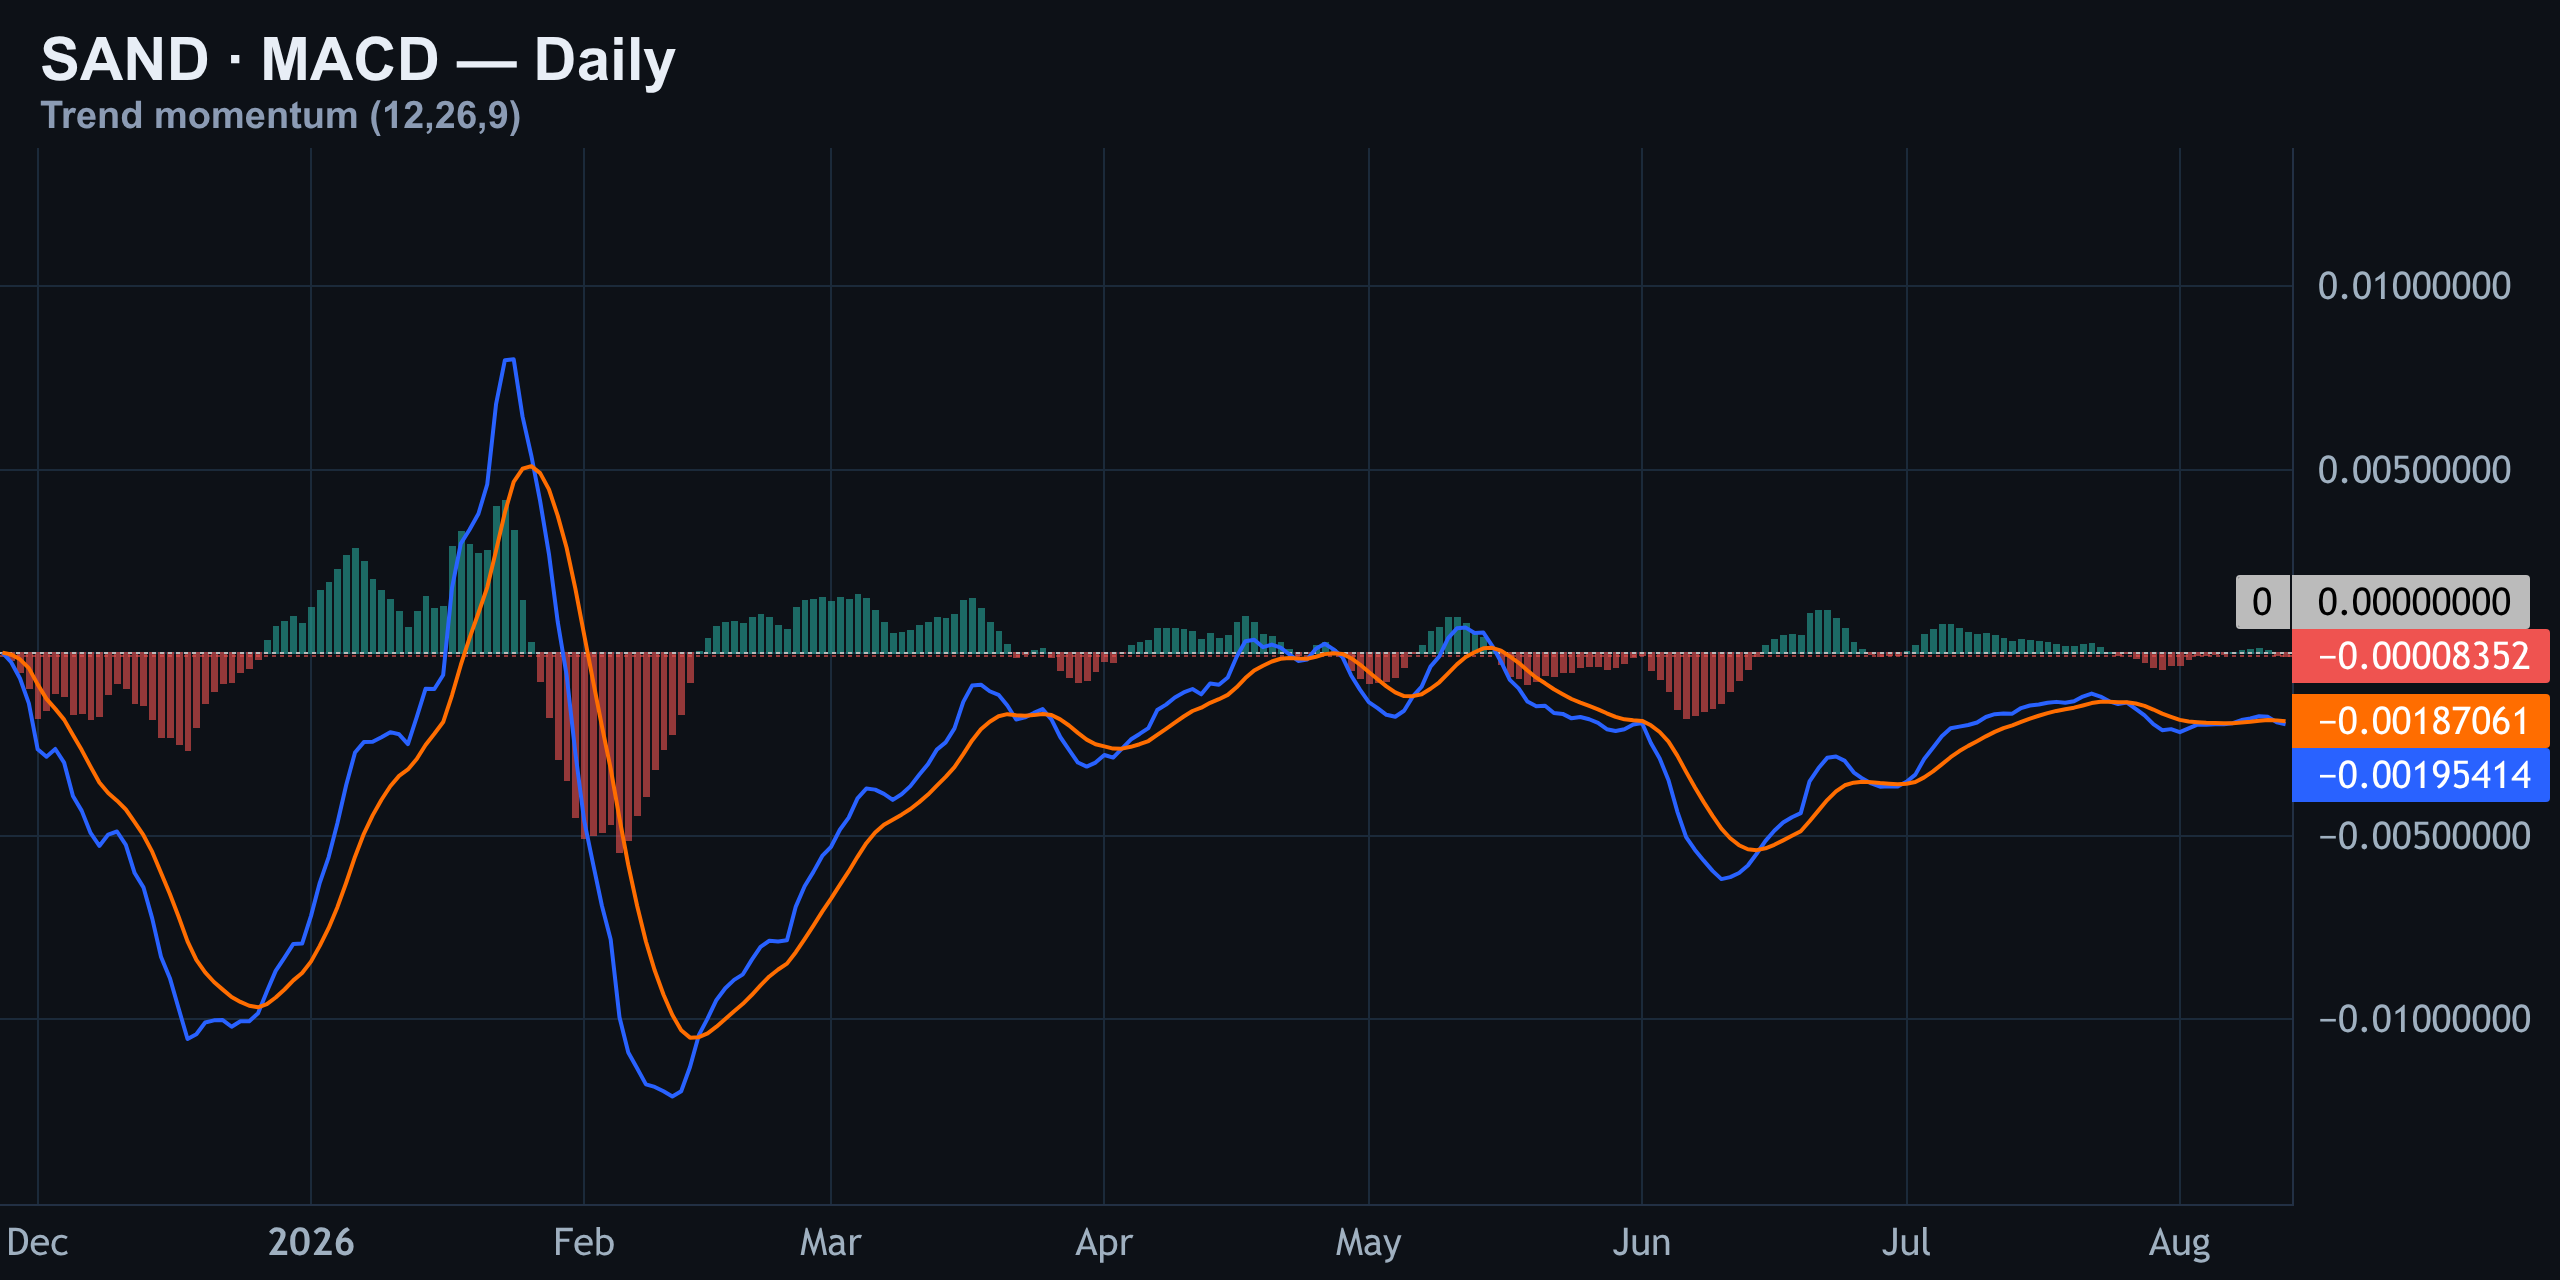
MACD confirms the RSI story. The MACD line is running below its signal line, and the histogram bars sit in negative territory with no real attempt at a bullish cross since the early-August rally failed. This is a trend-momentum indicator, and right now it's telling you the trend itself is down, not just the price action. When RSI and MACD line up like this, that's real confluence — two indicators confirming the same weak-momentum story, not contradicting each other.
Liquidation Heatmap: A Pool the Market Has Already Fought Over Once
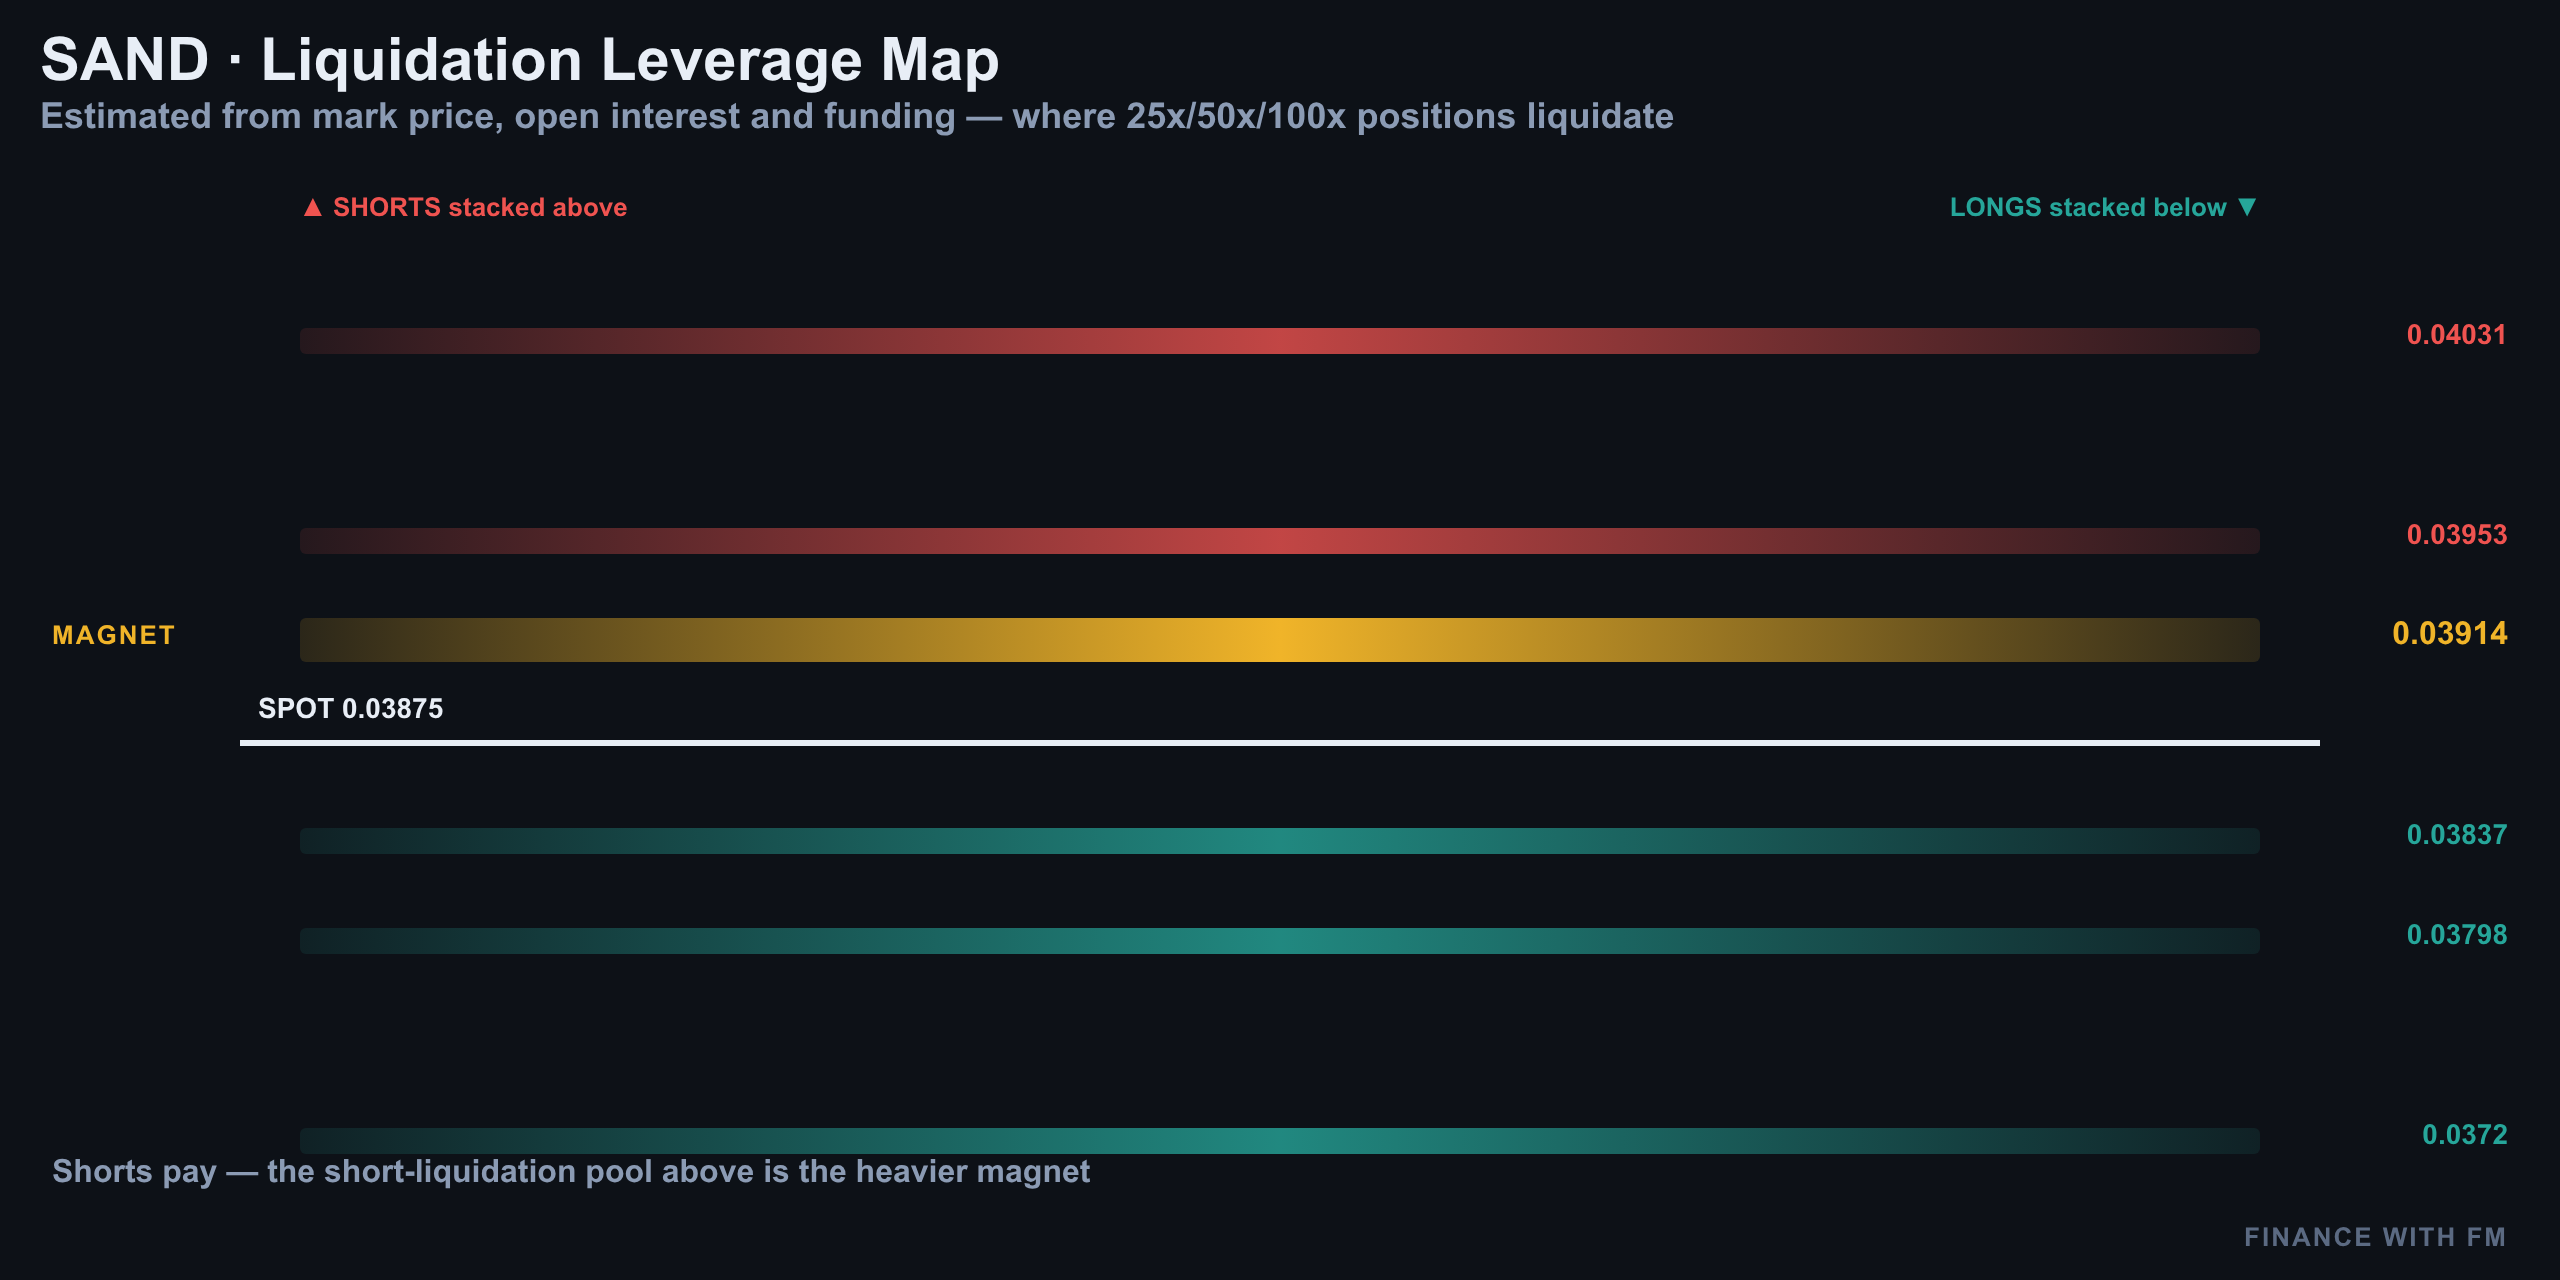
The densest liquidation cluster sits just below spot at $0.0382, a pool of stops the market has already cleared out once recently. Above spot, lighter clusters stack near $0.04 and $0.041 — magnets only if shorts get squeezed.
| Level | Type | Note |
|---|---|---|
| $0.0865 | Daily resistance | Far above — not a factor today |
| $0.041 | Light liquidation cluster | Only relevant on a short squeeze |
| $0.04 | Light liquidation cluster | Minor upside magnet |
| $0.0388 | Pivot in play | Price is glued here right now |
| $0.0382 | Densest liquidation pool | Stops already cleared once |
| $0.0379 | Daily support / session low | Range floor being tested |
Positioning, Order Flow, and the Coinbase Discount
Funding is basically neutral at -0.0076% — shorts are paying longs a tiny amount, mildly crowded but nothing extreme. Open interest is flat, up only 1.6% over the week, so no aggressive new leverage is piling in either direction.
Retail is long-skewed at 1.27, and top traders are right there with them at 1.30 — they're aligned, which removes the usual fade opportunity. Taker flow shows buyers slightly winning at 1.06. The order book's biggest bid wall sits way down near $0.03, the ask wall way up near $0.077 — both too far out to matter today.
There's one more wrinkle worth flagging: Coinbase is quietly trading at a discount to Binance right now, a pattern that typically shows up when American retail holders are selling into the dip harder than the rest of the market. That's a soft bearish tell — but it's not yet showing up as forced liquidation, just steady distribution.
| Positioning metric | Reading |
|---|---|
| Funding rate | -0.0076% (mildly negative) |
| Open interest (7d) | +1.6% |
| Retail long/short ratio | 1.27 (long-skewed) |
| Top trader long/short ratio | 1.30 (long-skewed) |
| Taker buy/sell ratio | 1.06 (buyers slightly ahead) |
| Biggest bid wall | ~$0.03 |
| Biggest ask wall | ~$0.077 |
The Setup: Entry, Stop, Target (1:2.5)
Everything today lines up around one pivot: $0.0388. Price is glued to it on the 15-minute, it's the last line the four-hour channel broke below, and it sits directly above the densest liquidation pool on the heatmap at $0.0382. That confluence is the whole trade.
| Parameter | Level |
|---|---|
| Bias | Bearish while under $0.0393 |
| Entry (short) | $0.0393 on a failed retest |
| Stop | $0.0401 |
| Target | $0.0374 |
| Risk:Reward | ≈ 1:2.5 |
| Invalidation | 4H close above $0.0401 flips bias bullish |
Summary: The One Level That Kills This Trade
SAND is trapped under $0.0388, sitting on a downtrend channel, weak-but-not-oversold momentum, and a liquidation pool just beneath it that's already been fought over once. Shorts are crowded and paying funding. Retail and top traders are aligned long. Coinbase spot is trading at a discount to Binance, hinting at steady U.S. retail selling into the dip.
None of that flips the bias on its own — the four-hour channel and the daily downtrend are still the dominant forces. But it does mean this isn't a clean, one-sided setup. If SAND reclaims $0.0401 on a four-hour close, this entire short thesis is dead and the range flips constructive fast.
- Bias stays bearish below $0.0393
- Watch the $0.0382 liquidation pool for a second sweep
- A 4H close above $0.0401 invalidates the short setup
- No bullish RSI/MACD divergence yet — momentum still favors sellers
Previous days
08/12/2026 — SAND Price Today: The Trap Under Four Cents (Aug 12)
SAND Price Today: The Trap Under Four Cents (Aug 12)
Where We Left It: Patience Pays as SAND Slides Under $0.04
Yesterday's call on Finance With FM was simple: stand aside. The best short setup on the table only offered a 1:2.4 reward-to-risk ratio, just shy of our 1:2.5 floor, and we don't force trades that don't clear the bar. That patience paid off. SAND kept sliding without us in the trade — no stopped position, no missed target, just a market that needed one more session to hand us something cleaner.
As of this writing, SAND trades at $0.03984, down roughly 2% on the day after tagging an intraday low near $0.0394. That figure lines up with quotes across the board: CoinMarketCap has it at $0.0402 with 24-hour volume near $10.1 million, CoinGecko shows $0.0402 with a similar -2.5% move, and Crypto.com prints $0.0402, down 2.7%. Coinbase is running slightly hotter at $0.0416 — a spread wide enough to matter on thin liquidity, and one we'll come back to when we talk order flow.
15-Minute Intraday: Coiling at the Pivot
Zoom into today's session and SAND has been stuck in a tight box. Resistance sits near $0.0405, support near $0.0395, and every rally into that ceiling has been sold — you can see it in the volume bars, where the red candles are consistently heavier than the green ones.
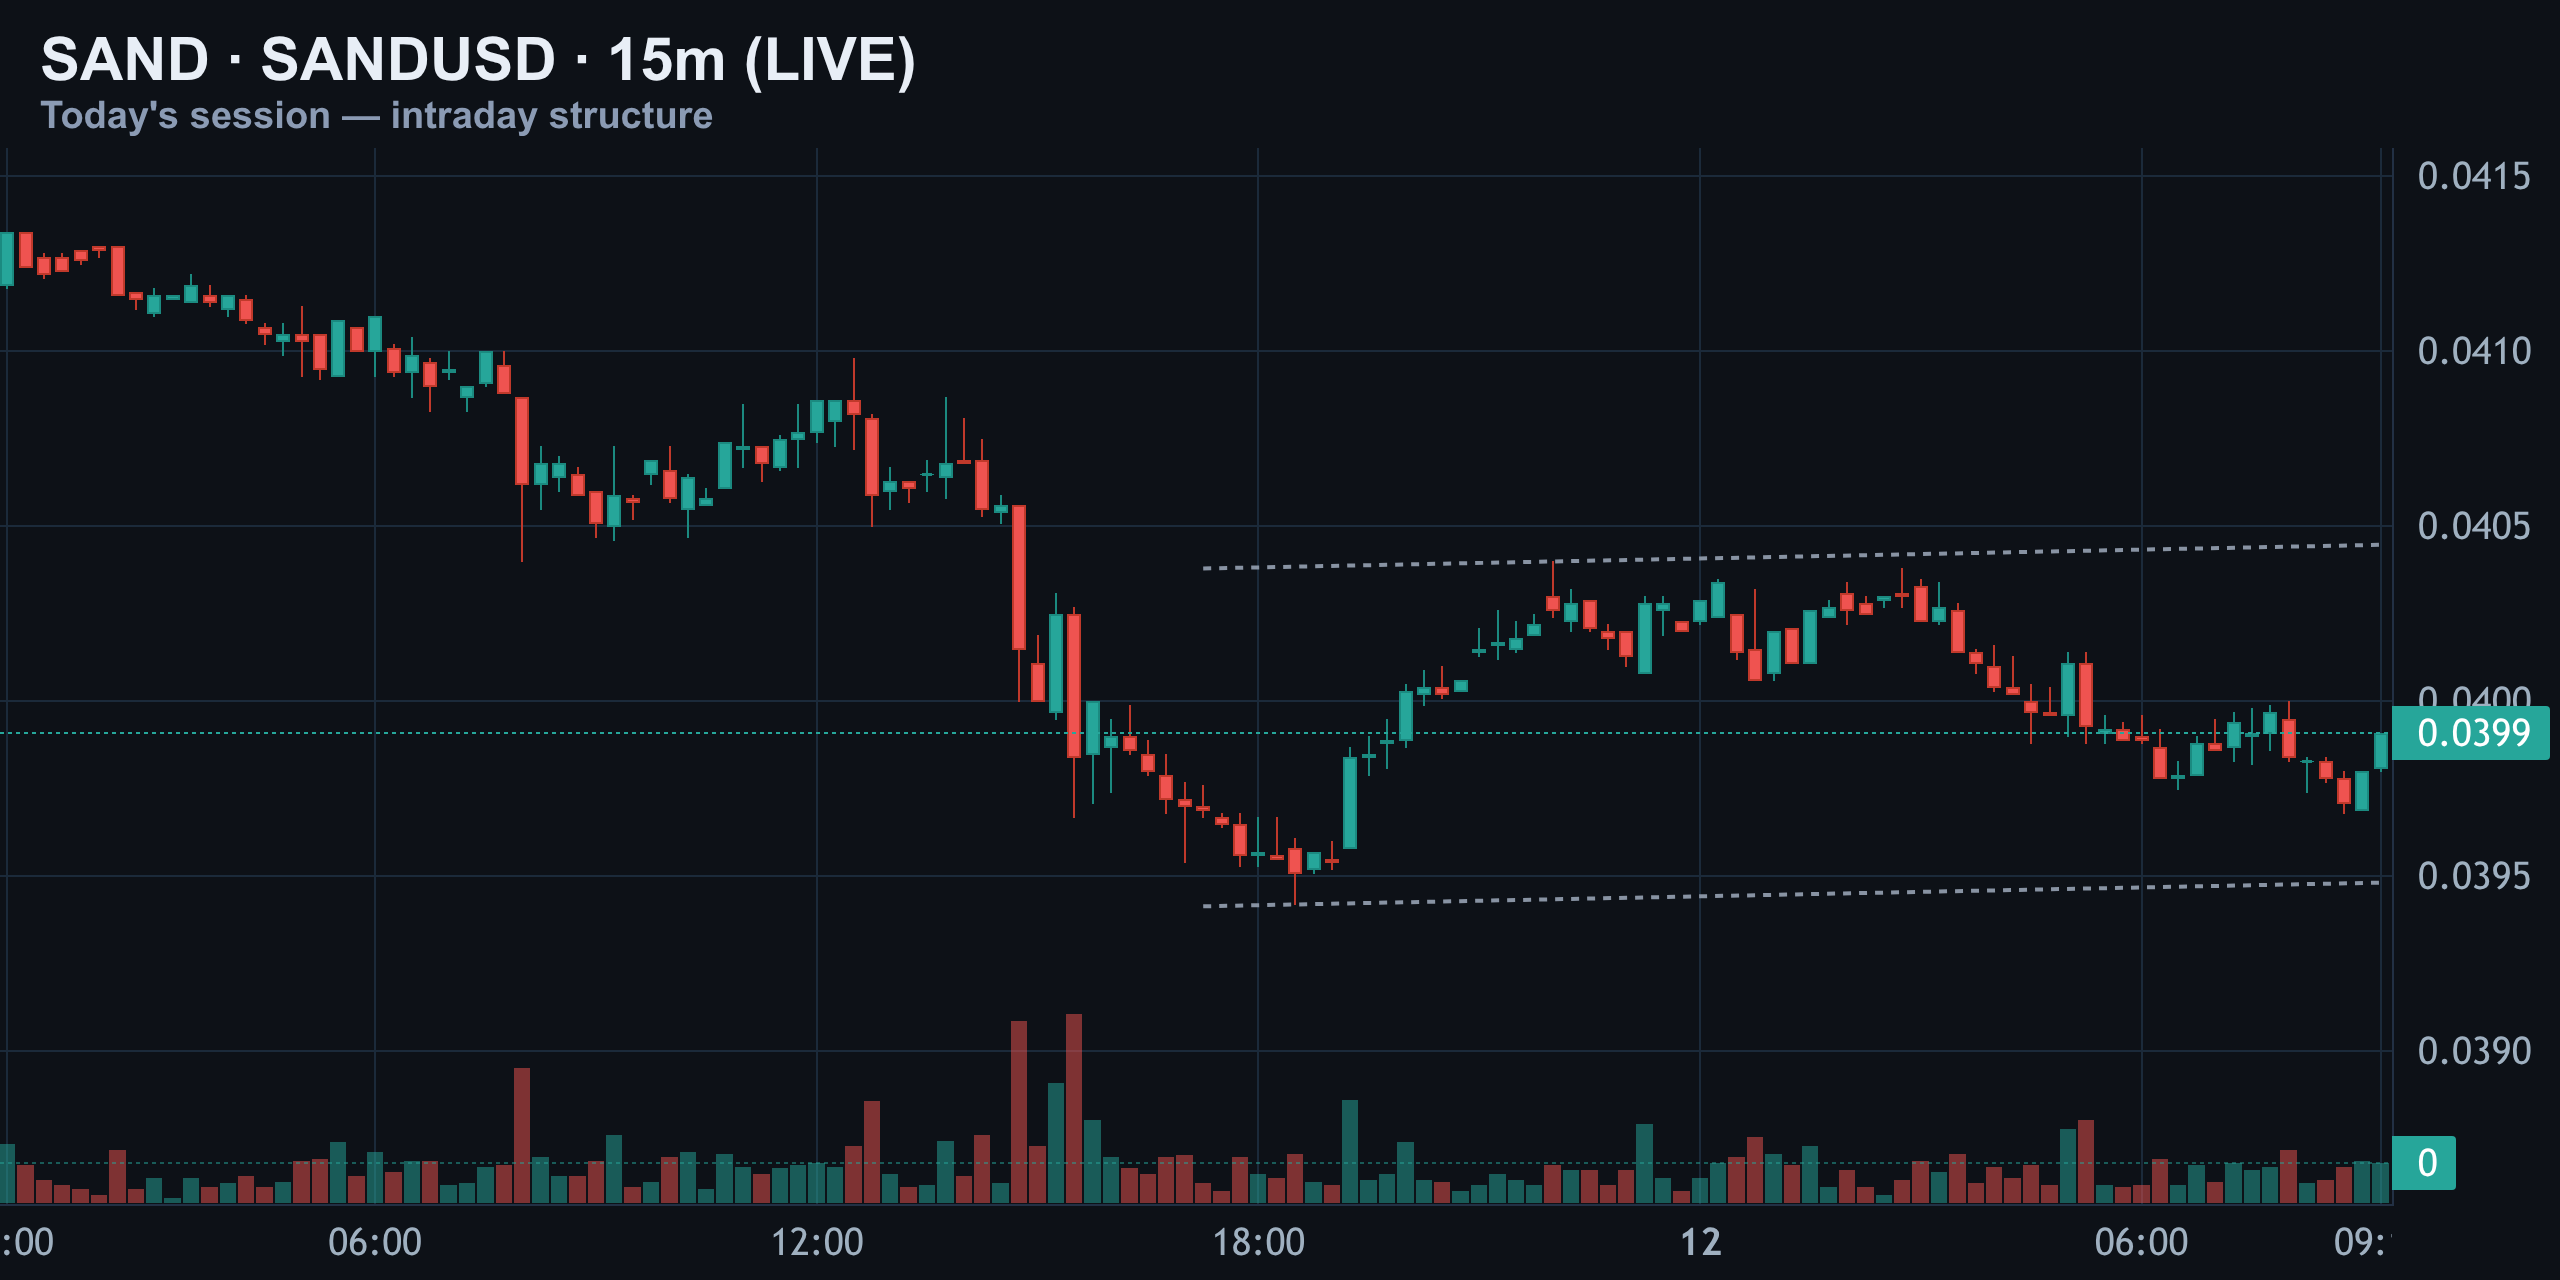
Right now price is parked almost dead-center on the $0.0399 level — which is exactly where SAND closed yesterday. That's indecision, not conviction. The 15-minute chart is effectively waiting for a catalyst, and until one shows up, this range should be treated as noise rather than a tradable trend.
4-Hour Structure: Channel Broken
The bigger 4-hour picture explains why the 15-minute chart feels heavy. SAND has been carving a textbook descending channel since the early-August high near $0.044, and this week price actually broke below the lower rail of that channel — a sign sellers picked up pace, not lost it.
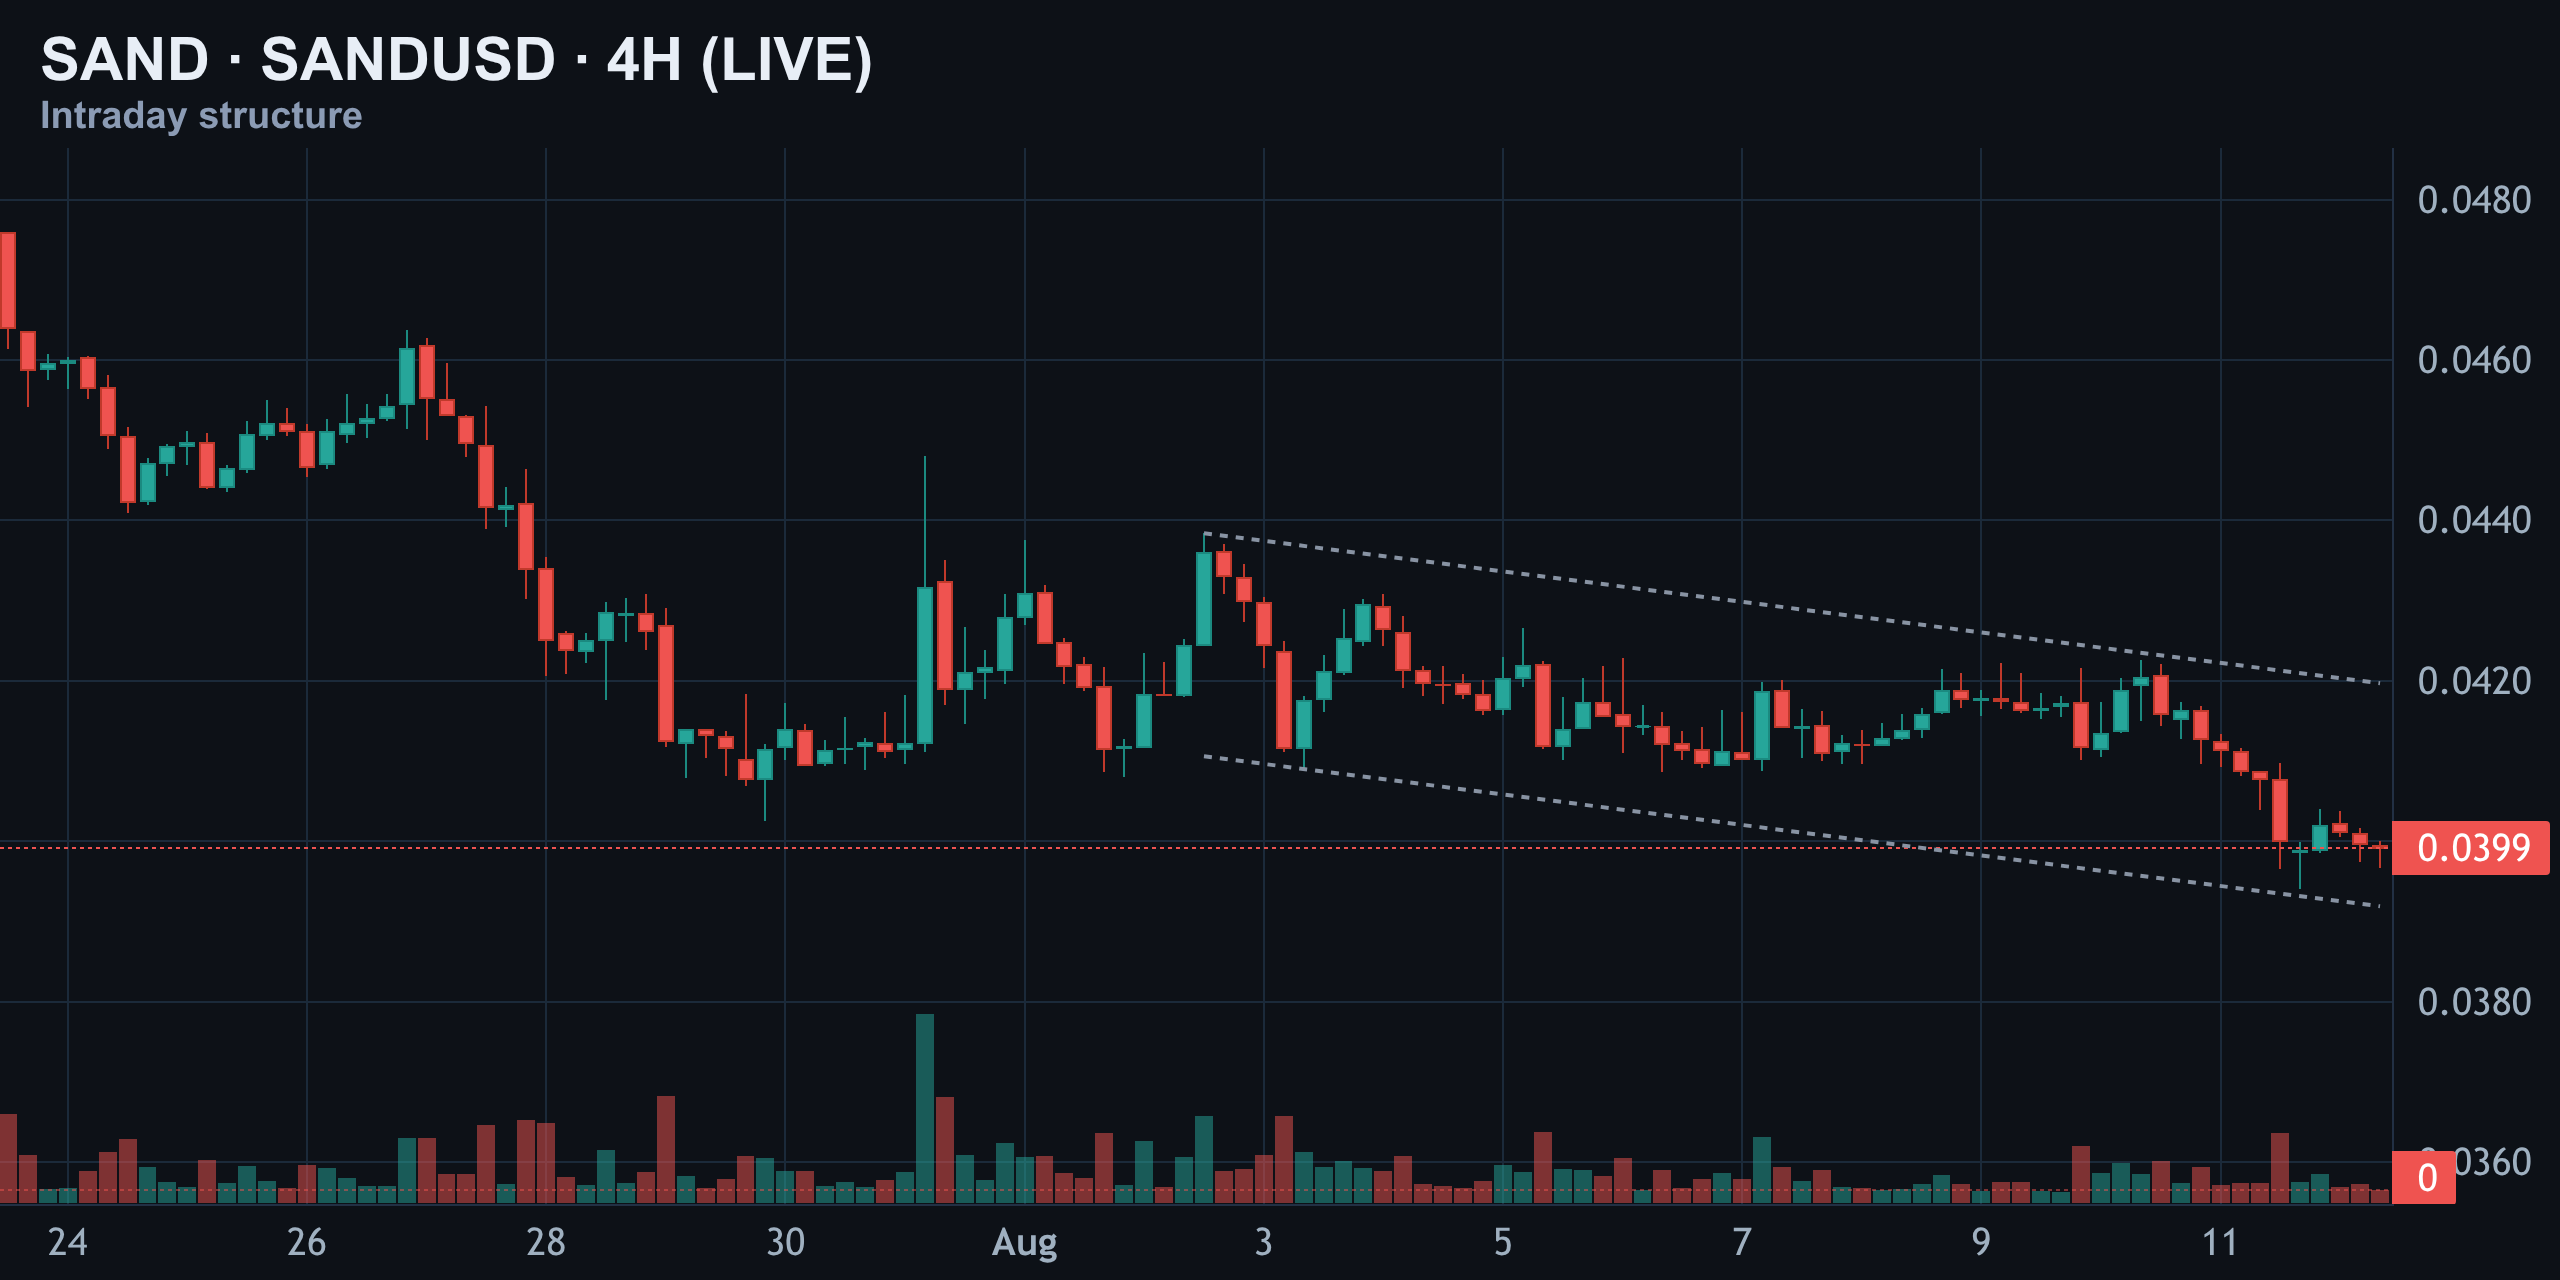
The $0.0399 level you see quoted everywhere used to sit comfortably inside that channel. Now it's perched right at the edge of it, which makes it a fragile pivot rather than genuine support. In plain terms: the downtrend just got a bit steeper on the bigger 4-hour timeframe, and the single 4-hour candle close from here decides a lot.
Daily Timeframe: The Shelf, a Tired RSI, and a Fading MACD
Pull back to daily and the story's been consistent all year: a relentless grind down from the January high near $0.0865 to where SAND sits today. There's a defined support shelf at $0.03942, and price is basically resting right on top of it.
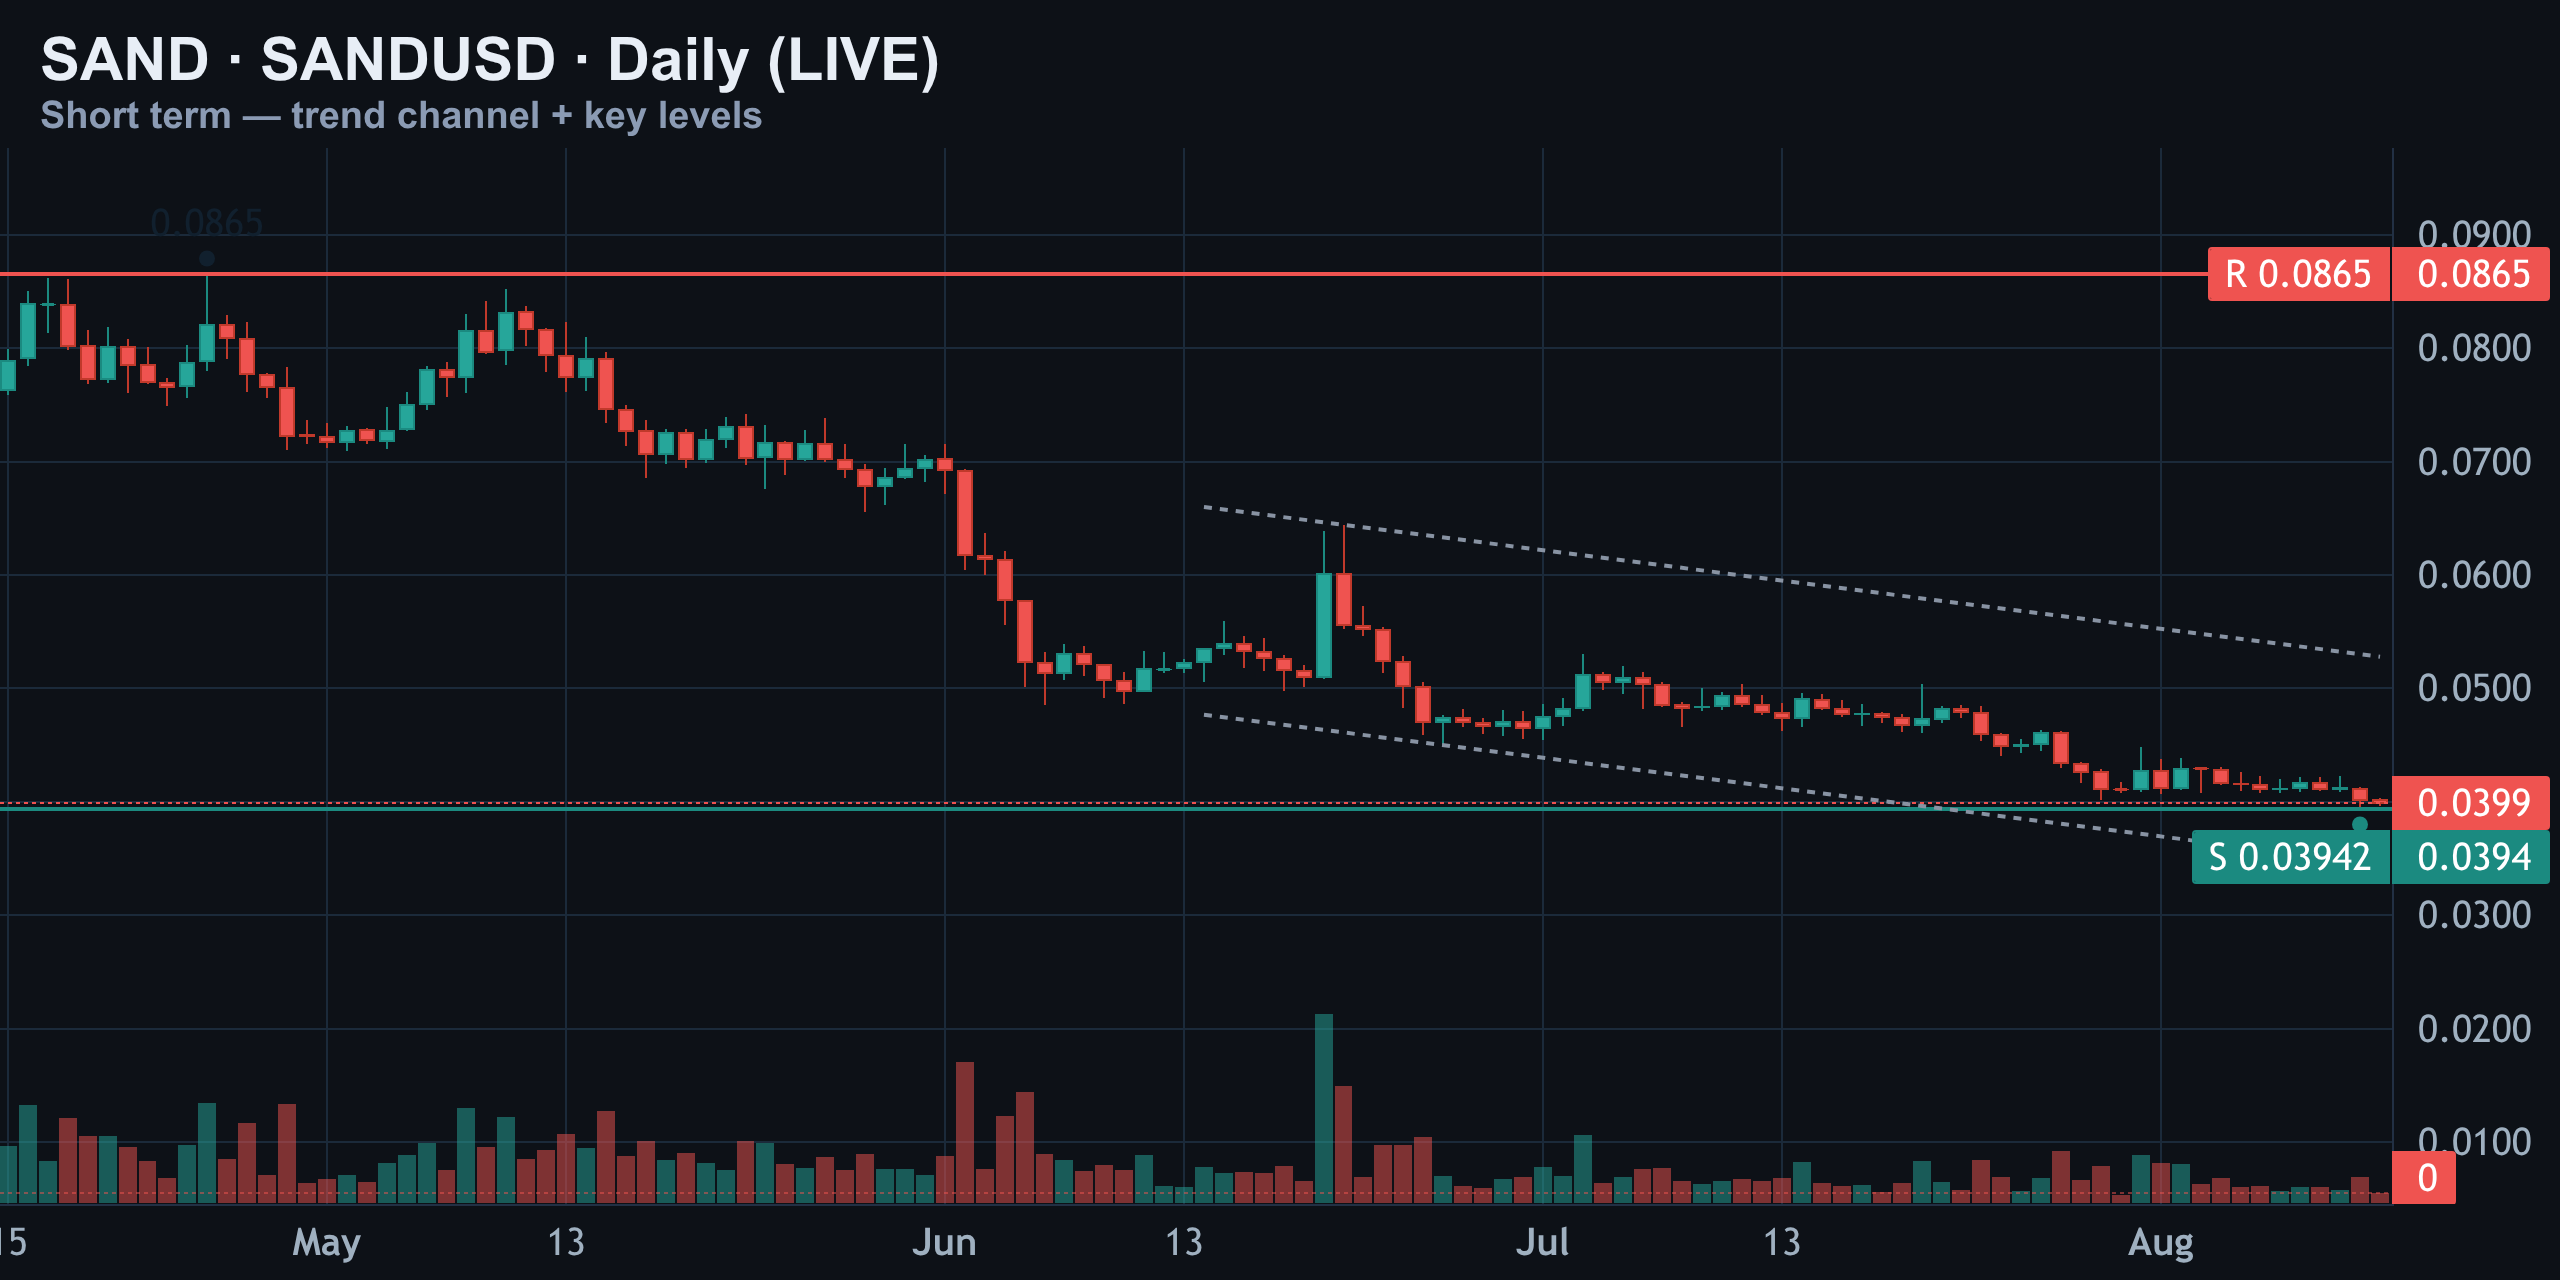
That's the line in the sand, so to speak. Hold it and there's room for a relief bounce; lose it with volume and the next stop is meaningfully lower. So far there's been no reclaim, no confirmation — just a test.
RSI (14): Neutral, Not Oversold
Momentum-wise, the daily RSI sits at 33. That's soft, leaning toward oversold, but nowhere near the sub-25 capitulation reading seen back in June — meaning there's still room for this to get worse before a reflex bounce even becomes likely.
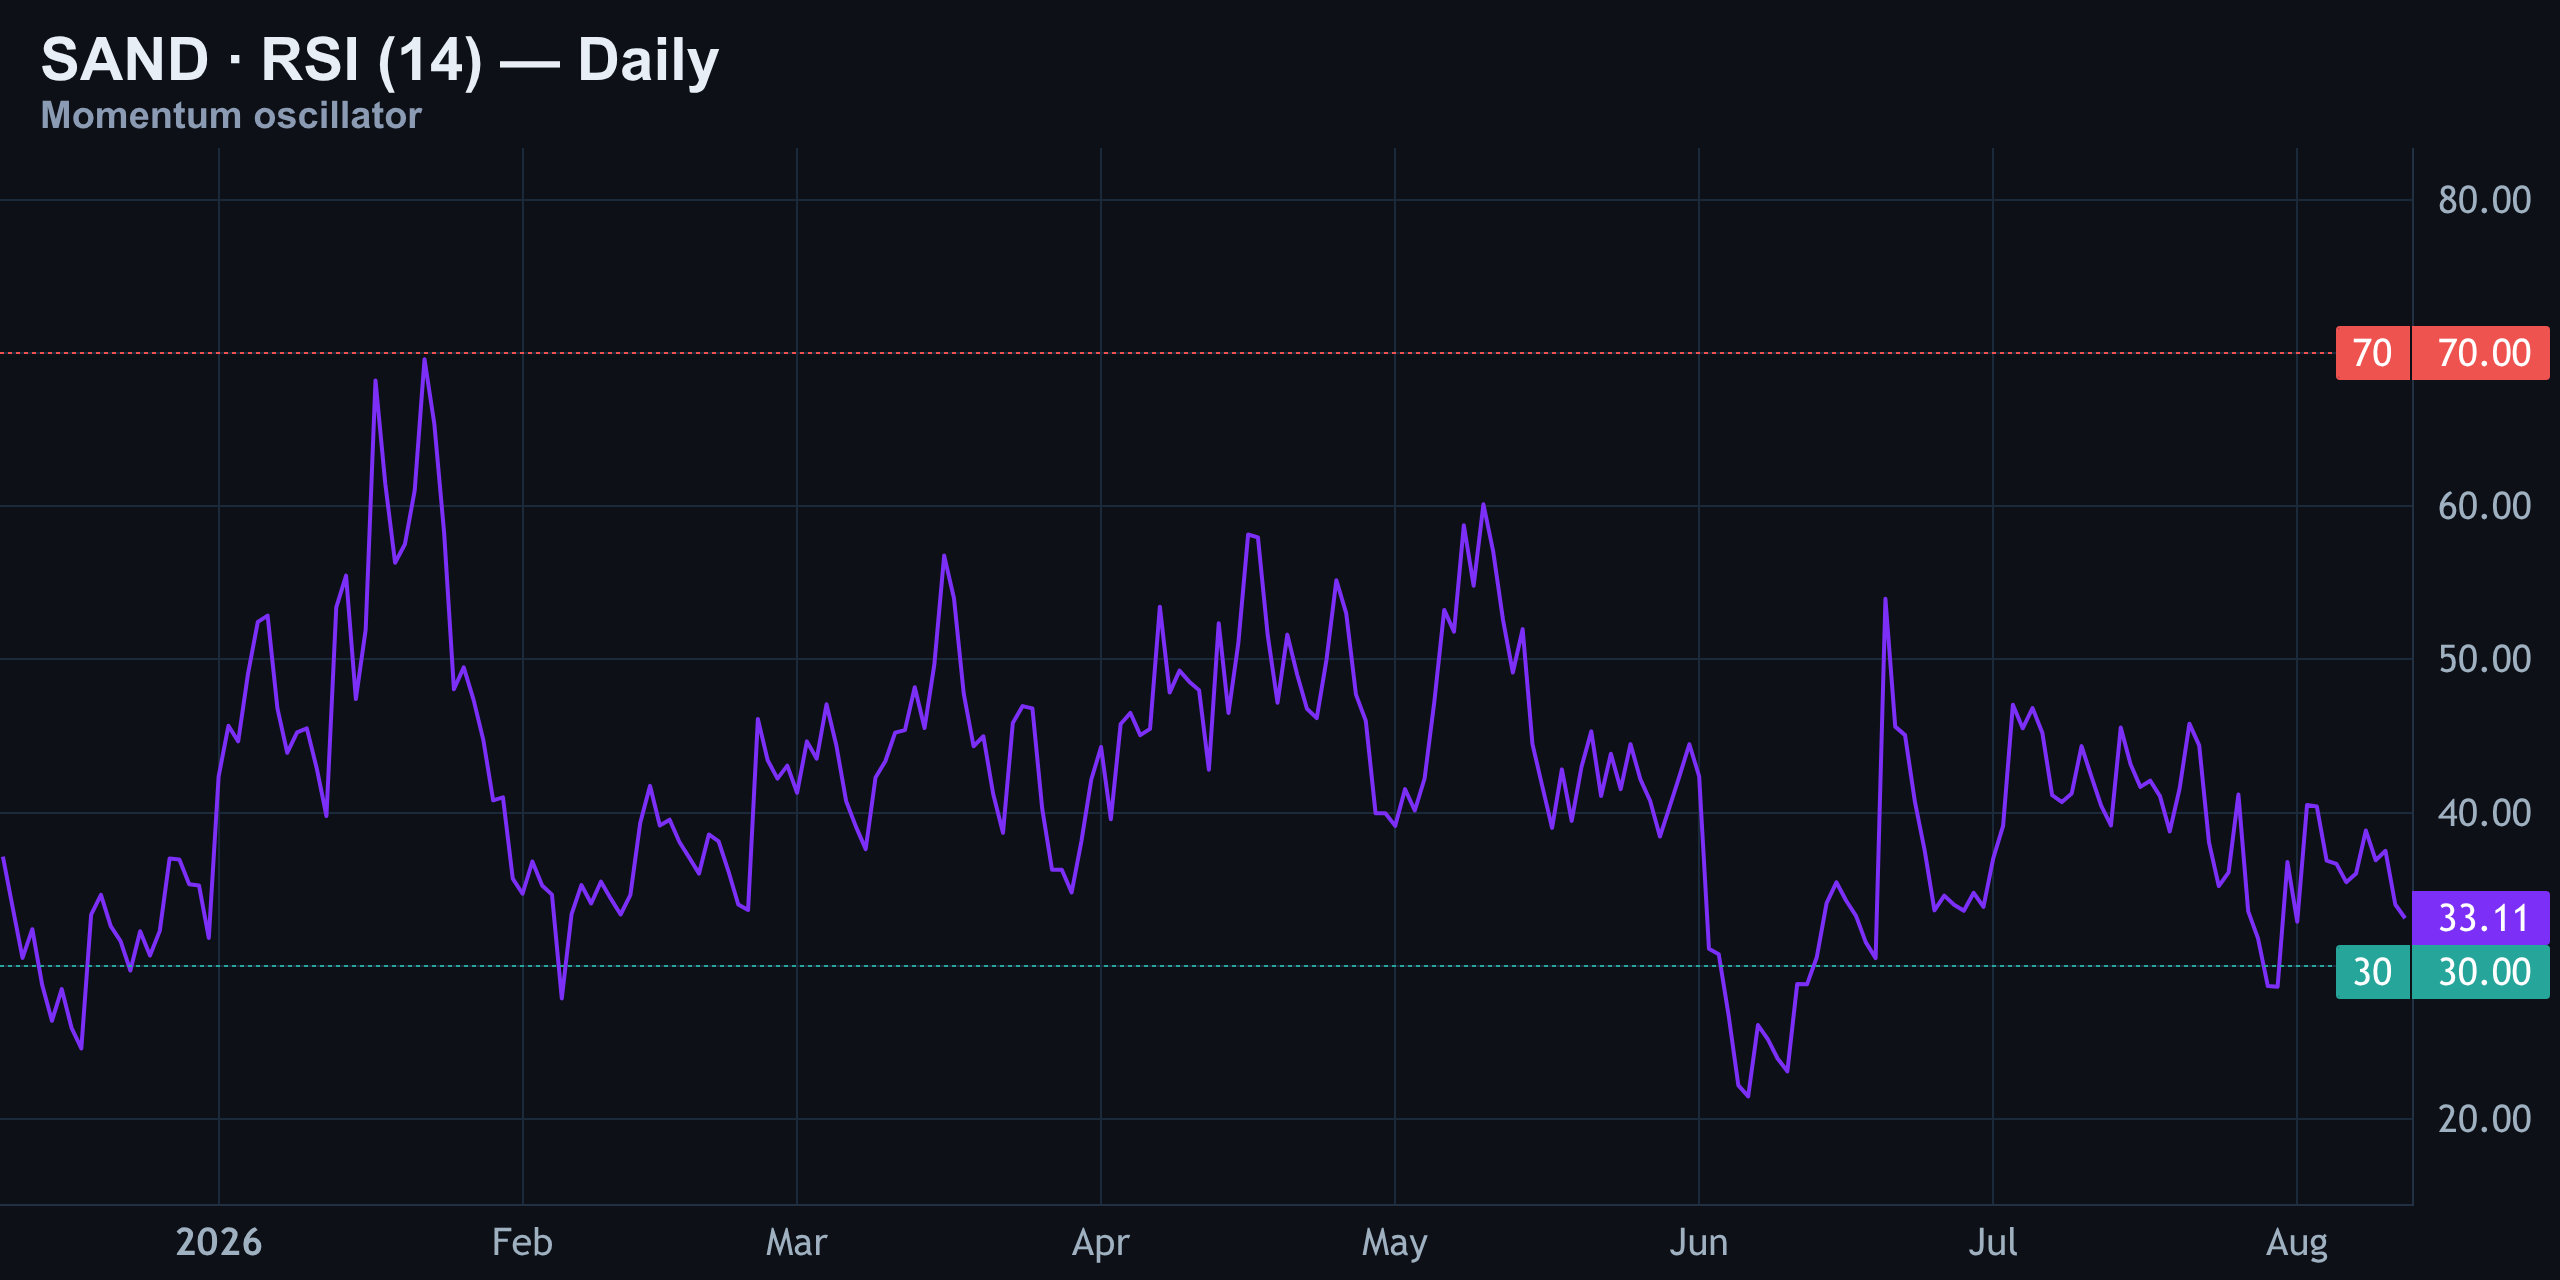
There's also no divergence yet — price is making lower lows and RSI is basically agreeing with it. When you don't see divergence, the trend usually just keeps doing what it's doing.
MACD: Fading Fast Near Zero
The MACD is technically bullish right now — the MACD line sits above the signal line, and the histogram is printing green. But look closer: that green bar is razor-thin, practically touching zero, with both lines converging on the zero mark.
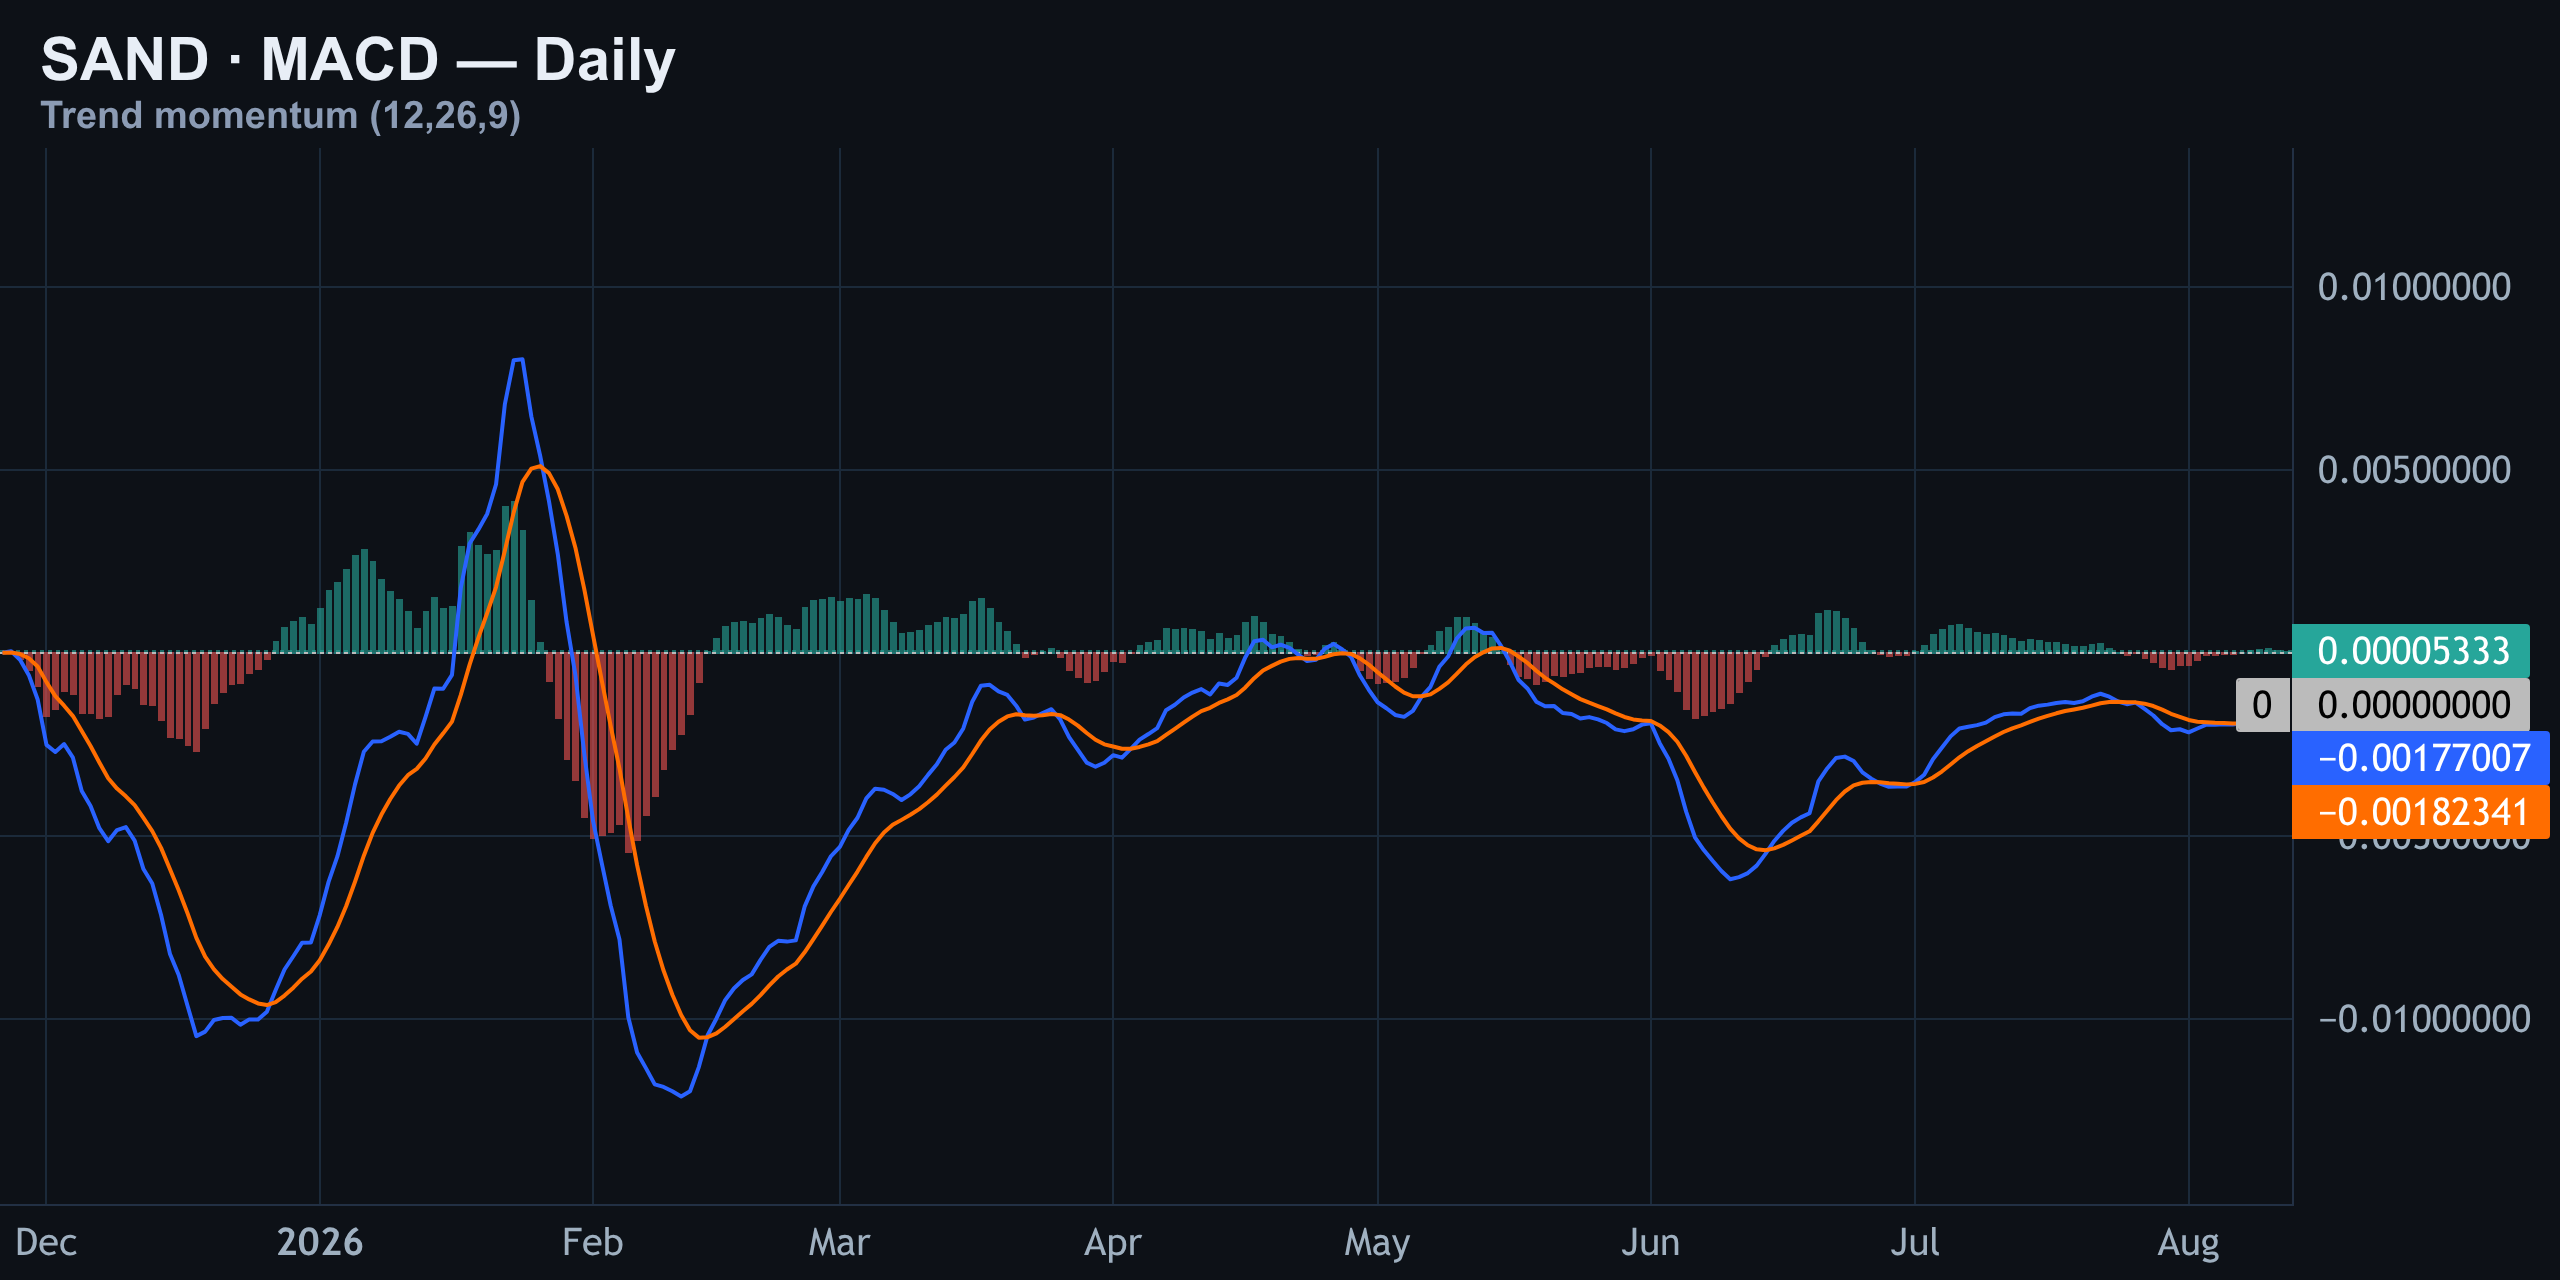
This isn't strong bullish momentum — it's a stall. If SAND rolls over from here, expect that histogram to flip red fast, and fast is the operative word.
Liquidation Heatmap: The Trap Above Spot
Here's the part nobody's talking about. There's a dense wall of liquidations sitting just above current price, and it lines up almost perfectly with where any relief bounce would naturally stall.
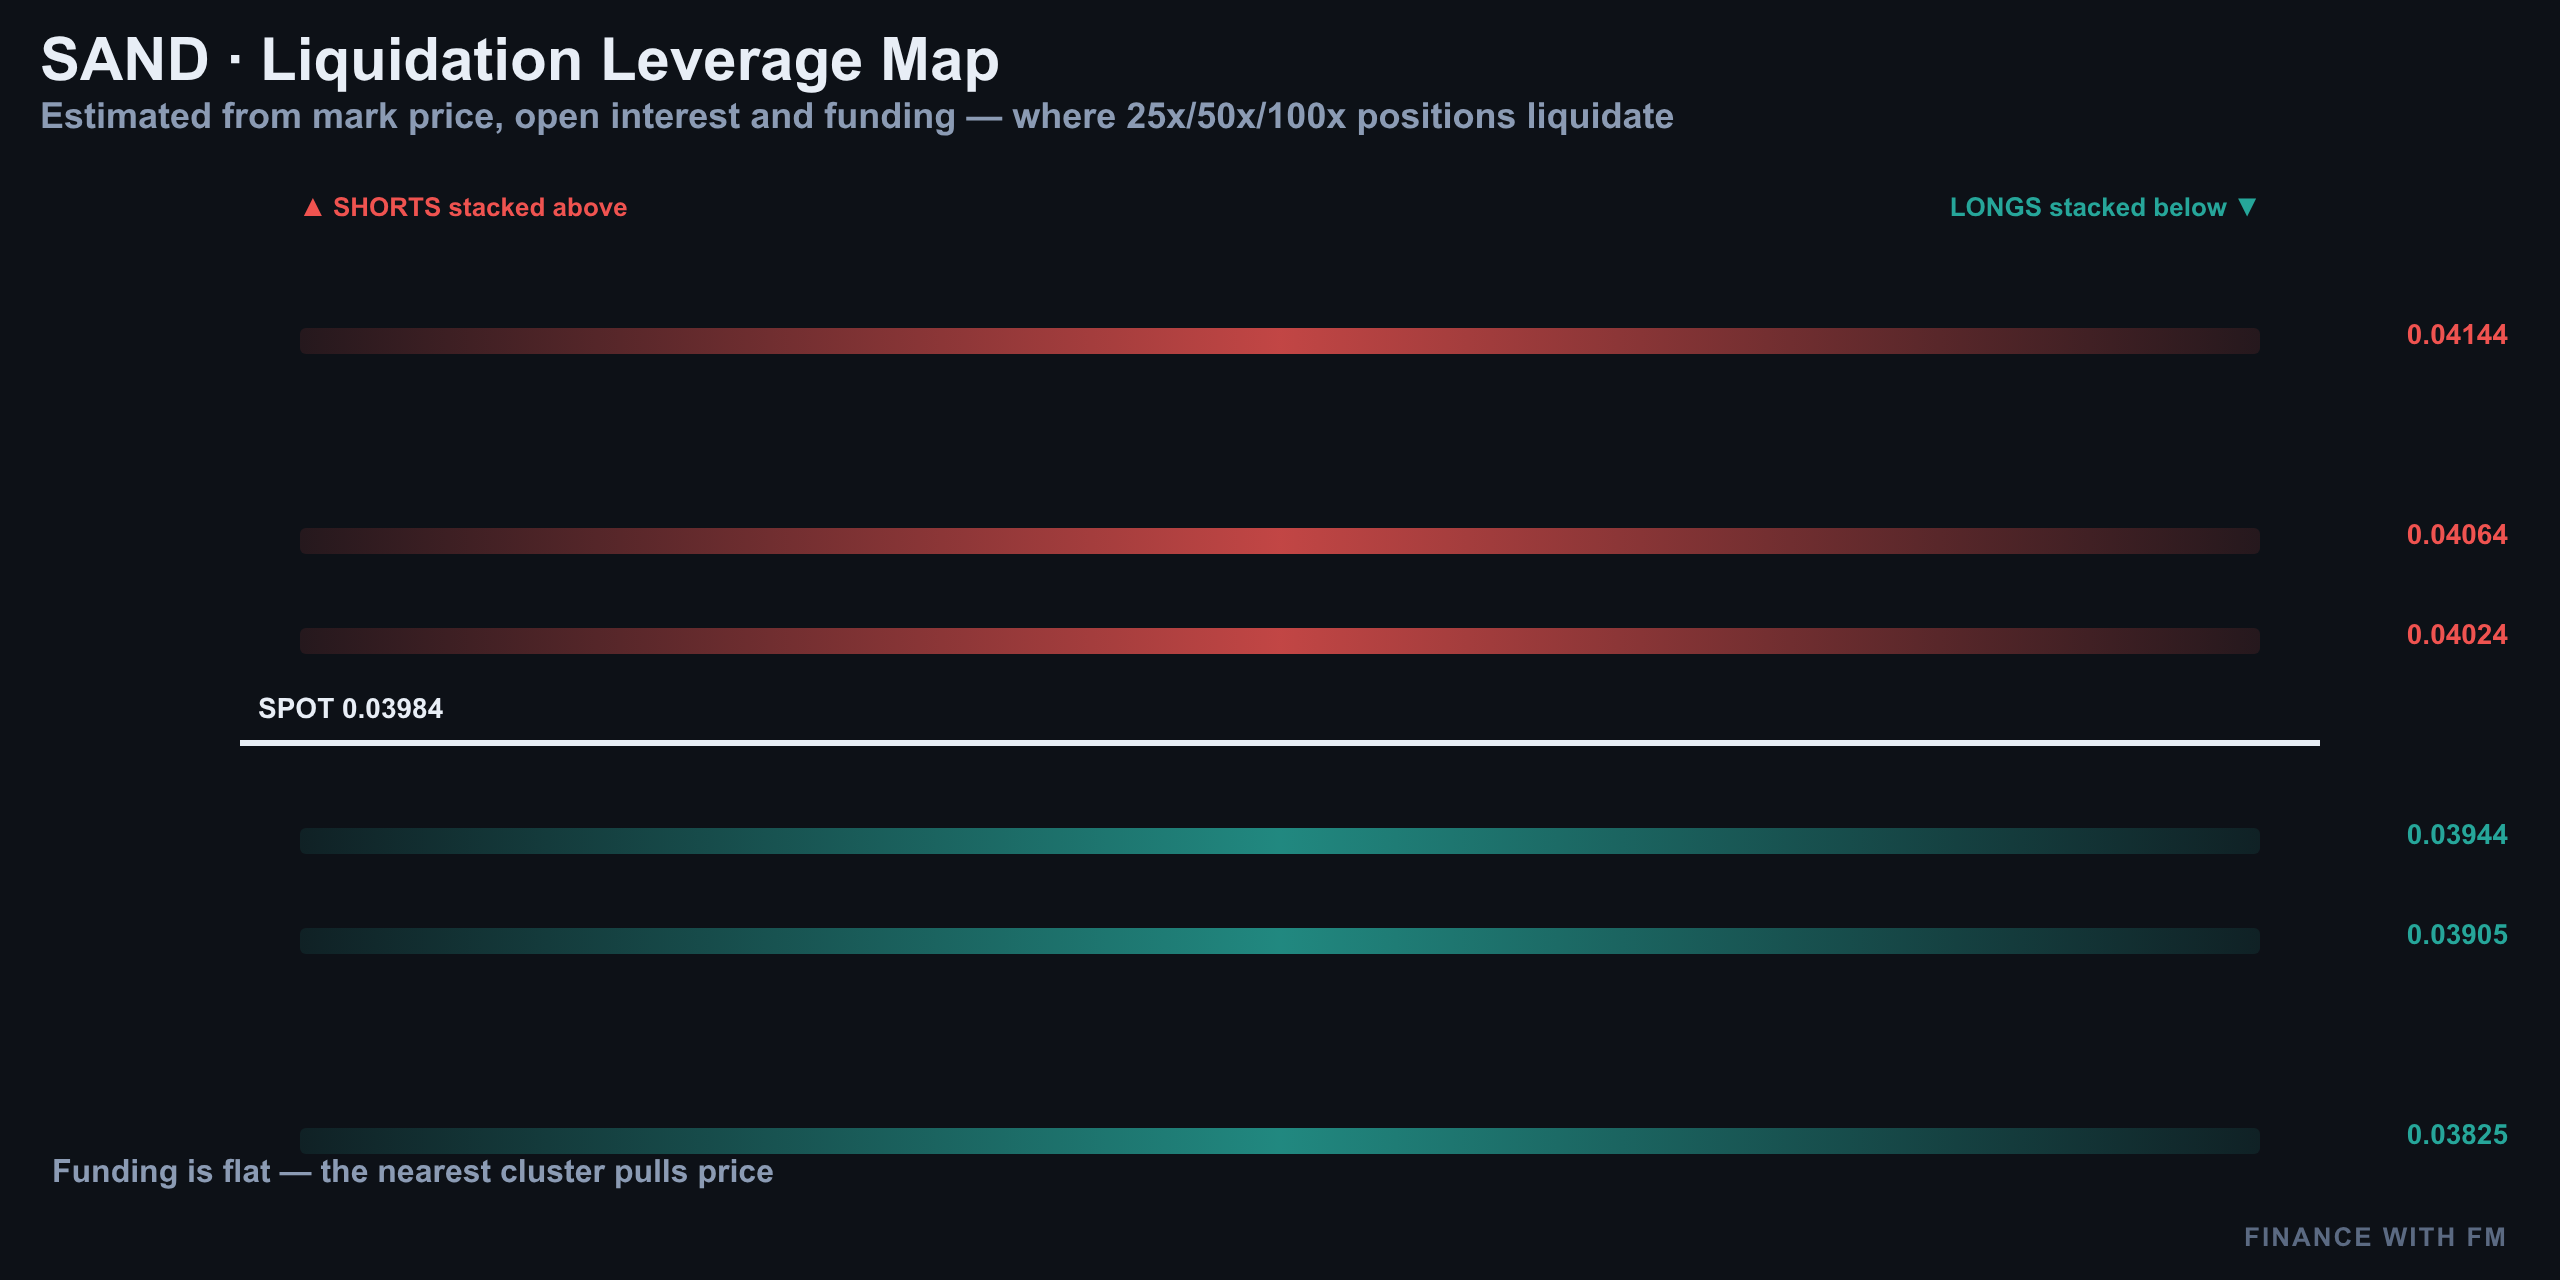
| Level | Price | What it is |
|---|---|---|
| Daily support shelf | $0.0394 | Must-hold floor from early August |
| Nearest resistance / liquidation cluster | $0.0401 | Densest liquidation zone, last two weeks |
| Secondary liquidation cluster | $0.0411 | Second wall of leveraged longs |
| Tertiary liquidation cluster | $0.0427 | Third wall, thinner but present |
| Macro bid wall | $0.031 | Biggest resting bid on the book |
| Macro ask wall | $0.077 | Biggest resting ask on the book |
| Macro ceiling (Jan 2026 high) | $0.0865 | Long-term marker, not relevant intraday |
In plain terms: $0.0394 is the line that has to hold, and $0.0401–$0.0427 is a stacked trap for anyone chasing a bounce. Way down at $0.031 sits the biggest bid wall on the book, and up at $0.077 the biggest ask wall — neither relevant today, but useful map markers for where liquidity actually lives.
Positioning & Order Flow: A Mismatch Worth Watching
Funding is basically flat — near zero percent annualized — so there's no crowded side getting squeezed by cost of carry. Open interest sits around 121 million SAND tokens, up modestly over the week, meaning traders are adding size, not fleeing.
| Metric | Reading | Read-through |
|---|---|---|
| Retail long/short ratio | 1.33 | Net long |
| Top-trader long/short ratio | 1.38 | Net long, aligned with retail |
| Taker buy/sell ratio | 0.76 | Sellers hitting bids aggressively |
| Funding rate | ~0% APR | Flat — no crowded squeeze pressure |
| Open interest | ~121M SAND | Up on the week — size being added |
| Coinbase vs. Binance premium | +0.125% | Coinbase trading at a premium |
Here's the catch: both retail and top-trader accounts are long-leaning, yet taker flow shows sellers hitting bids aggressively — a 0.76 buy-sell ratio. That's a mismatch. Positioned long, but actively selling into it — a setup that can unwind fast if support cracks. Because retail and top traders are aligned (not fighting each other), there's no obvious "fade the crowd" edge from positioning alone right now.
One more wrinkle: Coinbase is trading at a +0.125% premium versus Binance. A persistent positive premium is typically the fingerprint of US spot and ETF-linked demand — institutions bidding even as the broader tape sells off. It's not enough to flip the picture bullish today, but it's the kind of divergence worth tracking if it widens.
The Setup: Entry, Stop, Target — 1:2.5, Not Advice
Putting it together: SAND is heavy on every timeframe that matters — lower highs on the 4-hour, a broken channel, price sitting on a fragile daily shelf, momentum soft but not yet capitulating, and a stacked liquidation wall right above spot that would cap any bounce attempt. The trigger is a clean 4-hour close below $0.0394.
| Parameter | Level |
|---|---|
| Bias | Bearish, conditional on the trigger |
| Trigger | 4H close below $0.0394 shelf |
| Entry | ~$0.0392 on a retest of the broken shelf |
| Stop loss | $0.0411 (above the liquidation cluster) |
| Target | ~$0.0345 (next liquidity pocket) |
| Risk:Reward | 1:2.5 |
| Invalidation | Reclaim of $0.0401 with volume flips bias bullish |
The kill switch on this whole trade is simple: a 4-hour close back above $0.0401 with real volume. That would mean buyers absorbed the shelf test and are pushing straight into the liquidation cluster instead of getting trapped by it — at which point this bearish read is dead and a squeeze toward $0.0411–$0.0427 becomes the more likely story.
Summary
- SAND trades at $0.03984, down ~2% on the day, after tagging a low near $0.0394
- The 4-hour channel has broken to the downside — the steeper trend is now the base case
- RSI at 33 is soft but not oversold; MACD is technically green but fading toward zero
- A dense liquidation wall sits at $0.0401–$0.0427 — the real trap for any bounce
- Retail and top traders are both net long, but taker flow is sell-skewed — a mismatch that can unwind fast
- The trade: short on a confirmed break of $0.0394, stop $0.0411, target $0.0345, for a 1:2.5 reward-to-risk
Until buyers reclaim the mid-$0.0399s with volume, this reads as controlled distribution, not a bottom. We'll be back tomorrow with the next Daily Pulse to see whether that 4-hour candle closed the way the setup expects.
08/11/2026 — SAND Daily Pulse: Crowded Shorts, No Clean Trade Aug 11
SAND Daily Pulse: Crowded Shorts, No Clean Trade Aug 11
SAND Sits on the Line: The Setup for August 11
SAND is trading around $0.04073, down roughly 2.5% on the day, parked almost exactly on daily support after a session that broke a short-term channel and then stalled. Recent closes on major trackers put SAND between $0.0411 and $0.0421 over the past week, confirming the grind lower has been steady rather than sharp.
The setup today is genuinely two-sided. On one hand, the four-hour chart is still carving lower highs inside a descending channel, and taker flow says sellers remain in control right now. On the other hand, funding is paying shorts to stay short — a classic squeeze-fuel signal — and Coinbase is quietly bidding at a premium to Binance even as the candle prints red. CoinMarketCap's latest read on SAND flags the same daily descending trendline near $0.0418, with resistance at $0.048609 and support at $0.040425 — almost identical to the zone the desk is watching today.
15-Minute Intraday: The Channel Break That Matters Right Now
Zoom into today's session and SAND spent hours chopping inside a tight descending channel. Sellers then broke it, punching price down toward $0.0406 before dip buyers stepped in. Price is now consolidating around $0.0407 — sitting directly on top of where that channel support used to be.
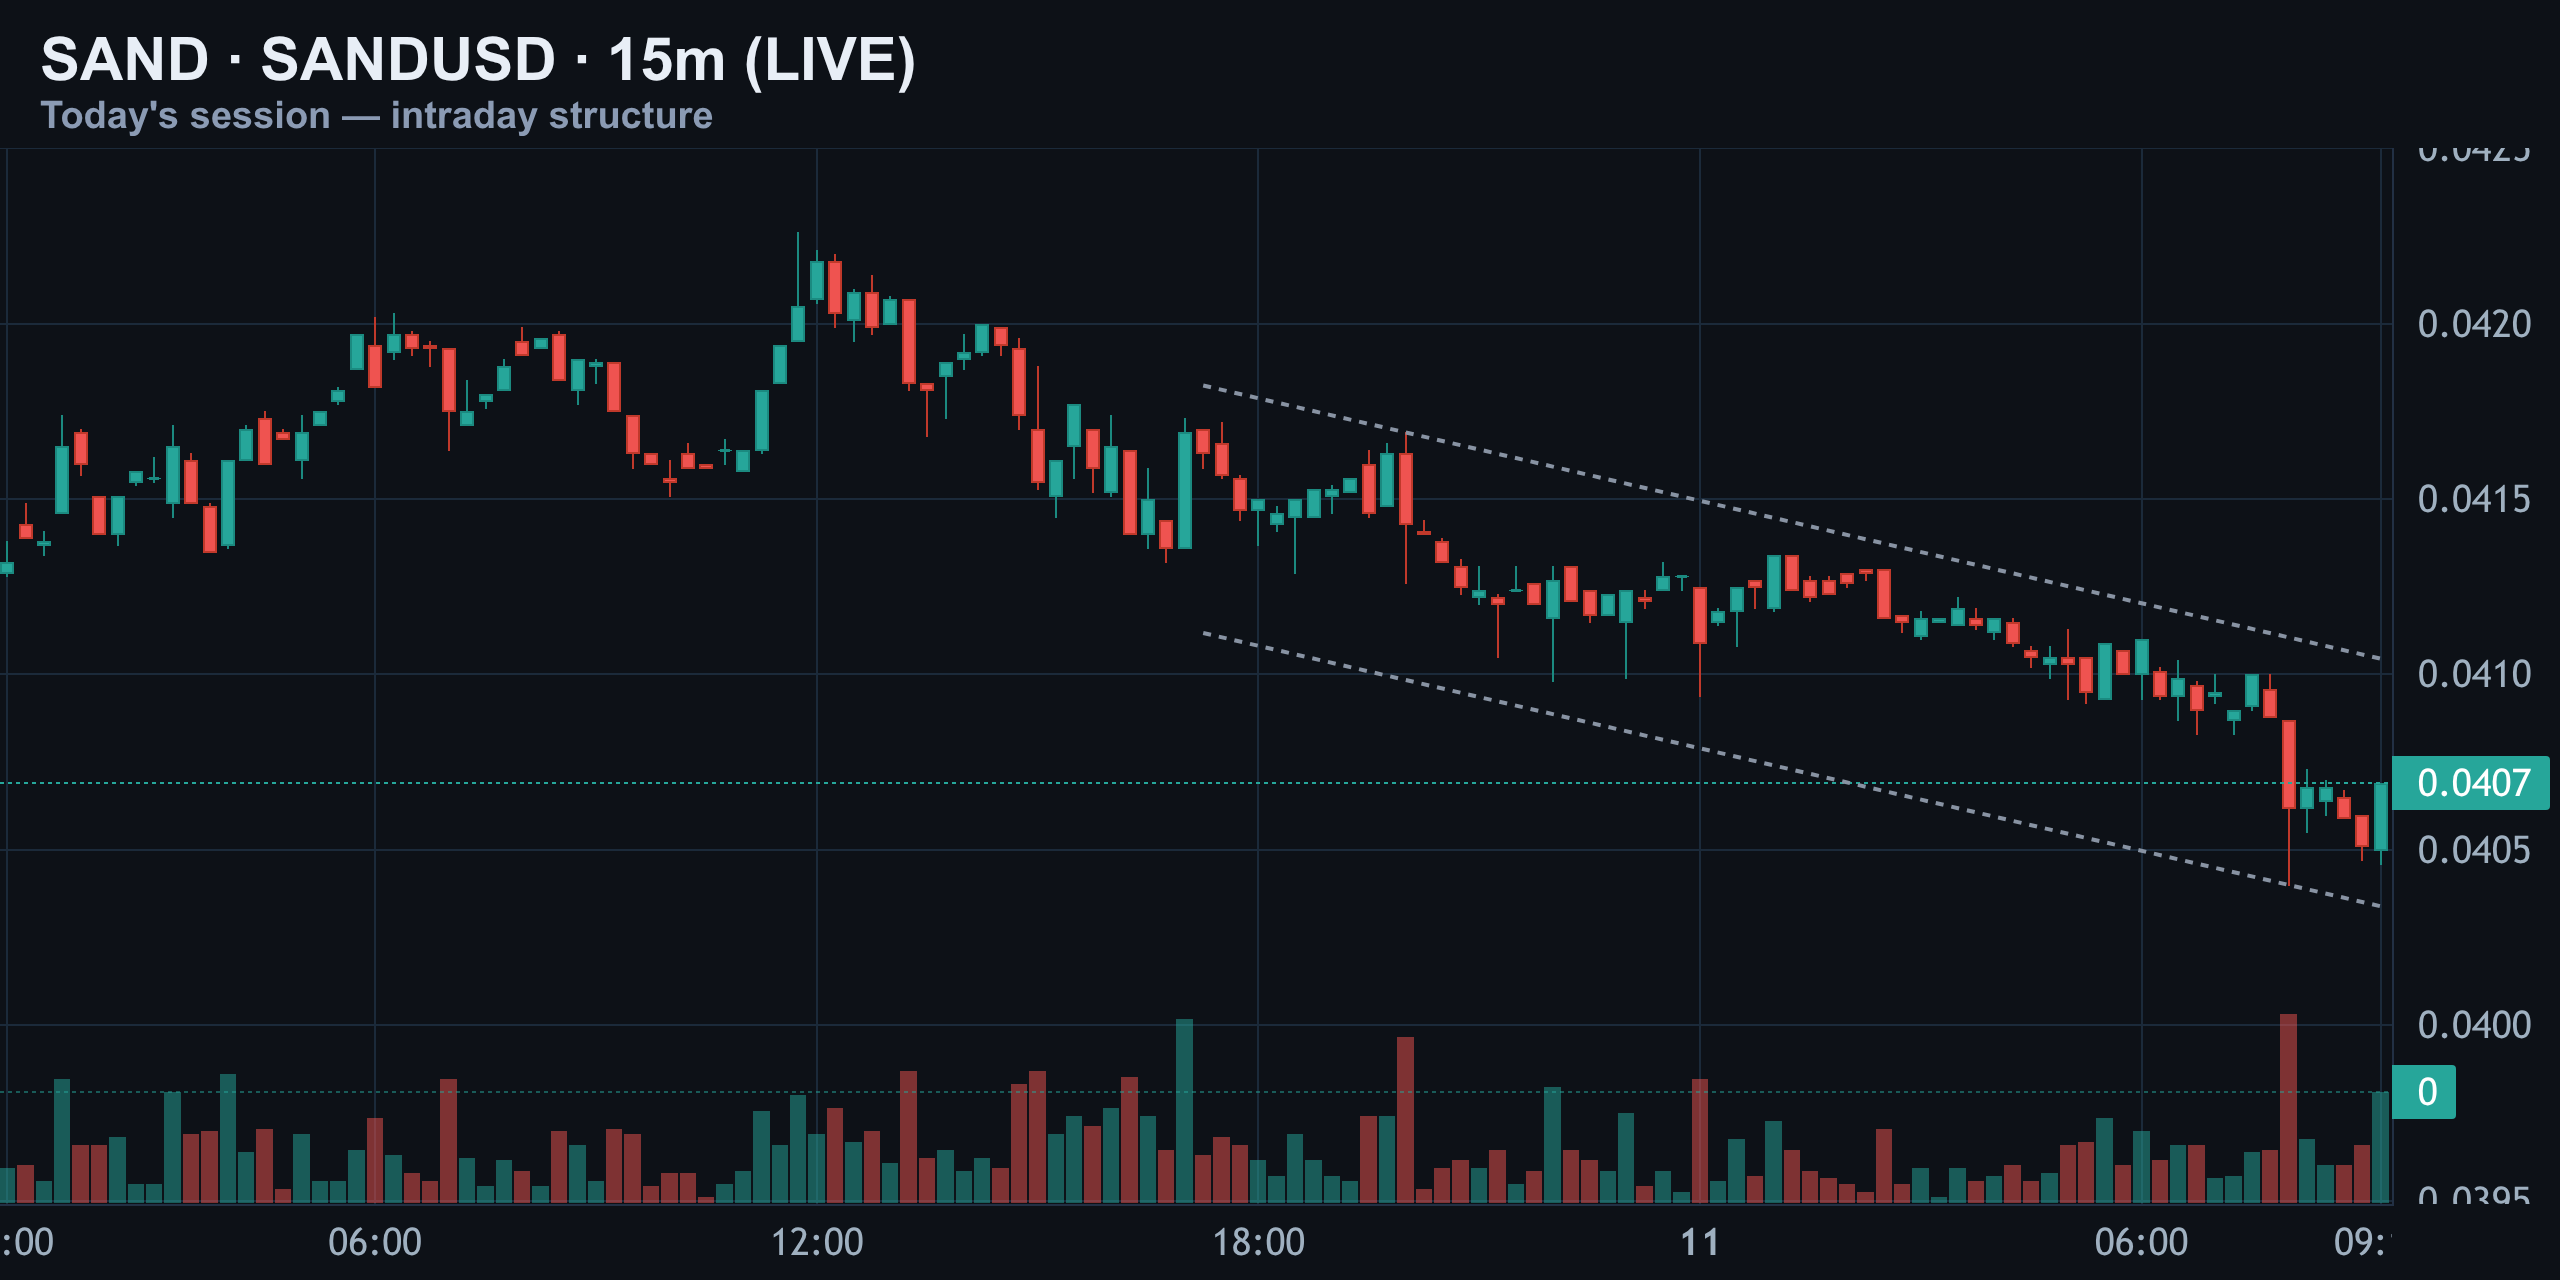
This matters because broken support often flips into resistance on the retest. How SAND behaves over the next few candles — reclaiming that level cleanly versus getting rejected back down — tells you whether this was a shakeout or the start of something heavier.
4-Hour Structure: Lower Highs Since Early August
Stepping back to the four-hour timeframe, SAND has carved a clean descending channel since early August, and every rally inside it has topped out lower than the last. Price is currently pressing directly against the bottom rail near $0.0407.
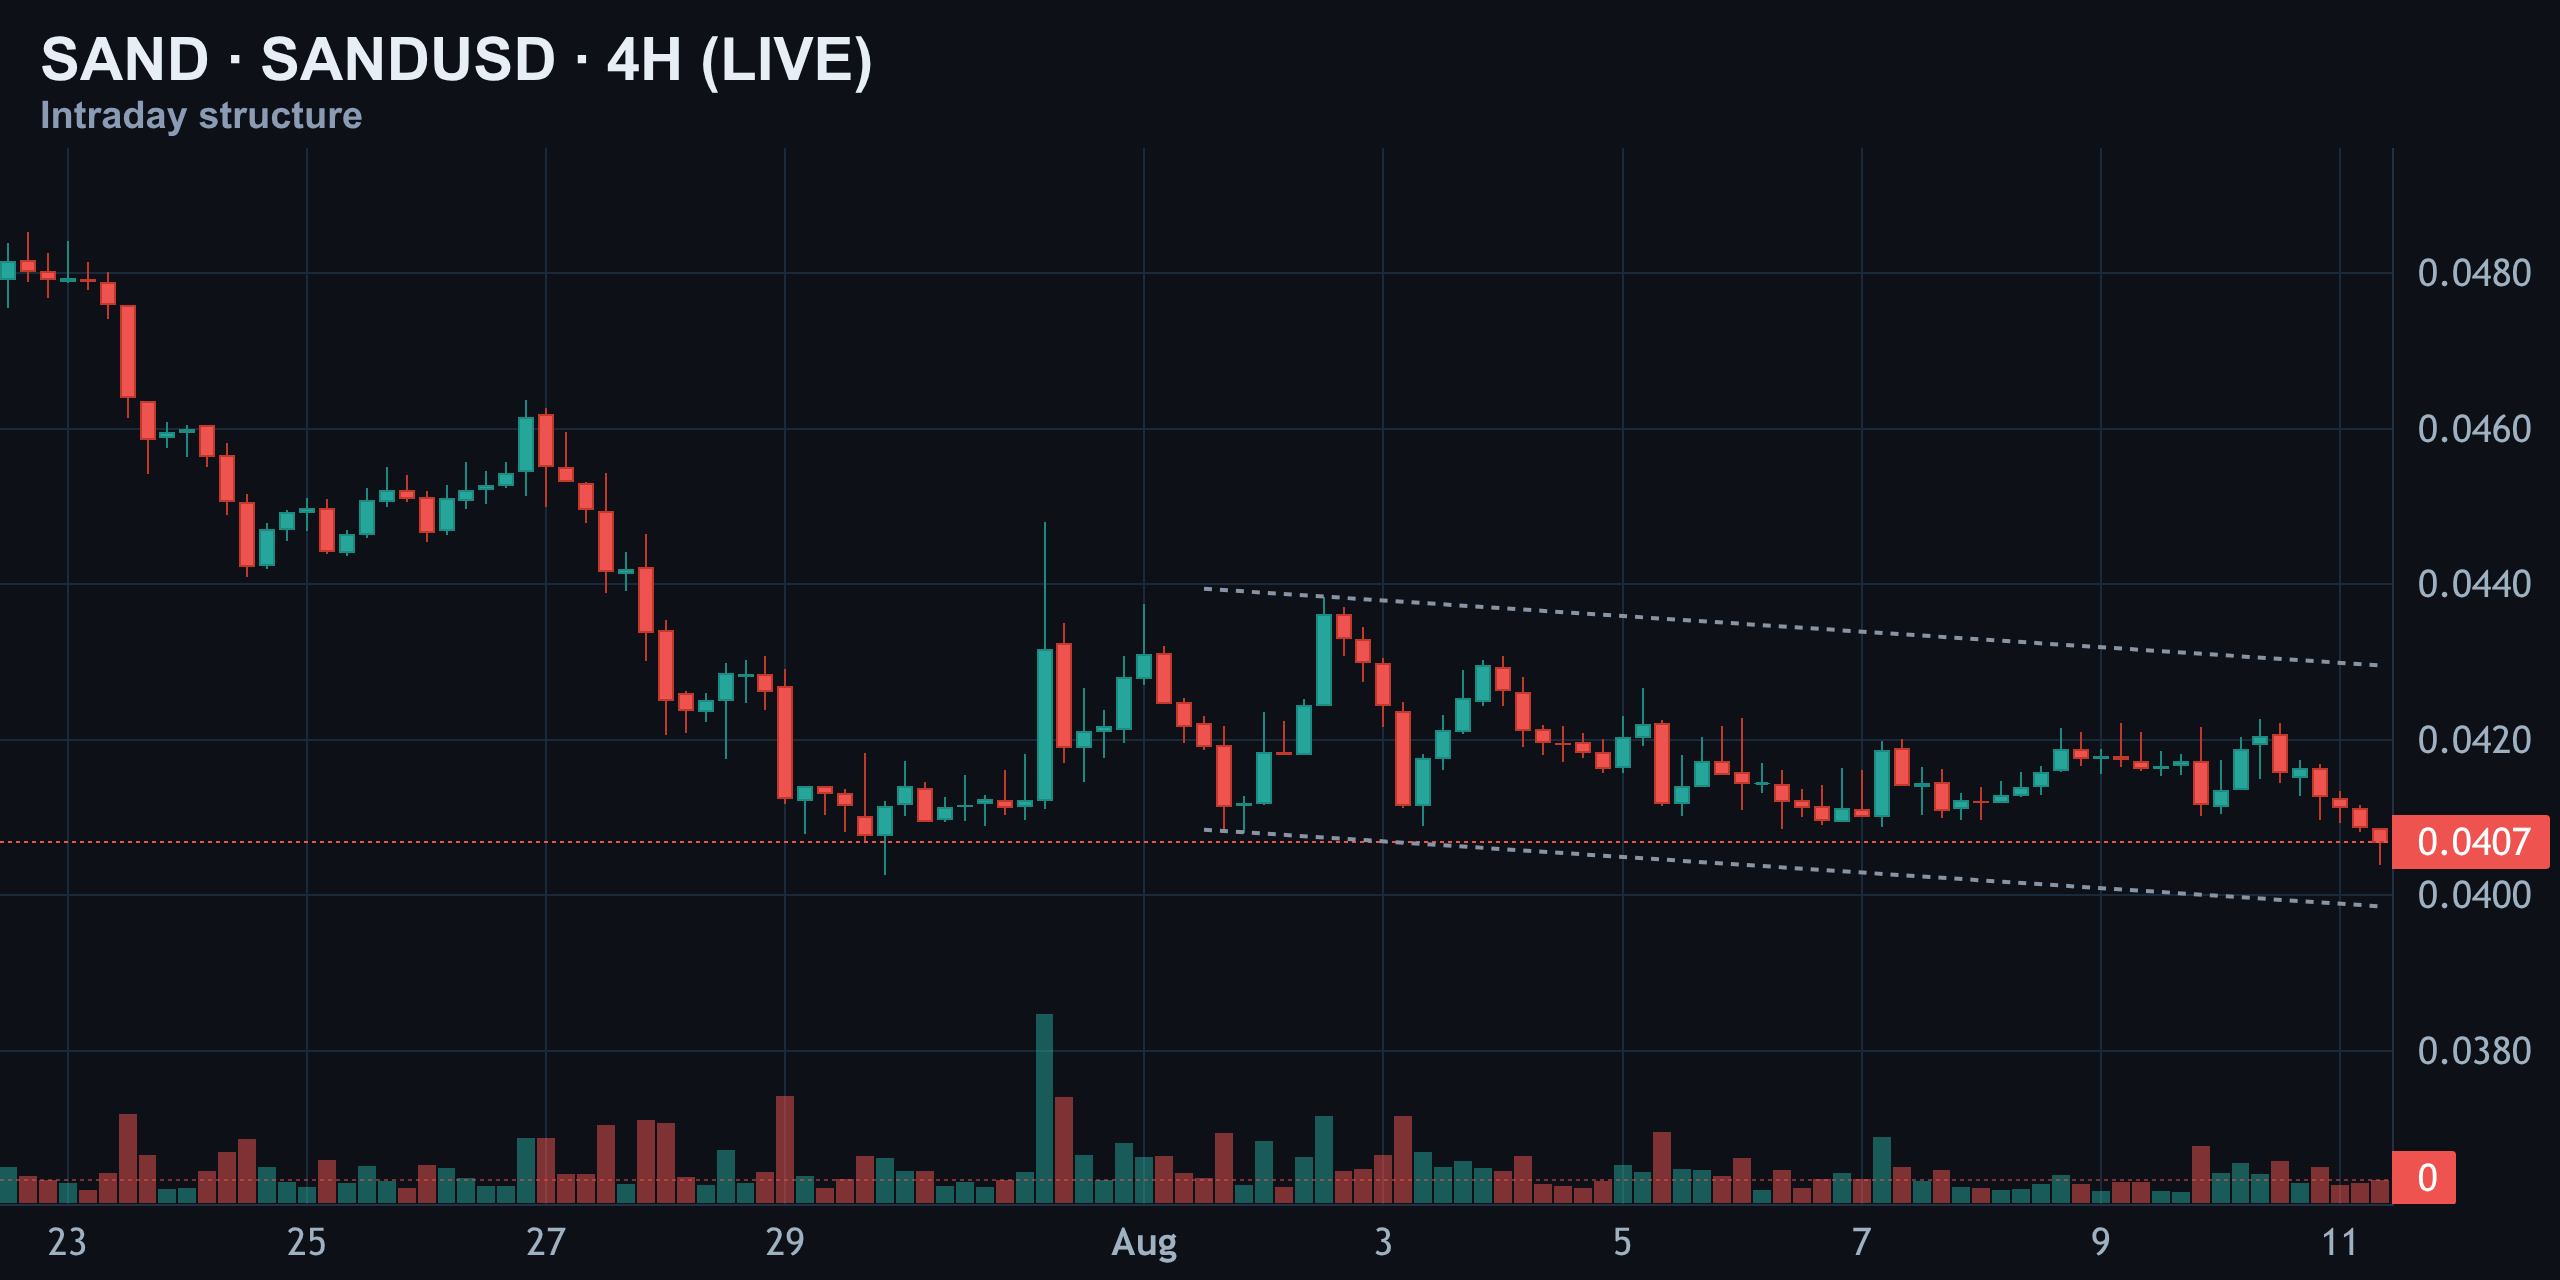
This isn't just chart geometry. The same zone lines up with recent liquidation clearing around $0.0411 just above spot and $0.0406 just below it — ground the market has already fought over with real leverage. Hold this rail and a bounce toward mid-channel opens up; lose it and the channel's lower boundary becomes the next magnet.
Daily Chart: Trapped Between Resistance and Support
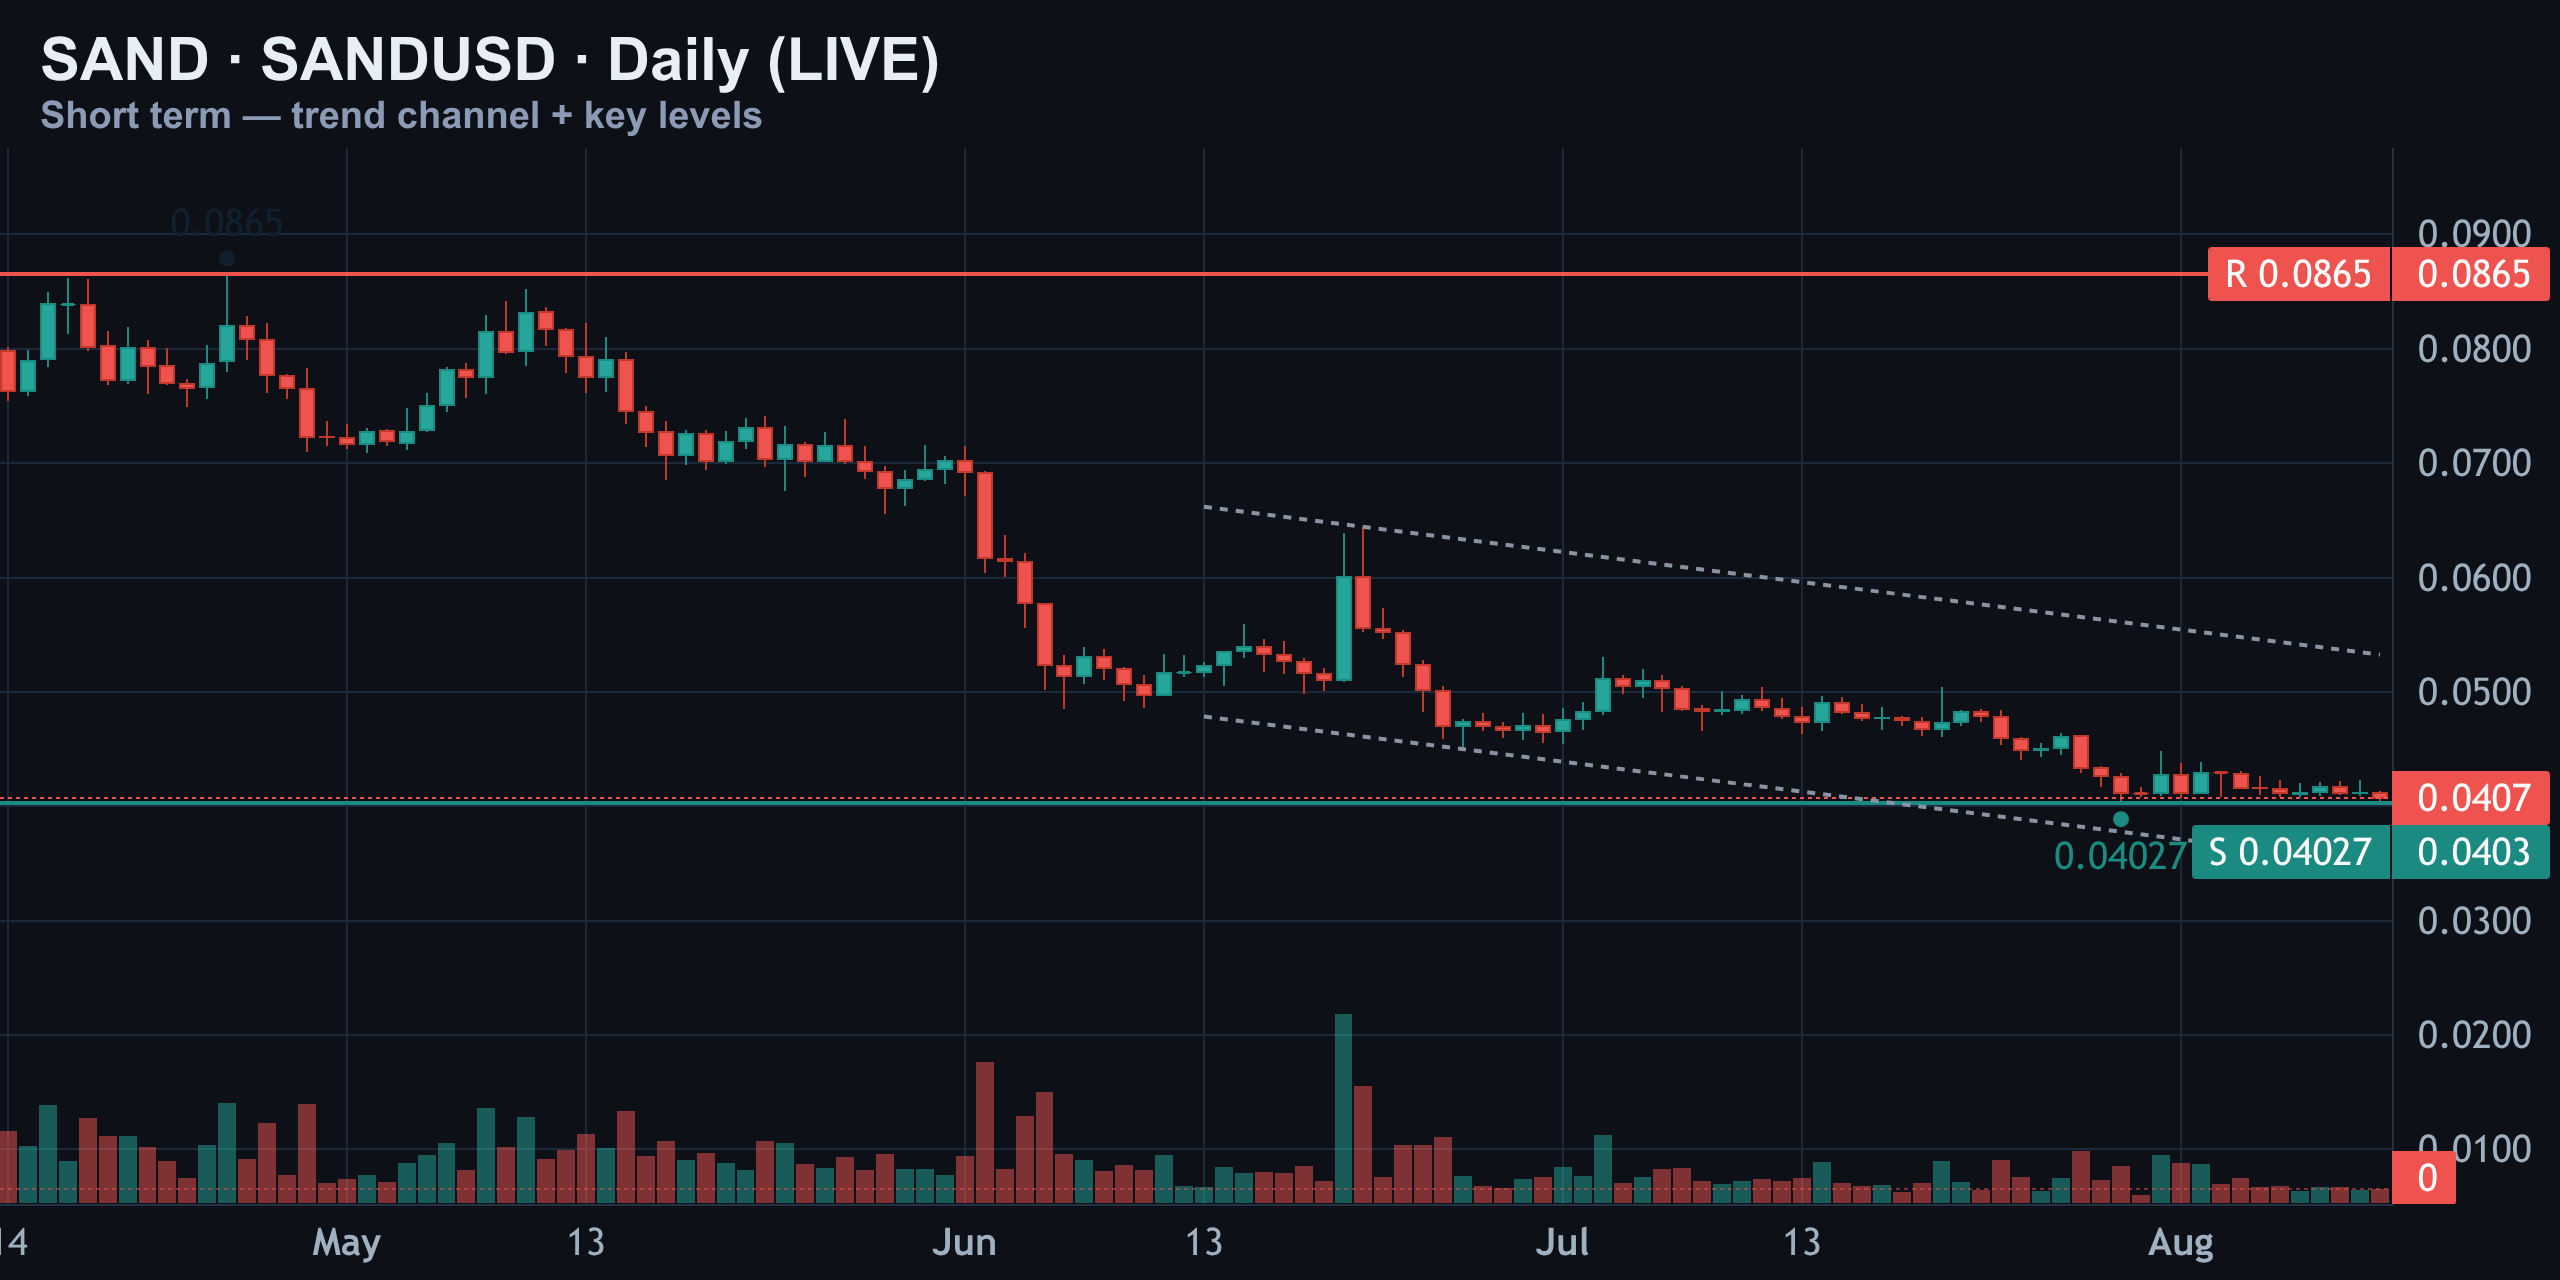
On the daily timeframe the picture is simple, and a little uncomfortable. There's hard resistance flagged at $0.0865, untouched for months, and support at roughly $0.0403 — basically right where price is trading today. SAND has been inside its own descending channel since late July, with every bounce failing at a lower high.
| Level | Price | Significance |
|---|---|---|
| Daily resistance | $0.0865 | Untouched for months |
| 4H channel top | ~$0.0430–0.0440 | Mid-channel bounce target |
| Current spot | $0.0407 | On daily support, decision point |
| Daily support | $0.0403 | Repeatedly tested since late July |
The fact that spot is sitting directly on daily support means today is a genuine decision point for the next multi-day move, not just noise.
Momentum Check: RSI Weak, MACD Whispering
RSI (14) is sitting at 36 — soft, leaning weak, but not the deeply oversold reading you'd want for a high-confidence bounce call. There's no clean bullish divergence here either; price and RSI are drifting lower together, which tells you sellers still hold some control.
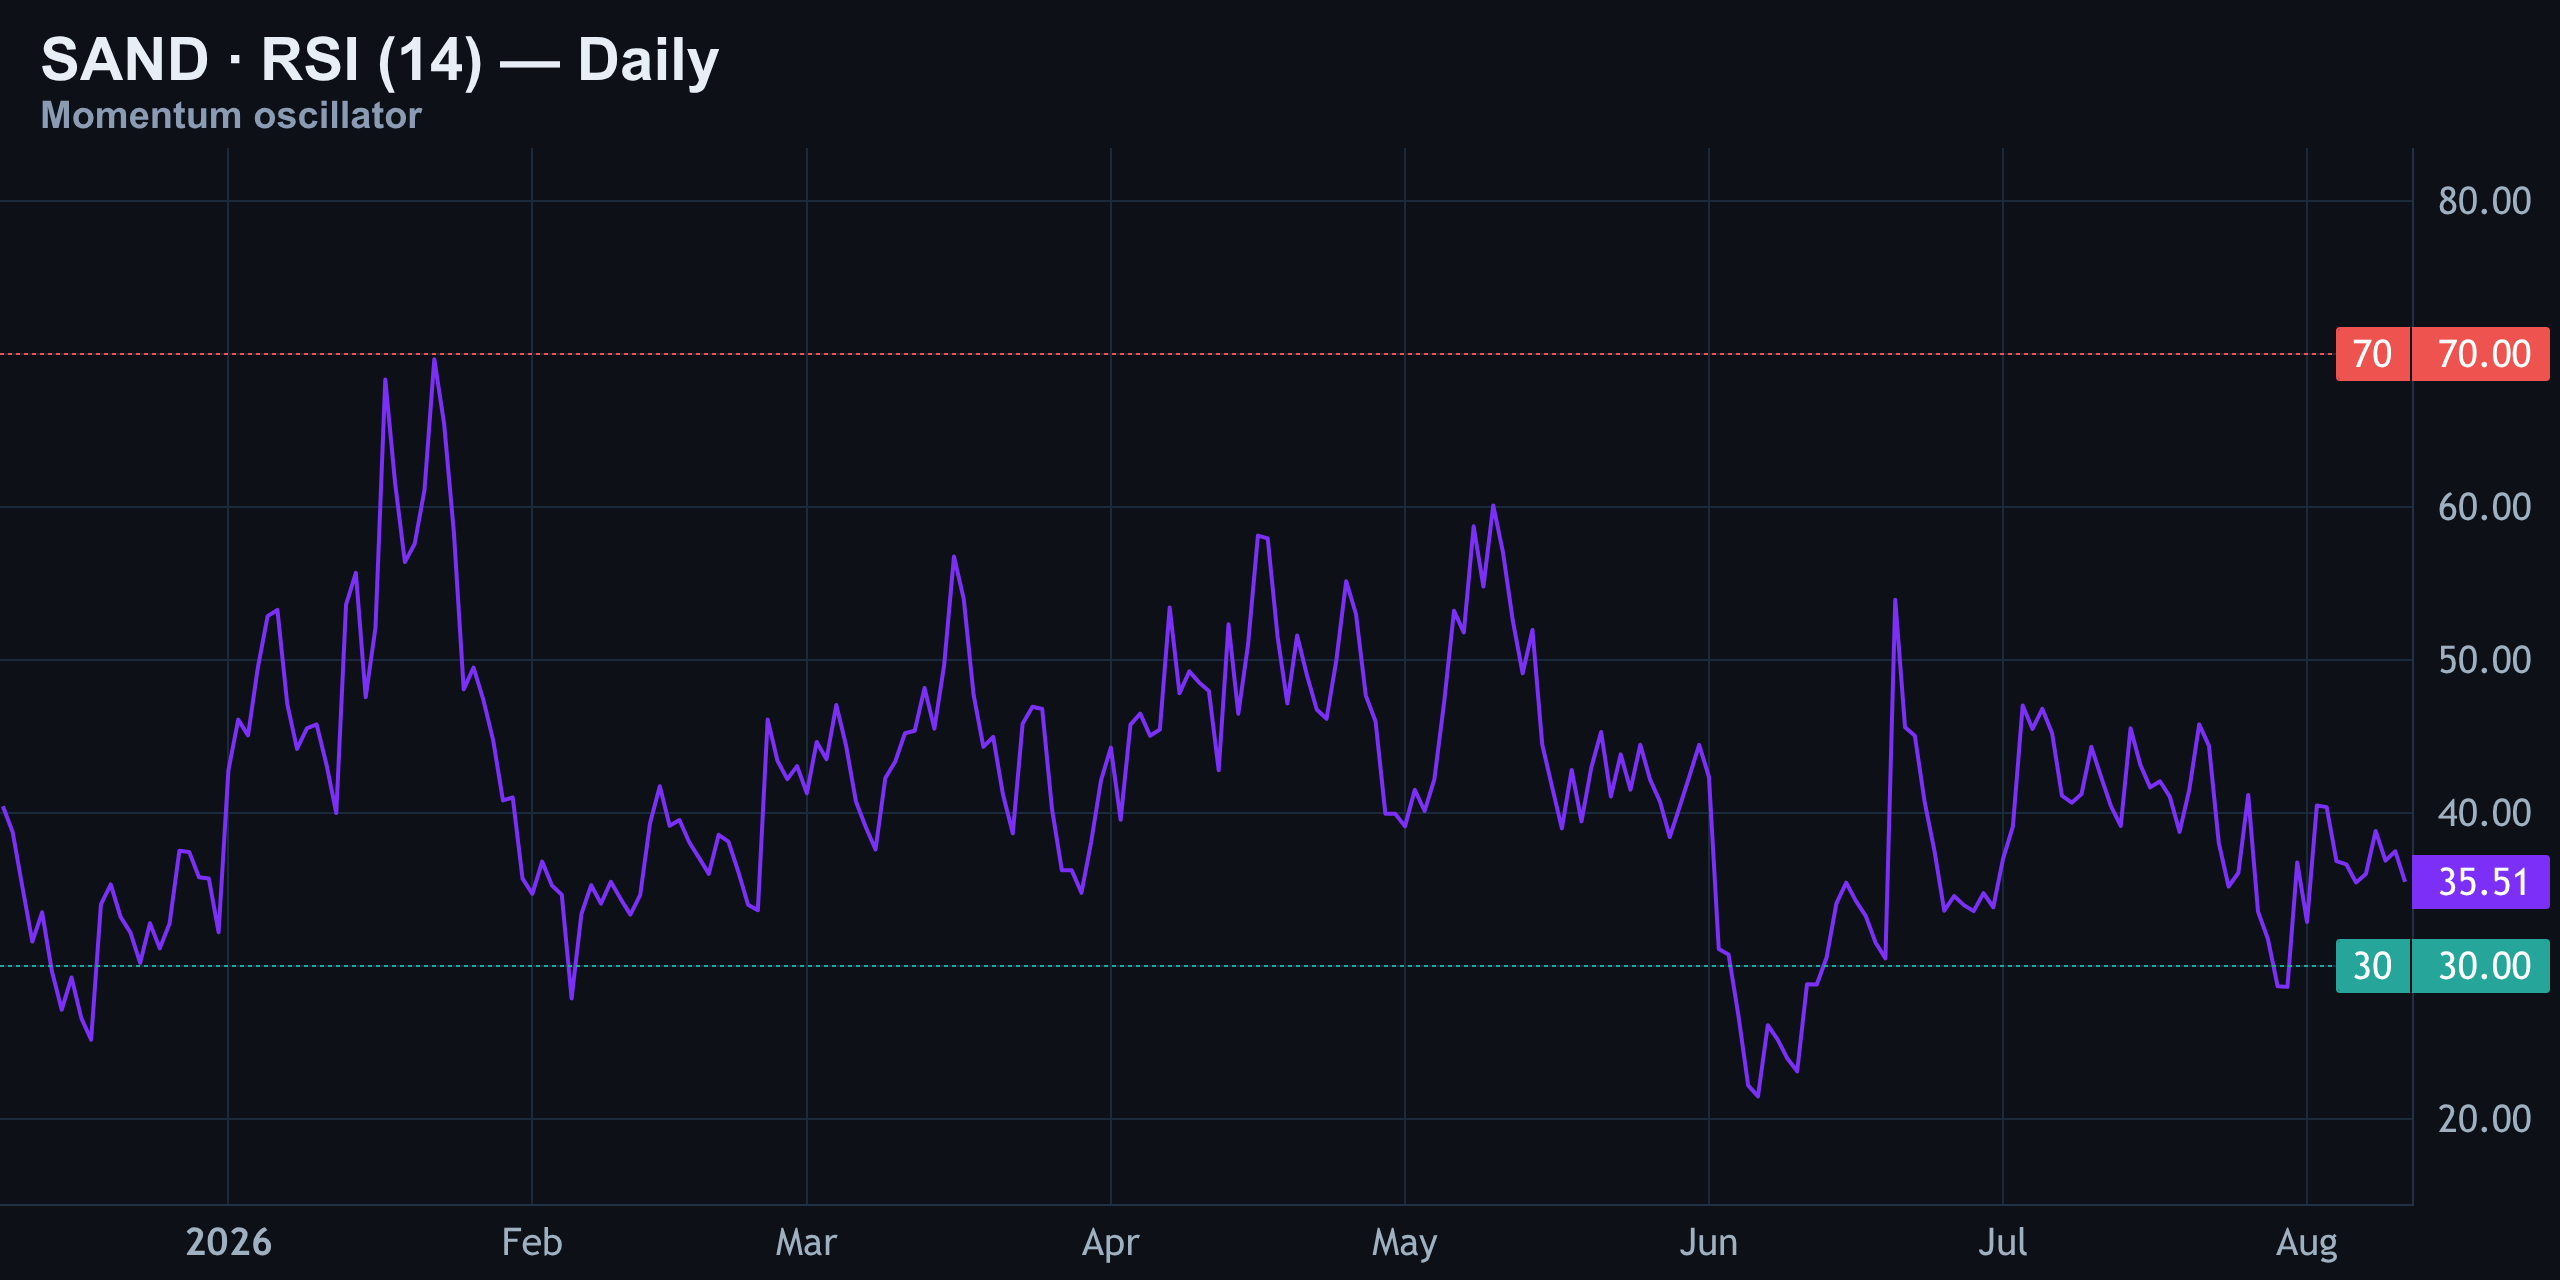
If RSI pushes down toward the 30 line without stabilizing, that would actually align with the deeper liquidation levels sitting below spot — worth watching in tandem rather than in isolation.
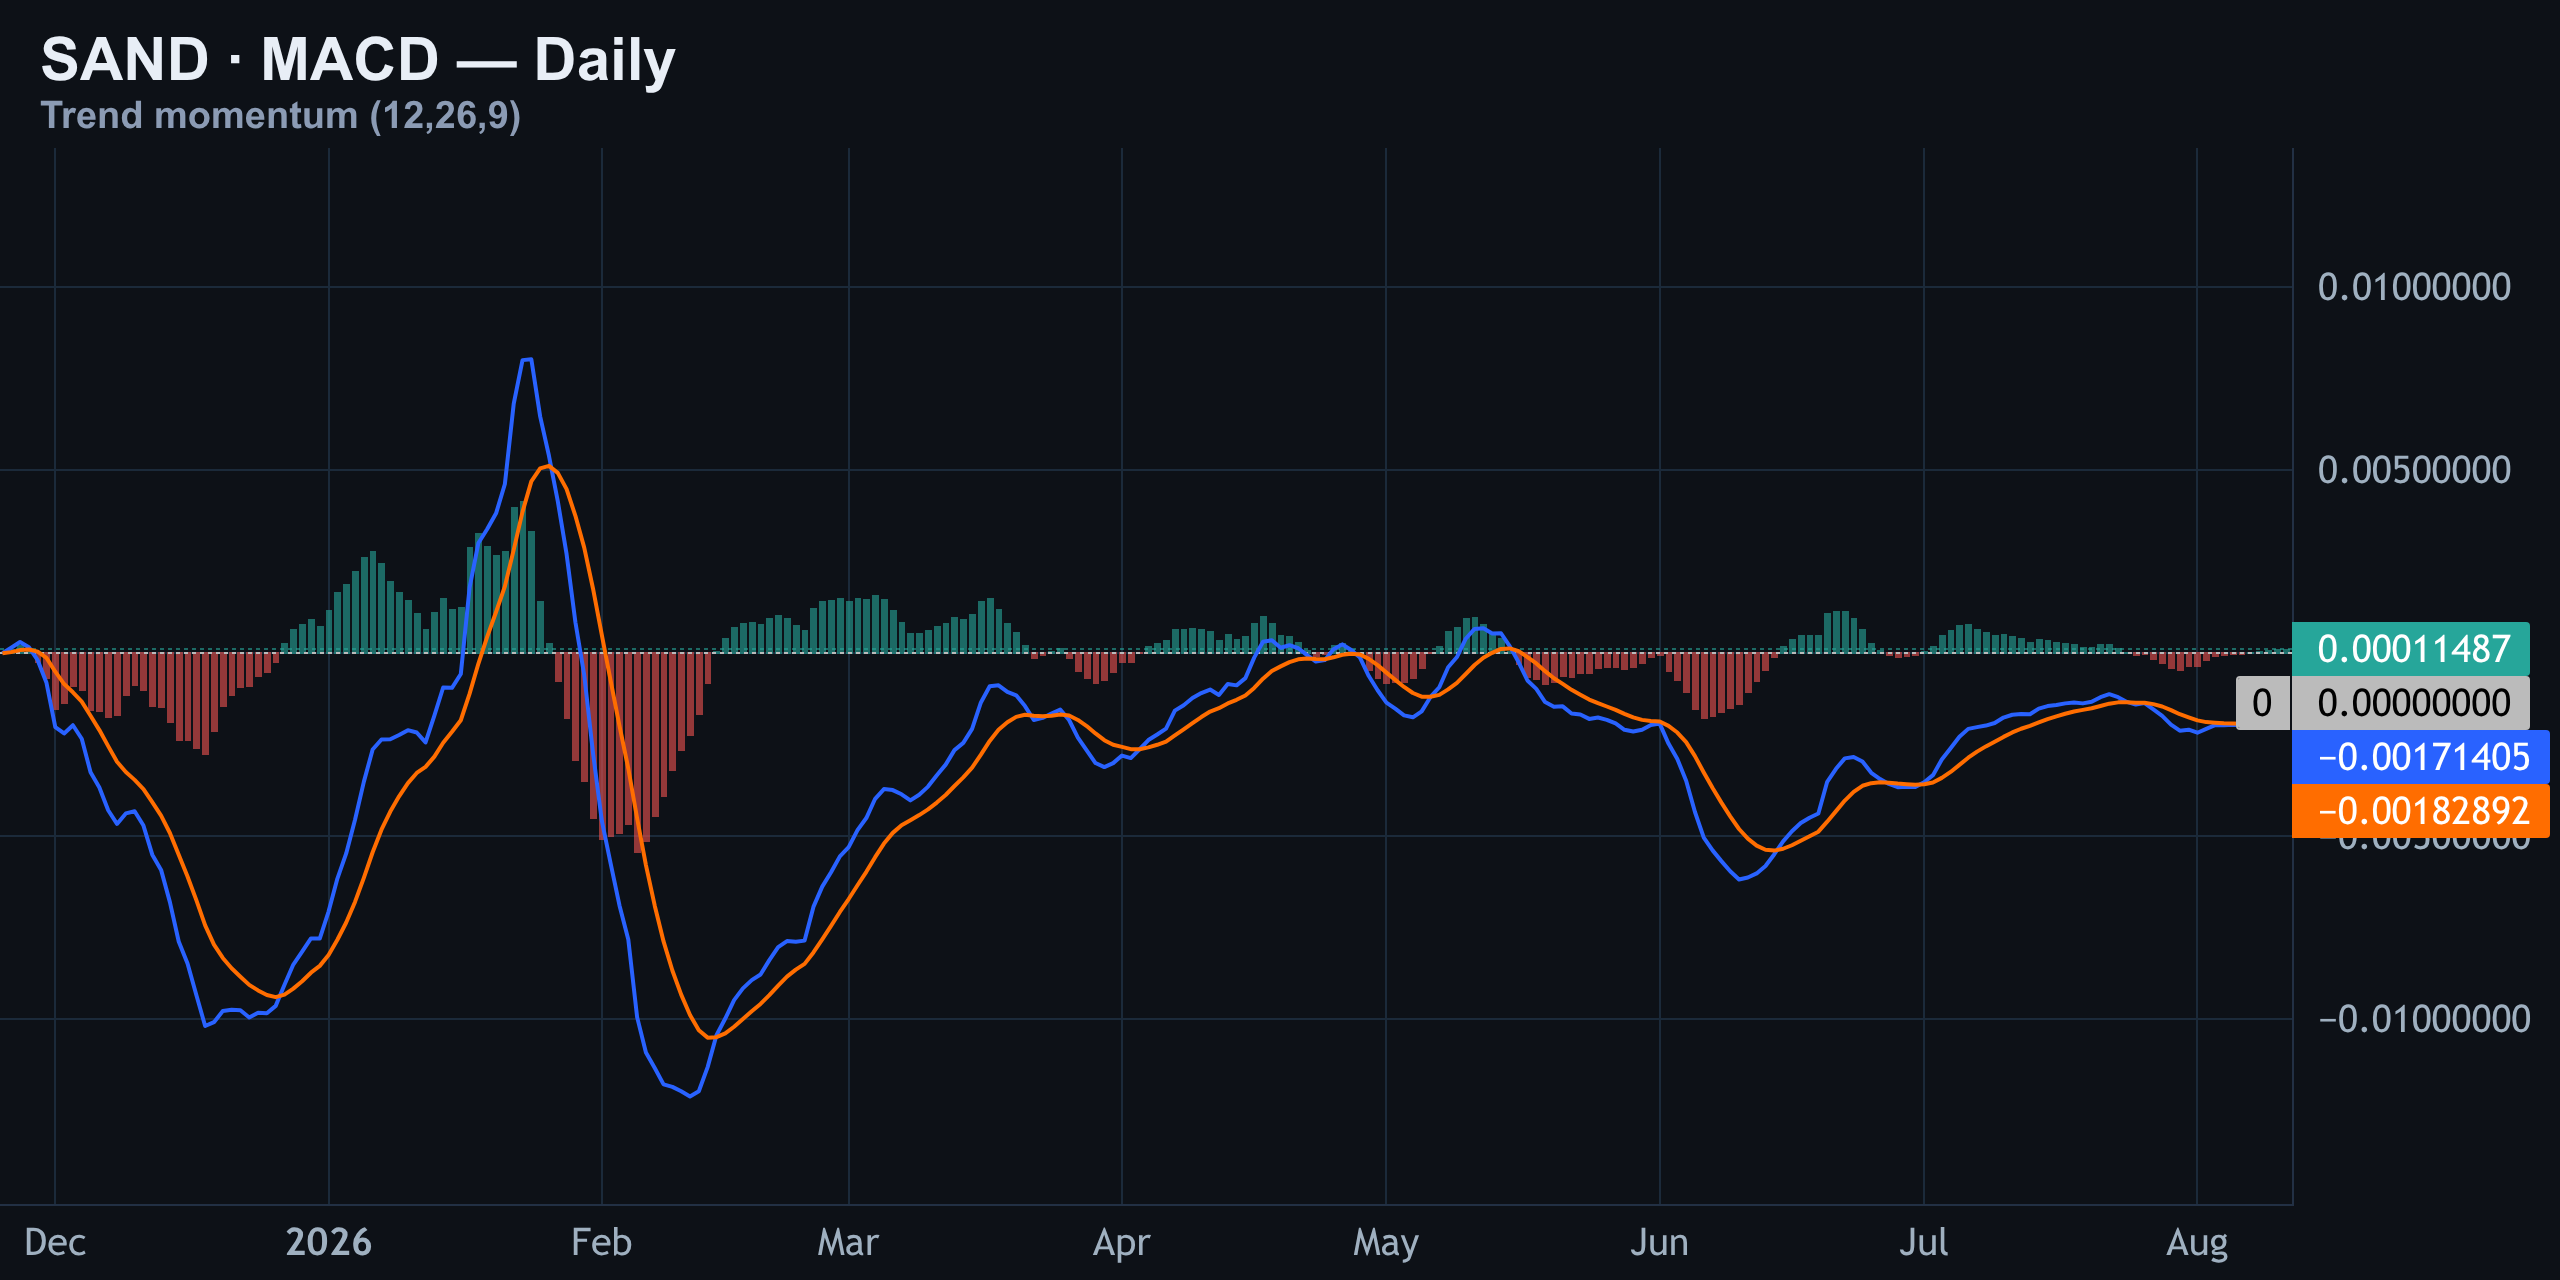
MACD is offering a quieter signal than RSI — a hint that downside momentum may be losing steam even though price hasn't confirmed it yet. It's not a trigger on its own, but it's the kind of tell that dealers file away rather than dismiss.
Positioning and Premium: Who's Actually Buying?
Retail accounts are net long at 1.50, and top traders are net long at 1.52 — essentially aligned, so positioning alone gives no edge to fade right now. Where it gets interesting is funding and cross-exchange premium.
| Metric | Reading | What it implies |
|---|---|---|
| Retail long/short ratio | 1.50 net long | No positioning edge |
| Top trader ratio | 1.52 net long | Aligned with retail |
| Funding rate | -20% APR (shorts paying) | Crowded shorts — squeeze-up fuel |
| Coinbase vs Binance premium | +0.098% | US institutions bidding |
Funding is negative, meaning shorts are paying to stay short — a crowded trade that adds squeeze-up fuel. At the same time, Coinbase is trading at a +0.098% premium to Binance, a signature of quiet US spot or ETF-linked demand under a red candle. A persistent positive premium like this is usually the fingerprint of American buyers stepping in; a discount would mean US holders are the ones selling. Broader funding data across venues shows a mixed picture — Coinalyze's aggregated feed has Binance funding near -0.0036% while Bybit sits slightly positive, underscoring that the squeeze setup isn't uniform across every exchange.
Liquidation Heatmap: The Levels the Market Already Fought Over
With mark near $0.0407, dense long-liquidation clusters sit below spot at leveraged tiers (25x and 50x), while short-liquidation clusters sit above. Funding leans the pressure upside — shorts crowded and paying means the short-liquidation pool above is the magnet. Price tends to hunt the heavier pool of stops, so treat the nearest cluster as a target, not as clean support or resistance.
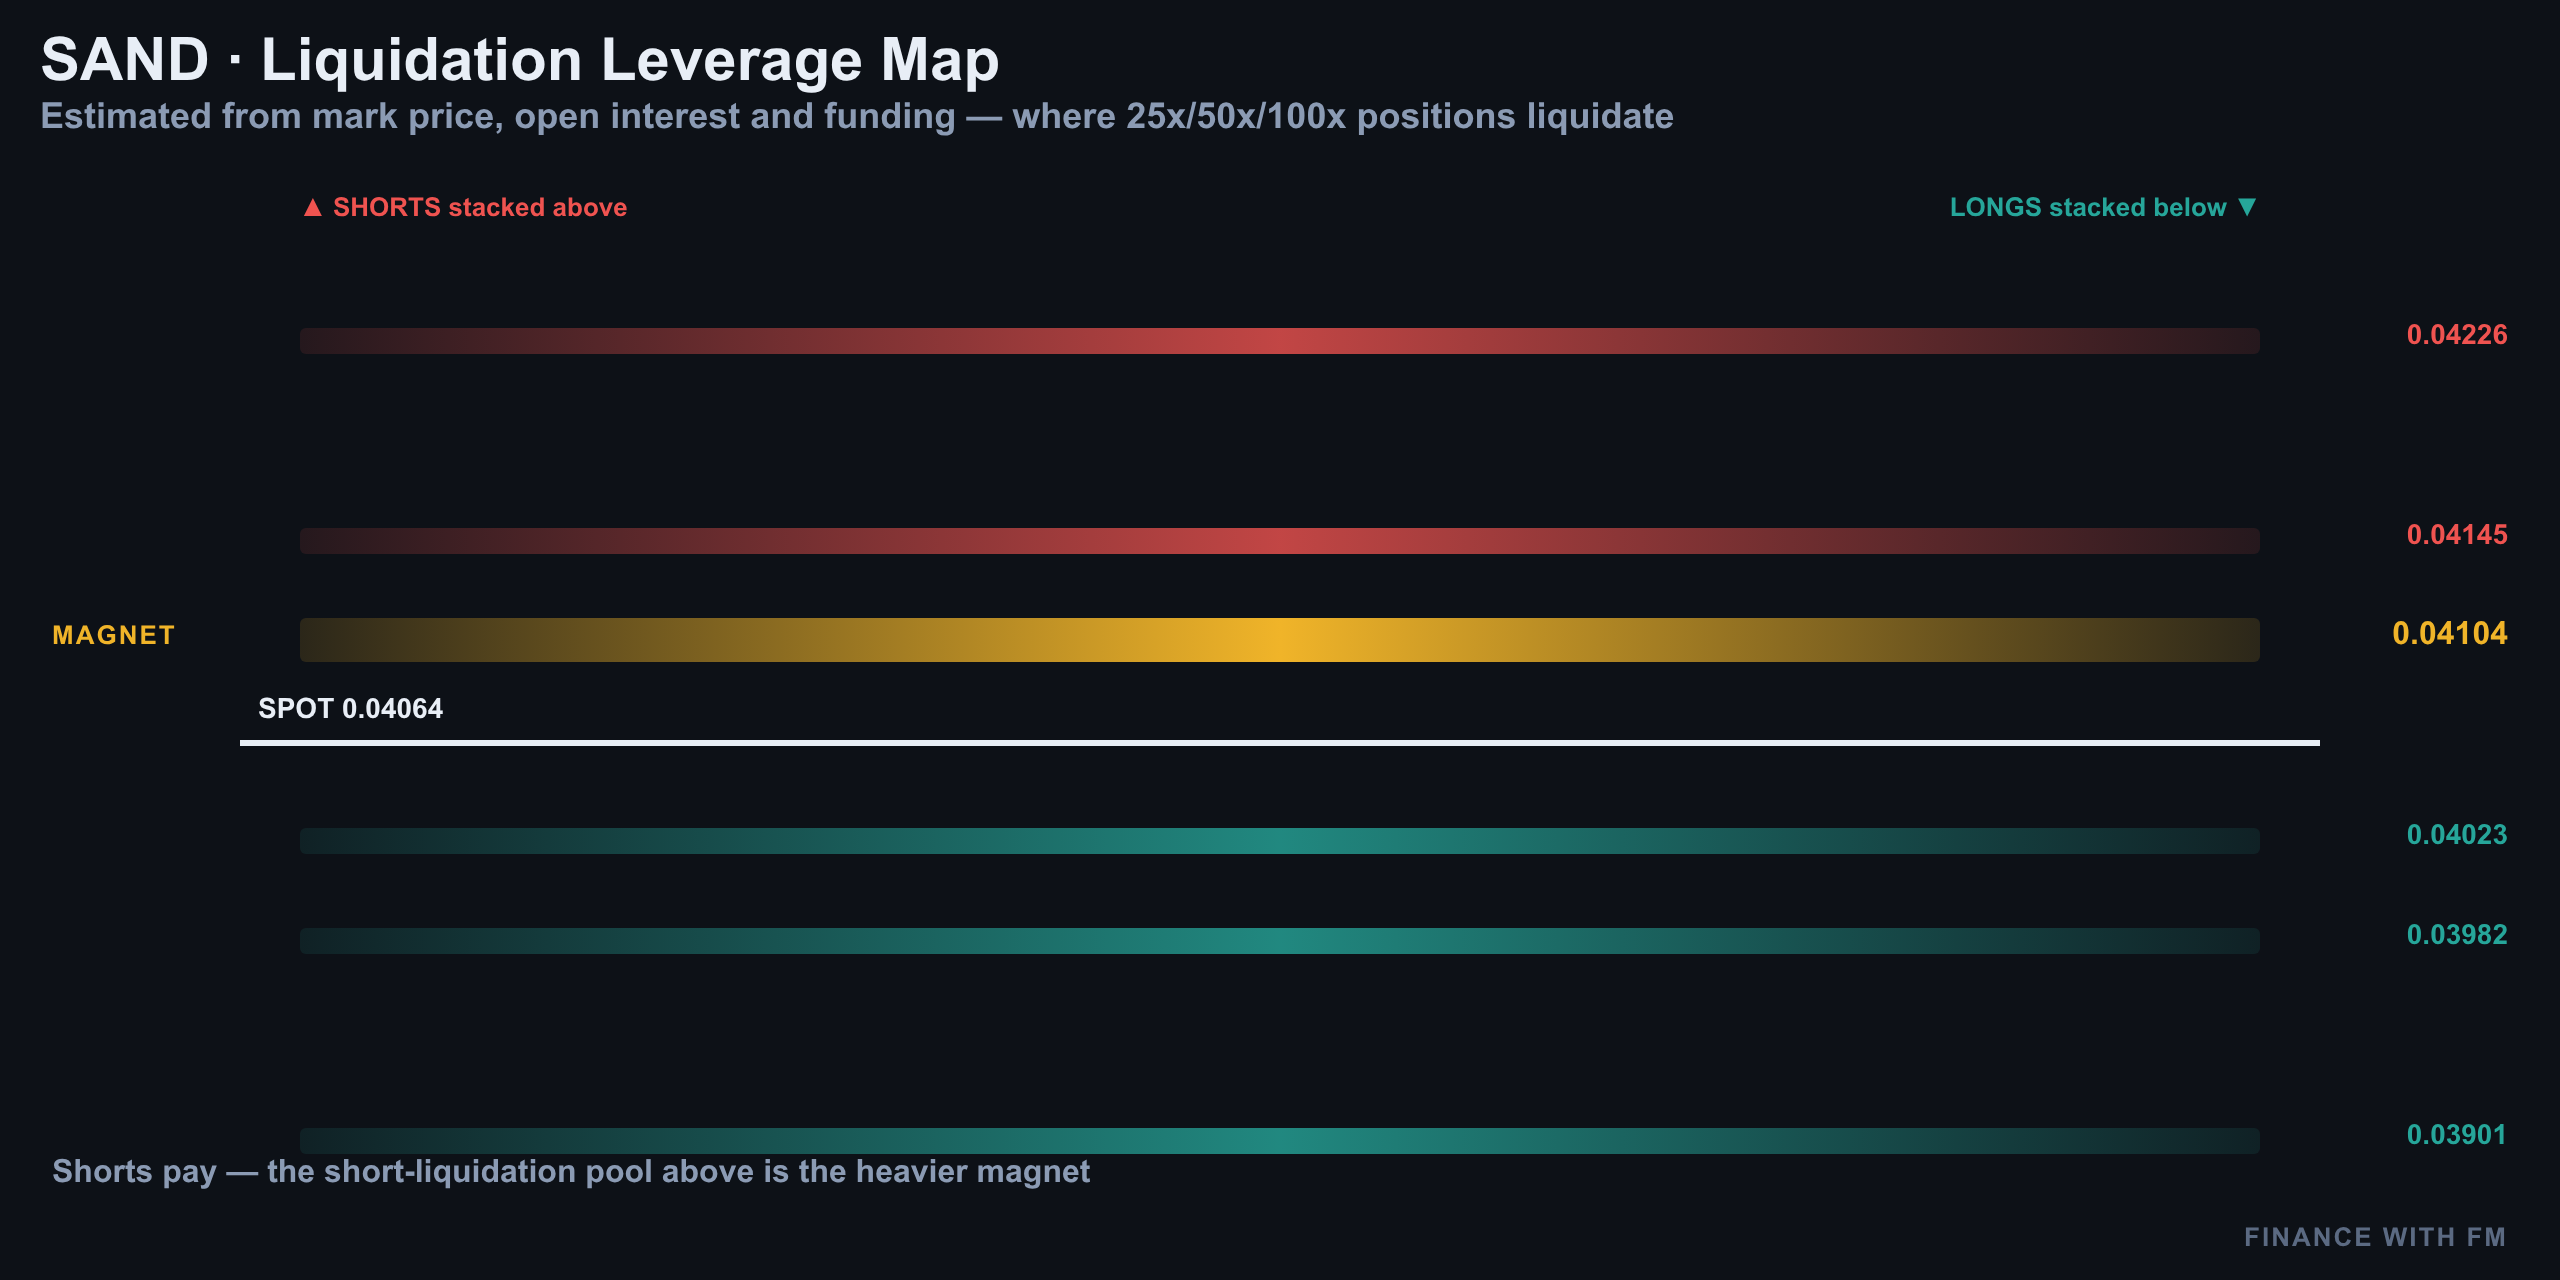
| Zone | Price | Estimated Size |
|---|---|---|
| Heaviest flush (above) | $0.0411 | $184,000 |
| Short liquidations (above) | $0.0427 | $62,000 |
| Short liquidations (above) | $0.0429 | $22,000 |
| Long liquidations (below) | $0.0406 | $15,000 |
Open interest around SAND remains well below earlier-year peaks according to recent aggregator data, which supports the idea that this liquidation map reflects leftover positioning rather than a fresh leverage buildup. These are prices where leverage has already been cleared out recently — ground the market has fought over, not necessarily where it's headed next.
The Desk's Call: No Clean 1:2.5 Trade Today
The desk ran today's numbers and walked away — not for lack of opportunity, but because the math didn't clear the bar. The best available target only offers roughly 1:2.4 risk/reward, just short of the 1:2.5 floor the desk requires before committing capital.
Patience beats a bad setup. With shorts crowded and paying, a Coinbase premium hinting at institutional bids, but four-hour structure still printing lower highs, today is a day to watch the $0.0407 support and the $0.0393 trigger rather than force a trade that doesn't clear the bar.
Analysis and education, not investment advice. See our editorial policy.