Daily market analysis
Internetcomputer (ICP) technical analysis today
Last updated
ICP Daily Pulse — August 31, 2026
ICP Daily Pulse: Neutral Bias With a Downside Skew
Welcome to the August 31, 2026 ICP Daily Pulse from Finance With FM. Internet Computer is trading around $2.40 after a soft session, but the market is more complicated than the daily loss suggests. Aggressive buyers are still lifting offers, funding remains positive, and the order book is bid-heavy. At the same time, open interest is falling, the daily MACD remains weak, and long positioning is crowded.
That combination points to a market caught between conviction and de-risking. Some traders are still willing to buy at market, while leveraged participants are reducing exposure. This can represent quiet accumulation, but it can also create the conditions for a squeeze if price breaks below support and crowded longs rush for the exit.
| Metric | Current reading | What it suggests |
|---|---|---|
| ICP price | $2.40 | Near the middle of the intraday range |
| 24-hour change | -2.52% | Short-term pressure remains visible |
| Today’s range | $2.32–$2.47 | Choppy, two-sided conditions |
| Three-day change | -0.5% | Limited directional progress |
| Funding | 0.0100% | Longs are paying to remain open |
| Open interest | 9,005,792 ICP | Down 5.1% over seven days |
| Account positioning | 1.53 long-to-short | Longs remain the crowded side |
Since the previous update, ICP moved from $2.41 to approximately $2.398. The prior long from $2.357 to $2.496 remains live: neither the target nor the stop has been reached. That is the honest scorecard. The setup is still open, but today’s range does not offer a new entry with a clean 1:2.5 risk-to-reward profile.
15-Minute Intraday Chart: Buyers Are Active, Not in Control
The 15-minute chart shows ICP rebounding from the lower section of today’s range, but the recovery has not developed into a convincing sequence of higher highs. Price is compressing around $2.40 after repeated reactions near the upper intraday area and support close to $2.37.
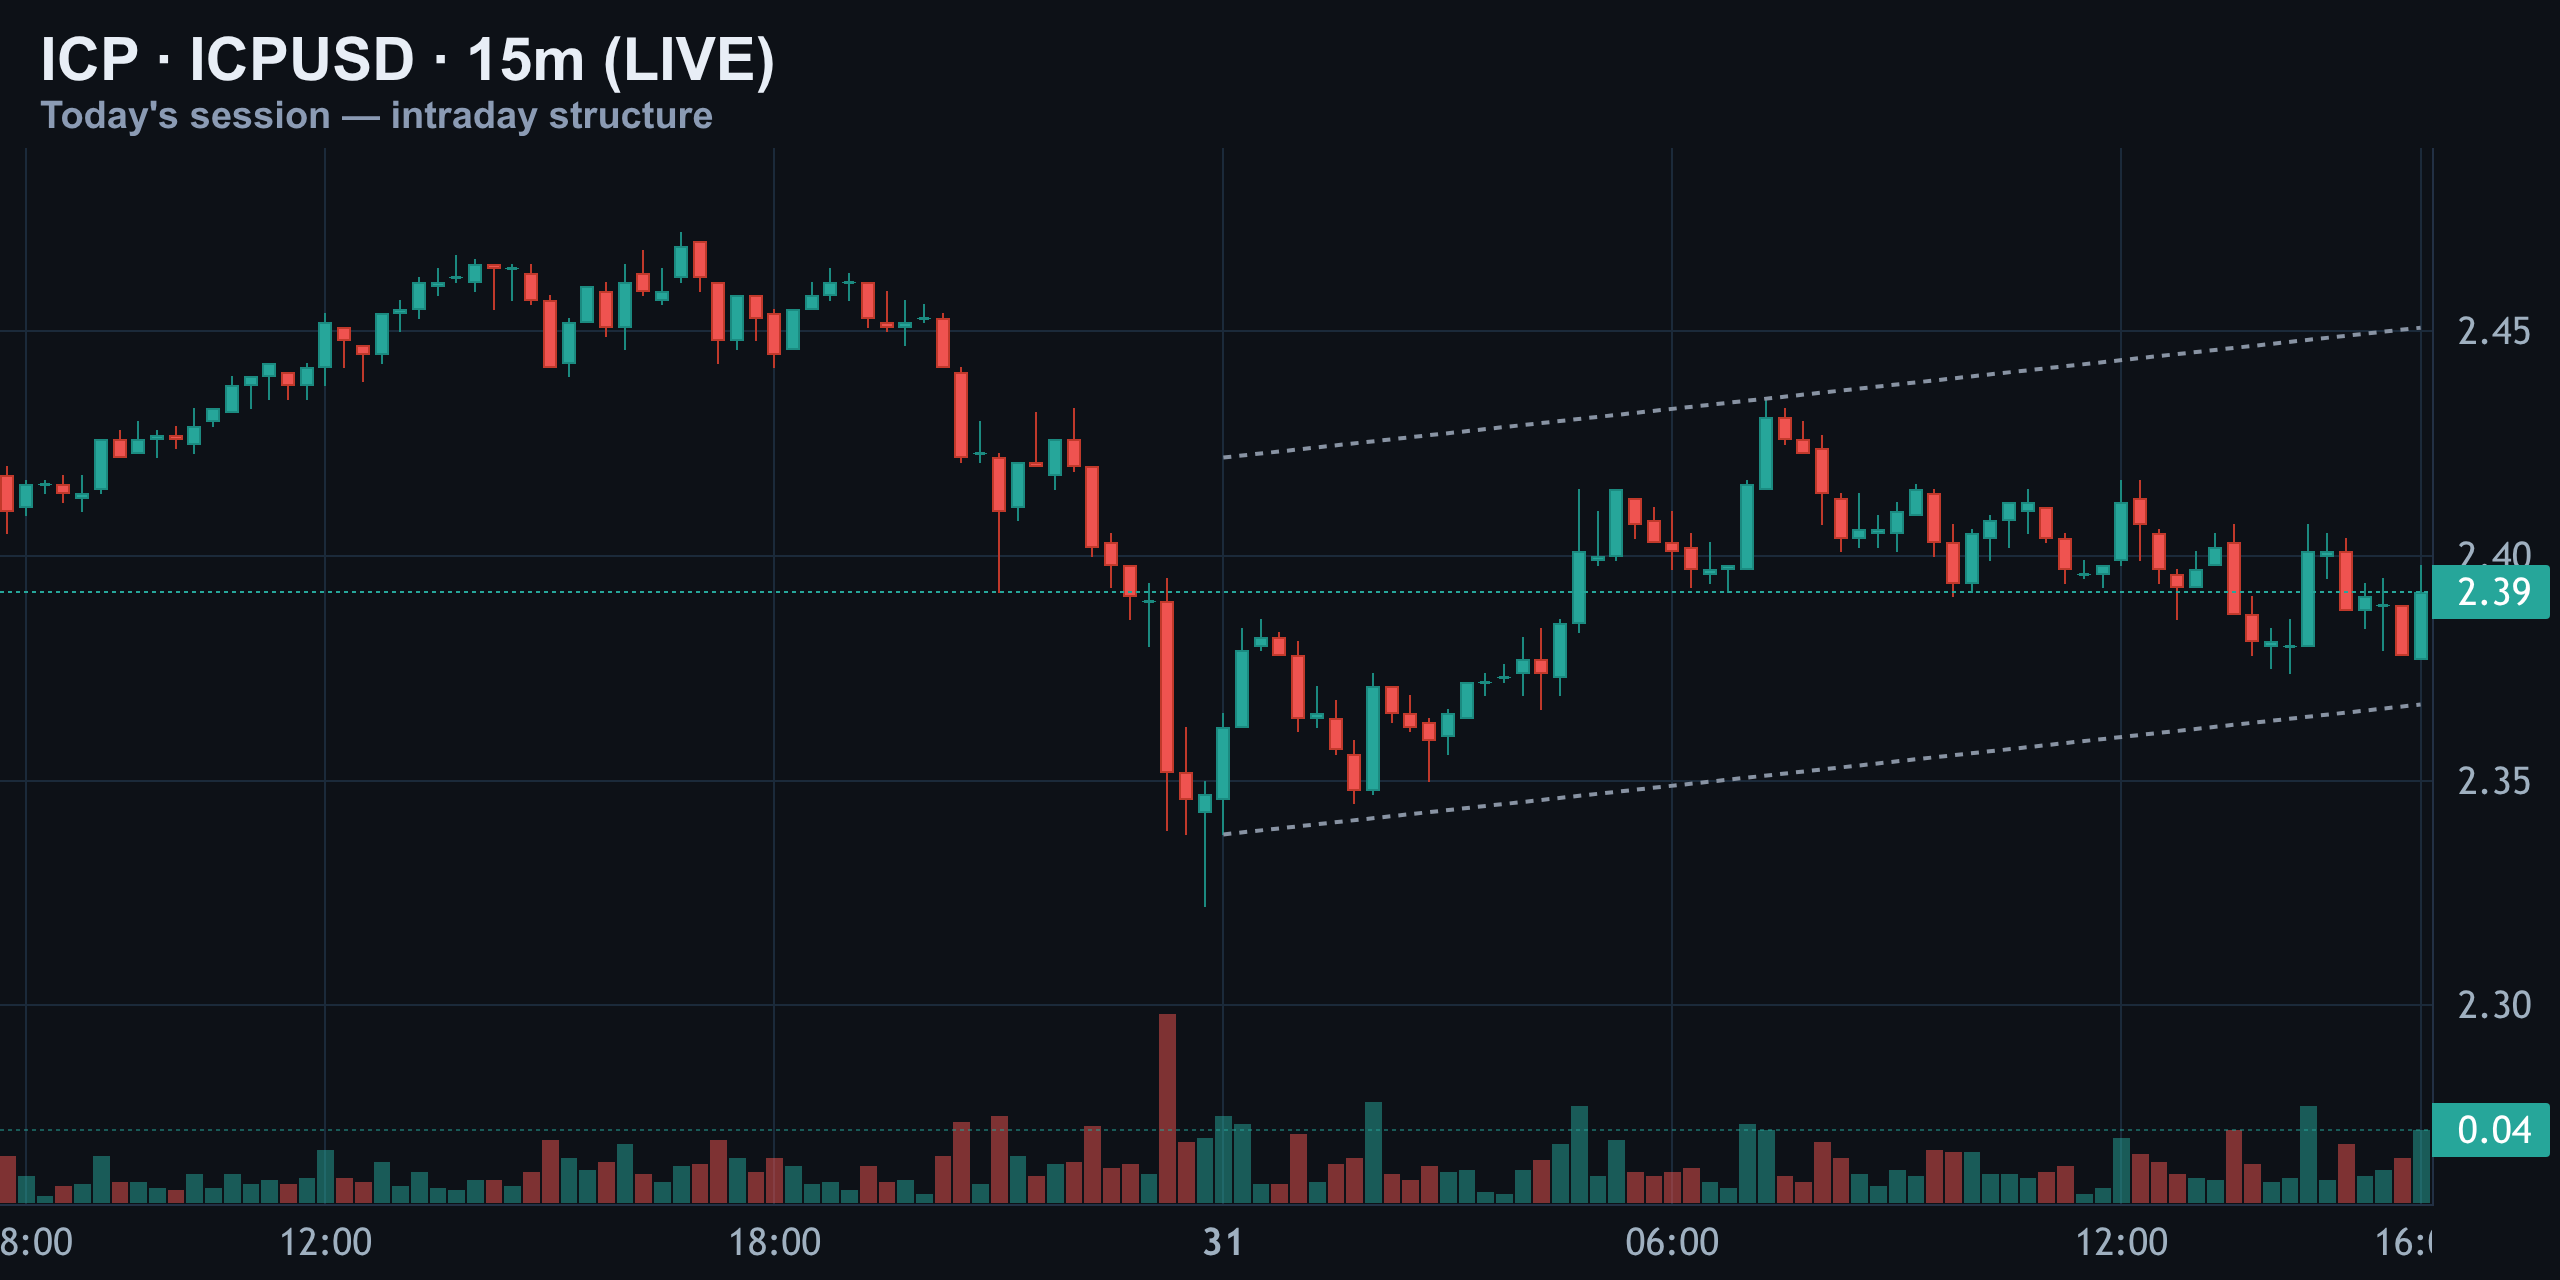
That distinction matters. A bounce tells us that buyers are present; it does not prove that buyers control follow-through. Until ICP reclaims the upper range and holds above it, the immediate structure remains vulnerable to another liquidity sweep lower.
| Intraday area | Price | Interpretation |
|---|---|---|
| Current price | $2.40 | Mid-range and vulnerable to chop |
| Nearby support | $2.369 | Key level for maintaining the bounce |
| Upper range reference | $2.419 | First level buyers need to reclaim |
| Session high | $2.47 | Breakout confirmation area |
| Session low | $2.32 | Loss would confirm renewed weakness |
In practical terms, the chart is not offering a high-quality momentum entry in the middle of the range. A trader buying here is exposed to rejection overhead, while a trader shorting here is selling before support has failed. The cleaner information comes from the edges: acceptance above resistance or a decisive loss of the watched support.
Four-Hour Structure: A Range, Not a Confirmed Trend
The four-hour structure is clearer than the noisy intraday tape. ICP remains boxed inside a broad range and is trading between the 50-day and 200-day moving averages. That moving-average compression helps explain the repeated reversals: neither side has established enough control to create sustained expansion.
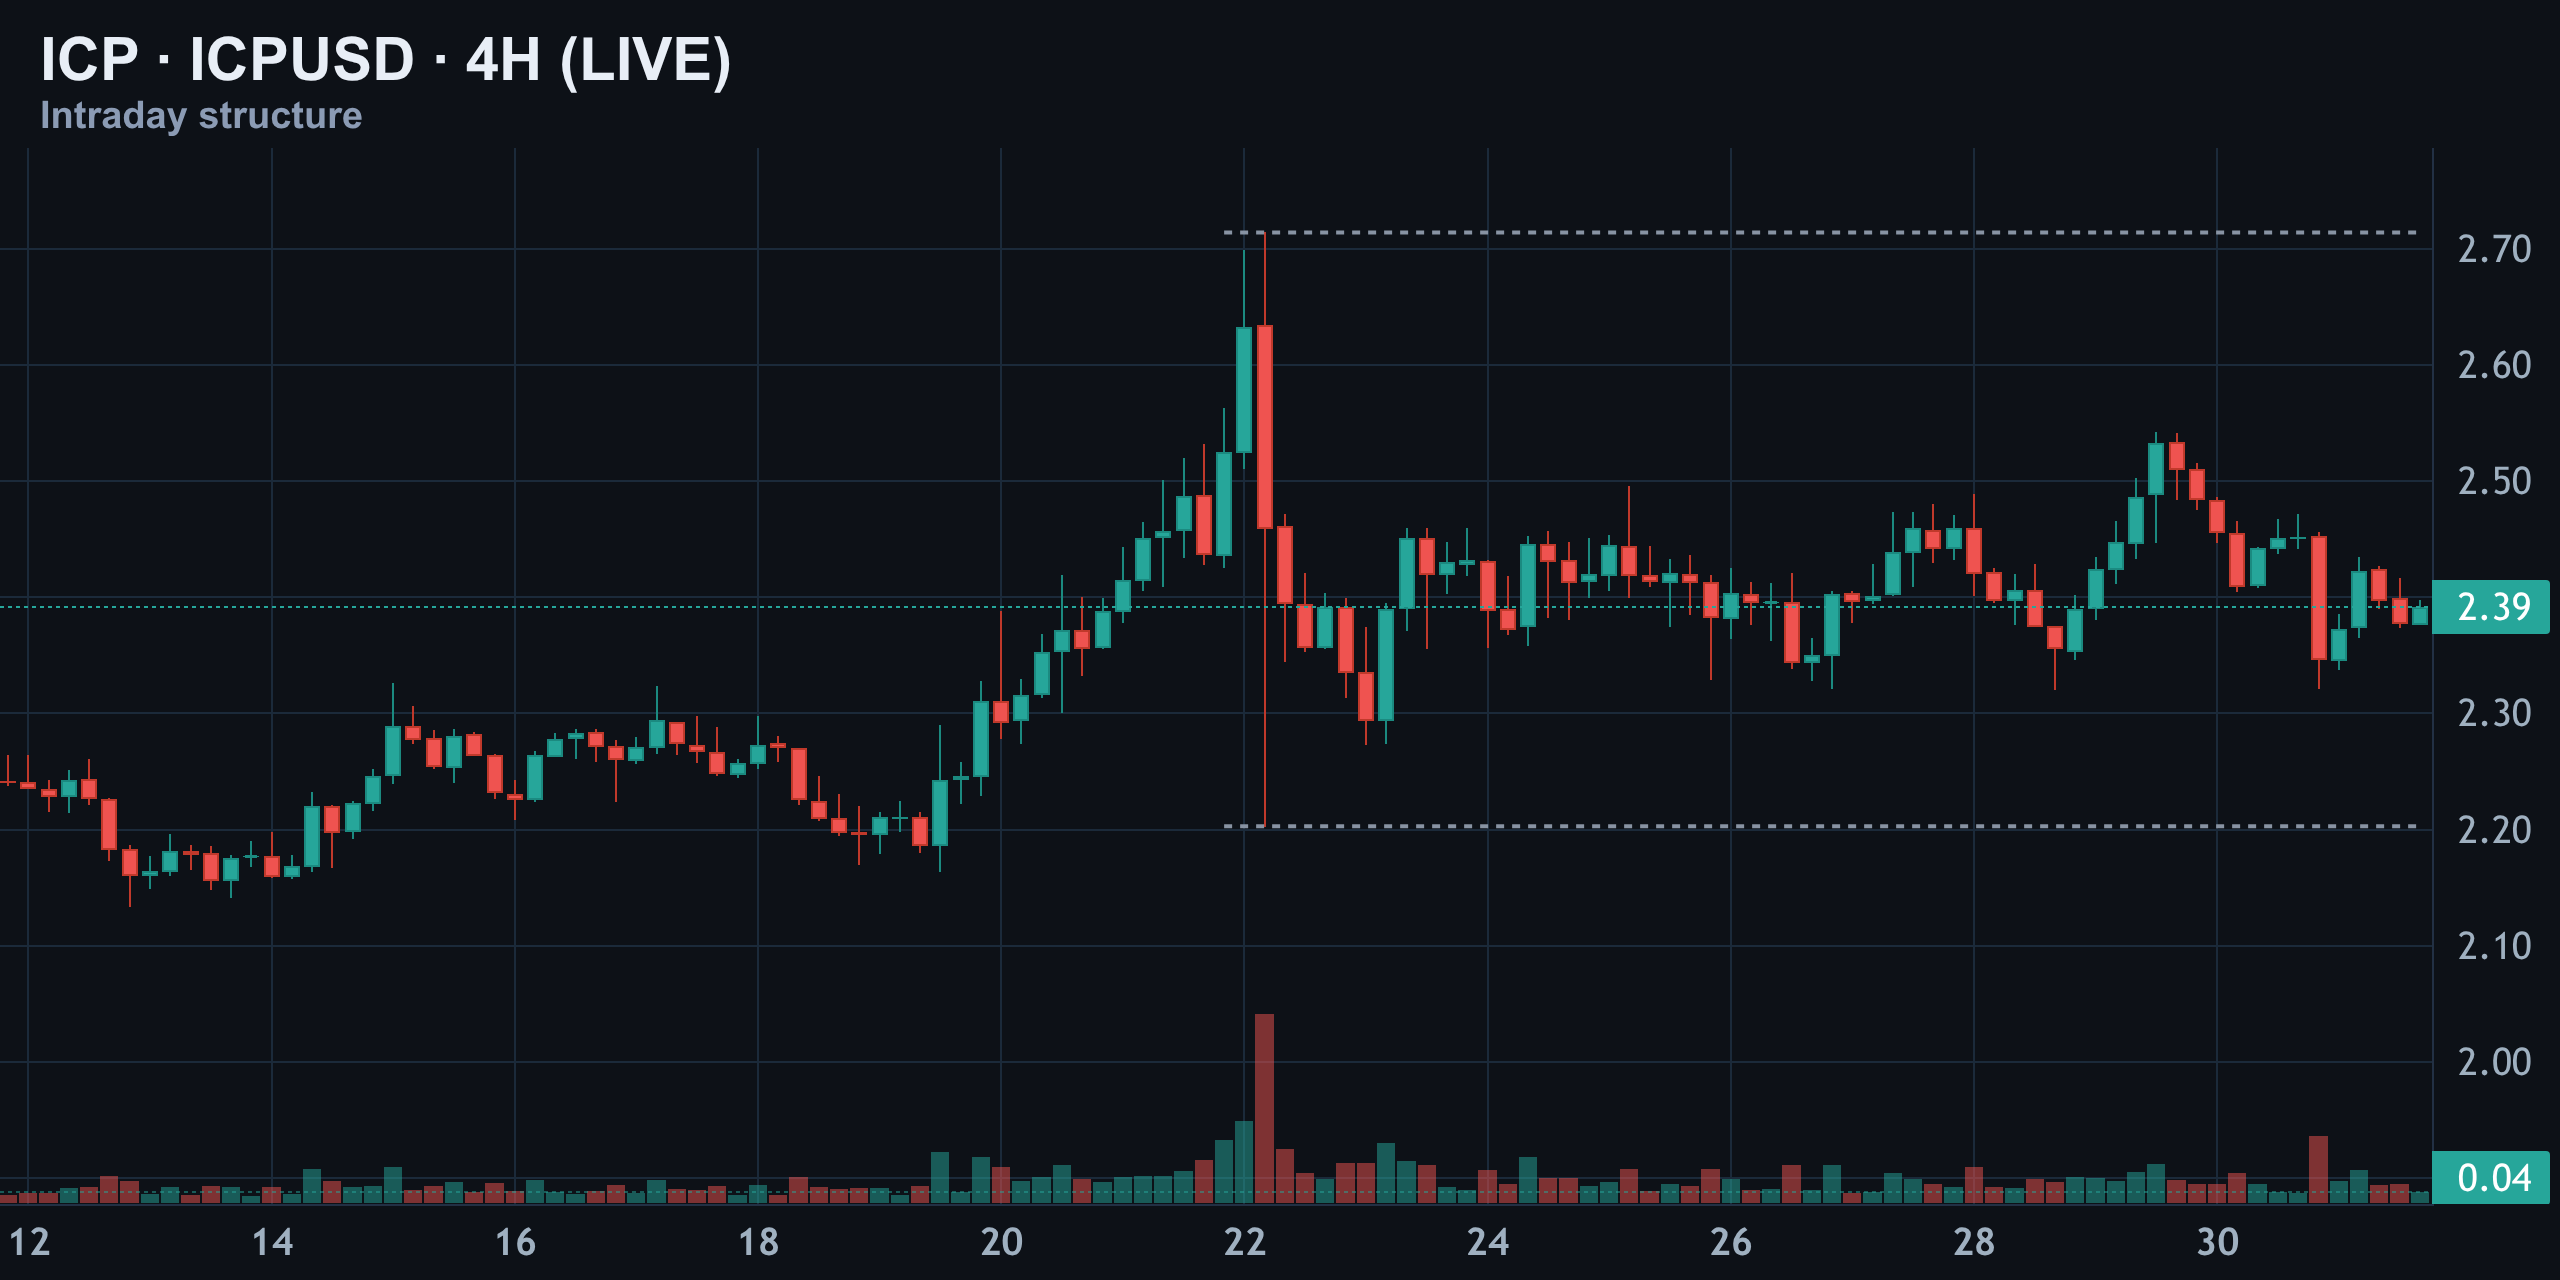
The recent rebound has held above the lower part of the range, which keeps the recovery alive. However, it has not produced a durable breakout or a clear change in market structure. A sustained push through the upper boundary would improve the outlook, particularly if it comes with expanding volume and rising open interest.
The bearish alternative is straightforward. If ICP loses the watched support near $2.369, the market can revisit the liquidation clusters below spot. That would weaken the intraday recovery and potentially turn a routine range test into a leverage-driven move.
Short-Term Daily Chart: Recovery Channel Still Needs Proof
The short-term daily chart shows a gradual recovery inside an ascending channel from the recent low near $2.00. That is constructive, but an ascending recovery channel is not automatically a confirmed trend reversal. It can continue higher, or it can fail when price reaches overhead resistance.
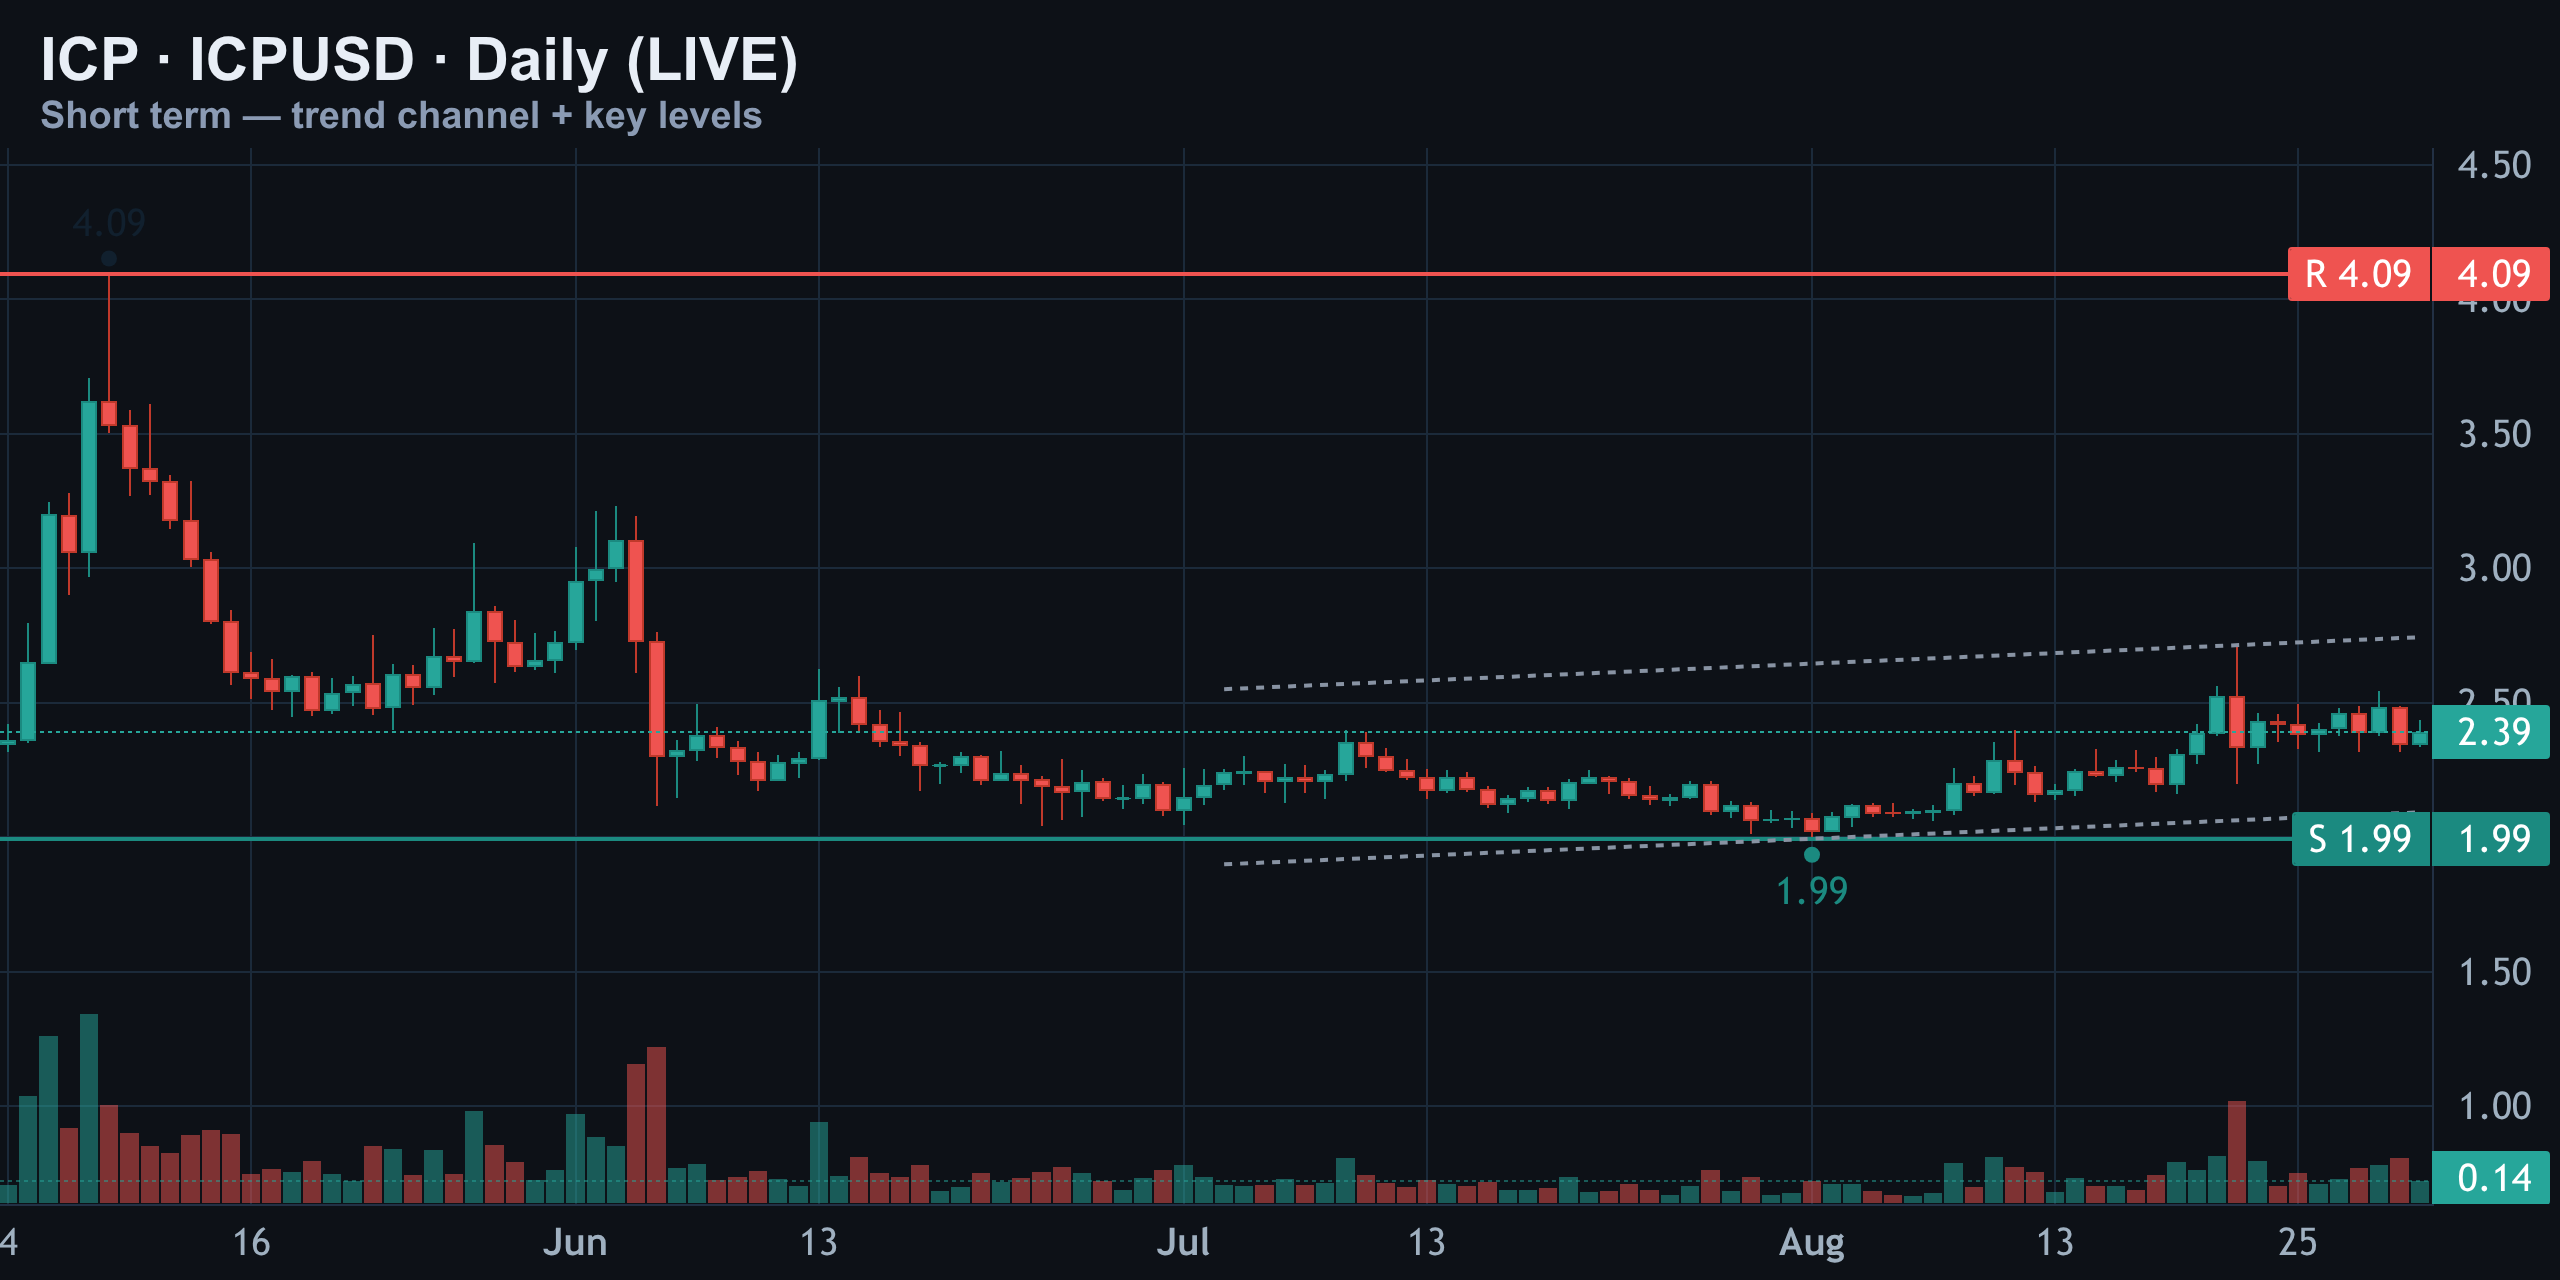
The wider chart still marks major resistance near $4.09, well above the current market. That level is not today’s trading trigger, but it provides useful context: ICP is recovering from depressed levels and remains far below the resistance that would define a larger-scale reversal.
| Daily structure reference | Price | Why it matters |
|---|---|---|
| Recent recovery low | Near $2.00 | Origin of the ascending channel |
| Current market | Near $2.40 | Inside the recovery structure |
| Major overhead resistance | Near $4.09 | Longer-term reversal confirmation area |
For today’s decision, the question is smaller and more immediate: can ICP defend the channel’s lower working area and reclaim nearby resistance? That answer is not confirmed. Patience is therefore more appropriate than forcing a directional forecast.
RSI and MACD: Balanced Oscillator, Bearish Momentum Warning
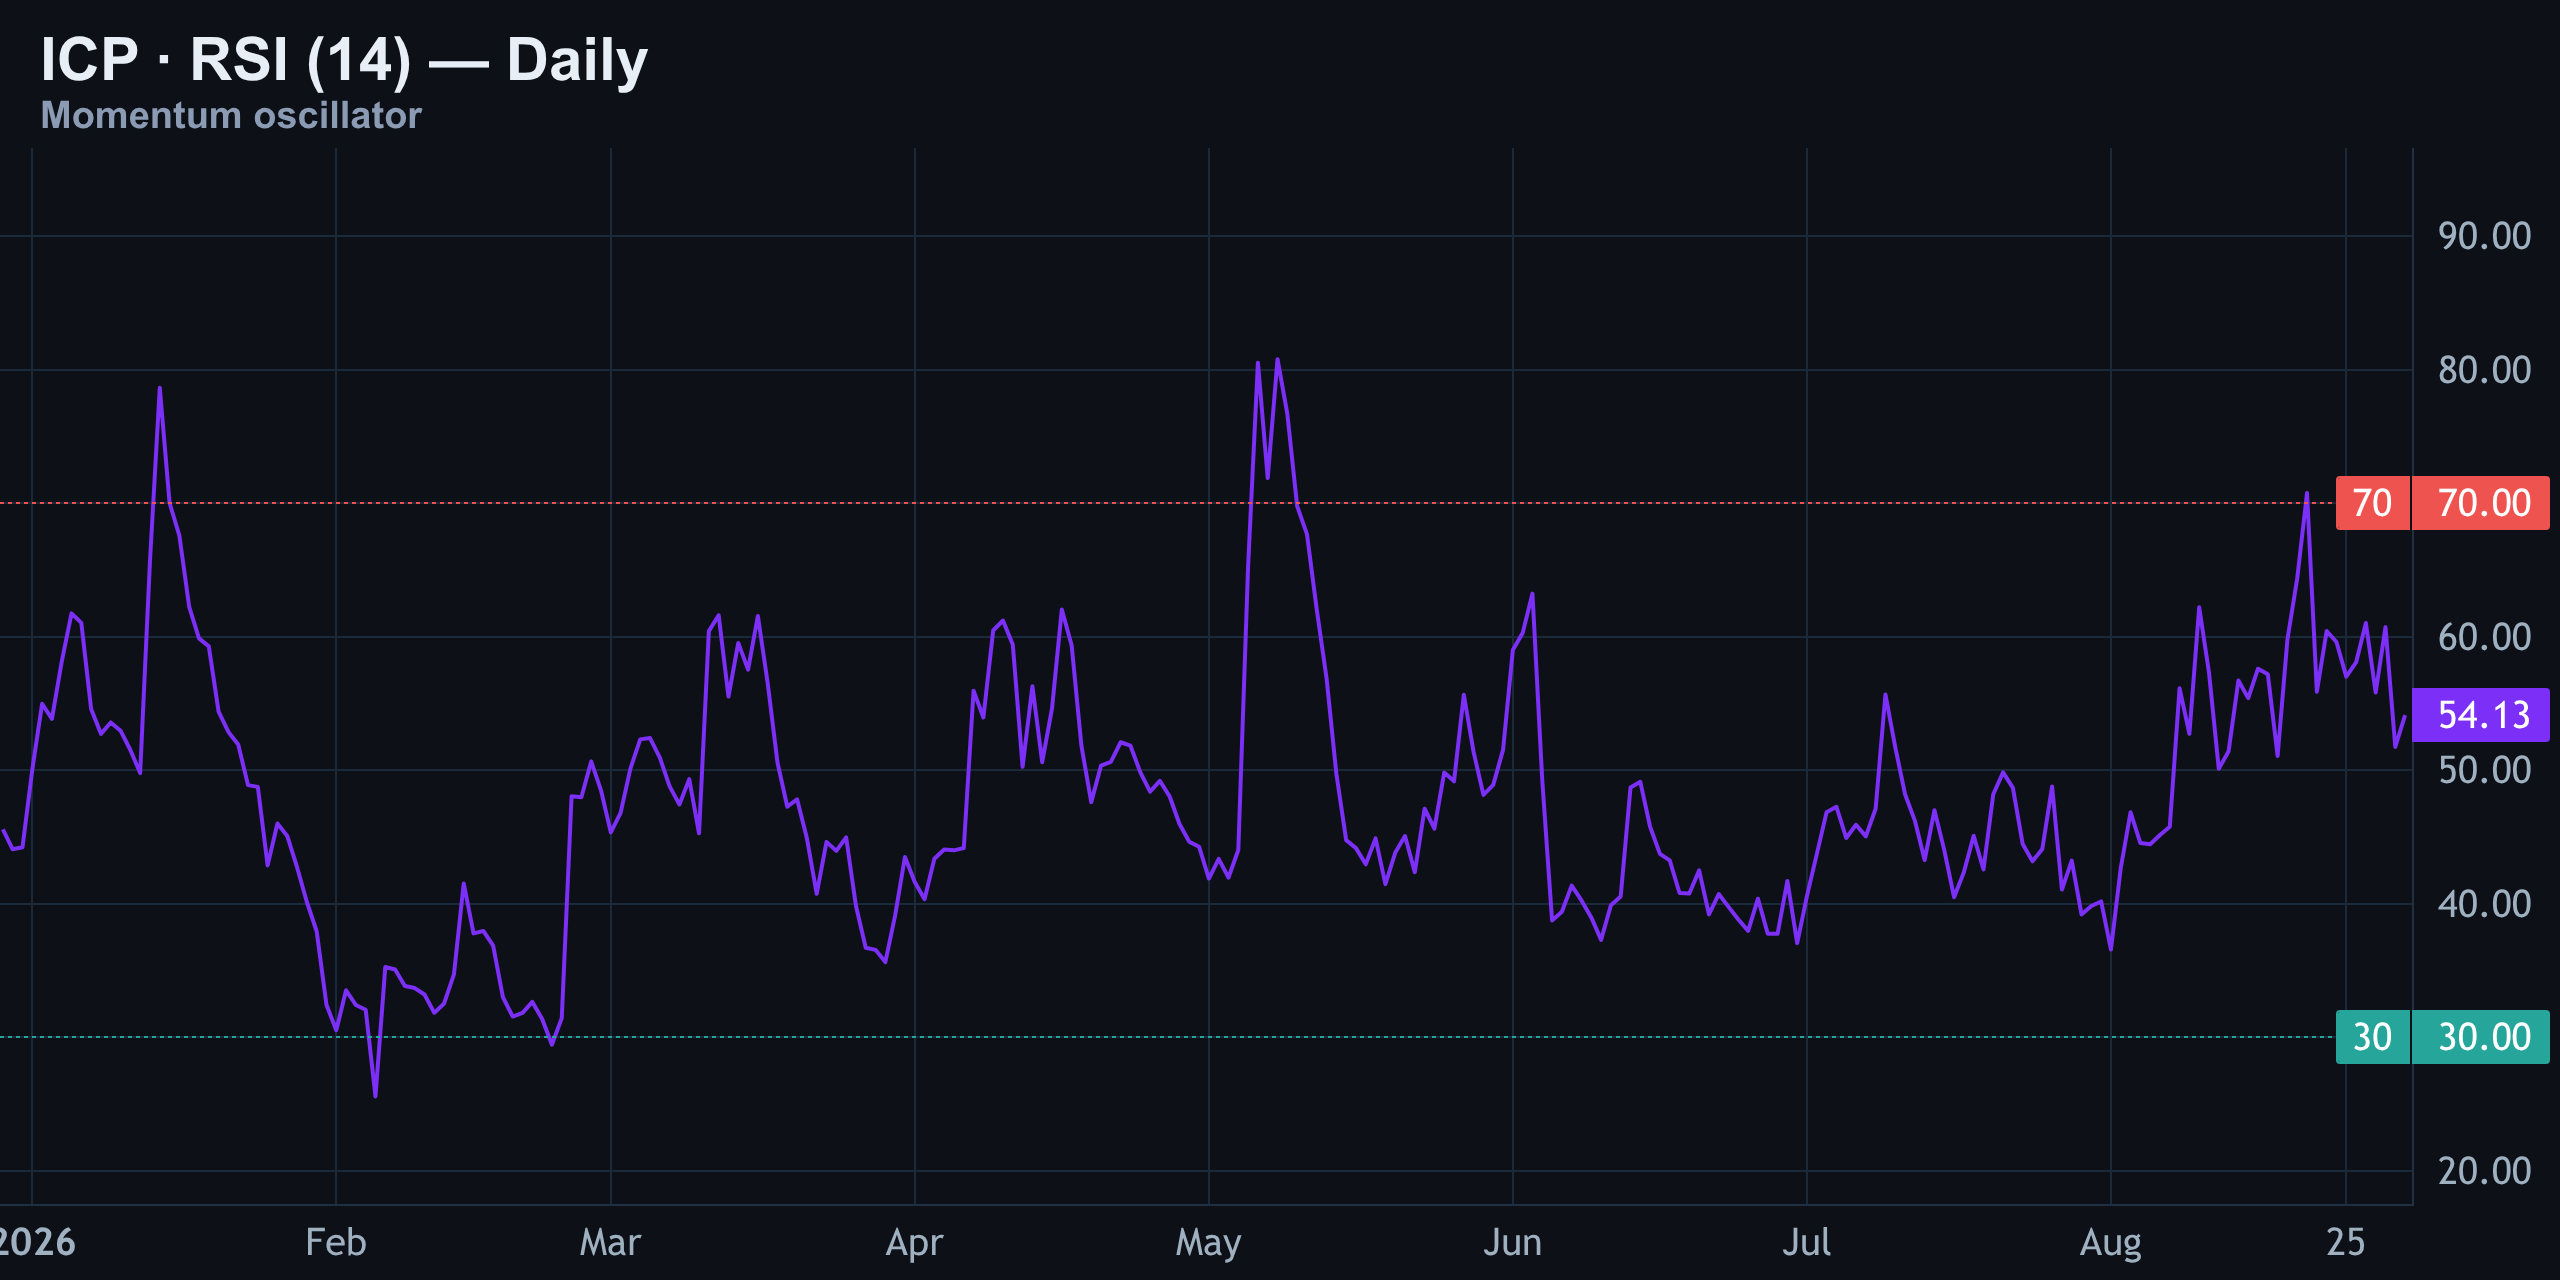
The daily RSI is 54, almost exactly the kind of reading expected in a range. It is neither oversold nor overbought, so it does not provide a strong reversal signal. The positive interpretation is that momentum has room to expand if price breaks higher. The negative interpretation is that there is no oversold cushion beneath the market if crowded longs begin to unwind.
The daily MACD is less encouraging. It remains below its signal line and the histogram is negative. That is a bearish momentum warning, although it is not a standalone sell signal while price remains range-bound.
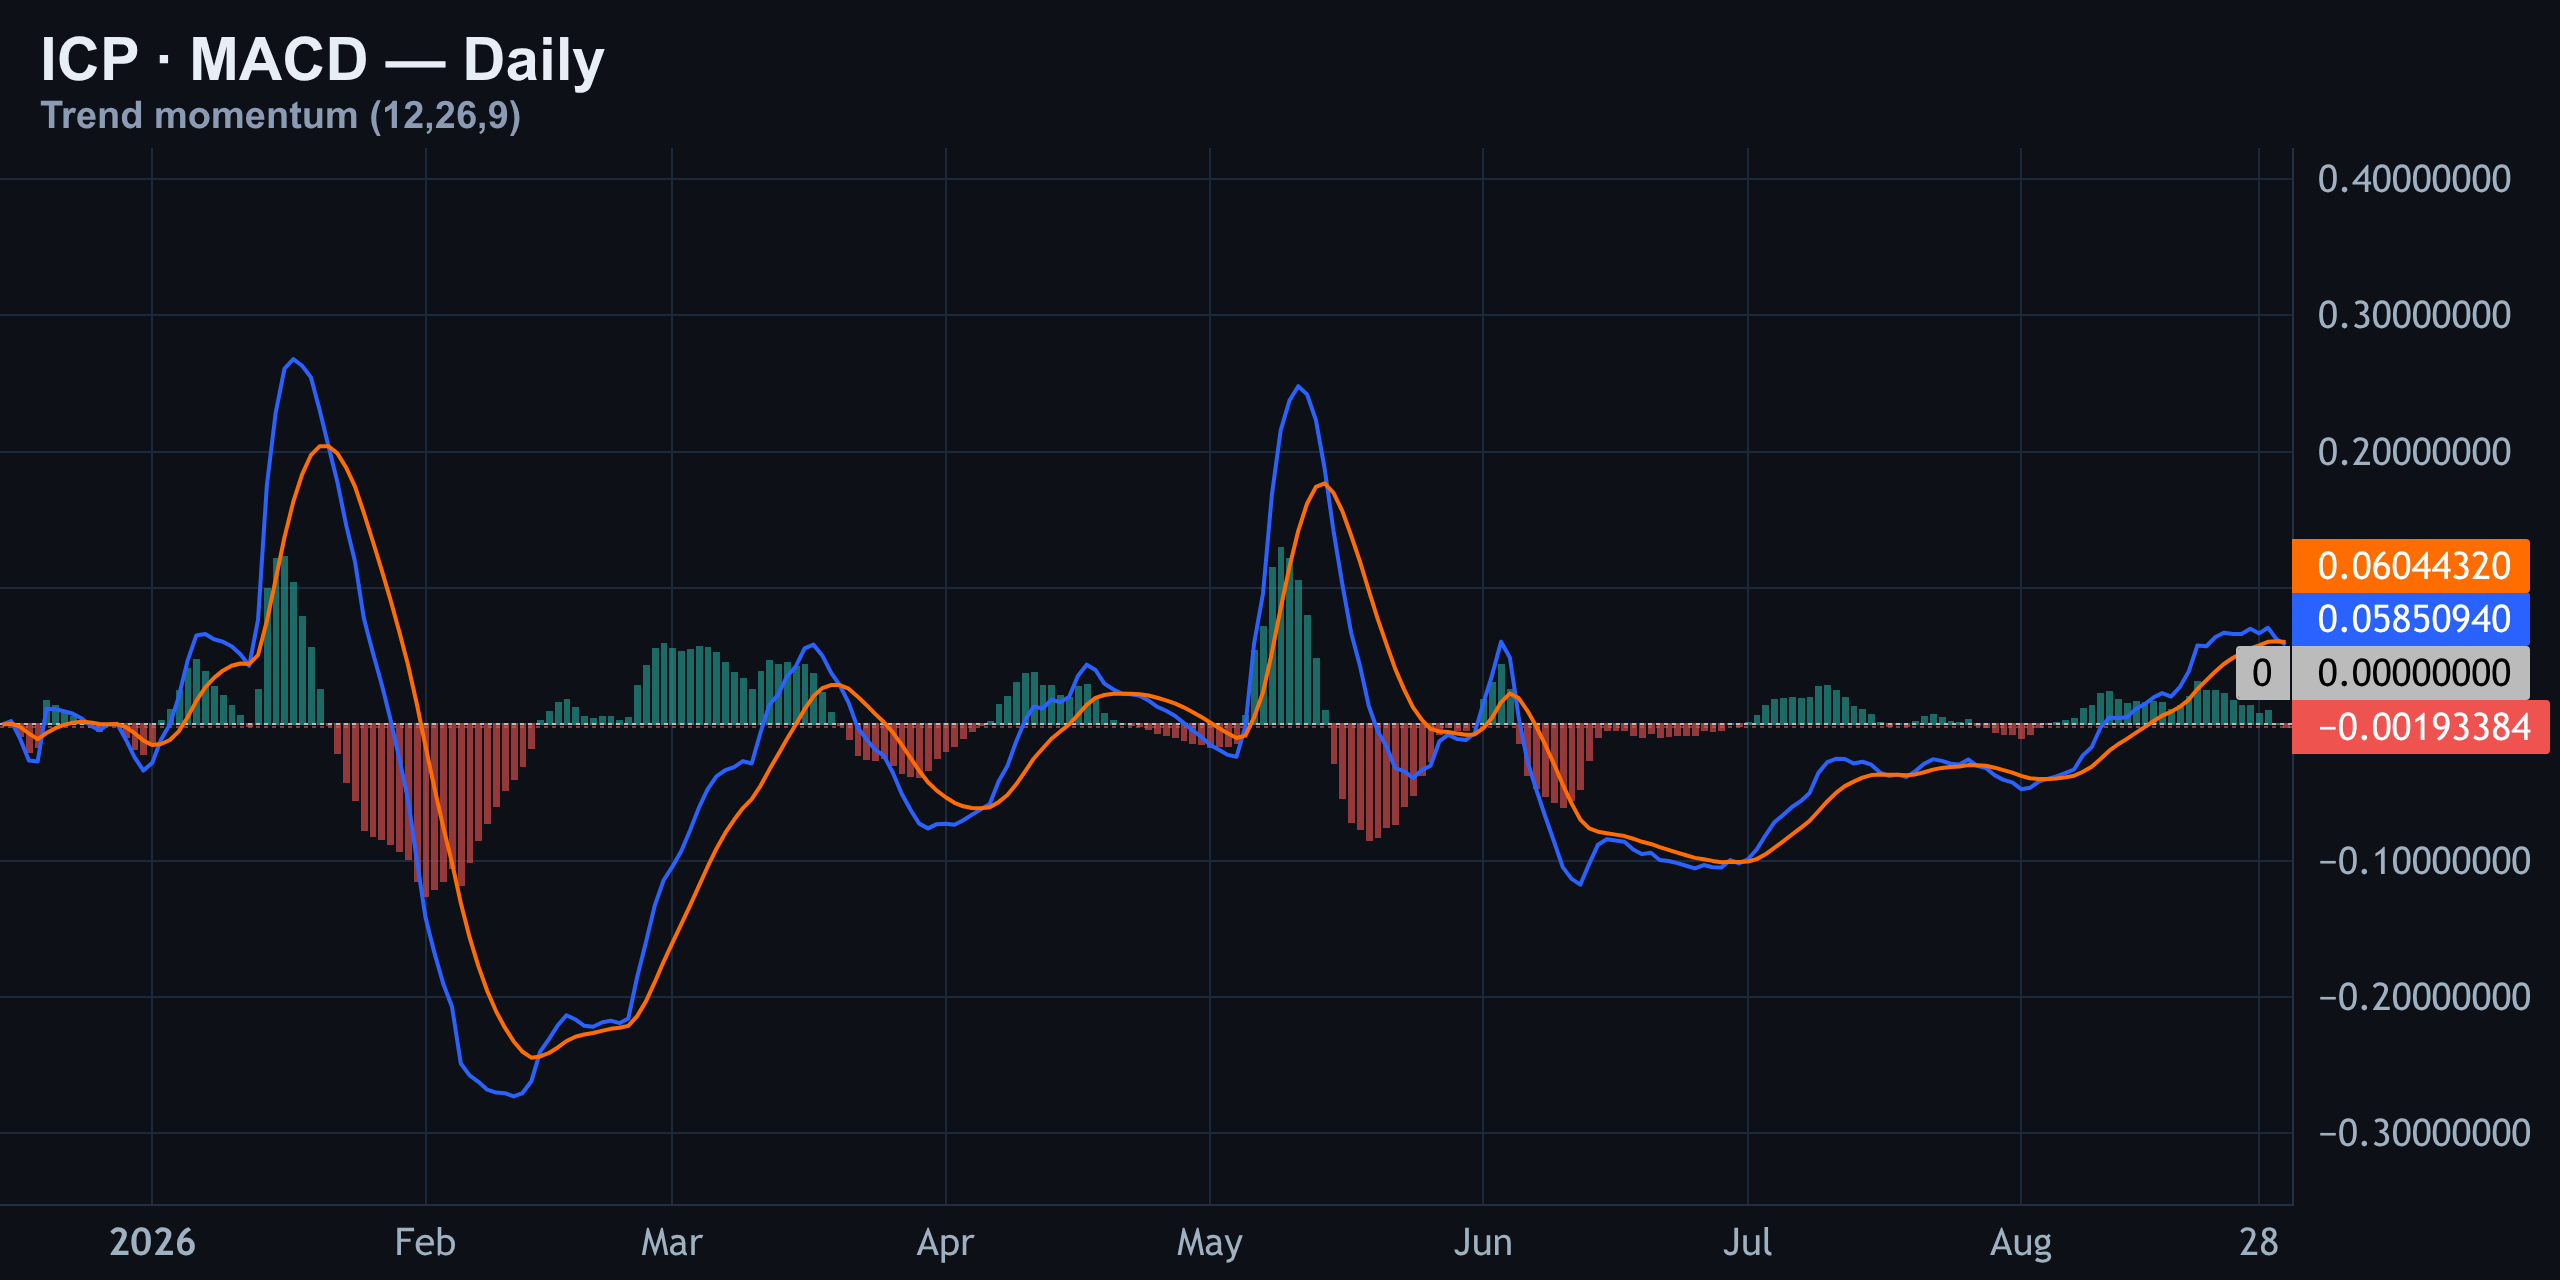
The important divergence is between aggressive taker buying and softening momentum. Buyers are pressing in the short term, but the trend engine has not confirmed them. Until MACD turns upward and price accepts above nearby resistance, rallies can remain countertrend moves inside the range rather than the start of sustained expansion.
| Indicator | Reading | Signal |
|---|---|---|
| Daily RSI (14) | 54 | Neutral; no overbought or oversold edge |
| Daily MACD | Below signal | Momentum leans bearish |
| MACD histogram | Negative | Trend confirmation is still absent |
Liquidation Heatmap, Positioning and the Trade Plan
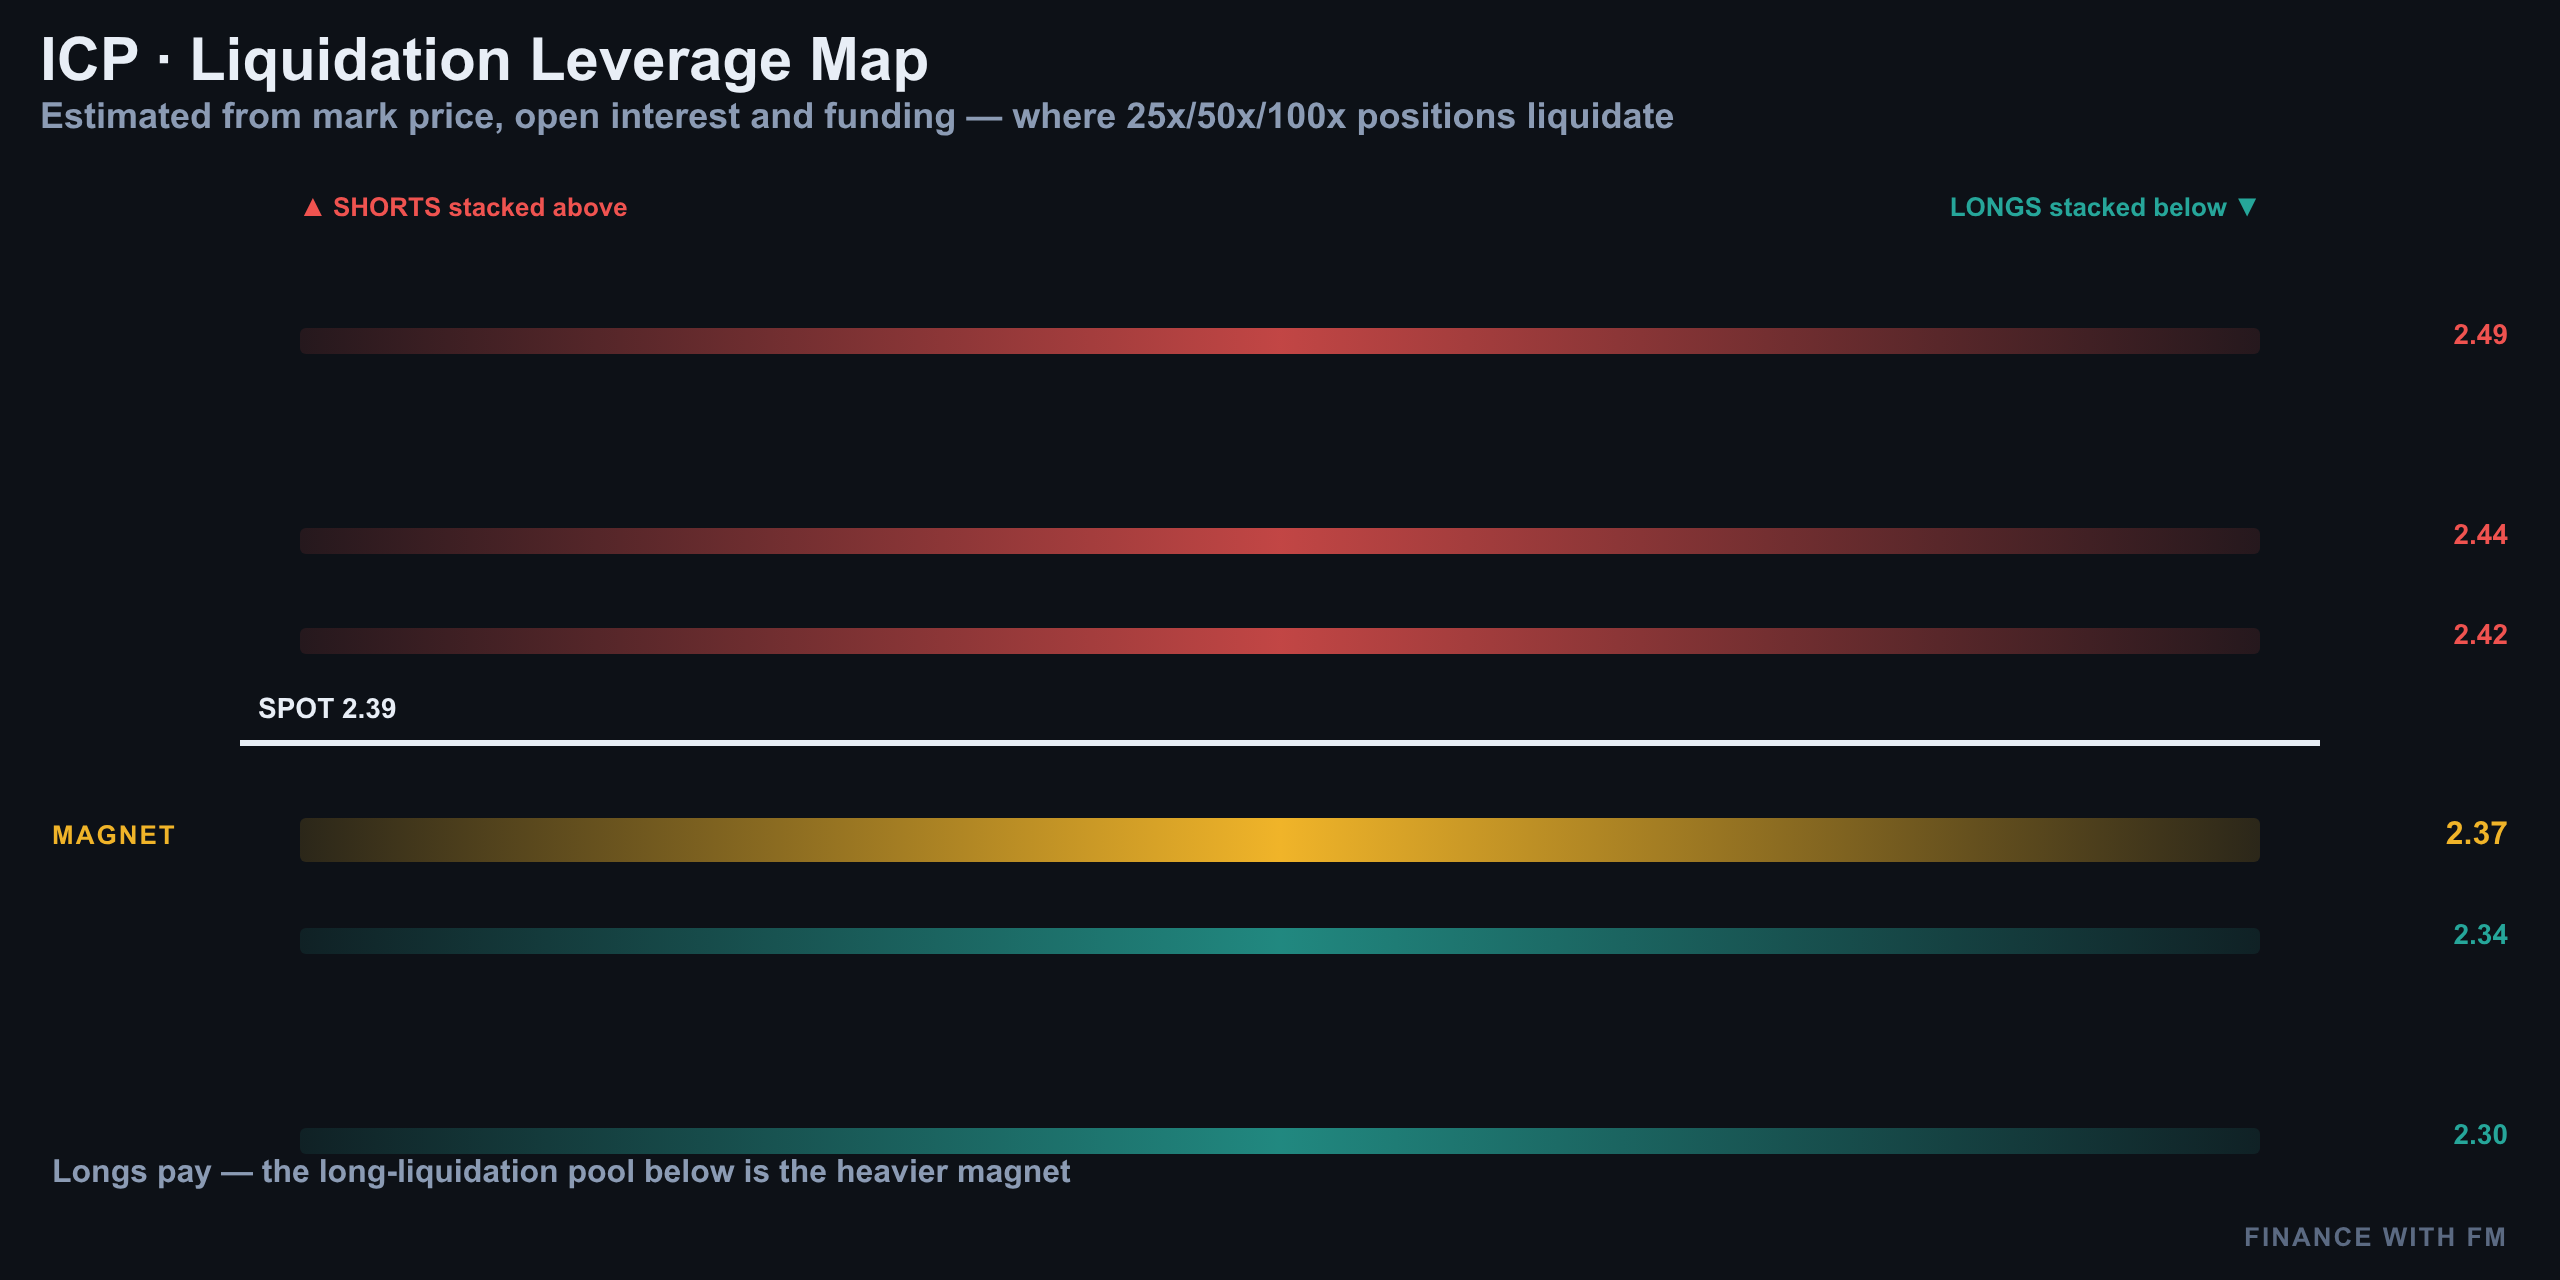
The liquidation heatmap shows a larger visible pool beneath spot than above it. That matters because positive funding and long-skewed positioning can turn a support break into a rapid flush. The market does not need a major fundamental shock if leveraged traders are already positioned in the same direction.
| Area | Price | Trading relevance |
|---|---|---|
| Primary watched support | $2.369 | Structure must hold to keep the bounce constructive |
| Lower liquidation cluster | $2.377 | Potential first downside liquidity zone |
| Lower liquidation cluster | $2.348 | Next liquidation area beneath support |
| Lower liquidation cluster | $2.334 | Deeper downside liquidity target |
| Upper resistance | $2.419 | First reclaim level for buyers |
| Higher resistance | $2.531 | Stronger upside confirmation area |
| Largest visible bid | $2.25 | Potential demand below the heatmap clusters |
| Largest visible ask | $2.70 | Major overhead supply reference |
Funding is positive at 0.0100%, or approximately 11% annualized. Longs are paying to remain open, which raises the cost of waiting and increases squeeze-down risk. Open interest stands at 9,005,792 ICP, down 5.1% over seven days. Falling open interest suggests that leverage has been flushing, but it does not by itself prove accumulation.
Account positioning remains long-skewed at 1.53. This leaves the market vulnerable to a downside move if price cannot reclaim $2.419. Conversely, a clean break and hold above the upper range could force late shorts to cover, especially if open interest begins rebuilding alongside price.
Why the desk is standing aside
There is no clean 1:2.5 trade today. Buying near $2.40 means entering in the middle of a range with resistance close overhead. Shorting immediately also lacks confirmation because support has not decisively failed. The professional response is not inactivity for its own sake; it is refusing to accept poor asymmetry.
| Scenario | Confirmation | Desk response |
|---|---|---|
| Bullish expansion | Acceptance above $2.419, then strength toward $2.531 | Reassess for a long only after confirmation |
| Bearish breakdown | Decisive loss of $2.369 | Watch $2.348 and $2.334 liquidity zones |
| Range continuation | Price remains between support and resistance | Stand aside; avoid middle-of-range entries |
For broader market context, traders can compare the live ICP market with data from CoinGecko and review derivatives information through CoinGlass. Those sources can vary by exchange and timestamp, so they should be treated as confirmation tools rather than replacements for the chart structure above.
ICP Daily Pulse Summary
ICP is down on the day, but the market is not showing a simple seller-controlled trend. Buyers are lifting offers, the order book remains bid-heavy, and the daily recovery channel is still intact. Against that, funding is positive, account positioning is long-skewed, MACD is bearish, and open interest has been declining.
- The intraday chart is balanced and choppy rather than decisively bullish.
- The four-hour structure remains a range between major moving averages.
- RSI near 54 offers no strong directional edge.
- MACD remains a bearish momentum warning until it turns higher.
- The key decision level is $2.369, with downside liquidity clustered below it.
- There is no fresh trade with a clean 1:2.5 setup at current prices.
The market can resolve higher, but it needs acceptance above resistance and better momentum confirmation. It can also resolve lower if crowded longs lose the level that currently supports the recovery. Until one of those conditions appears, standing aside is a position: it preserves capital and avoids paying for uncertainty.
This analysis is educational and not financial advice. Crypto assets are volatile, leverage can produce rapid losses, and every trade should be sized according to personal risk tolerance.
Previous days
08/28/2026 — ICP Price Analysis August 28, 2026: Dip or Squeeze?
ICP Price Analysis August 28, 2026: Dip or Squeeze?
ICP Daily Pulse: A Market Caught Between Support and Supply
ICP is trading near $2.41 on August 28, 2026, after moving from approximately $2.39 to $2.41 over the past six days. That is a gain of about 0.8%, but the advance has not yet developed into a decisive breakout. The immediate tape is mixed: Coinbase data indicates institutional bidding, while taker-flow data shows that aggressive sellers remain in control.
The result is a fragile range rather than a clean trend. ICP is up roughly 0.42% over 24 hours and has traded inside today’s $2.40 to $2.49 range. Positive funding suggests that long traders are paying to maintain exposure, while falling open interest indicates that some leverage has already been removed. That combination can support a controlled rebound, but it also leaves the market vulnerable to a fast long squeeze.
| Metric | Current read | What it means |
|---|---|---|
| Reference price | $2.41 | ICP remains inside a short-term range |
| 24-hour change | +0.42% | Small positive move, not a confirmed breakout |
| Six-day change | +0.8% | Recovery has been measured |
| Daily RSI (14) | 58 | Moderately constructive, not overbought |
| Funding | +0.01% | Longs are paying; squeeze-down risk remains |
| Seven-day open interest | -3.1% | Leverage has been coming out |
| Taker buy-to-sell ratio | 0.74 | Aggressive selling is dominating |
The previous update stood aside because price was trapped between the 50-day and 200-day moving averages. No target or stop was hit because no position was opened. That patience call remains valid: price has improved, but the market still has not supplied the confirmation needed for a high-conviction directional trade.
15-Minute ICP Chart: Rejection at $2.49 Changes the Immediate Read
The 15-minute chart shows why chasing ICP in the middle of the range is unattractive. Price pushed toward $2.49, met resistance and then rejected sharply back toward the $2.40 area. Selling volume expanded during that decline, while the rebound has been more measured. That is not the profile of a confirmed intraday breakout.
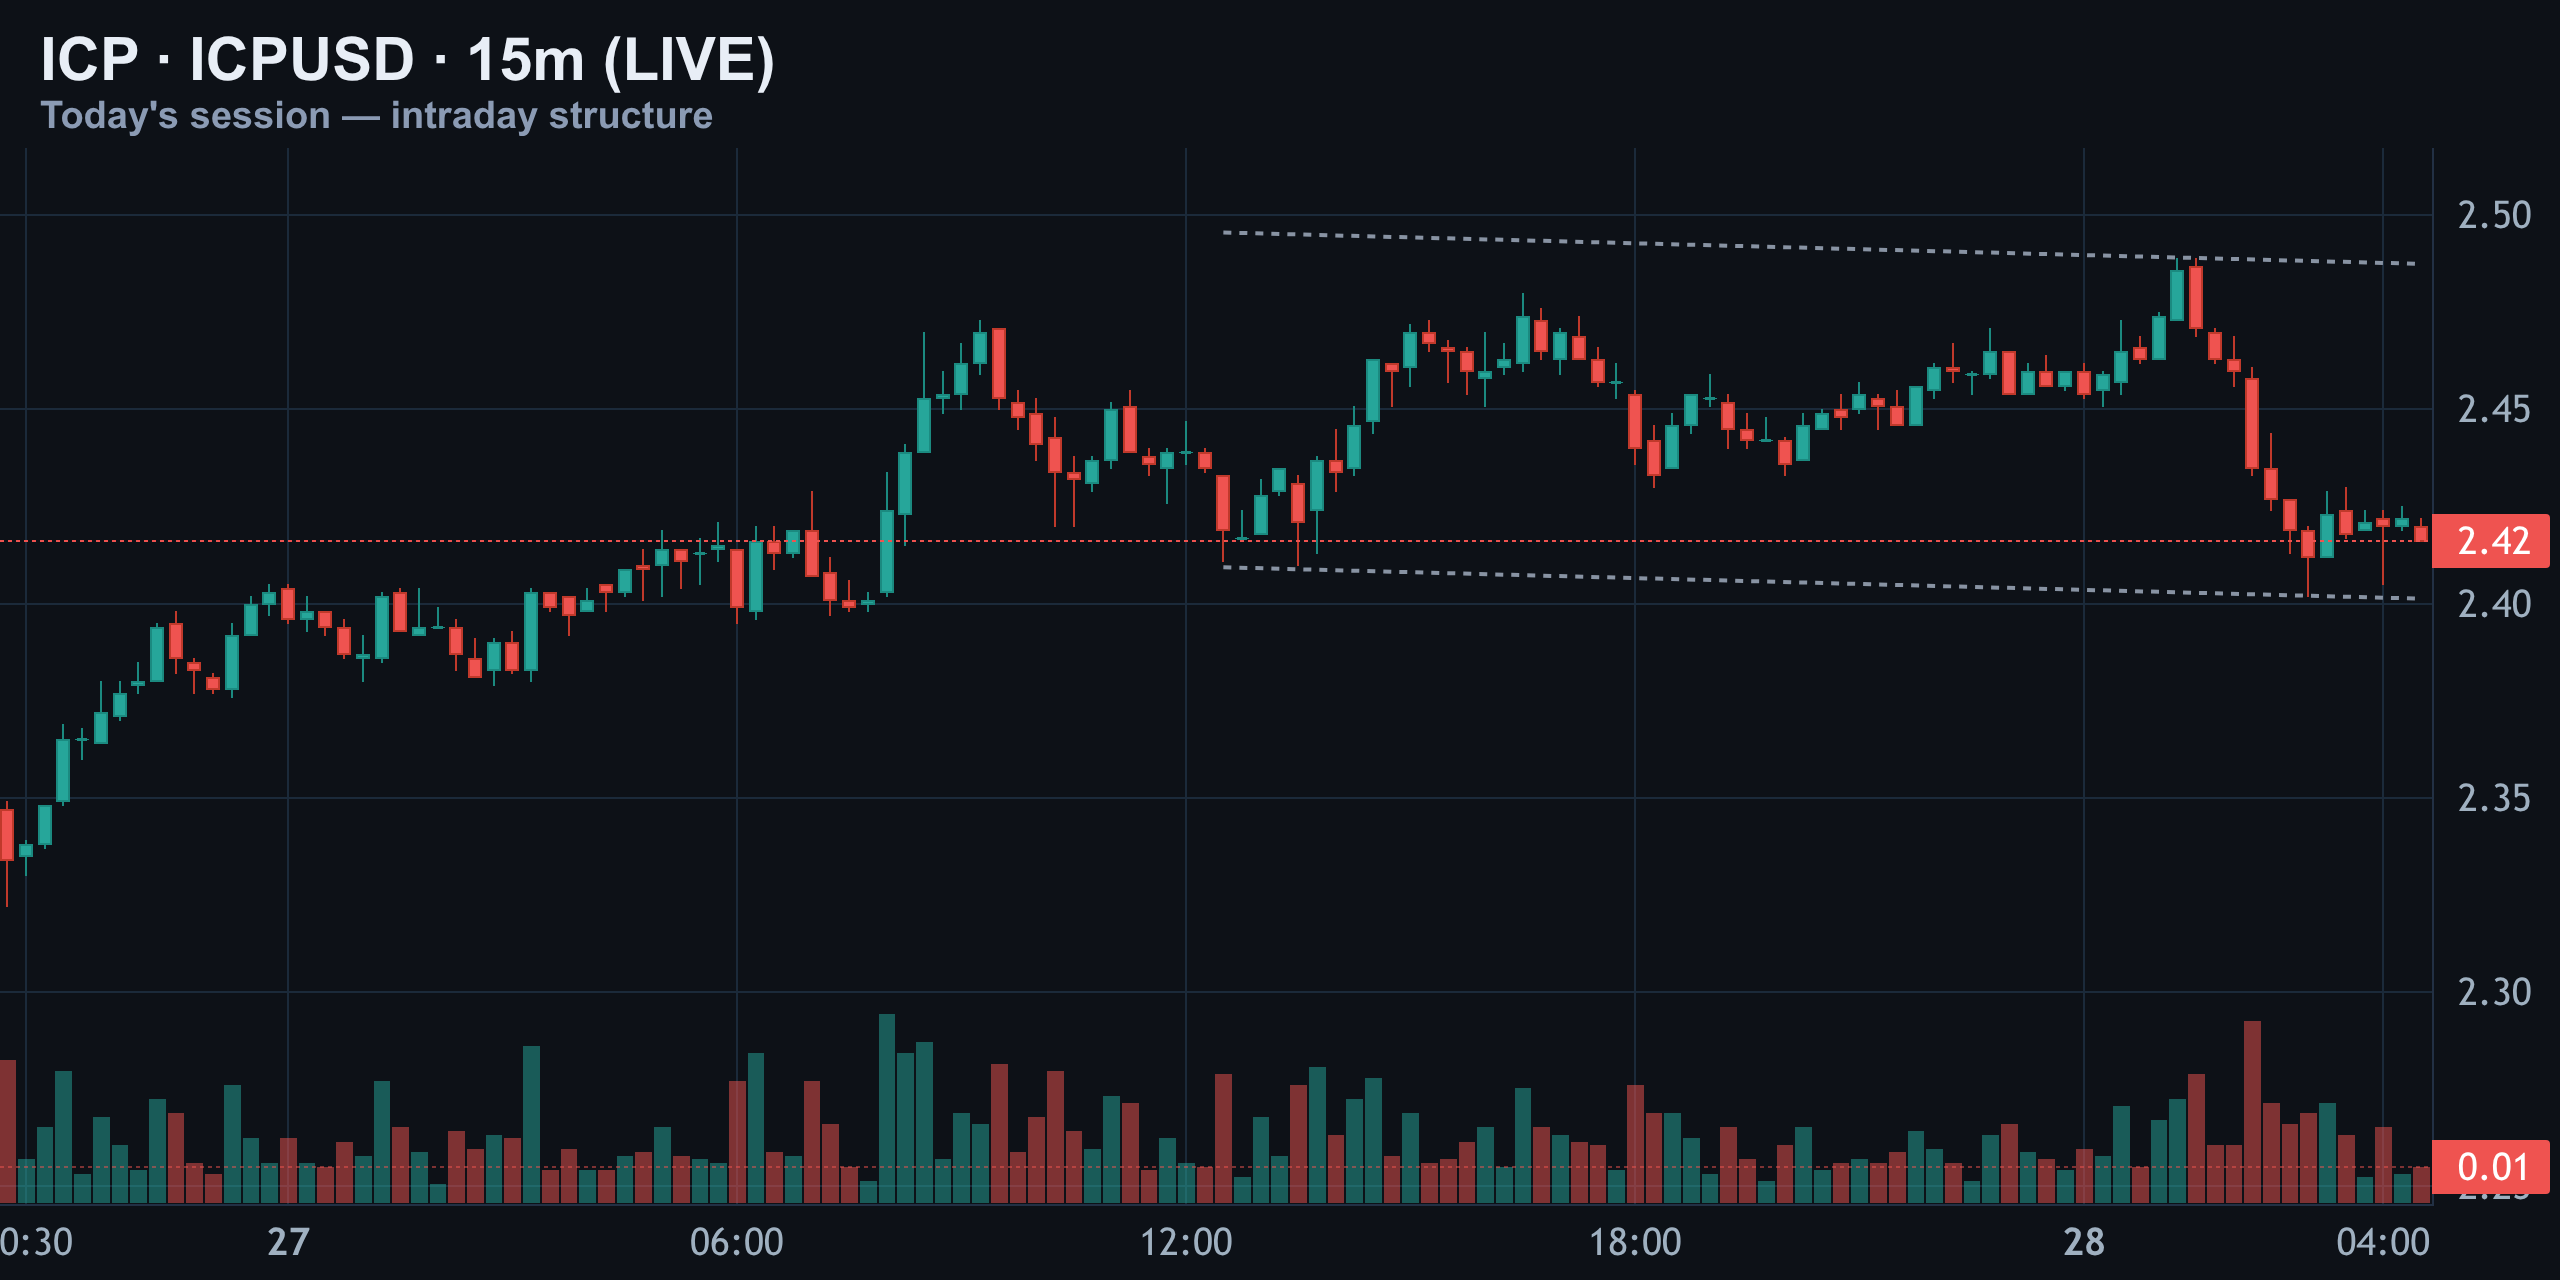
For the intraday structure to improve, buyers need to defend the lower band and begin printing higher lows. A move back above $2.49 would show that supply at the top of the range is being absorbed. Until then, the market can sweep nearby liquidity in either direction before selecting its next trend.
The practical lesson is simple: stabilization comes before breakout. Buying after a controlled retracement near the computed entry is structurally better than buying after a fast move into resistance. Conversely, a clean loss of the lower band would weaken the long thesis and make the liquidation pocket below spot more important.
- Constructive intraday signal: support holds and price forms higher lows.
- Confirmation signal: price reclaims and accepts above $2.49.
- Warning signal: another high-volume rejection followed by a loss of $2.40.
- Poor location: entering around the middle of the $2.40 to $2.49 range without confirmation.
Four-Hour and Daily Structure: Recovery, but Still Inside a Larger Range
The four-hour structure is more constructive than the intraday tape. ICP remains inside an ascending channel that began near the $2.00 area, with price consolidating around $2.42 after the latest pullback. This channel gives the tactical long idea a structural foundation, but it is valid only while support holds.
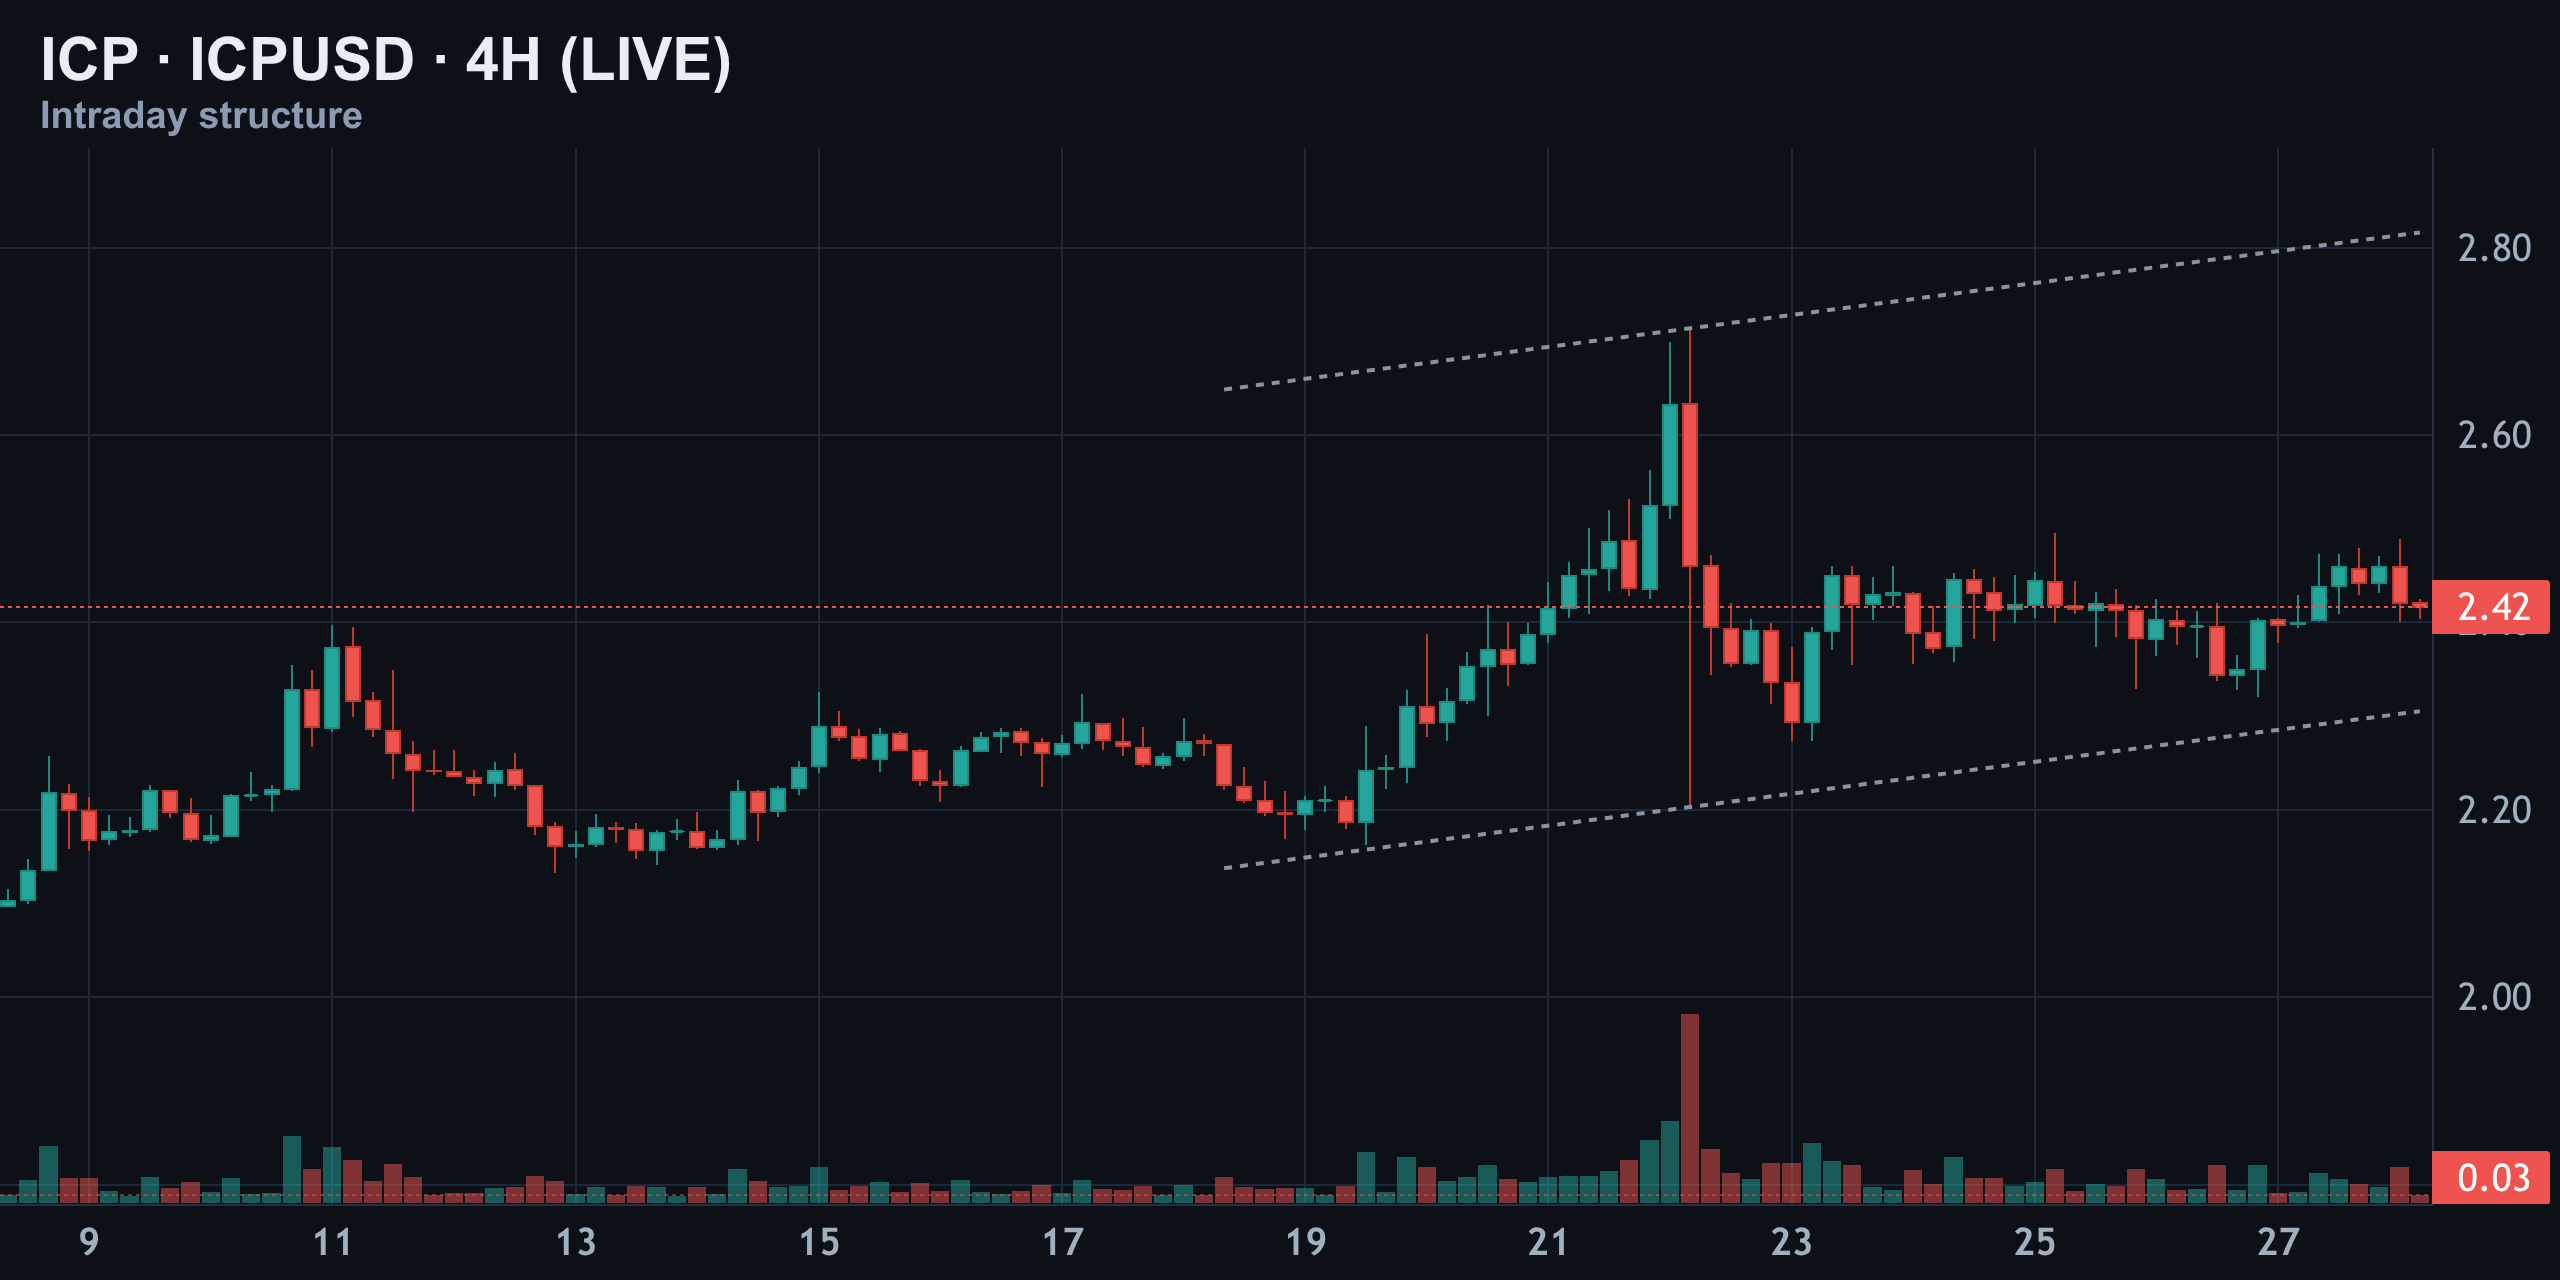
A four-hour close below $2.34 would invalidate the computed trade setup and suggest that the recent advance has failed. On the upside, $2.49 is the first recovery test. The larger short-term trend therefore points upward while support remains intact, but the trend is conditional rather than established.
The short-term daily view adds important context. ICP is recovering from a prolonged decline and has built a visible base near $1.99, yet it remains far below major resistance around $4.09. That distant level is useful for understanding the broader range, not for setting a realistic target for today into tomorrow.
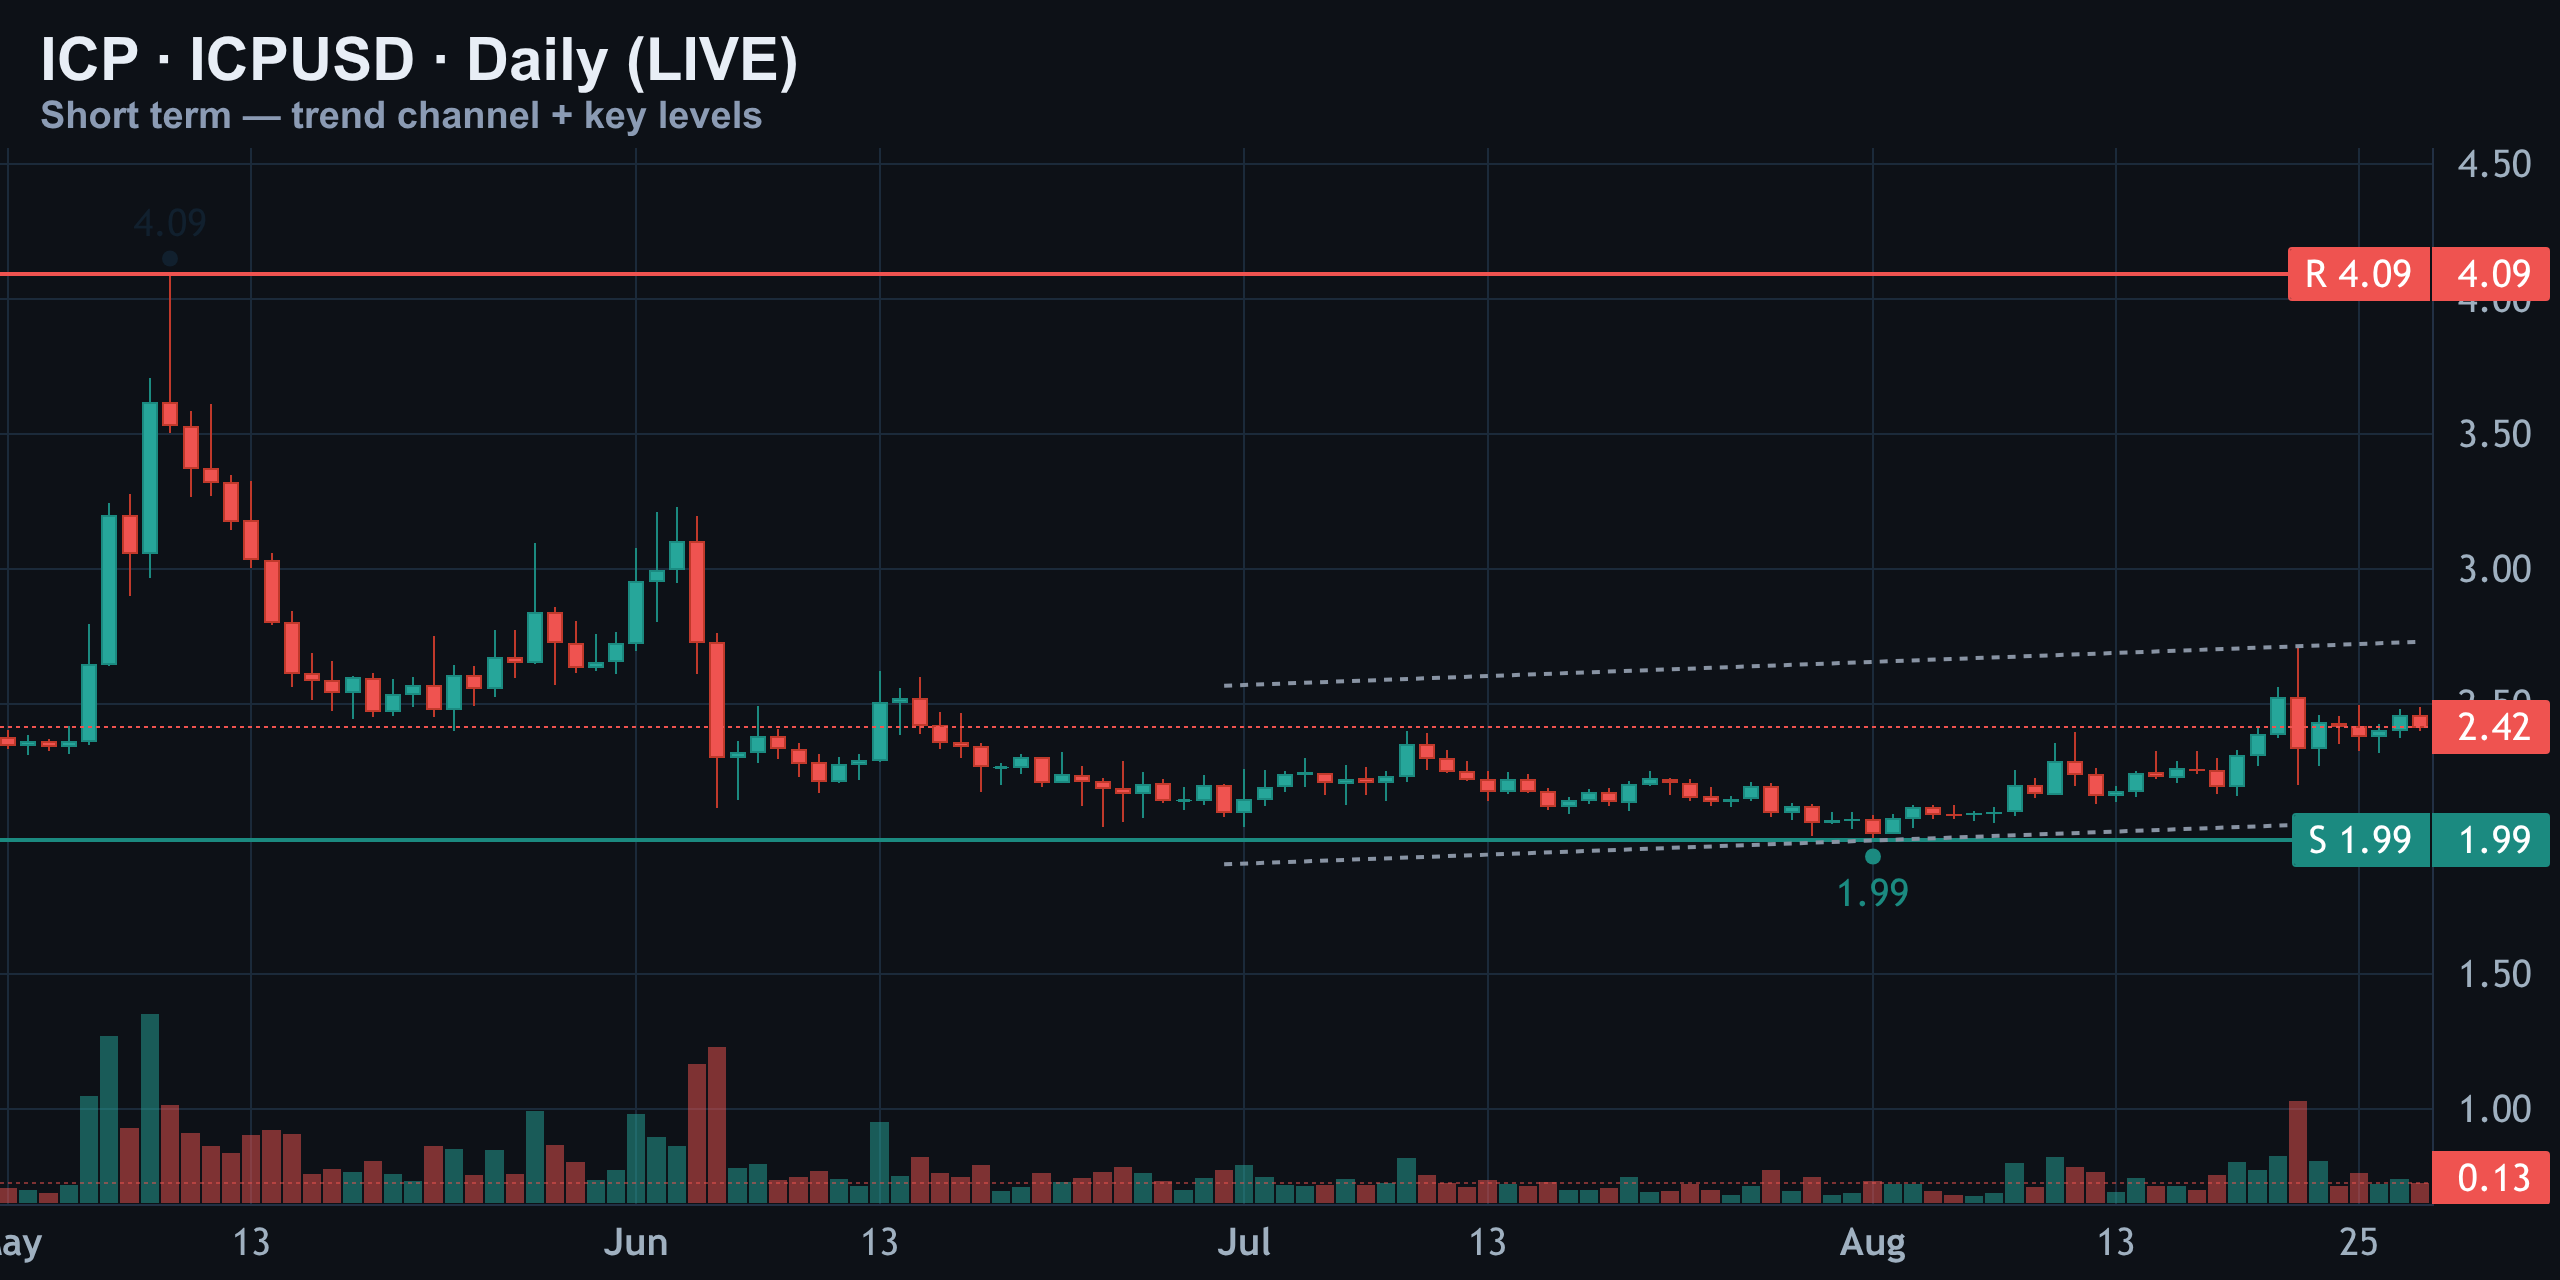
The daily message is compression above the base. ICP has improved, but it has not converted the broader range into a sustained trend. Rallies should therefore be treated as tests until price demonstrates acceptance above nearby resistance and begins building support at higher levels.
ICP Momentum: RSI and MACD Support a Measured Bounce
Daily RSI (14) is 58, placing momentum in a neutral-to-moderately constructive zone. RSI has recovered from weaker levels, but it is not overbought and does not show an obvious exhaustion signal. That leaves room for ICP to rise if price holds the four-hour structure.
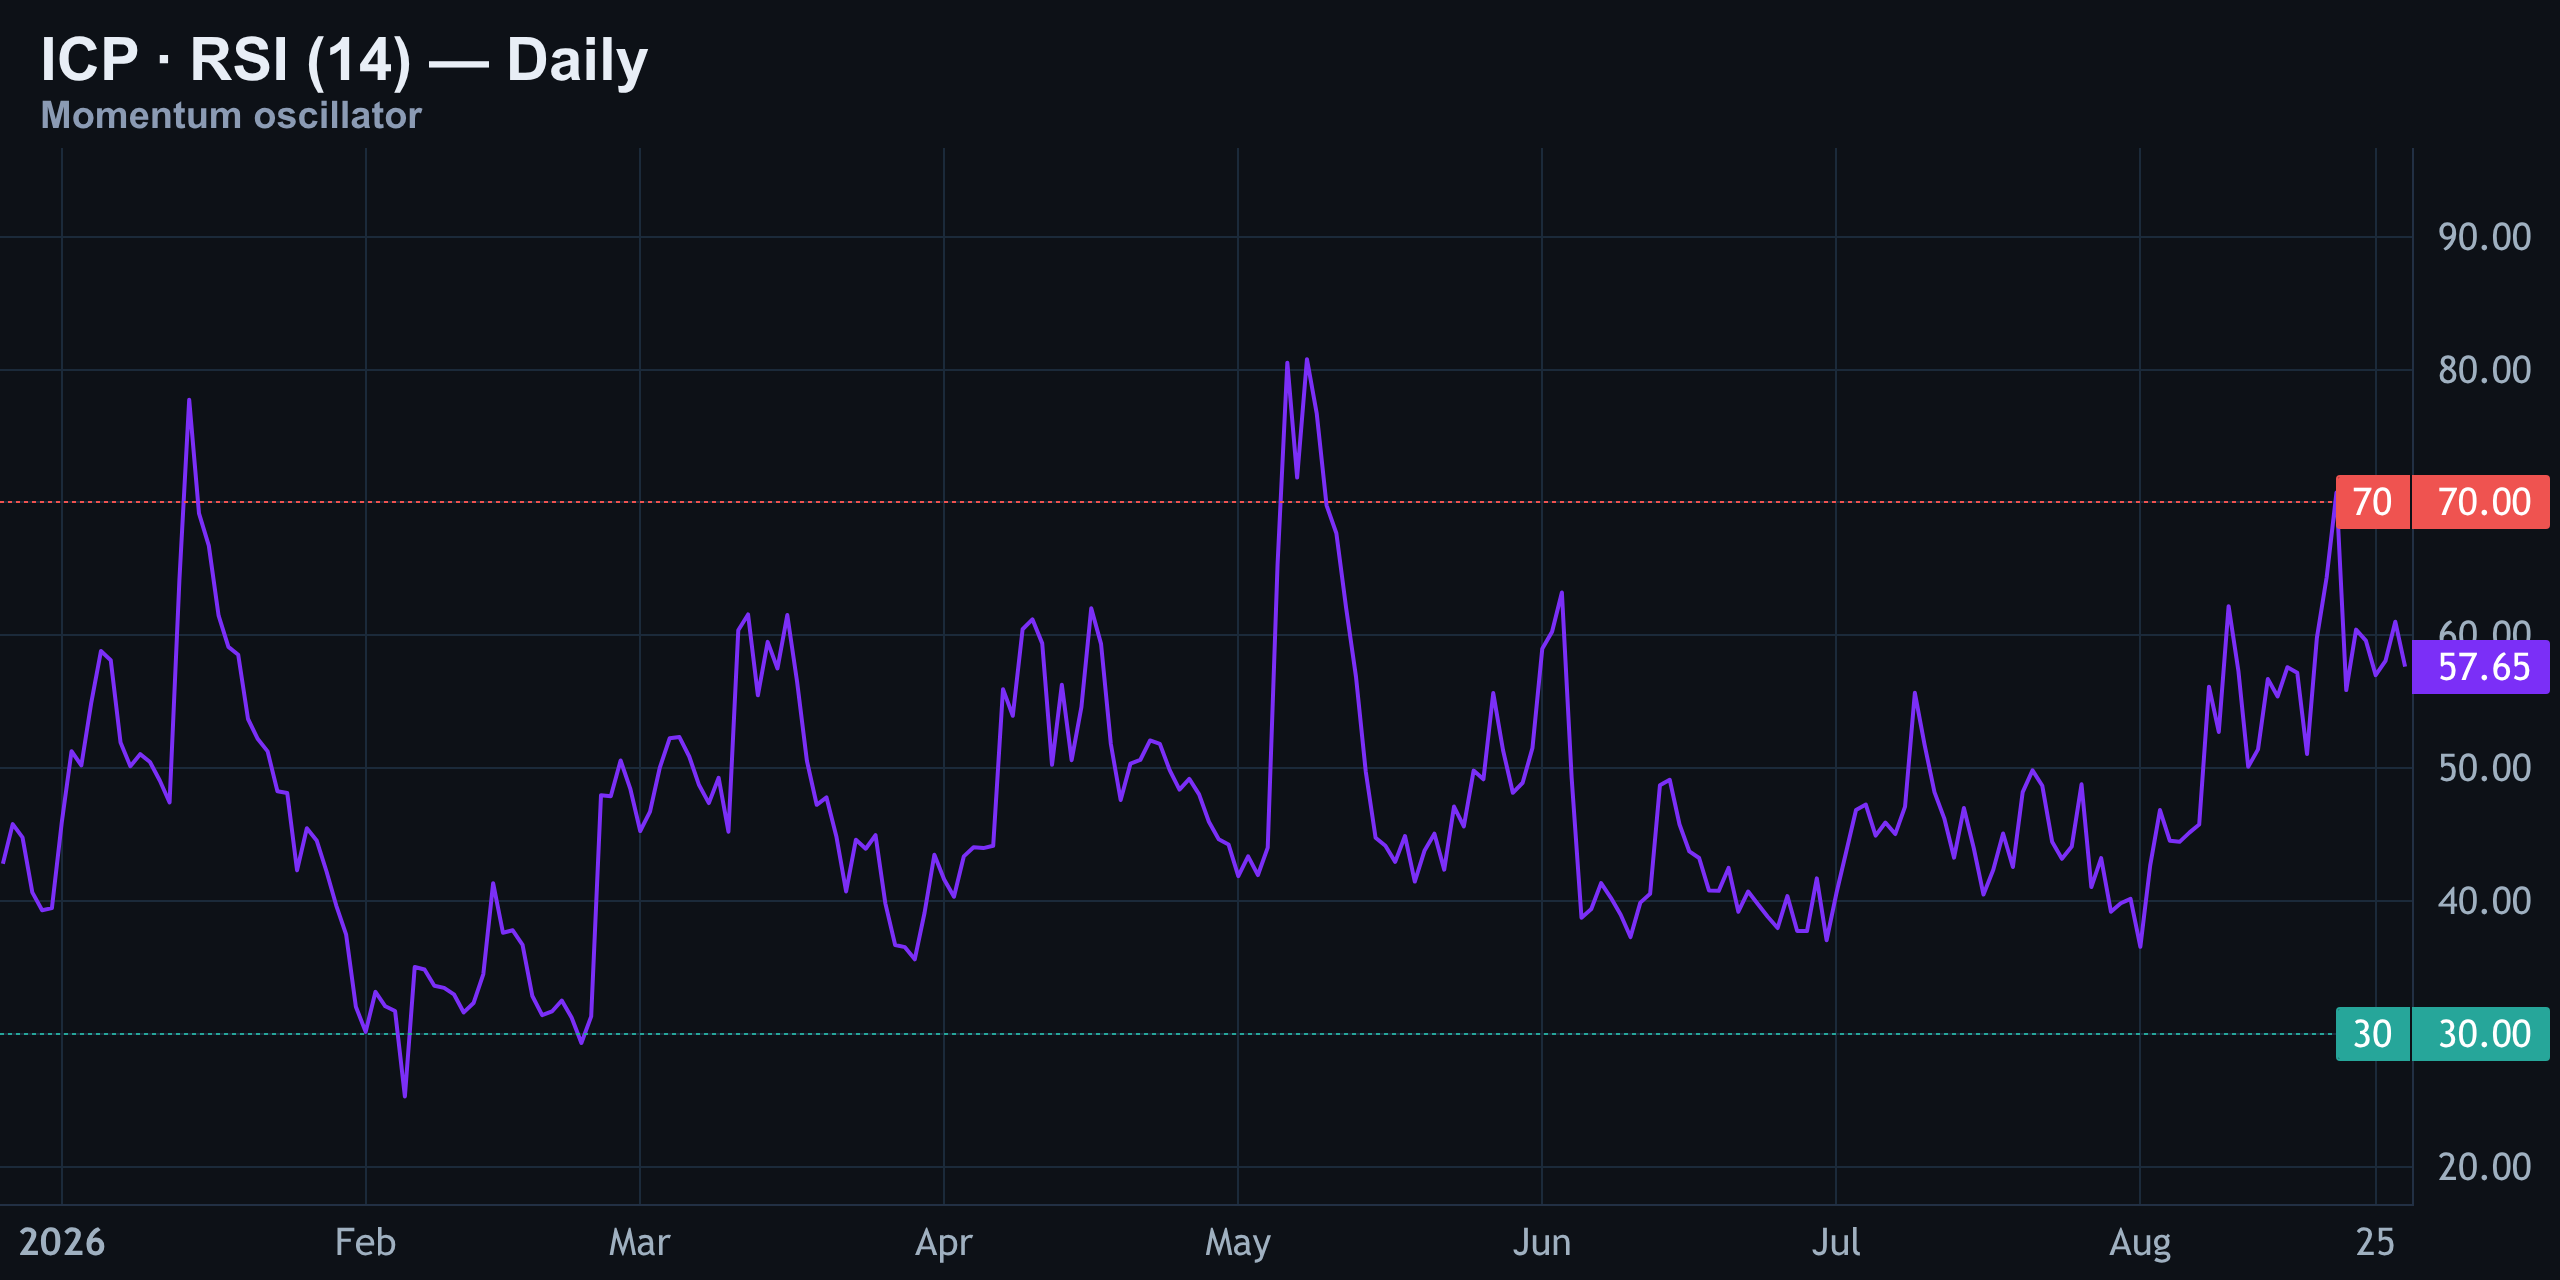
The important limitation is that RSI provides room, not certainty. Derivatives positioning remains vulnerable because longs are paying positive funding, and aggressive taker selling is still visible. A healthy RSI reading can coexist with a sharp downside flush when leveraged traders are crowded on one side.
Daily MACD is above its signal line and the histogram is positive. This confirms that the short-term directional impulse has turned upward and aligns with the ascending four-hour channel. However, the improvement is modest rather than explosive. MACD confirms momentum direction; it does not confirm that resistance has been cleared.
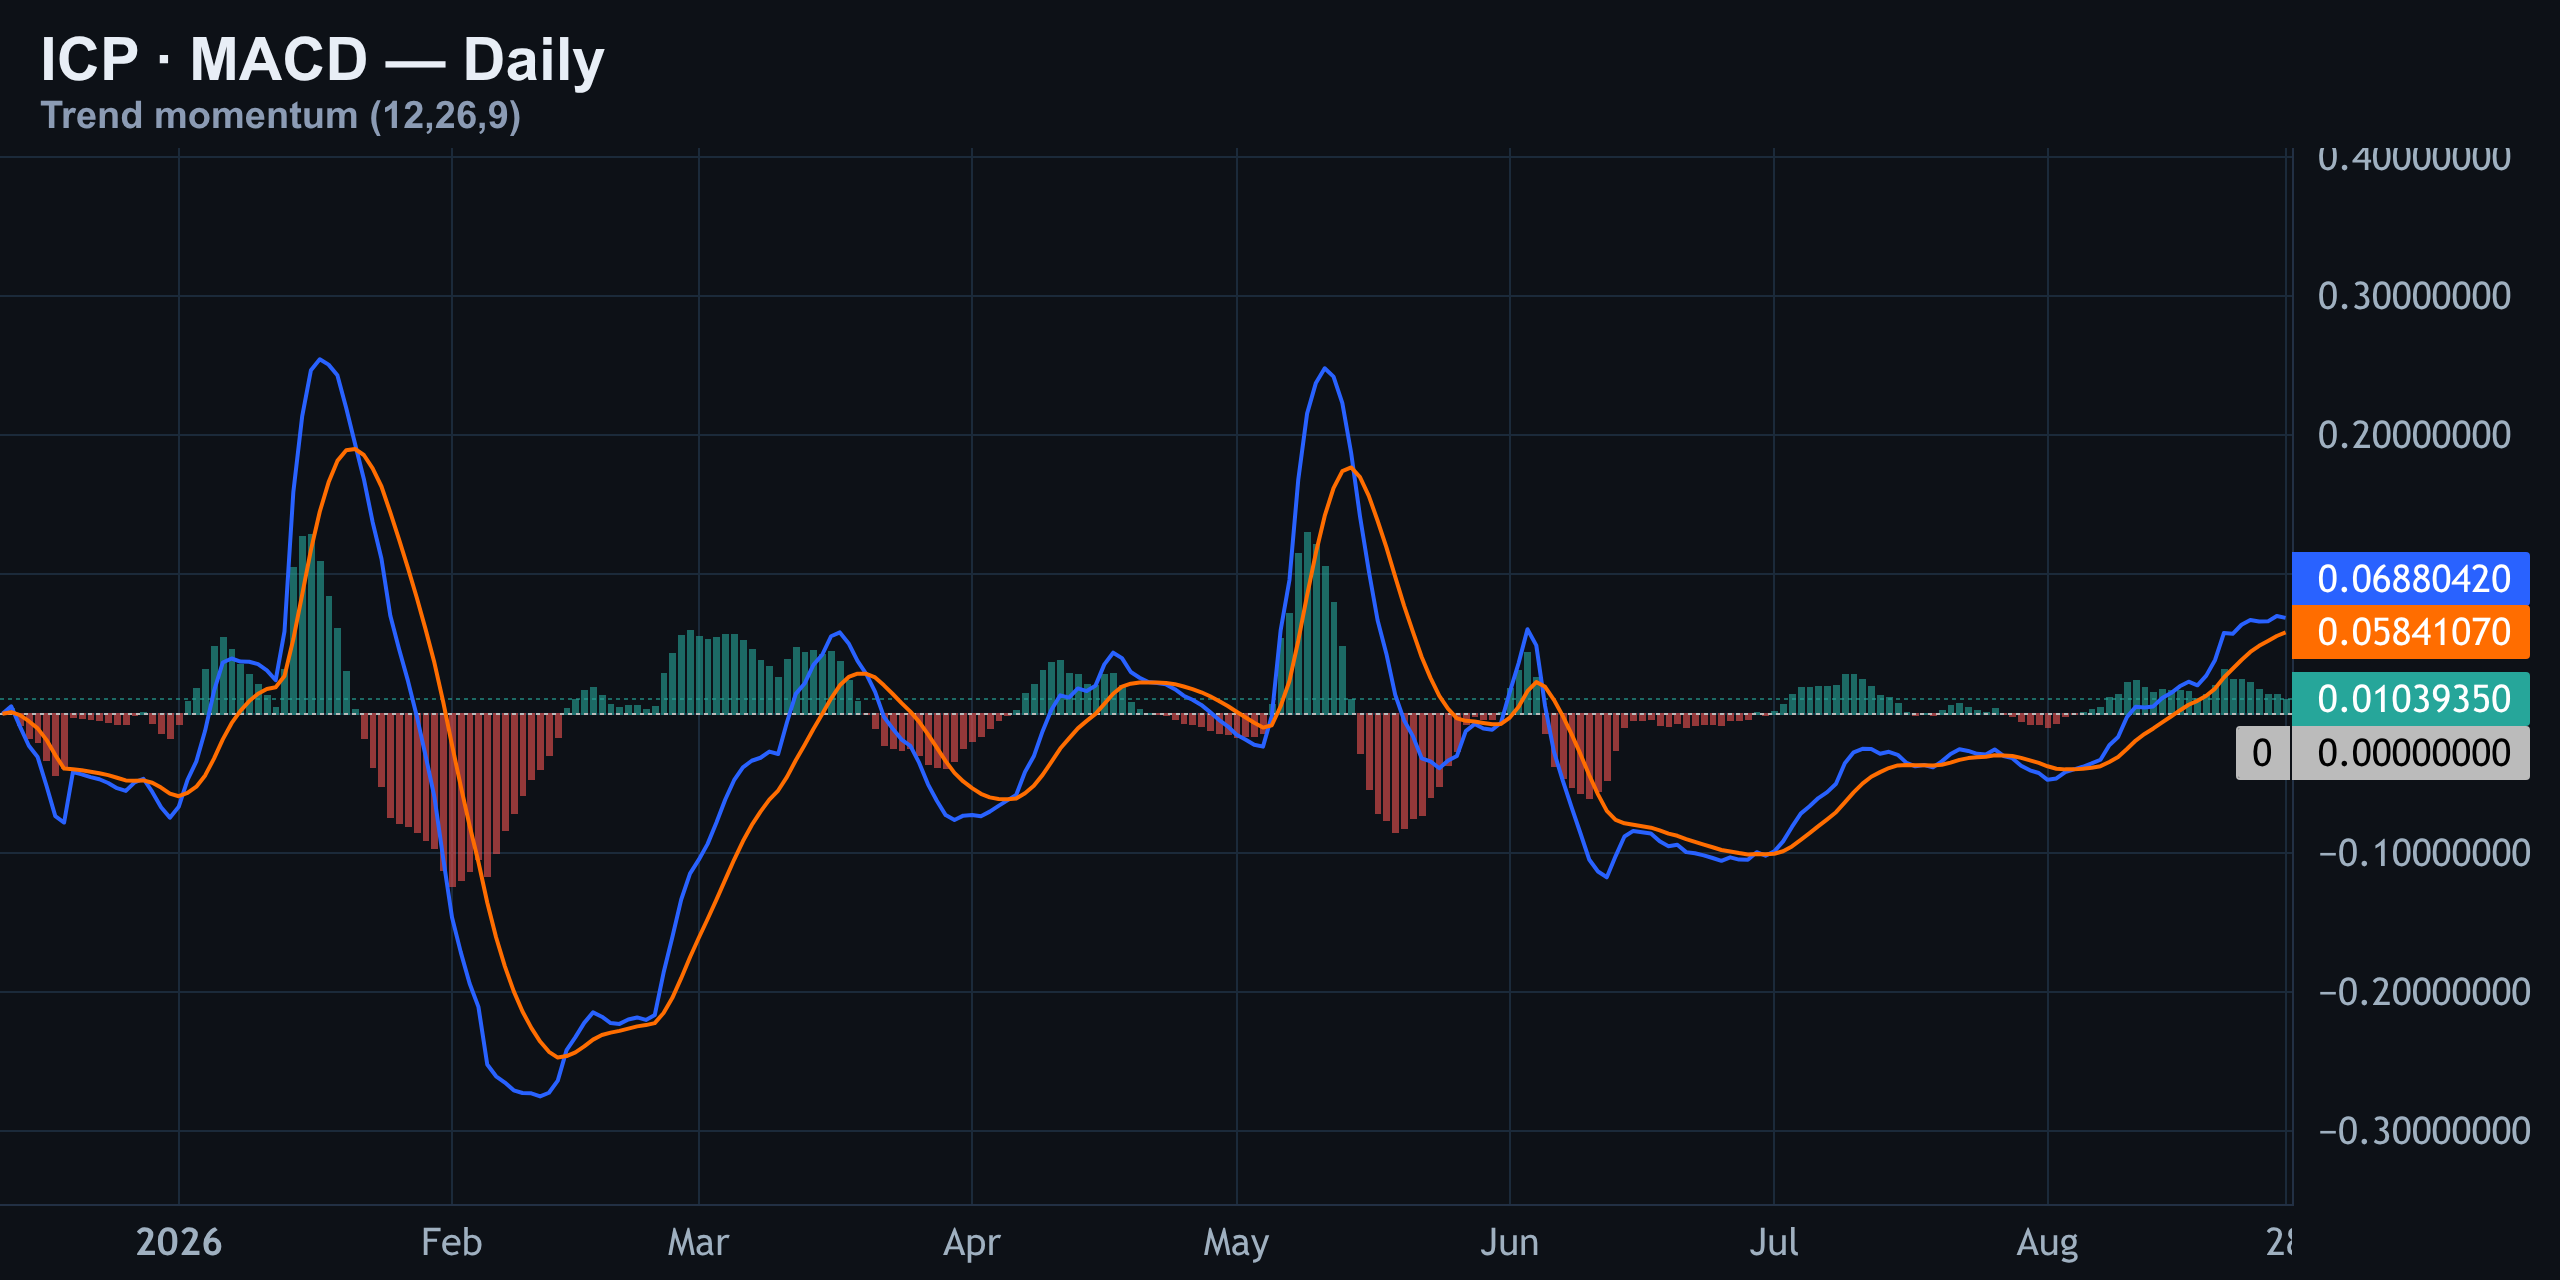
Taken together, the indicators favor buying a controlled retracement rather than chasing strength. The bullish case improves if RSI remains above its midpoint, MACD stays positive and price reclaims $2.49. The case weakens quickly if momentum rolls over alongside a break of four-hour support.
Liquidation Heatmap and Order Flow: The Downside Trap Is Heavier
The liquidation heatmap is the most important risk-management tool in today’s setup. With ICP near $2.41, the densest realized liquidation zone is below spot around $2.35, followed by the stop area near $2.30. By comparison, the upside liquidation pocket near $2.53 is less dominant.
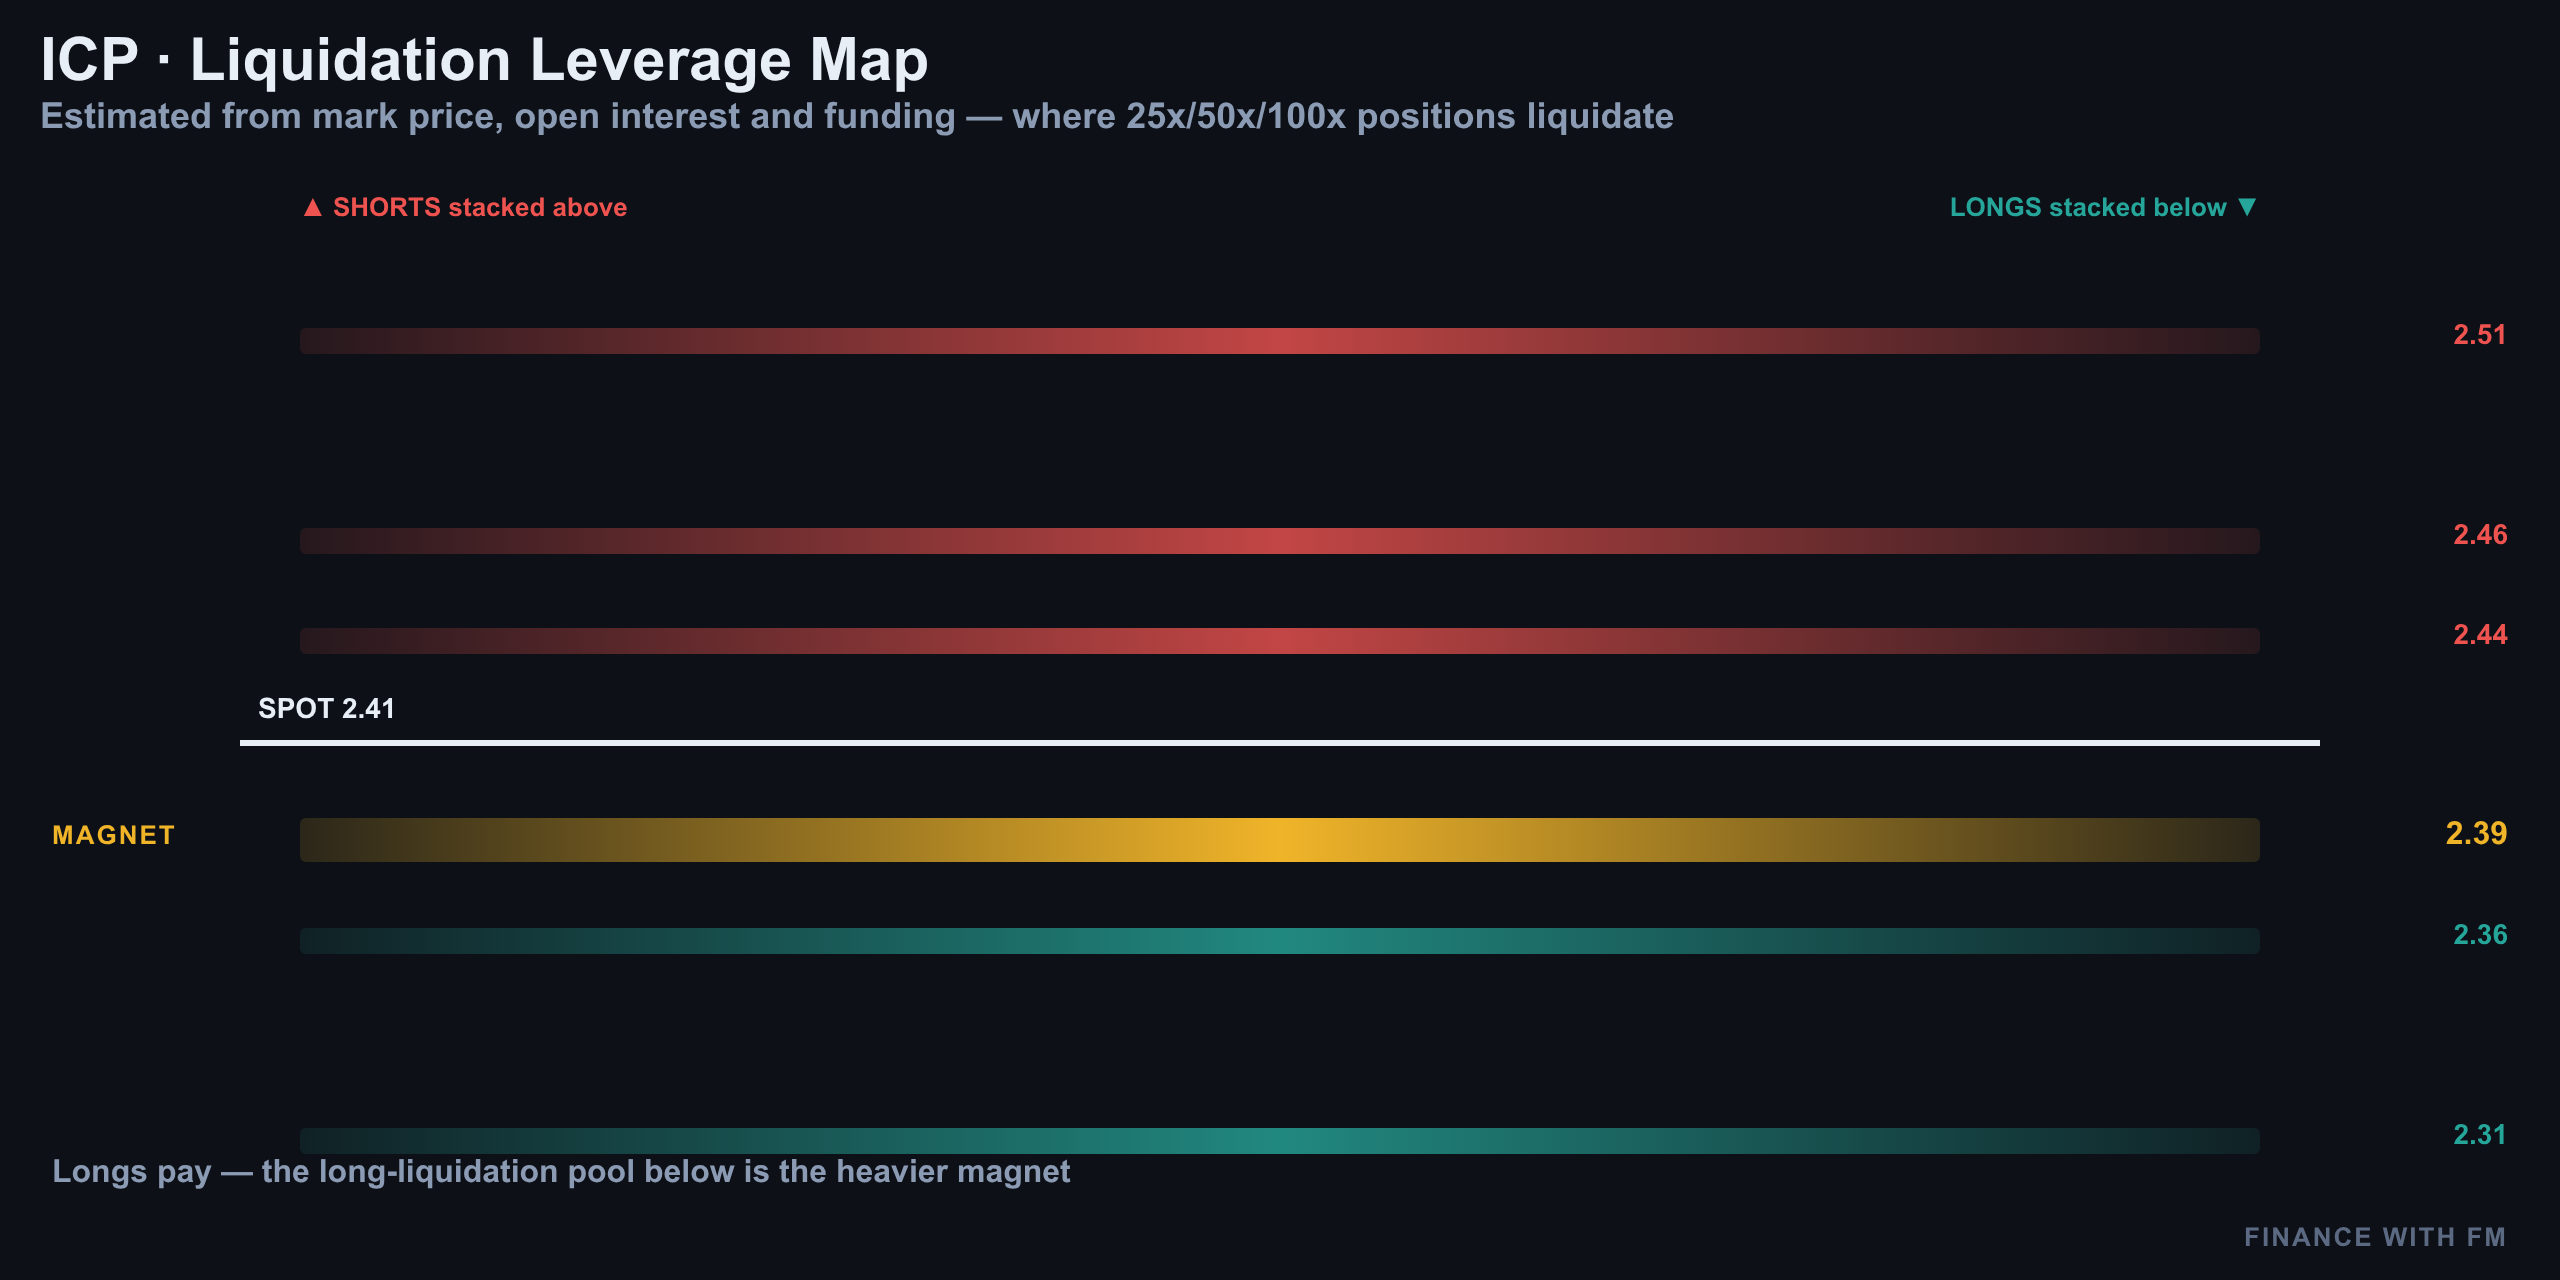
This creates two possible interpretations. A dip into $2.35 could be a liquidity sweep that clears weak longs before price rebounds. But if buyers fail to respond at that level, the same liquidation cluster can become a catalyst for continuation toward the stop region near $2.30. The heatmap identifies where volatility may accelerate; it does not predict which side will win.
Order flow currently leans bearish in the immediate term. The taker buy-to-sell ratio is 0.74, meaning market sellers are more aggressive than market buyers. Funding is positive at approximately 0.01%, equivalent to roughly 11% annualized, so longs are paying to stay open. At the same time, open interest has fallen 3.1% over seven days, suggesting that leverage has been flushed rather than expanding.
| Positioning measure | Reading | Trading implication |
|---|---|---|
| Global long-to-short account ratio | 1.69 | Accounts lean long |
| Top-trader long-to-short ratio | 7.64 | Top traders are heavily long |
| Funding rate | +0.01% | Longs pay shorts |
| Open interest, seven-day change | -3.1% | Some leverage has already exited |
| Taker buy-to-sell ratio | 0.74 | Aggressive sellers lead |
The positioning data does not provide an easy contrarian trade. Longs are crowded enough to create squeeze risk, but falling open interest means the market is not simply adding leverage at the highs. The cleanest read is caution: let price prove that the liquidation zone is being absorbed before treating the dip as bullish.
ICP Trade Plan for August 28–29, 2026
The computed desk-style setup is a conditional long from a controlled retracement, not an instruction to buy the current market price. The planned entry is $2.357, close to the heavy liquidation area near $2.35. The stop is approximately $2.30, and the calculated target is approximately $2.505, producing a risk-to-reward profile near 1:2.6.
| Plan element | Level | Purpose |
|---|---|---|
| Current reference | $2.41 | Market location at the time of analysis |
| Computed entry | $2.357 | Buy only after controlled support response |
| Structural invalidation | Four-hour close below $2.34 | Ascending-channel thesis fails |
| Stop area | $2.30 | Risk limit for the computed setup |
| Primary target | $2.505 | Approximate 1:2.6 reward-to-risk objective |
| Upside liquidity pocket | $2.53 | Potential reaction or extension zone |
| Immediate resistance | $2.49 | First recovery and confirmation test |
The trade only makes sense if price reaches the entry area, stabilizes and shows evidence that sellers are losing control. A blind limit order into falling price would ignore the taker-flow weakness and the liquidation risk. Confirmation can include a reclaim of the local range, a higher low near support or a clear reduction in selling pressure.
The setup is killed if ICP closes below $2.34 on the four-hour chart, and the risk limit is near $2.30. If price rallies directly from $2.41 into $2.49, the reward-to-risk profile becomes less attractive because the market is approaching resistance without offering the planned entry. If price reaches the $2.50 to $2.53 area, traders should expect potential profit-taking and should not assume that the liquidation pocket guarantees continuation.
For broader context, traders can compare live market information through Coinbase and derivatives data through CoinGlass. Always verify price, funding, open interest and liquidation data before acting because these figures change continuously.
08/22/2026 — ICP August 22, 2026: The Level That Wakes This Up
ICP August 22, 2026: The Level That Wakes This Up
ICP August 22, 2026: The market is waiting for confirmation
Welcome back to Finance With FM. As of August 22, 2026, Internet Computer (ICP) is trading near $2.37, down approximately 3.85% over the last 24 hours. The session range has been wide, running from roughly $2.20 to $2.71. That range tells us something important: this is not a quiet drift lower. It is a market where both liquidity and leverage can move price quickly.
The immediate read is neutral to slightly bearish. ICP still has a constructive momentum signal on the daily chart, and the broader market has not invalidated its recovery structure. However, price has rejected the upper side of its short-term channel, remains below the 200-day average near $2.41, and is facing a visible ask wall around $2.40. At the same time, funding is positive and long positioning is crowded.
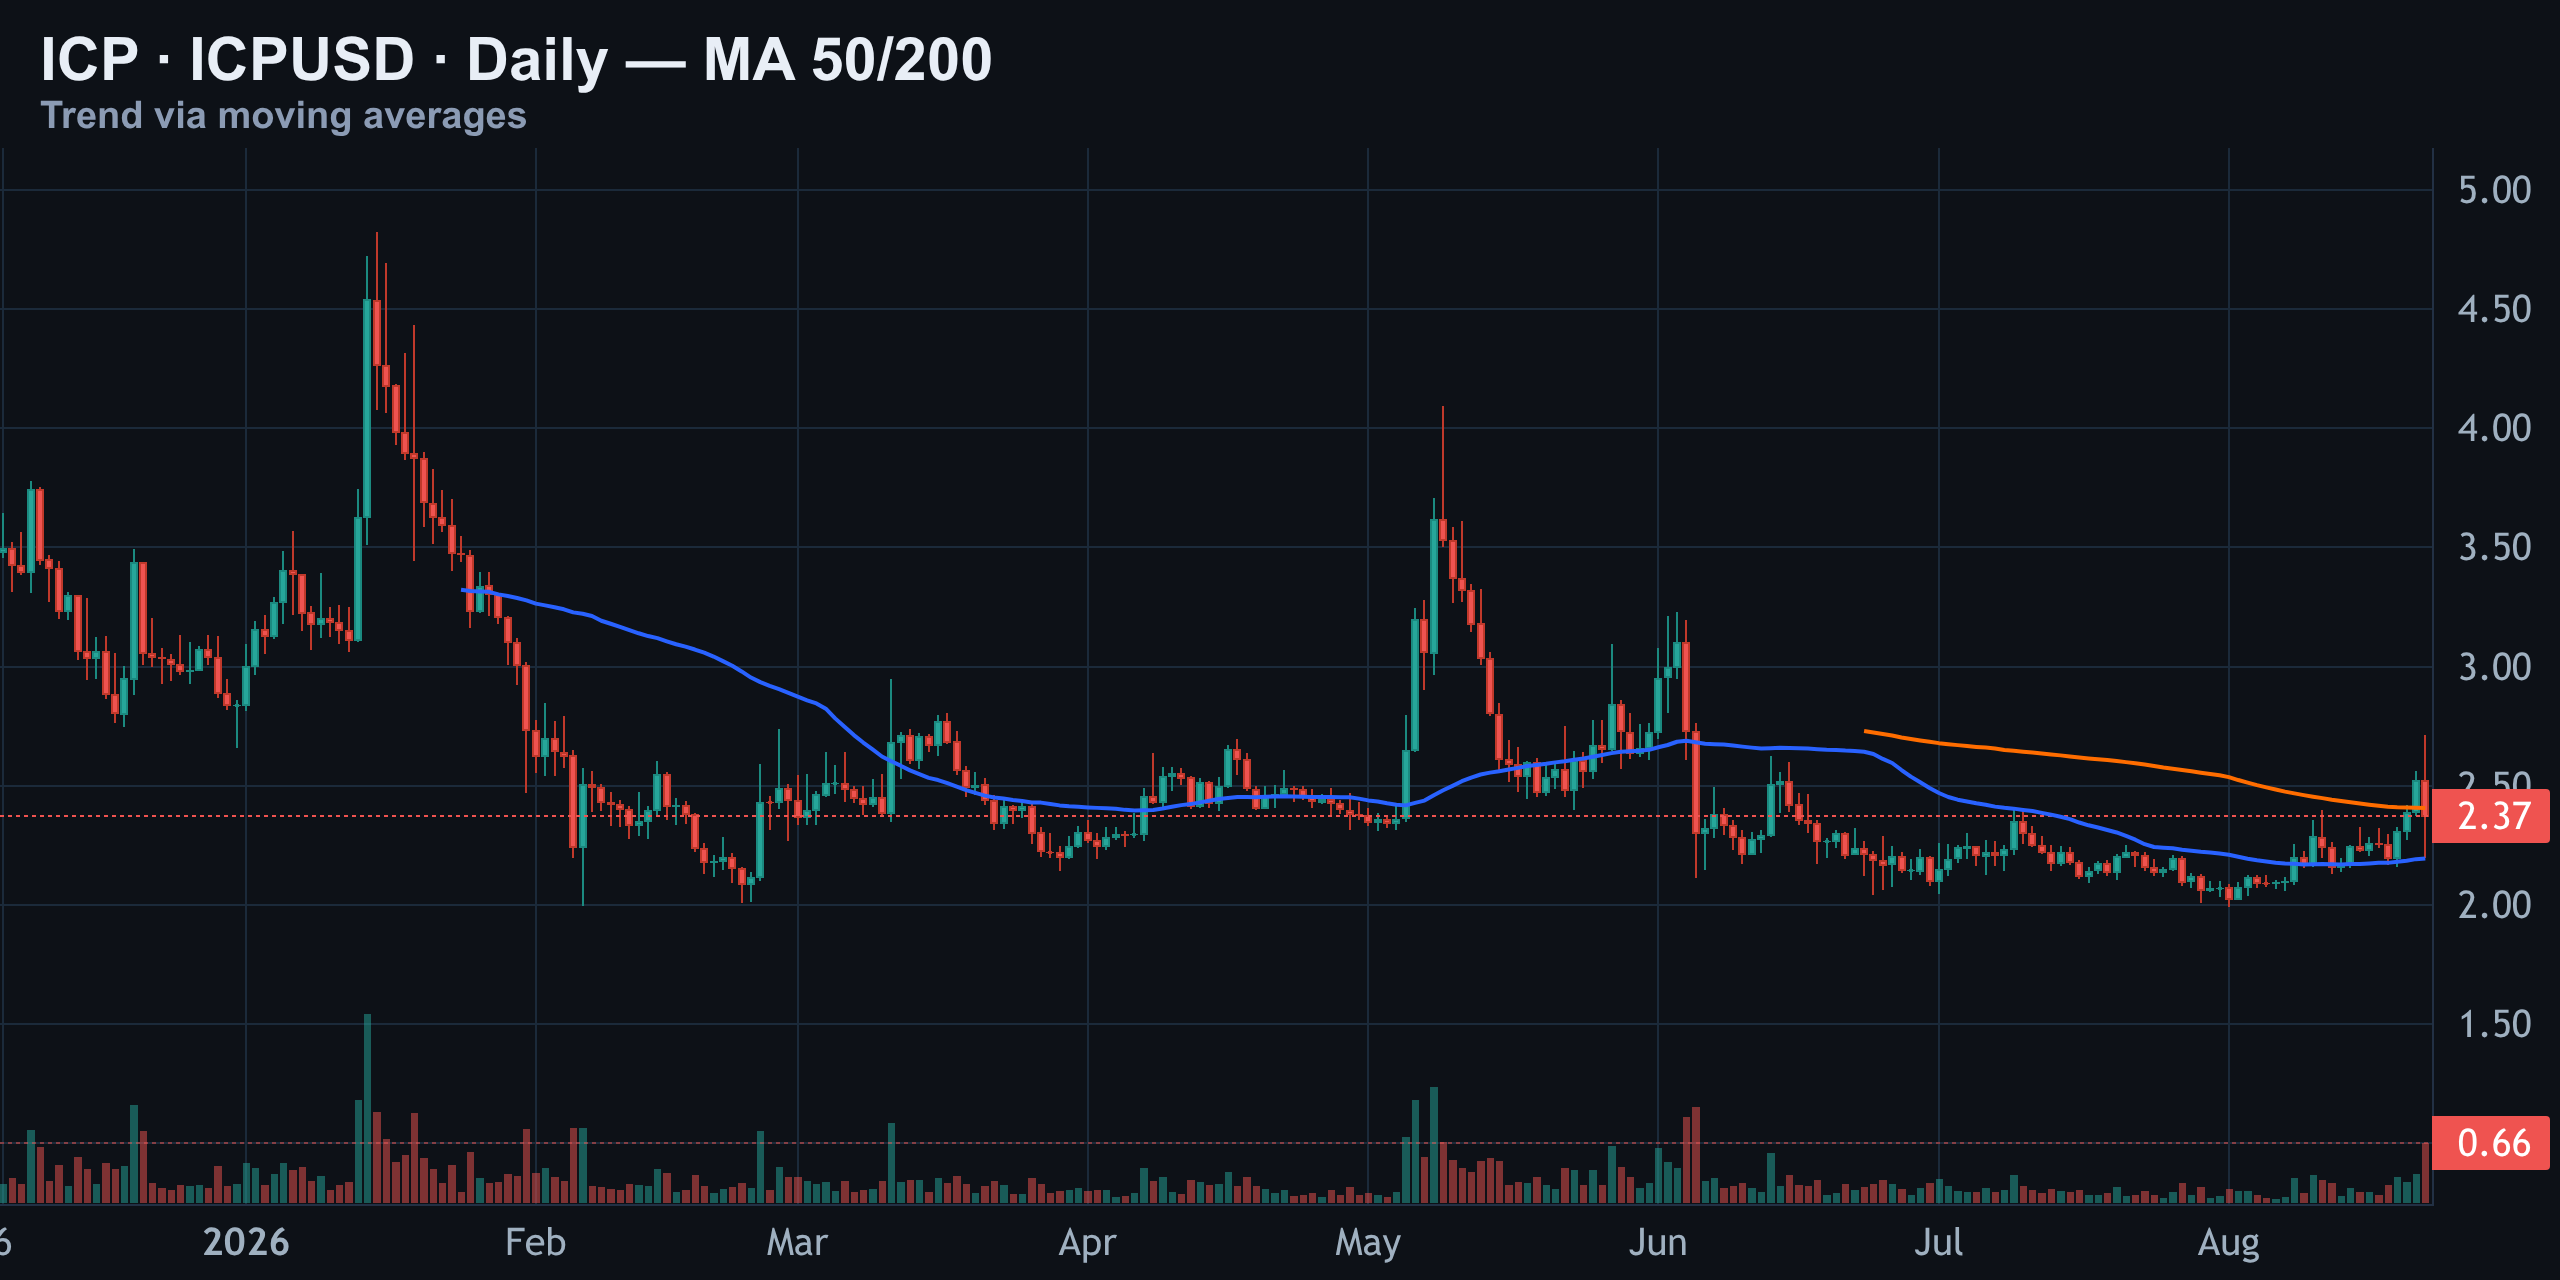
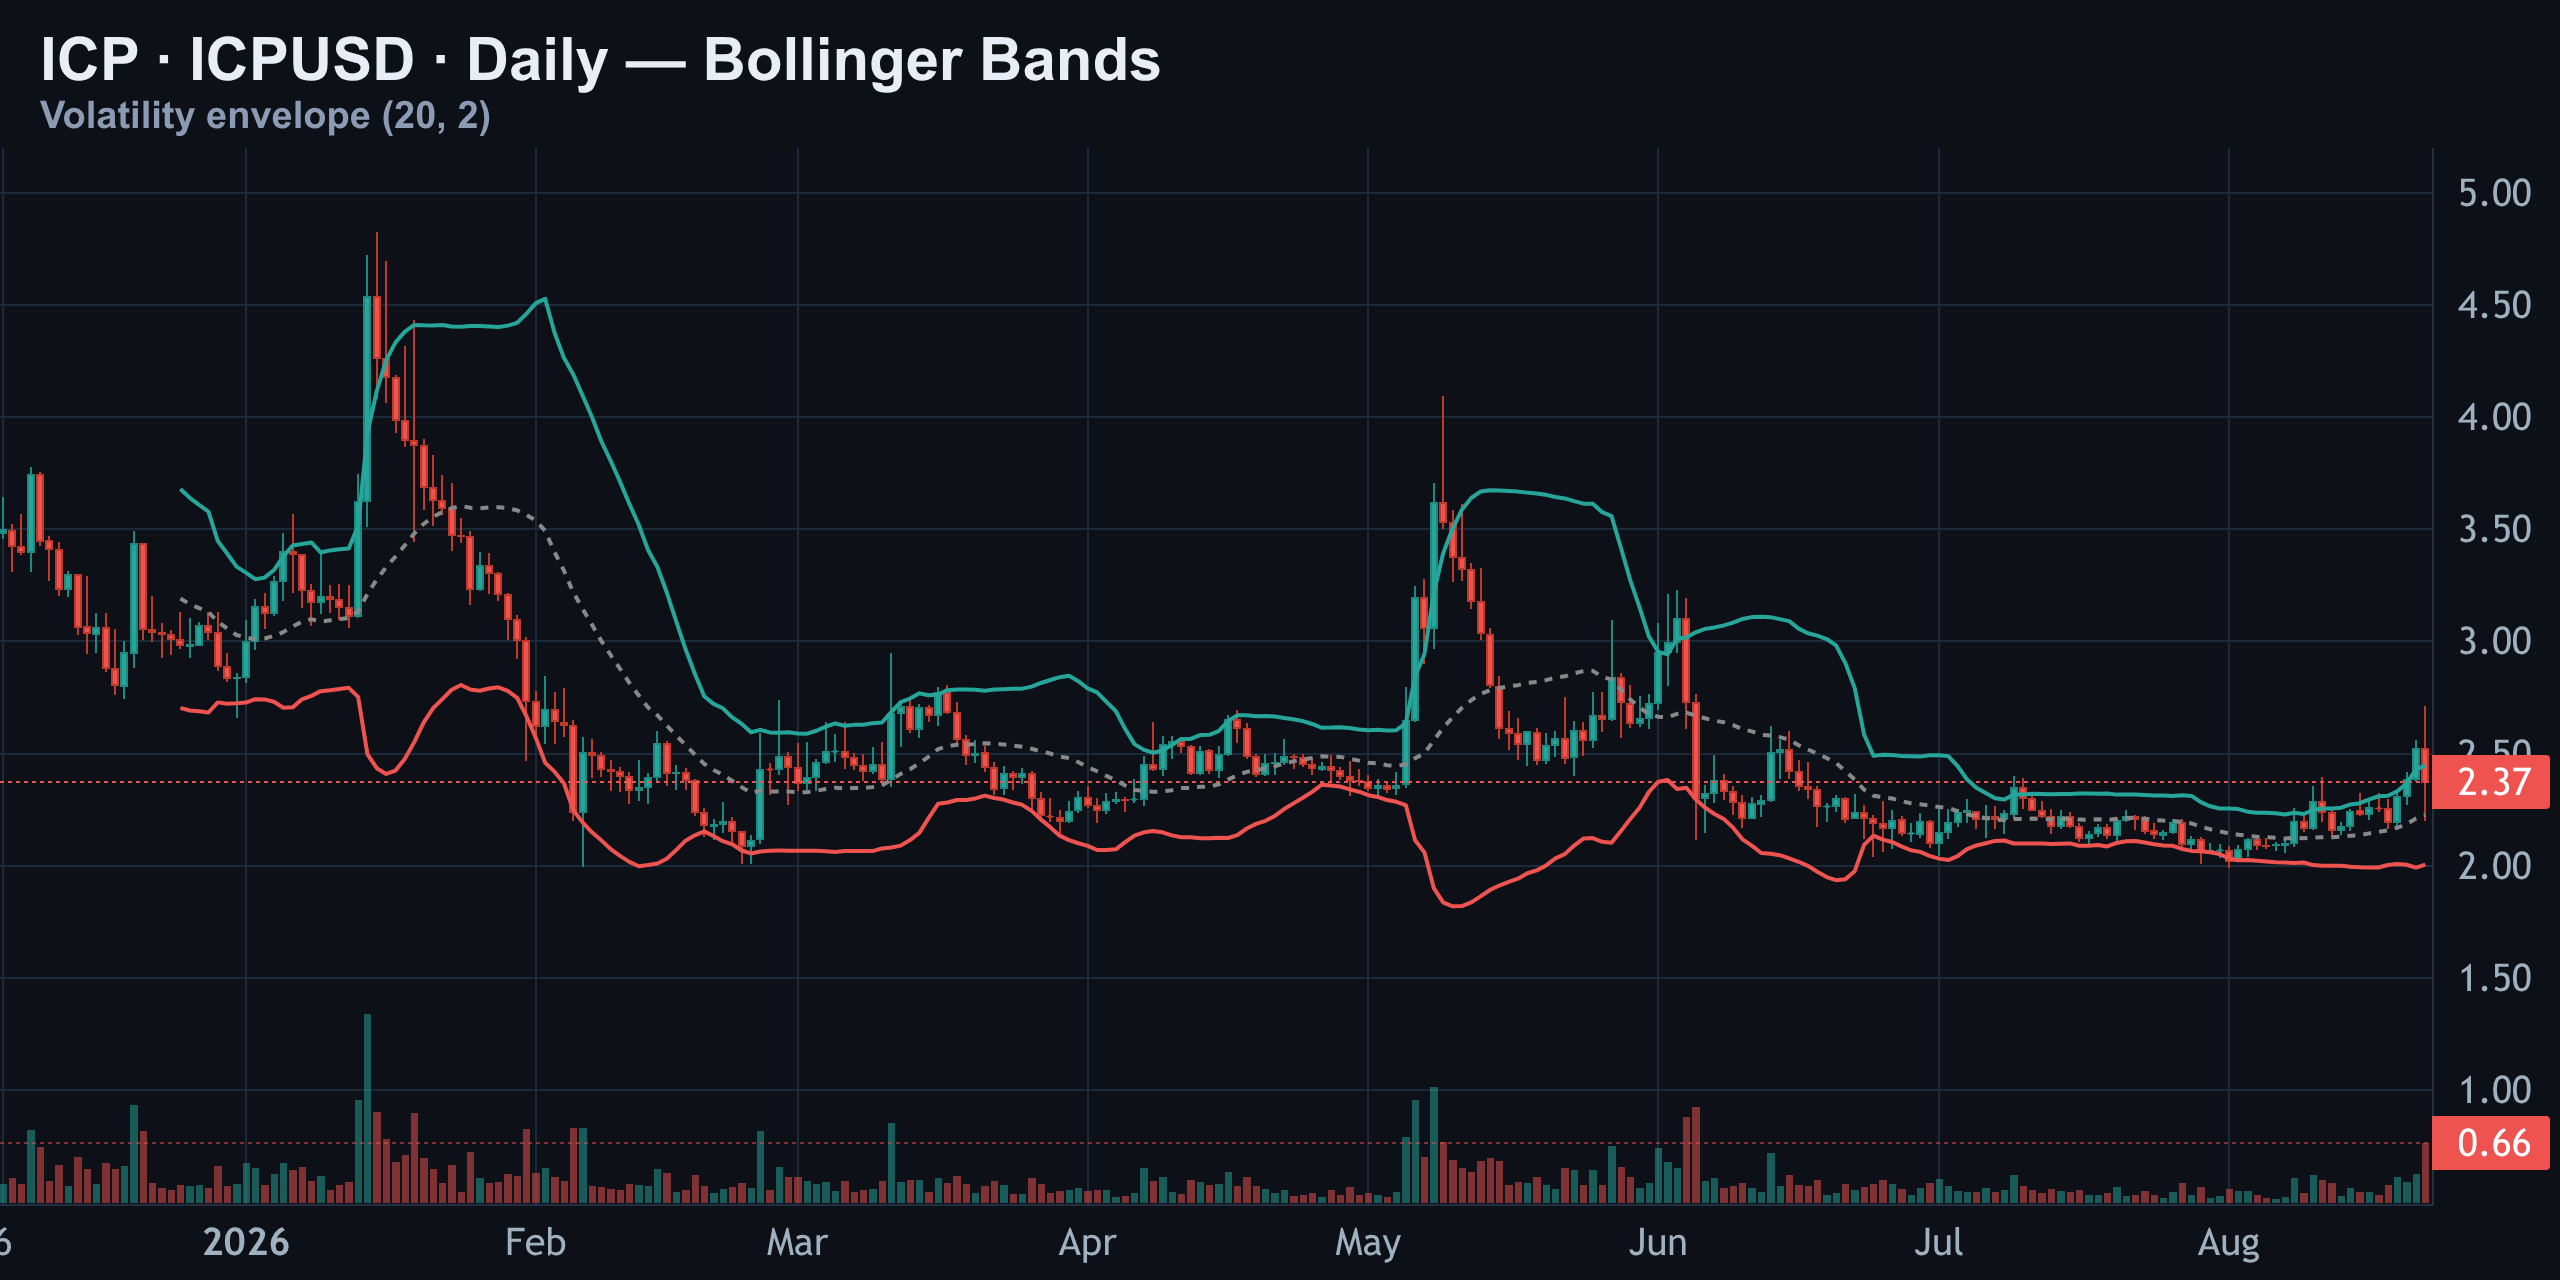
Since the previous update, ICP has declined from approximately $2.485 to $2.39 in the referenced move, a drop of about 3.8%. The prior long idea—entered near $2.443, with a stop at $2.351 and a target at $2.795—remains live under its original rules. It has not reached either the target or the stop. That is not the same as confirmation, though. The setup is still active, while today's conditions do not provide a fresh trade with the required risk-reward.
Four-hour structure: support is close, but longs are exposed
The four-hour chart shows ICP recovering from the low-$2 area with a sequence of higher intraday lows. Buyers then pushed toward the $2.70 region, but sellers rejected that extension. The latest red candle arrived with elevated volume, making this look more like a meaningful supply response than an ordinary pause.
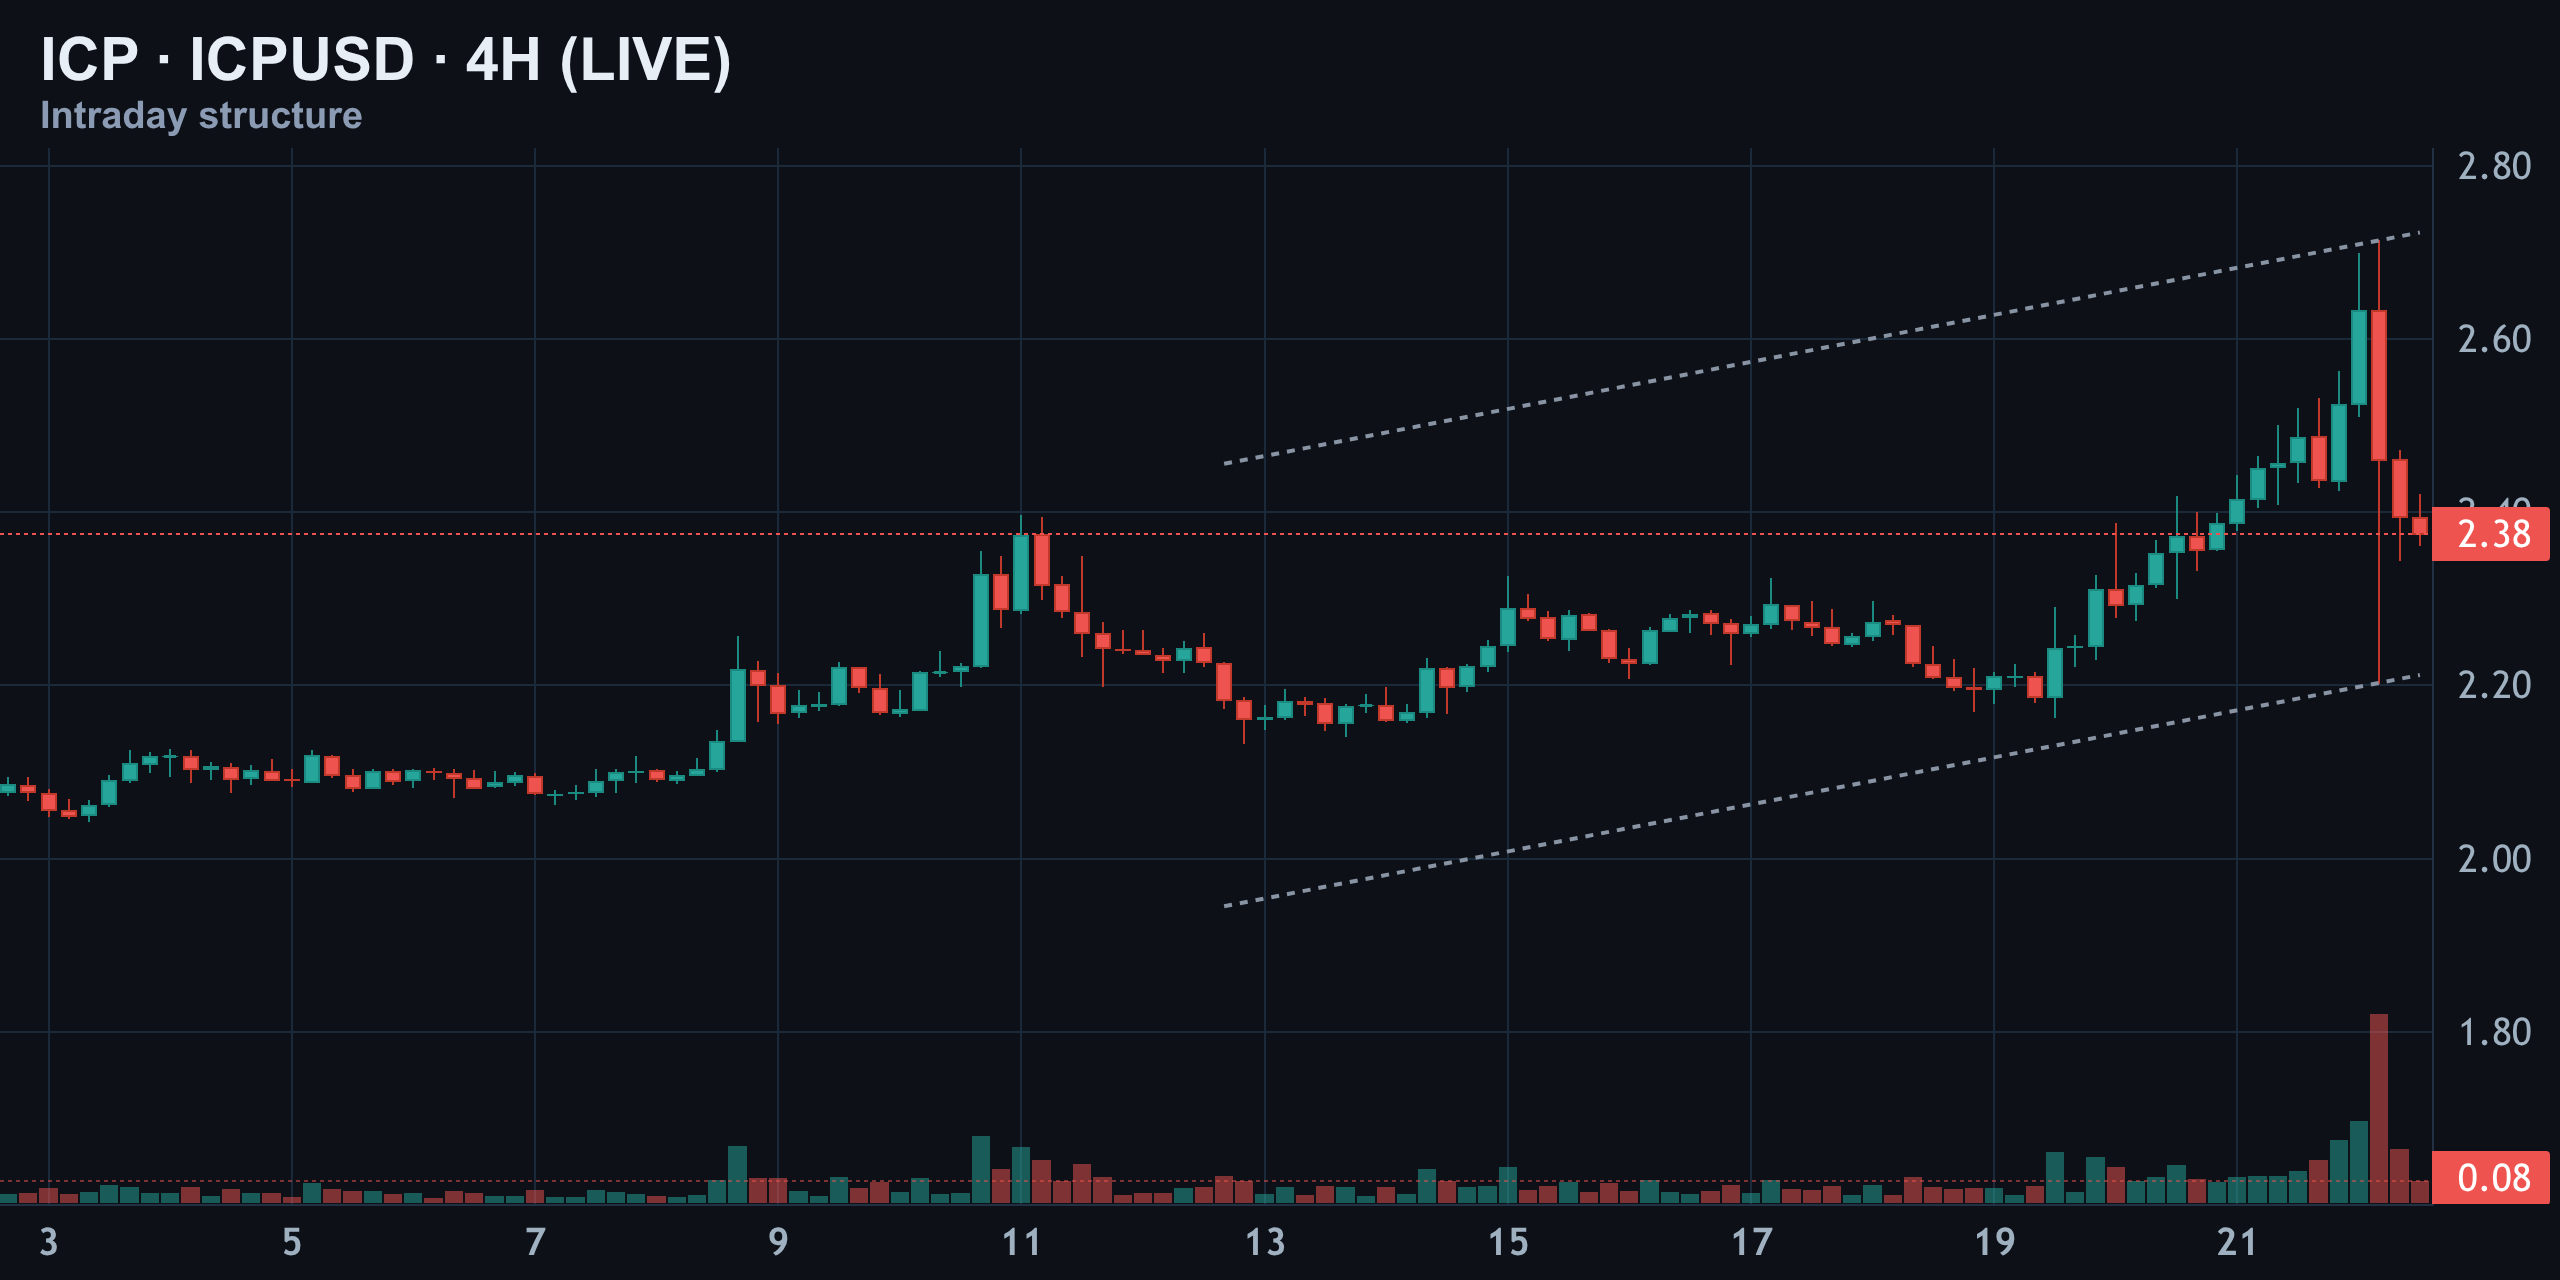
The first battleground is $2.40. That is where the largest visible ask wall sits, and it also overlaps with the nearby 200-day moving average. A clean four-hour reclaim would suggest that sellers were absorbed rather than fully in control. Until that happens, the ask wall is an overhead lid.
Below the market, the largest visible bid wall is near $2.20. The order book is reported to be bid-heavy at roughly 71%, which creates a cushion but not a guarantee. Large bids can be pulled, hit, or used as liquidity during a flush. Traders should focus on how price behaves when it reaches those orders, not simply assume they will hold.
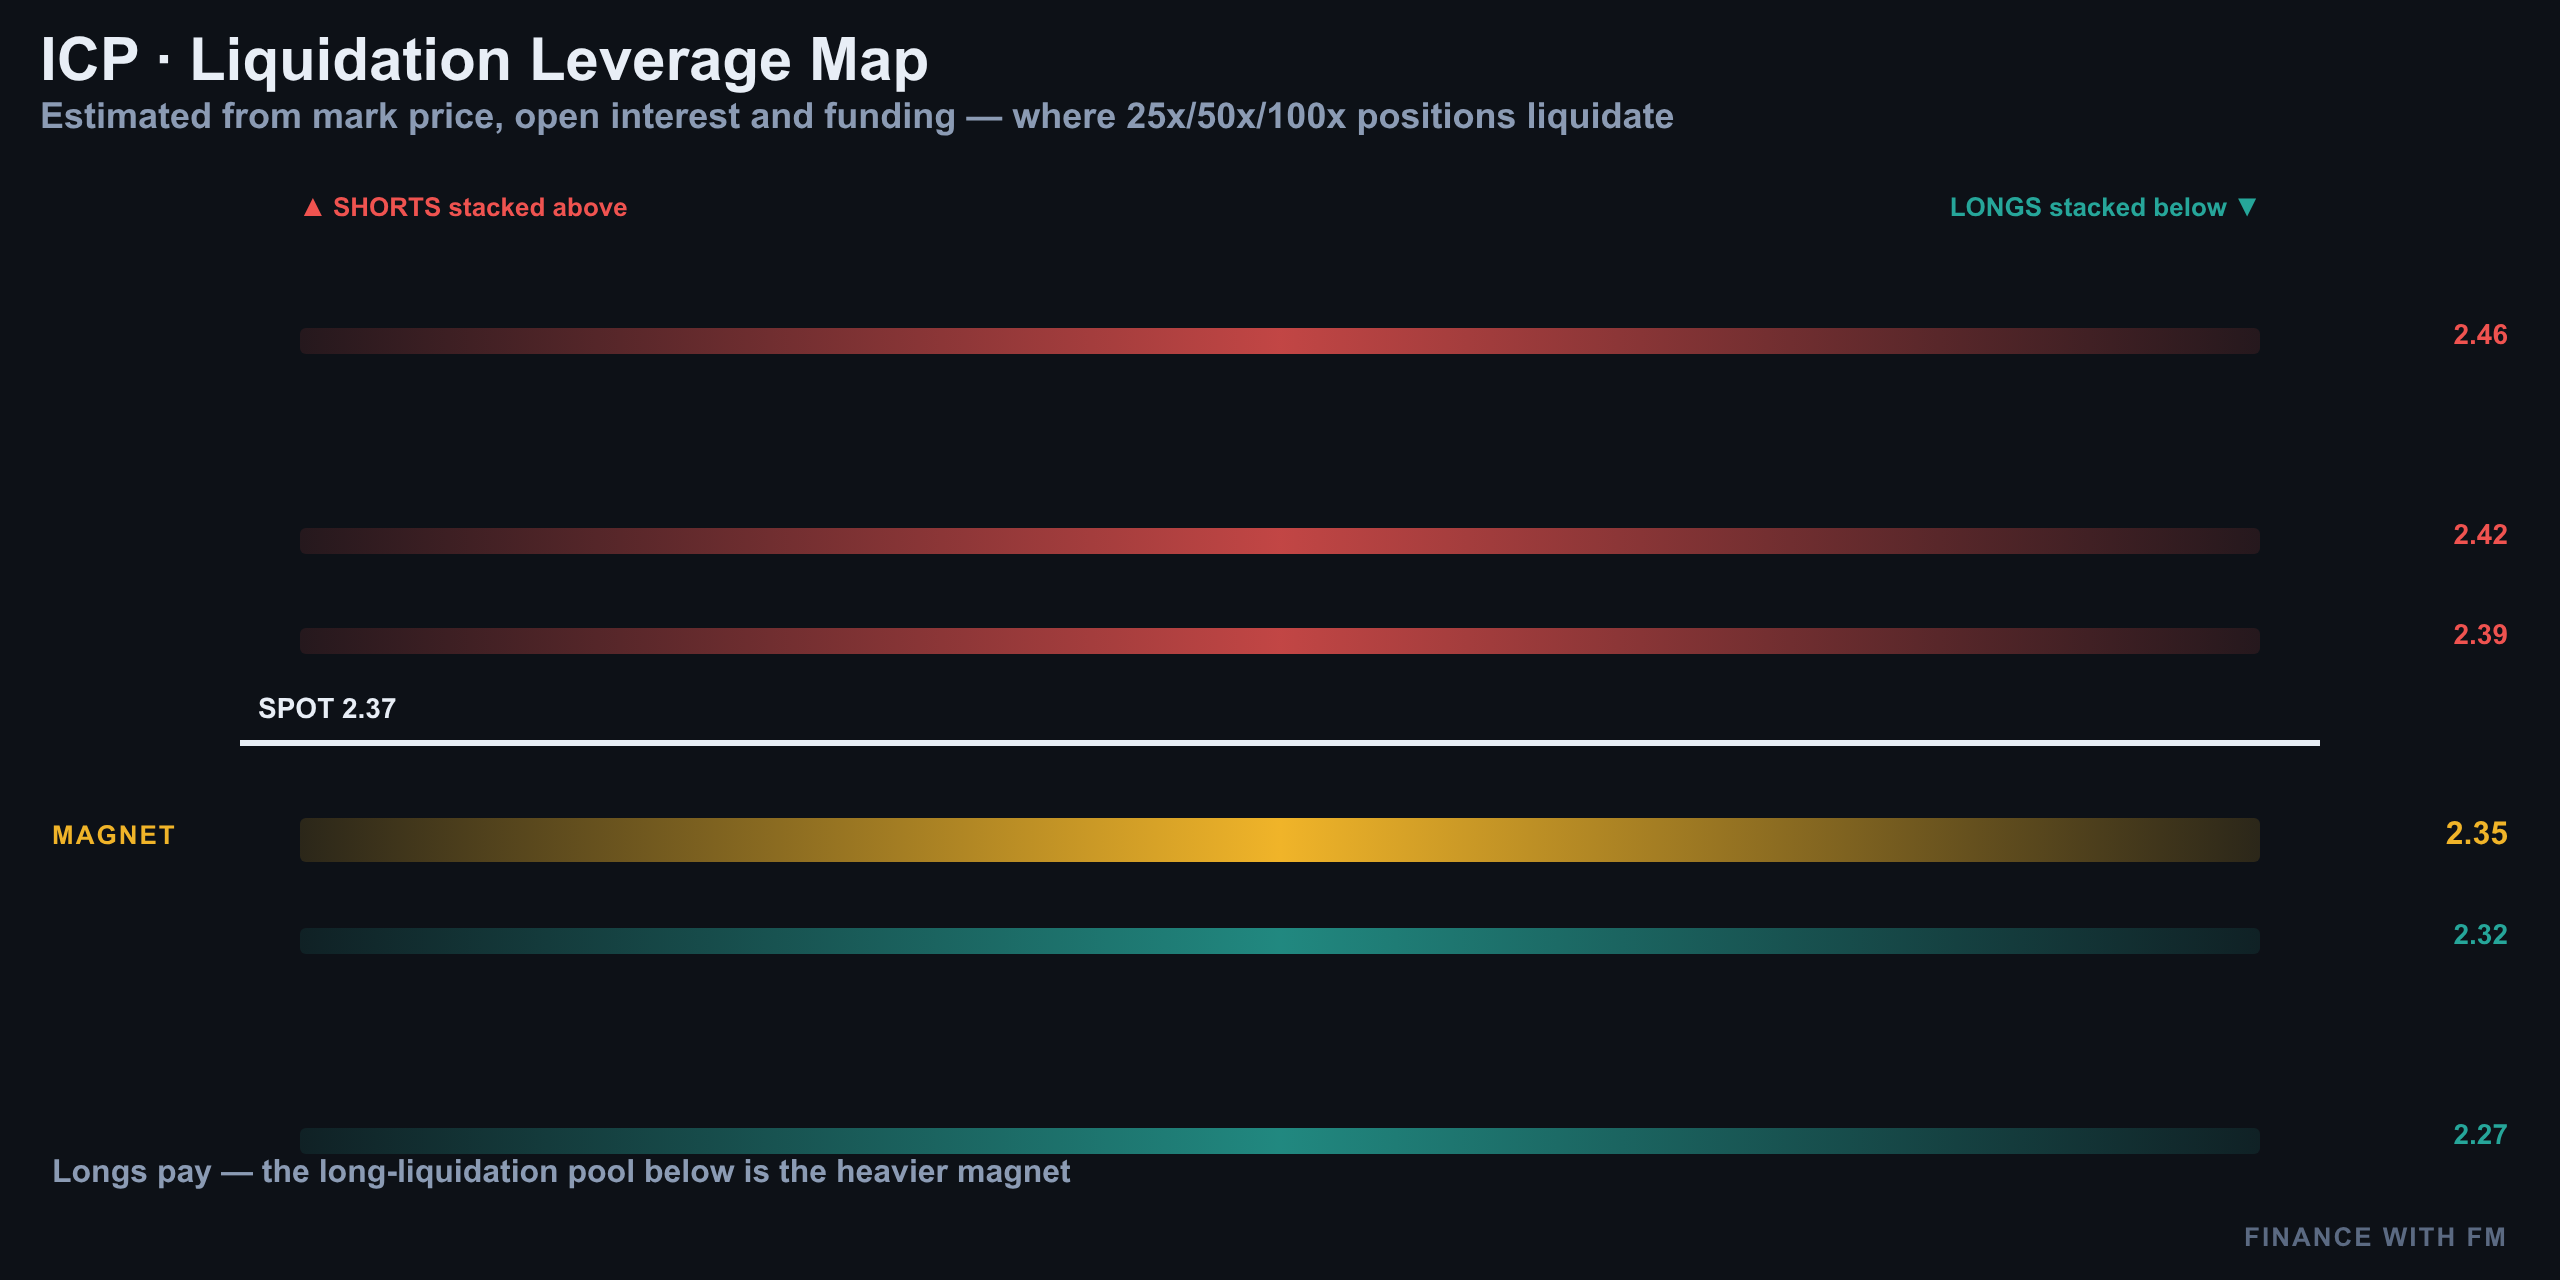
The liquidation heatmap reinforces the caution. A realised liquidation zone is clustered near $2.38, almost directly under the current market. If ICP slips through short-term support, forced selling could turn a normal pullback into a sharper move. Positive funding adds to that risk because longs are paying to remain in the trade while aggressive takers are selling.
| Level | Price | Why it matters |
|---|---|---|
| Immediate resistance | $2.40 | Visible ask wall and nearby 200-day average |
| Key pivot | $2.354 | Hold for a possible retest; lose it for downside risk |
| Prior long stop | $2.351 | Invalidation level for the existing trade idea |
| Liquidation area | Around $2.38 | Potential forced-selling zone beneath spot |
| Major bid support | $2.20 | Lower liquidity magnet if the pivot fails |
| Prior long target | $2.795 | Upside objective for the previously published setup |
Daily and weekly charts: recovery, not confirmed reversal
On the short-term daily chart, ICP is recovering from a prolonged compressed range. The market built a base above the $1.99 low and then climbed into the mid-$2 area. That improvement matters, but the recent rejection near $2.50 means the recovery is meeting resistance rather than breaking cleanly into a new trend.
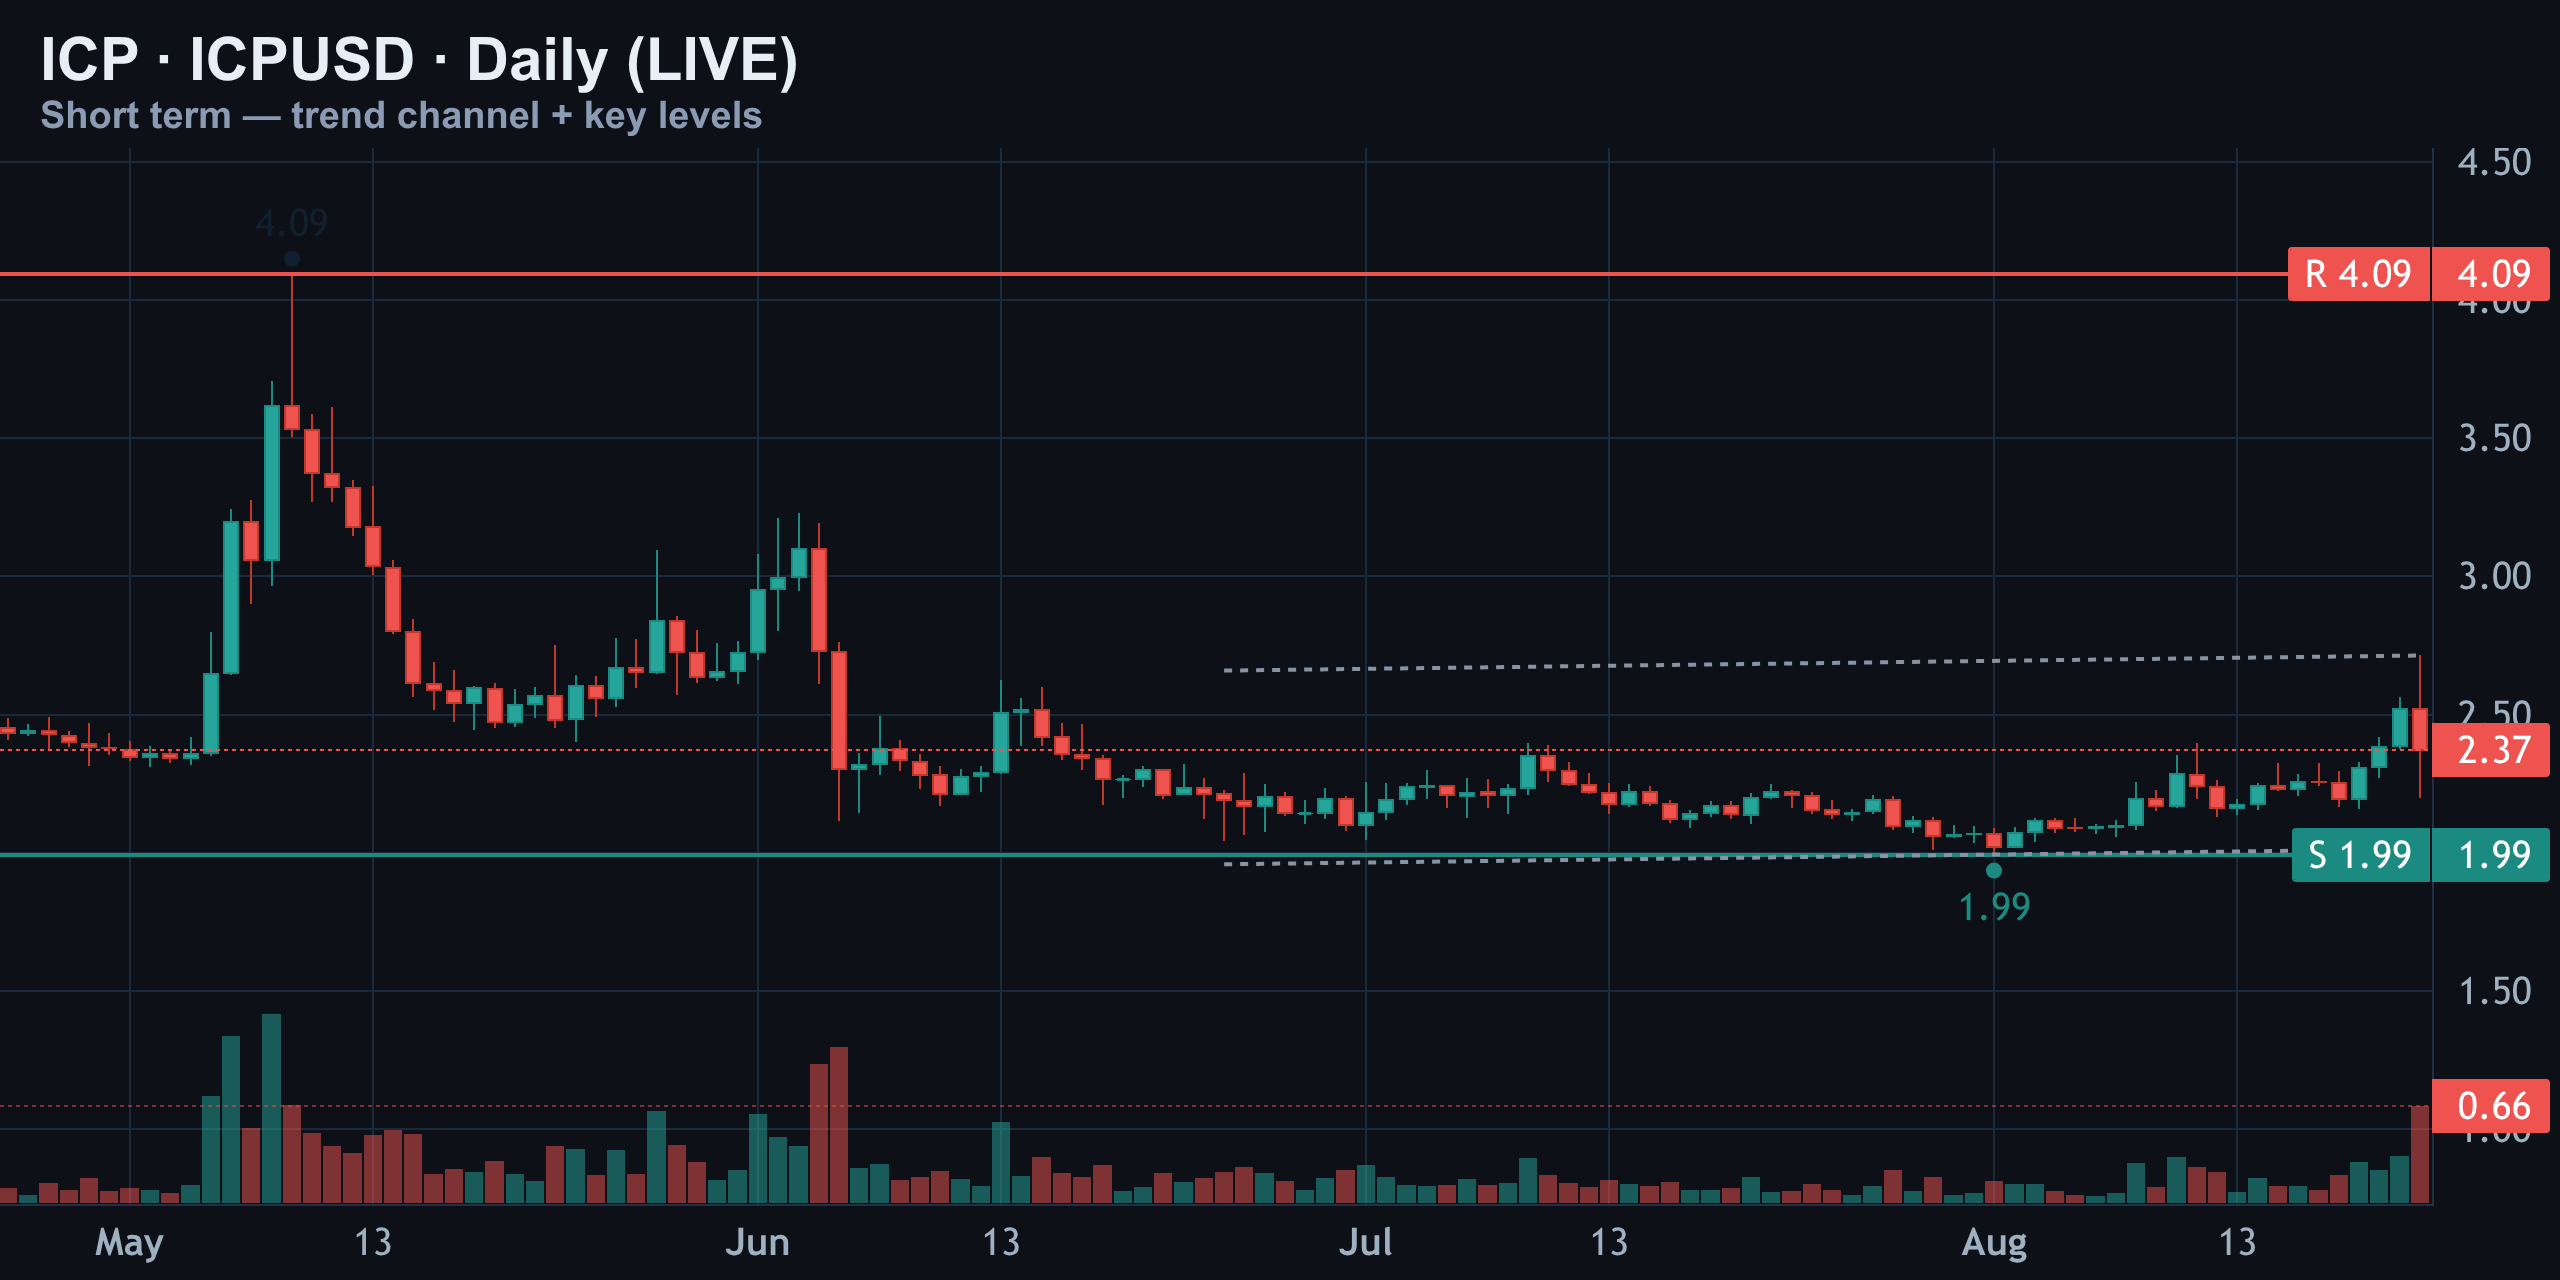
The descending channel from the earlier high remains the dominant short-term framework. Price is testing the upper boundary, but there has not yet been a decisive daily close beyond it followed by a successful retest. Until that sequence appears, the market is testing resistance—not confirming a trend change.
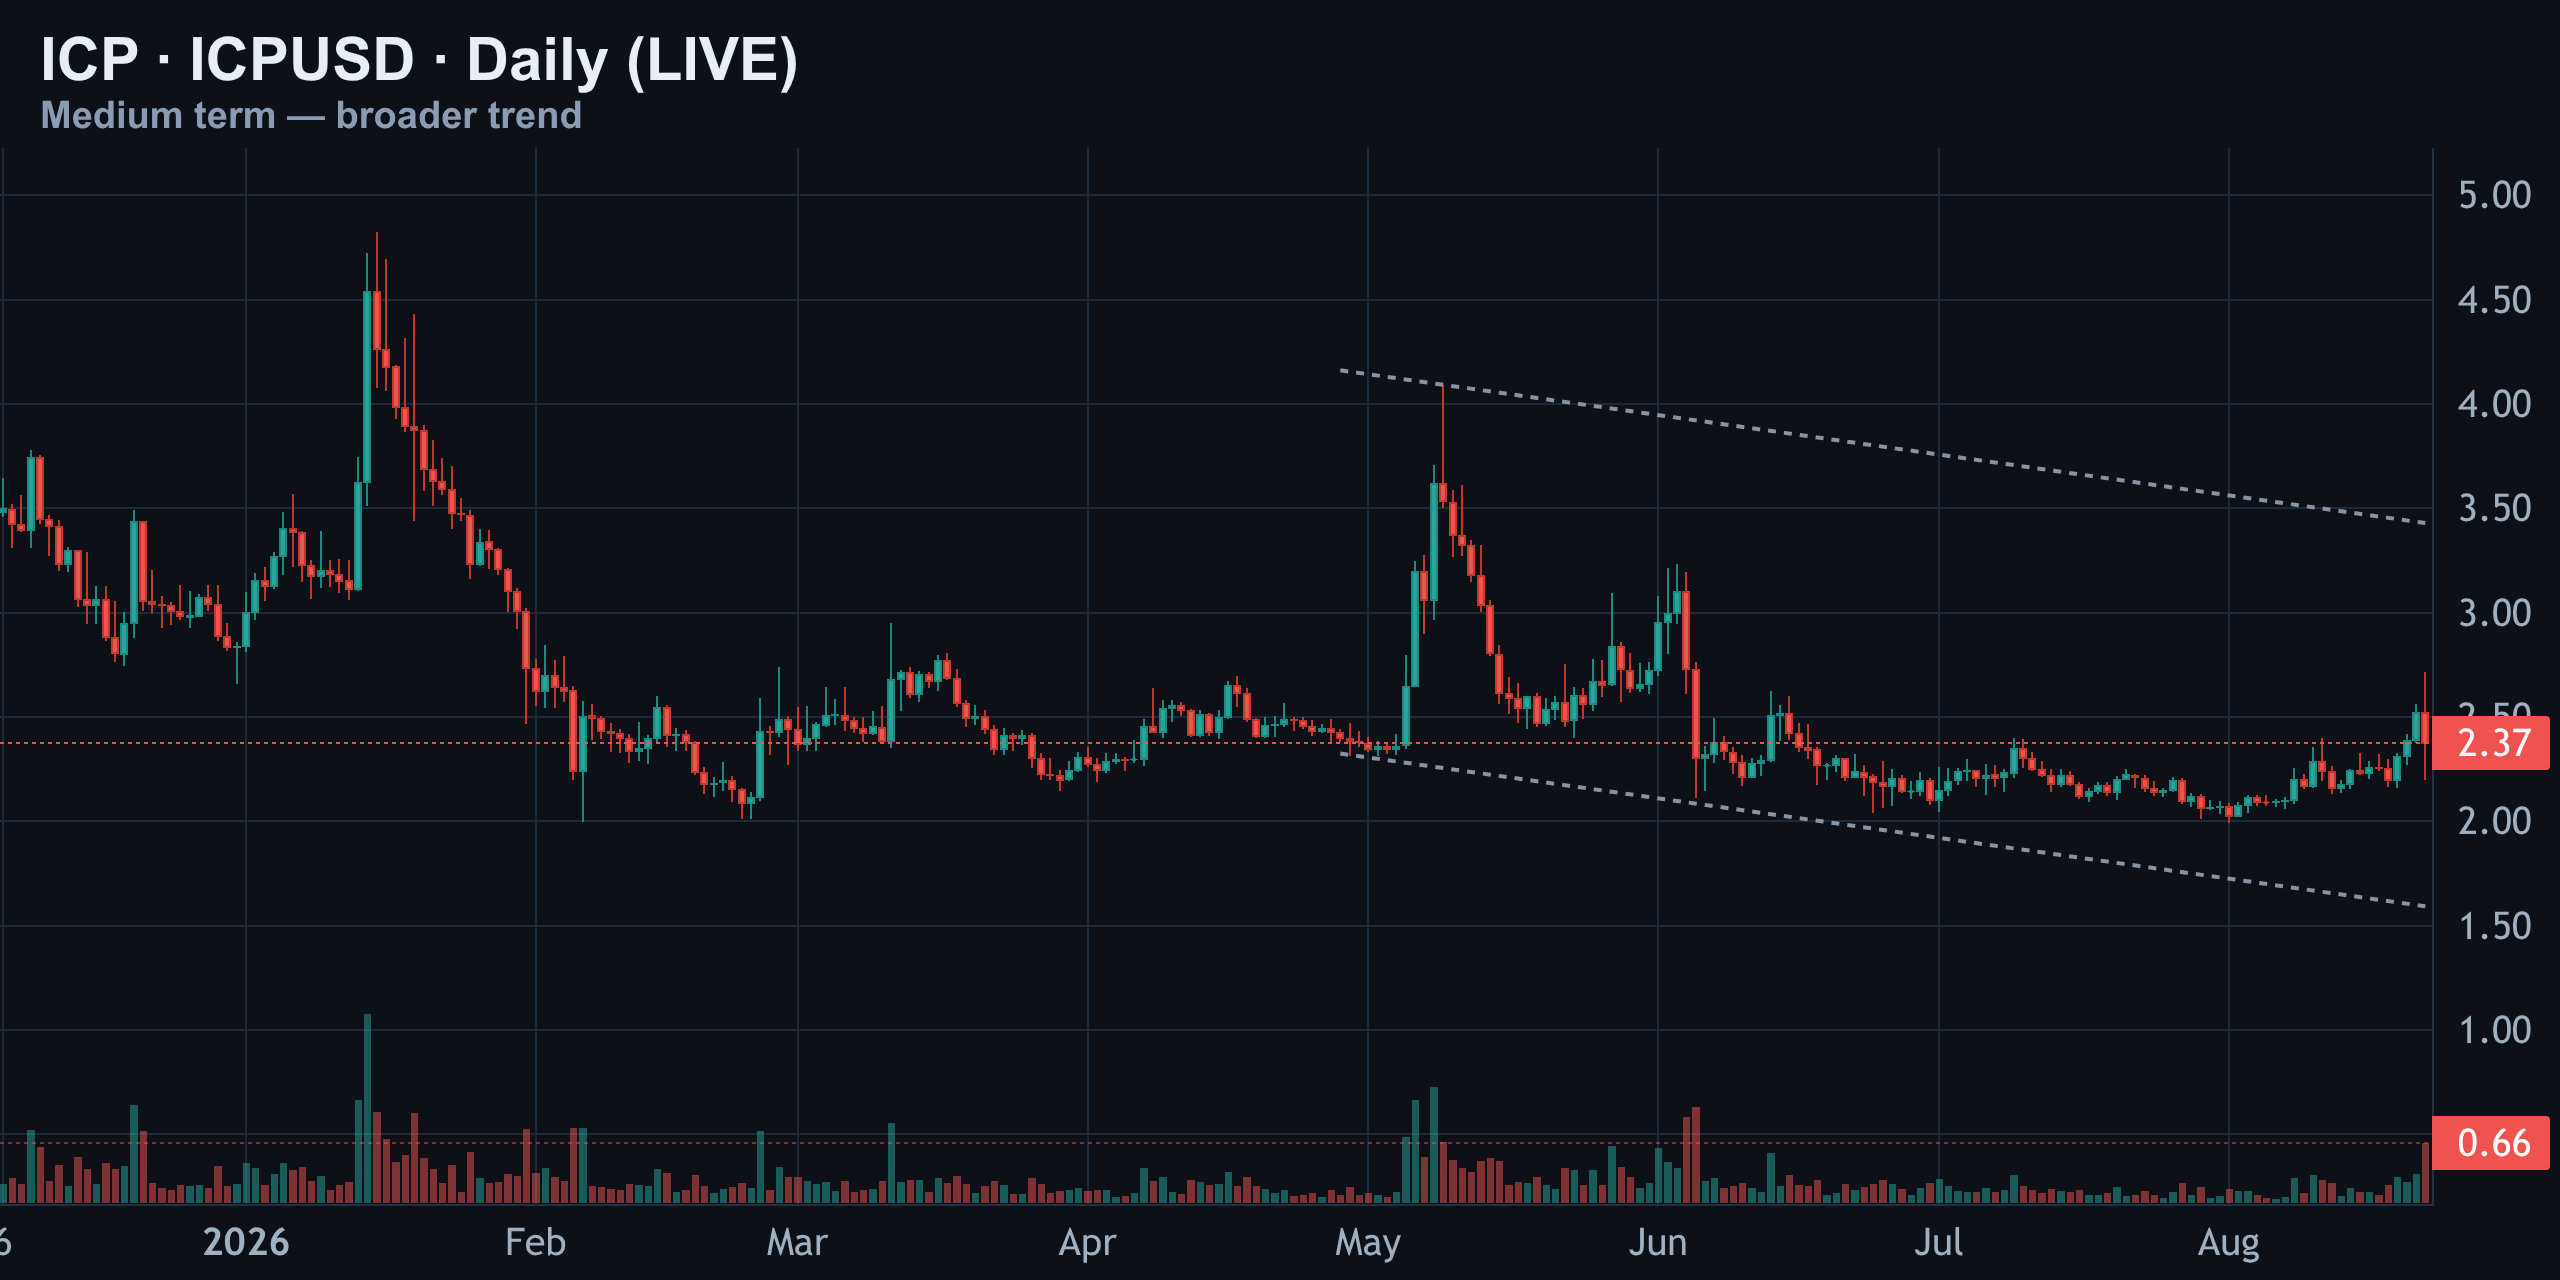
The medium-term picture is therefore constructive but incomplete. A daily close above $2.354 would improve the structure, especially if buyers defend that level on a retest. A sustained move above $2.40 would be stronger still because it would reclaim both a major moving-average area and the visible ask wall. Failure below $2.354 keeps ICP inside the range and raises the probability of a move toward $2.20.
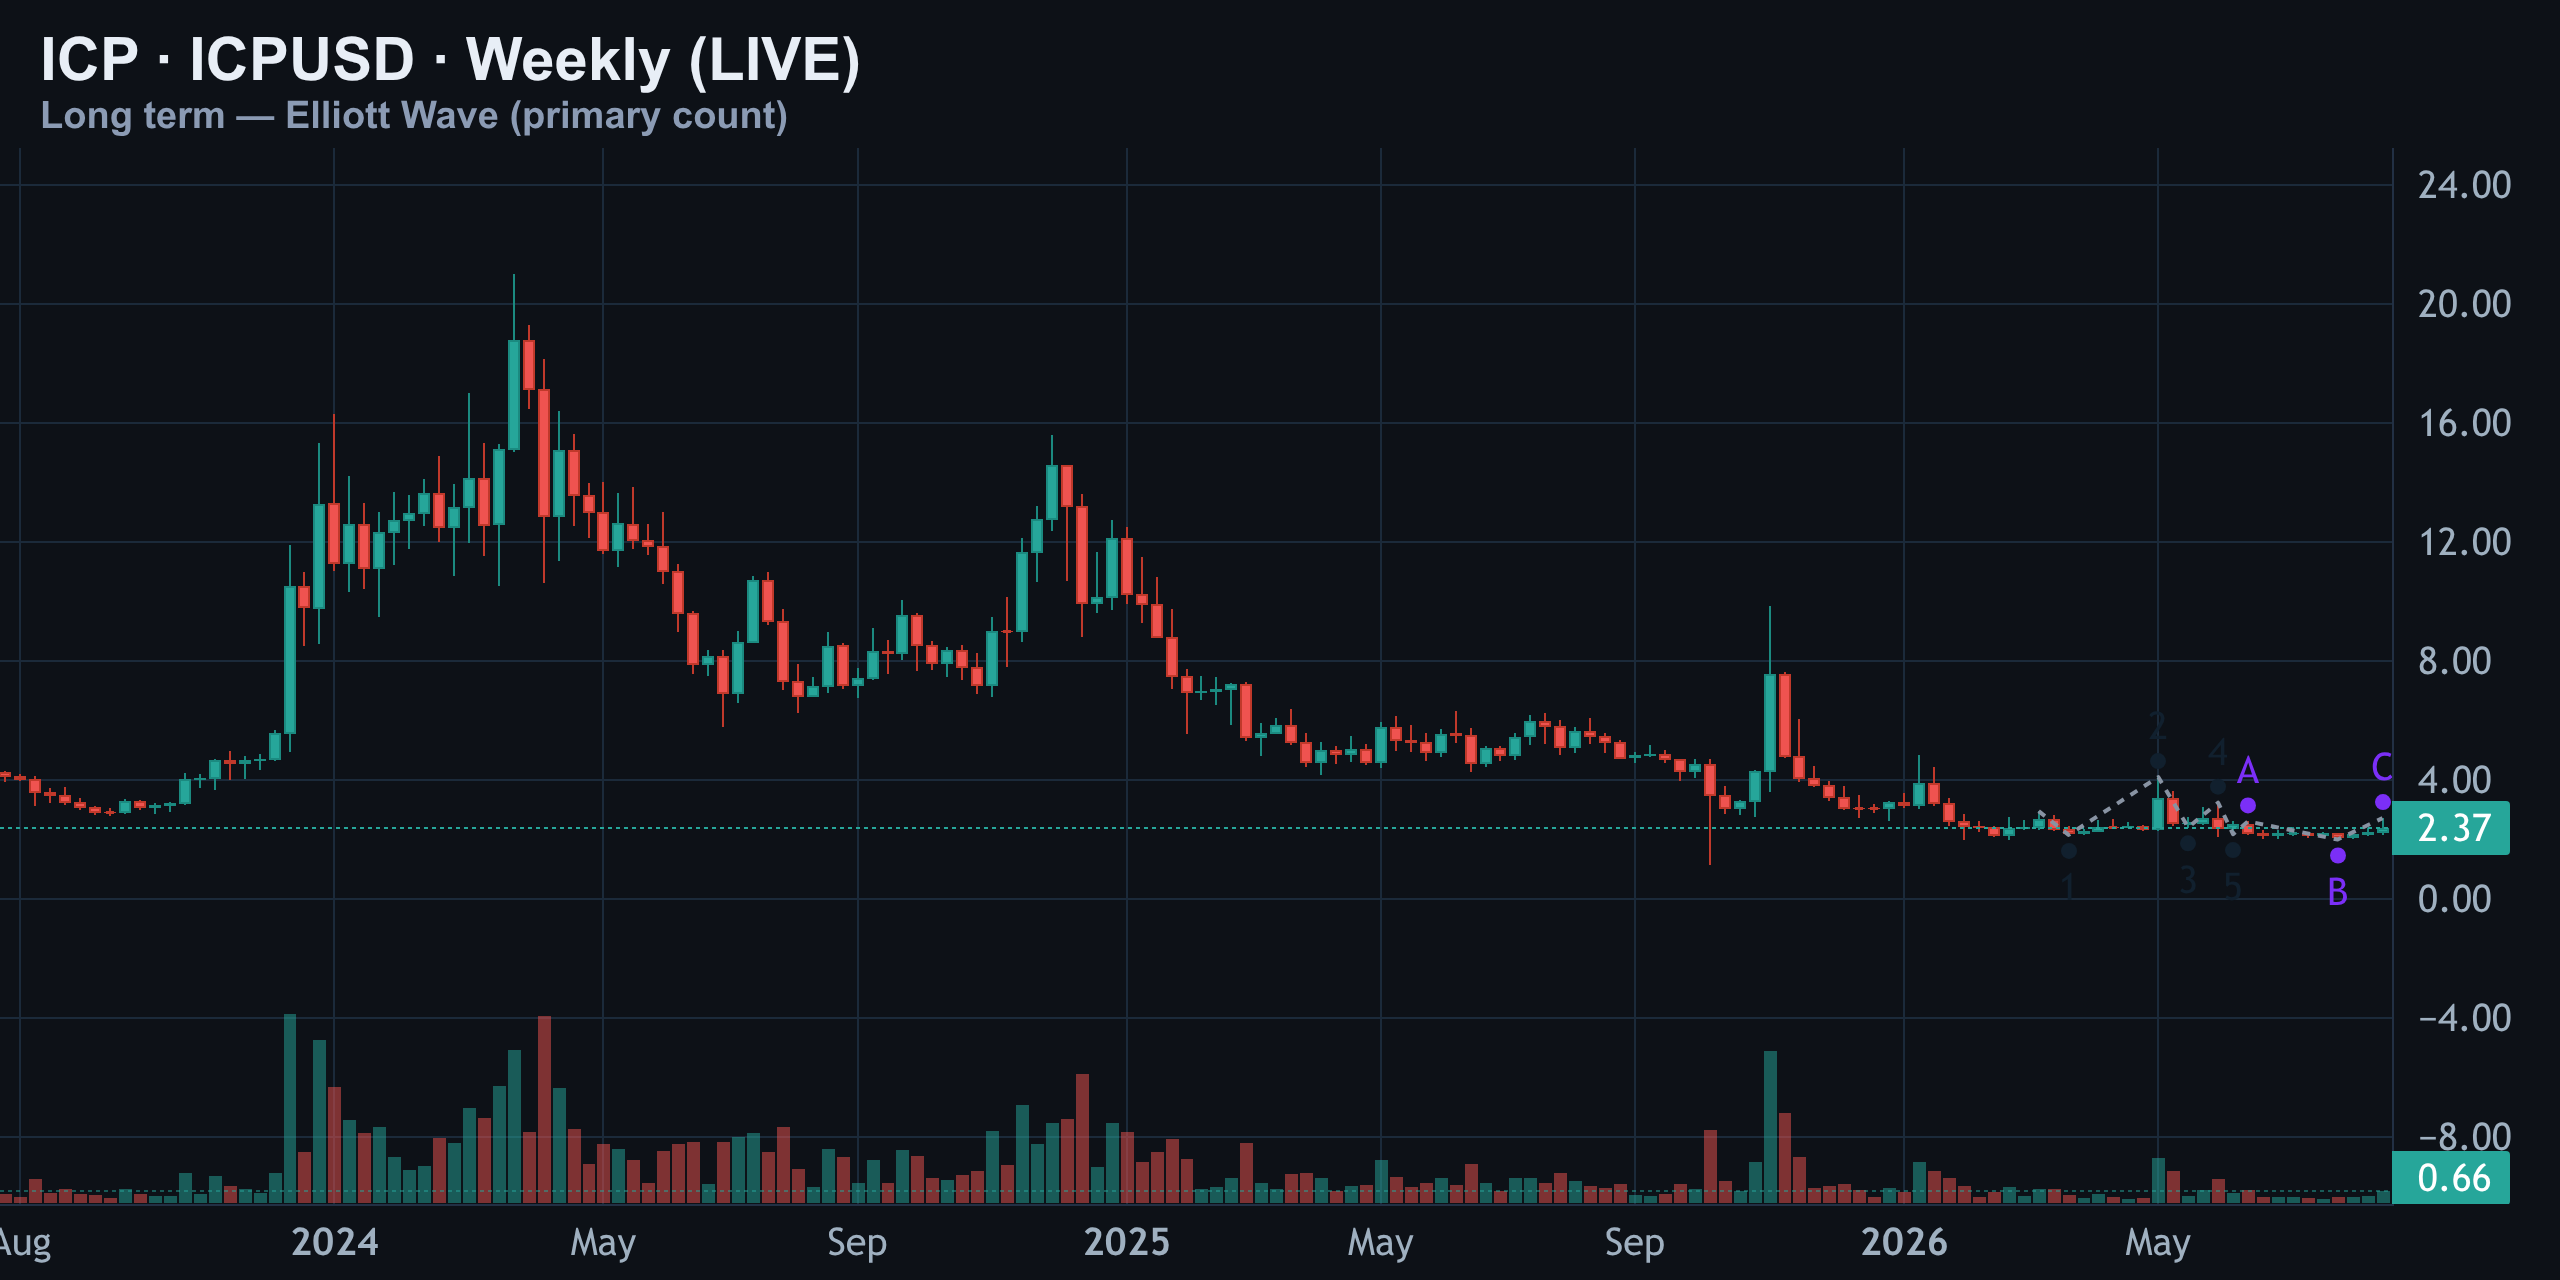
The weekly chart adds necessary perspective. ICP is still in a repair phase after a deep decline, not in a clearly established long-term uptrend. That does not rule out powerful rallies, but it does mean every breakout needs follow-through. Long-term repair phases often produce violent countertrend moves, failed breakouts, and sharp retracements.
Momentum looks better than positioning
The technical signals are mixed. Daily momentum has improved, and RSI still appears to have room before reaching an extreme condition. The problem is that momentum alone cannot explain the current risk. Price has rejected resistance, red volume has increased, and derivatives positioning is leaning toward the side that can be forced out.
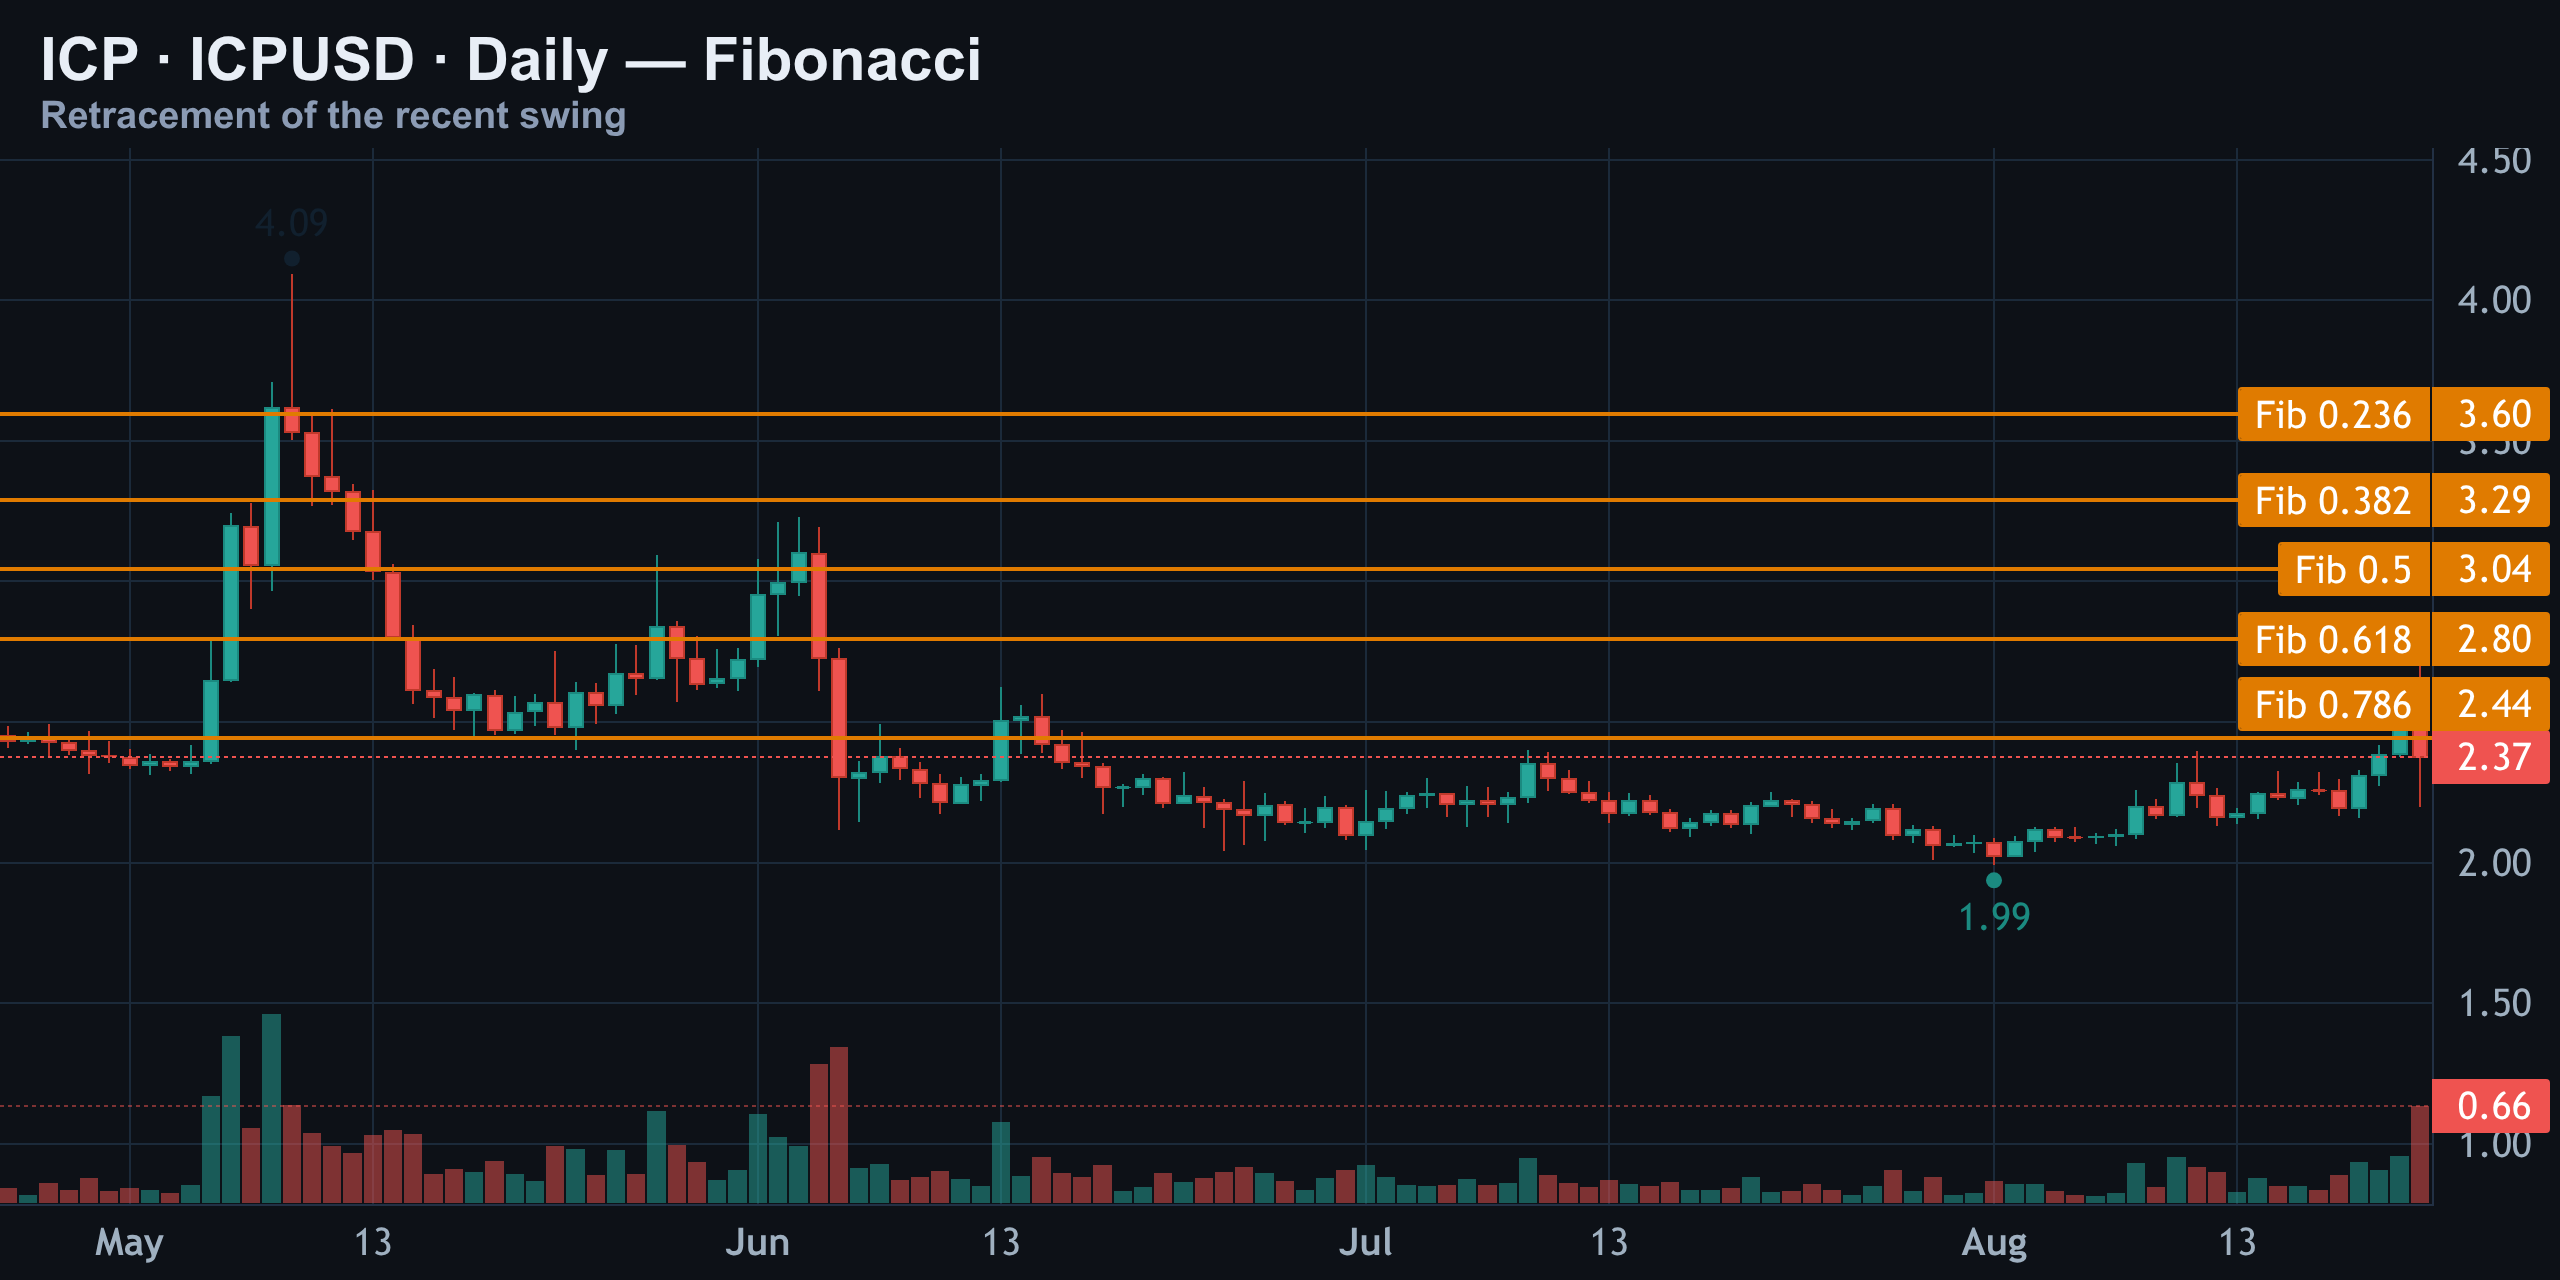
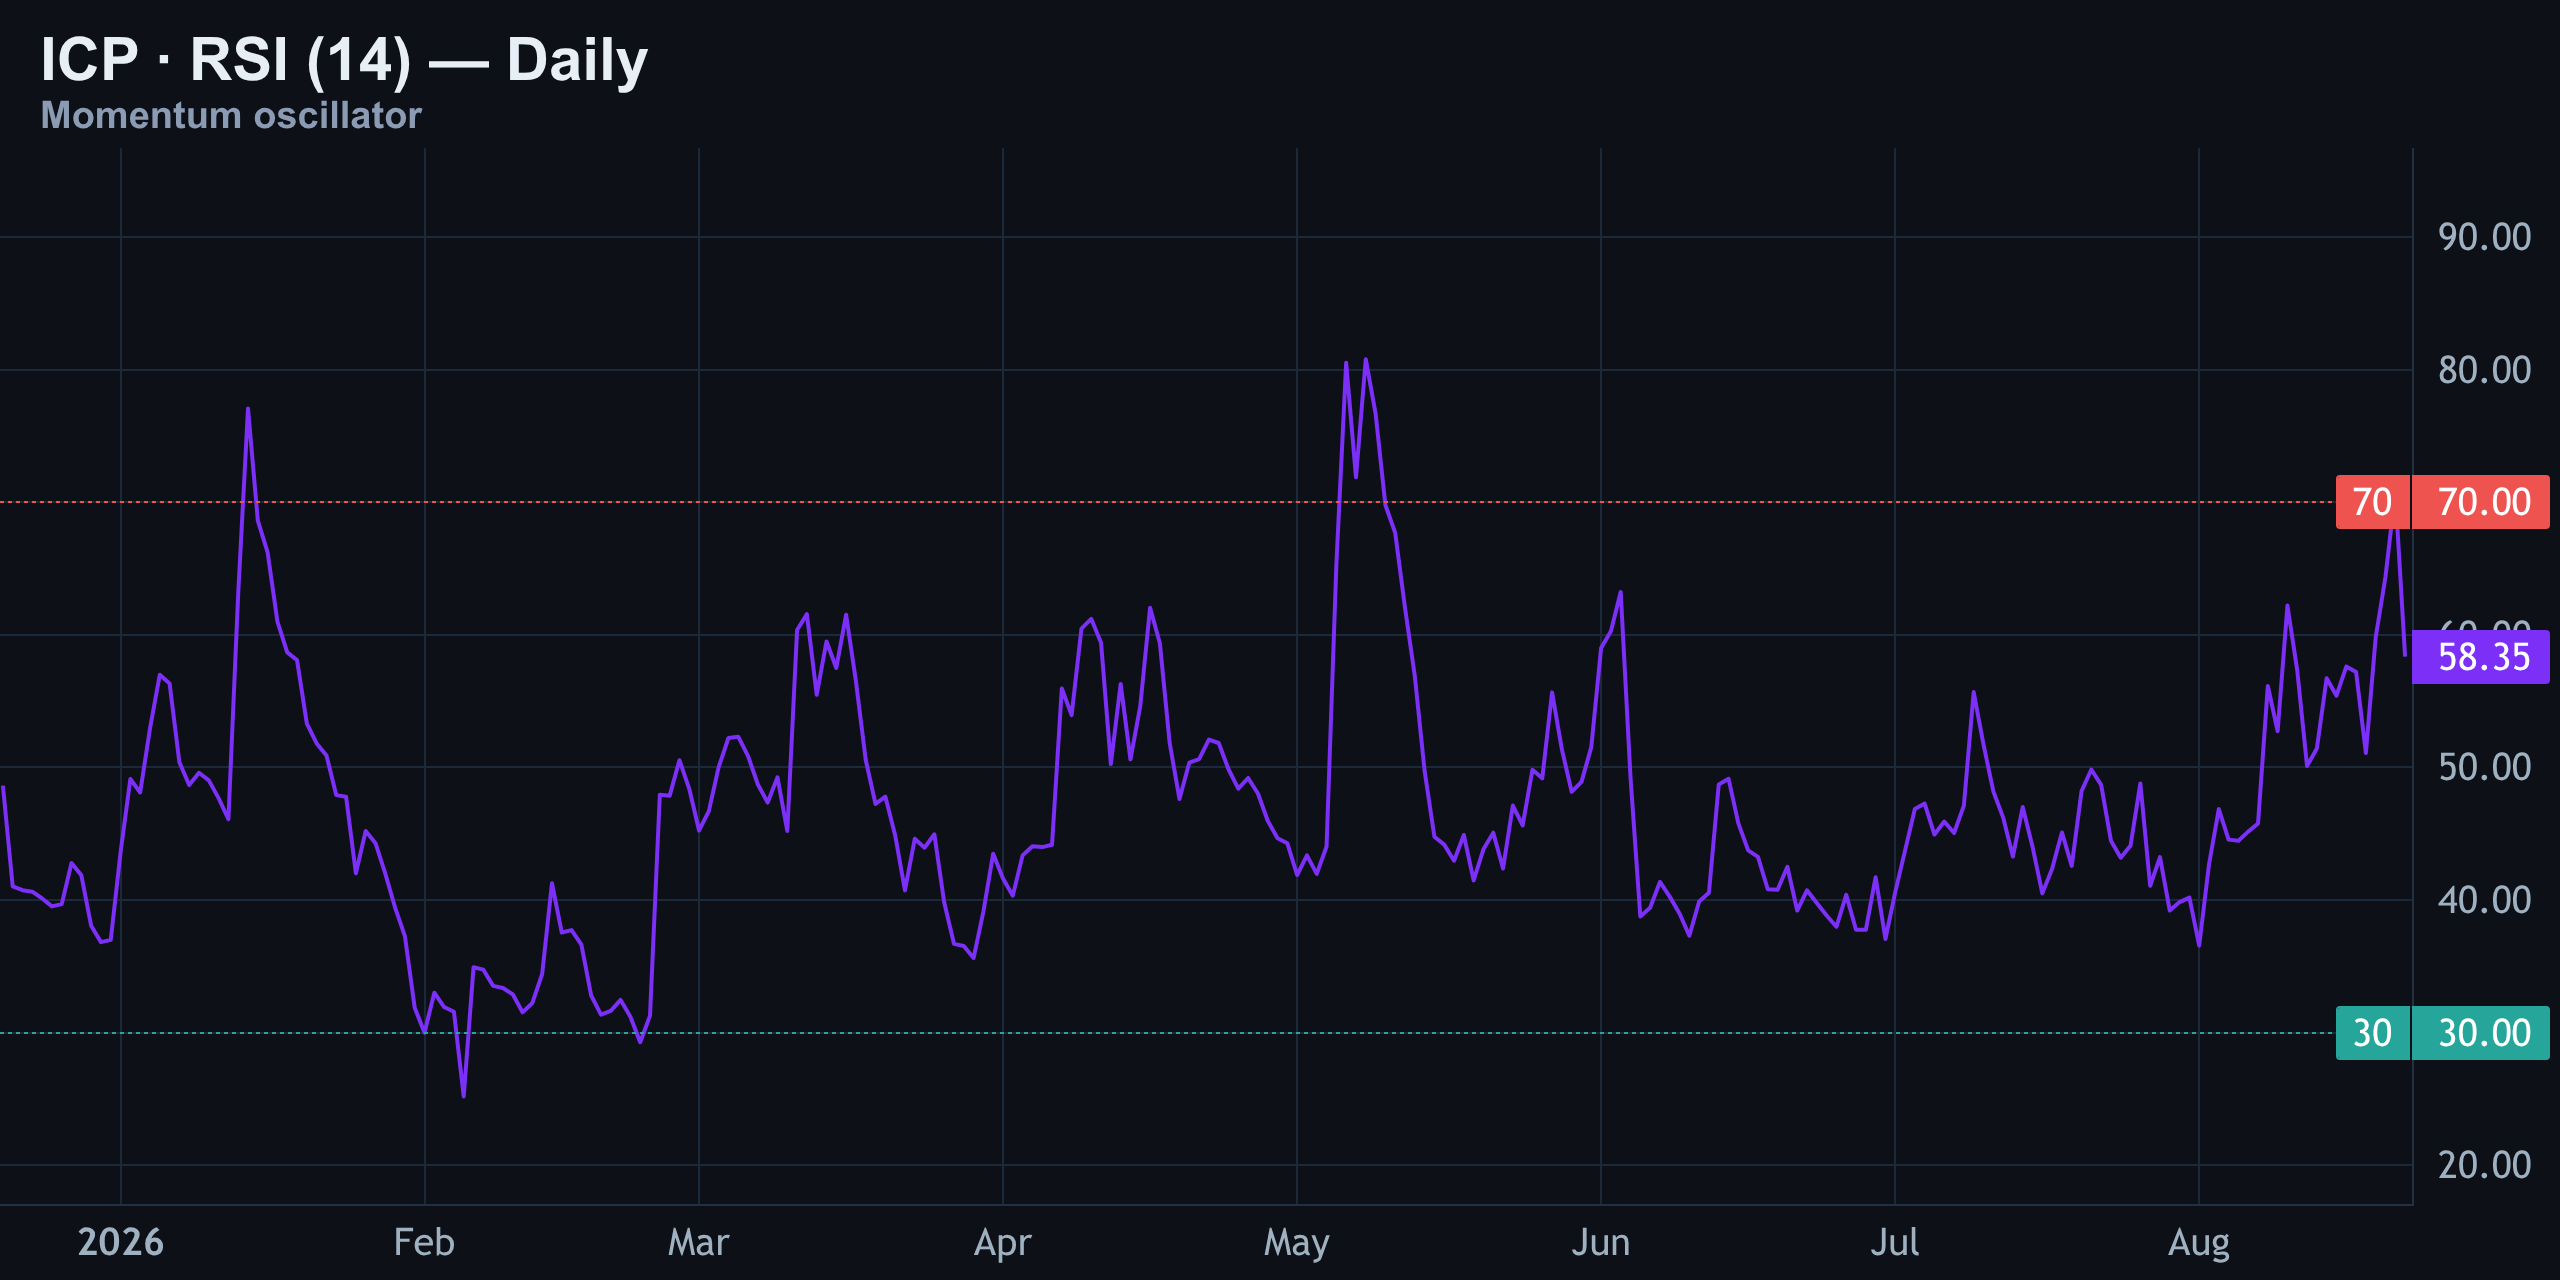
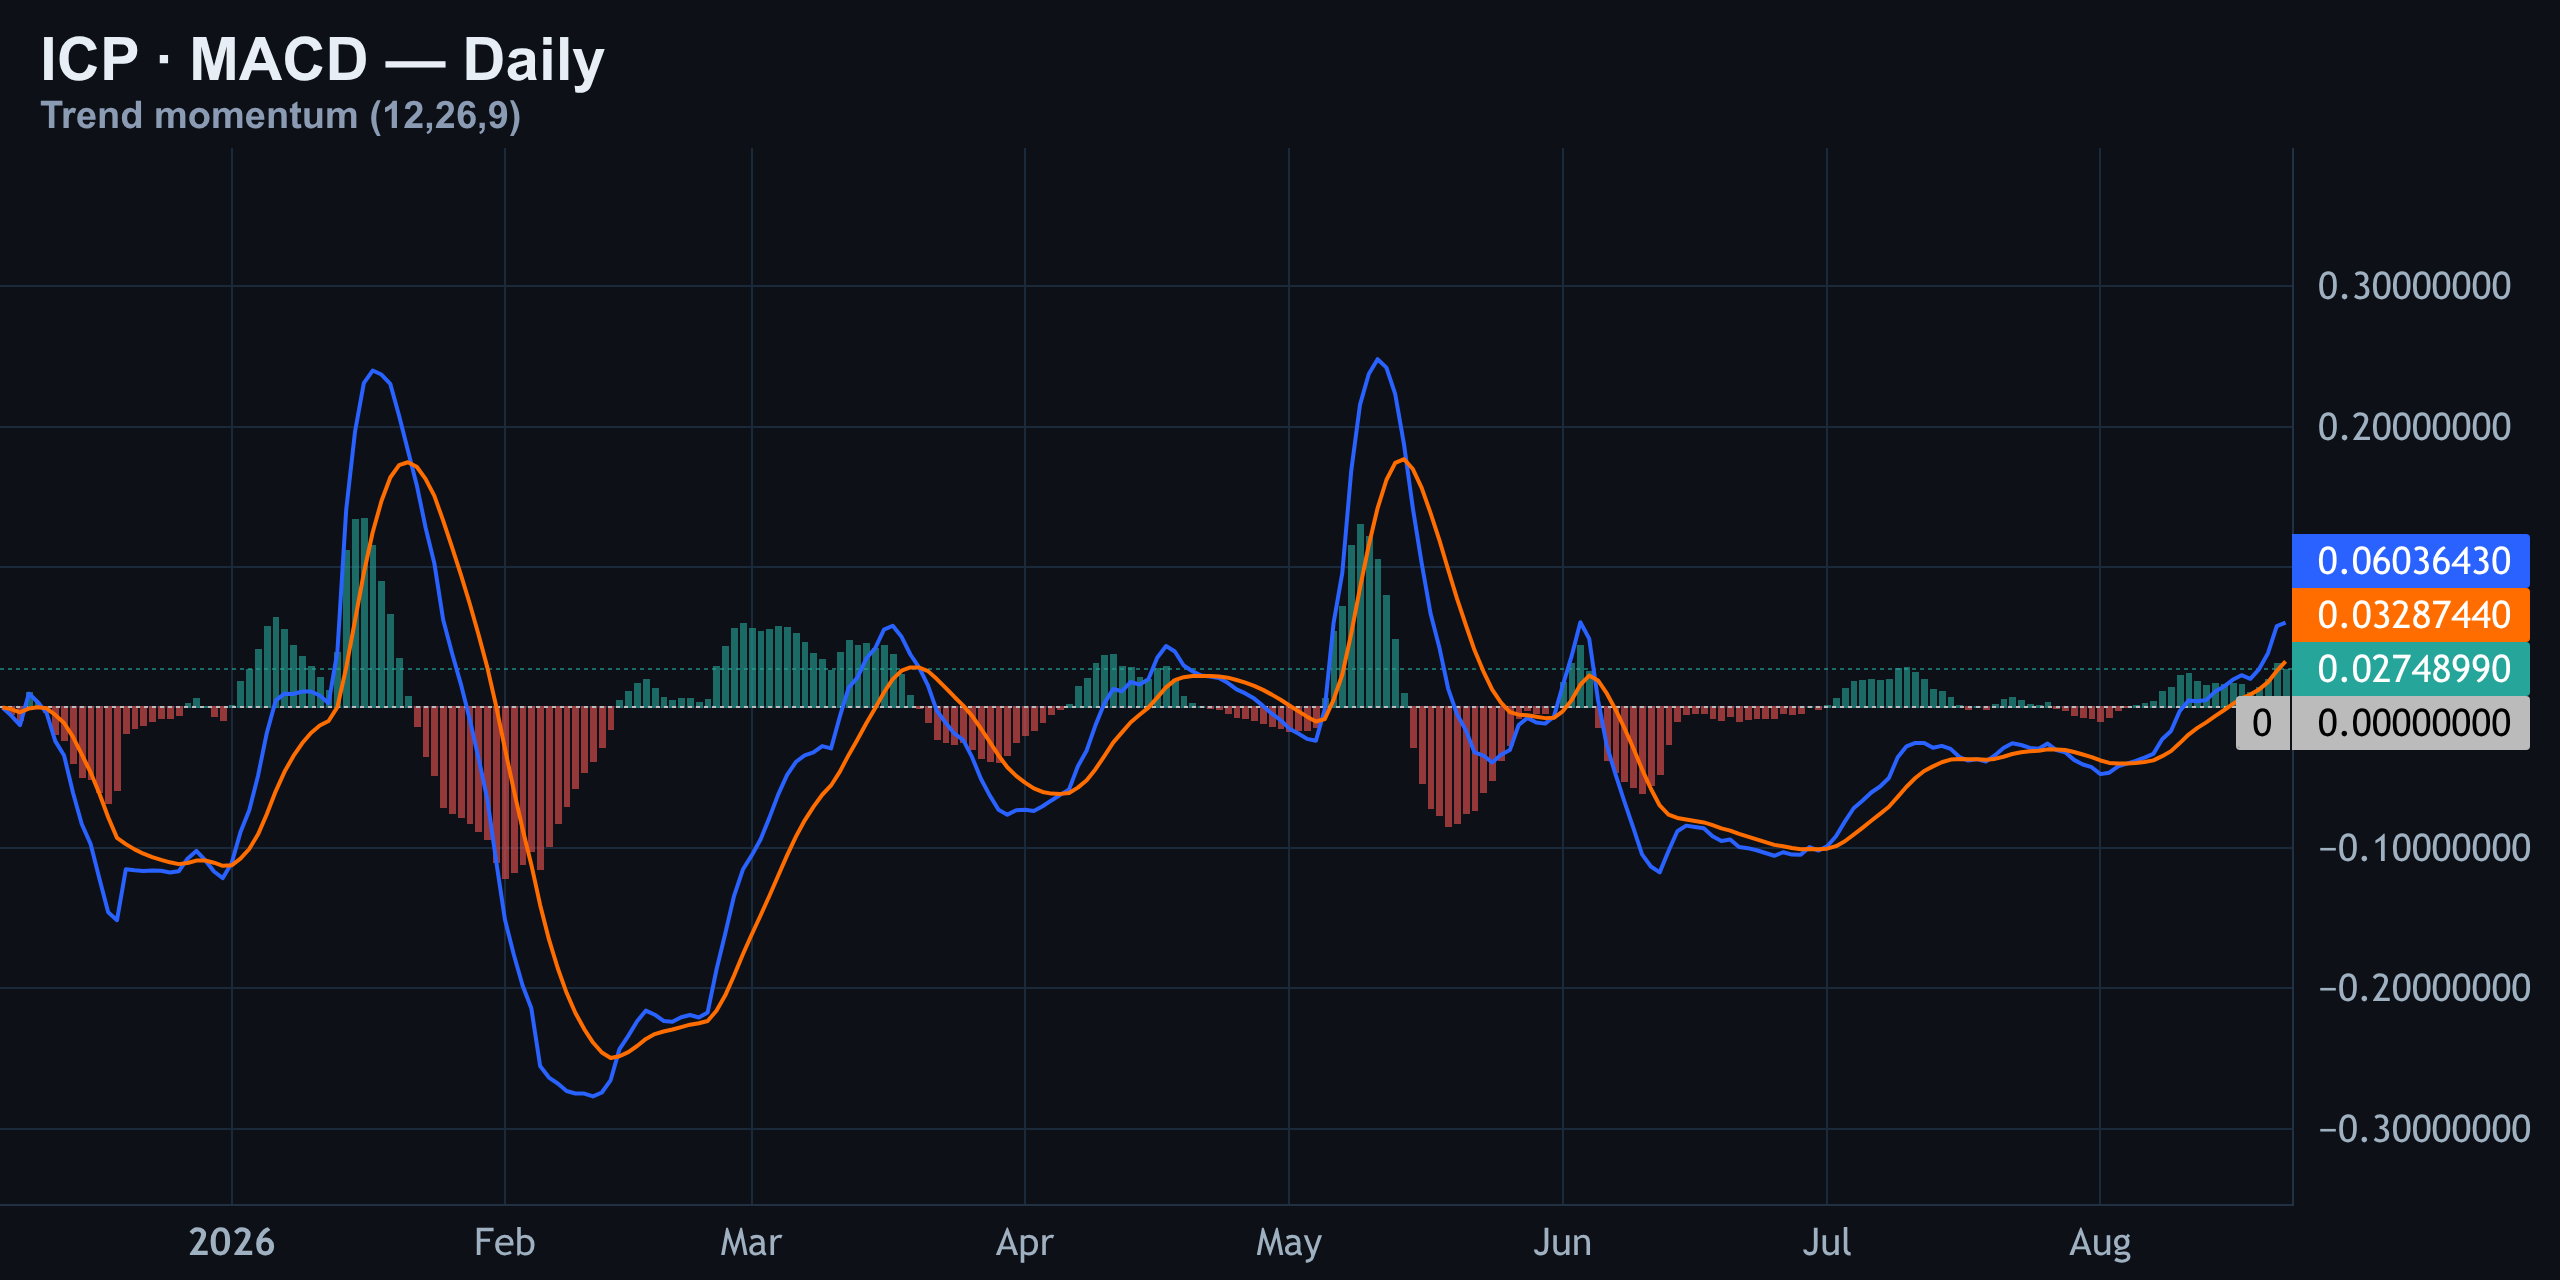
This is why the MACD should be treated as a condition, not a conclusion. A positive daily MACD supports the idea that buyers still have some underlying momentum. It does not override a failed breakout or guarantee that the next candle will rise. The strongest confirmation would come from positive momentum combined with a reclaim of $2.40 and declining leverage stress.
Derivatives currently lean cautious. Funding is positive, global accounts are long-biased, and taker flow is below one, indicating that aggressive market selling is winning. Open interest is broadly flat, so this does not look like a fresh surge of leverage. Instead, it resembles existing crowded longs meeting immediate supply.
| Signal | Current read | Trading implication |
|---|---|---|
| Daily MACD | Positive | Supports recovery, but needs price confirmation |
| RSI | Room remains | Not overbought, but not a buy signal by itself |
| Funding | Positive | Longs are paying; downside squeeze risk is elevated |
| Taker flow | Below one | Aggressive selling is currently dominant |
| Open interest | Approximately flat | Positioning is crowded without obvious new leverage expansion |
| Coinbase versus Binance | Small discount | US spot demand is not fully validating the rally |
On-chain data and market psychology
The on-chain picture prevents an overly bearish interpretation. MVRV is near deep-value territory, and active addresses are rising. Together, those signals suggest that ICP is not obviously experiencing a structural collapse in participation. They may support a longer-term recovery thesis, but they do not tell traders exactly where the next short-term candle will close.
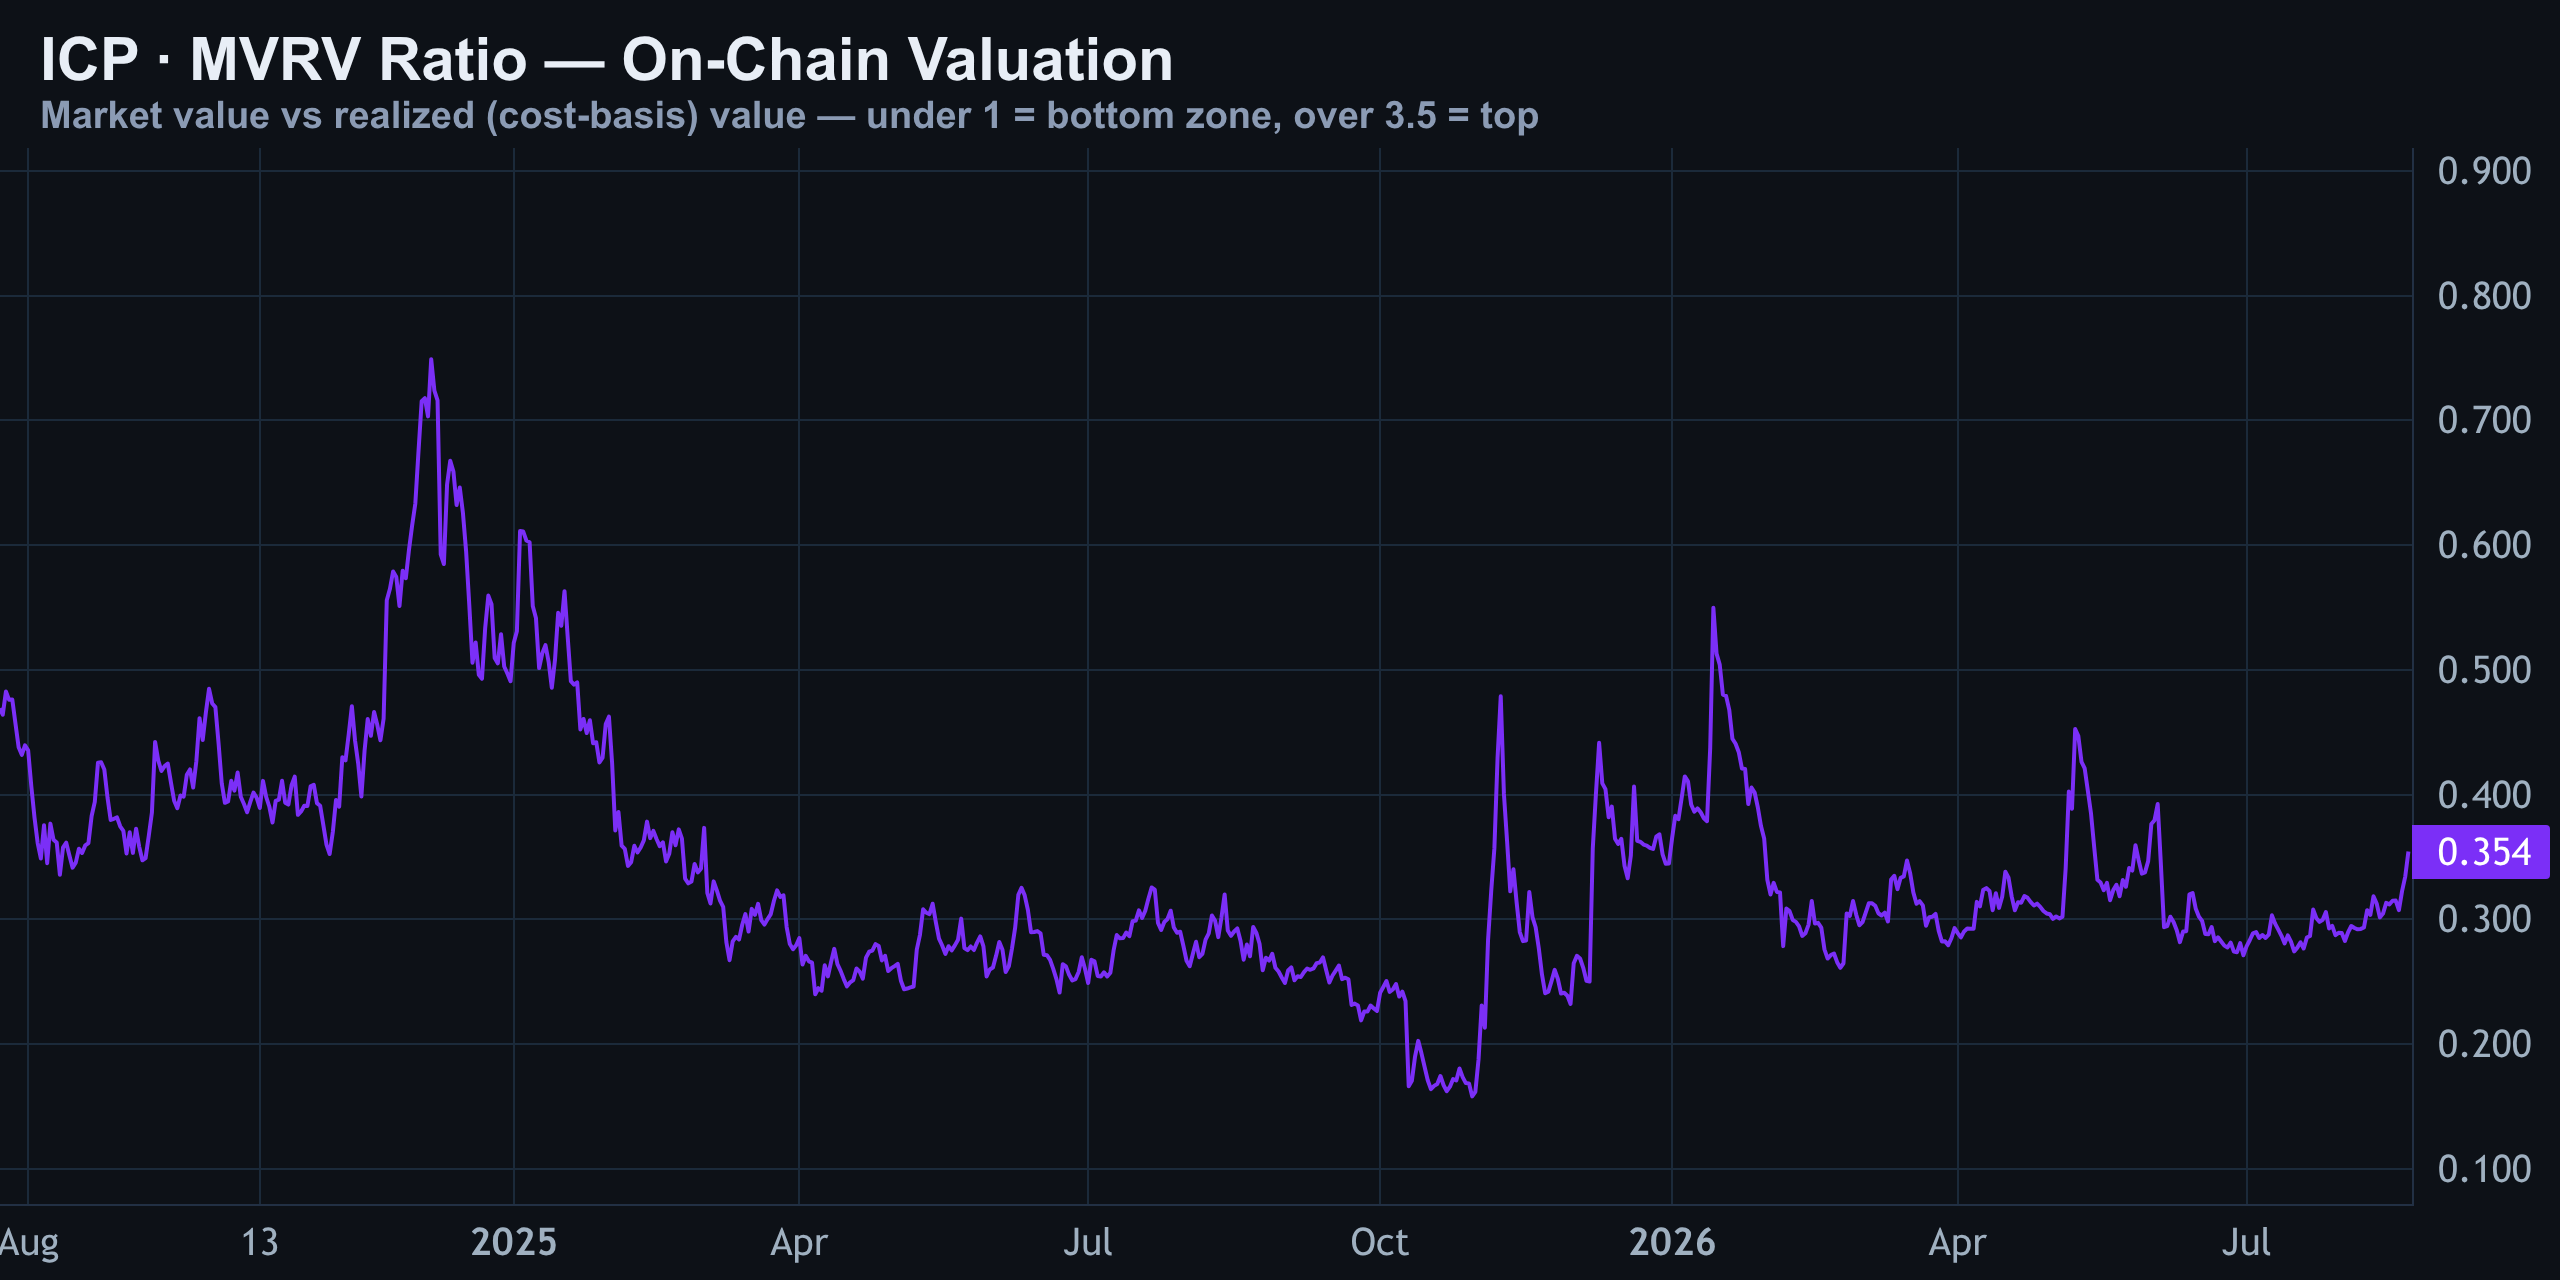
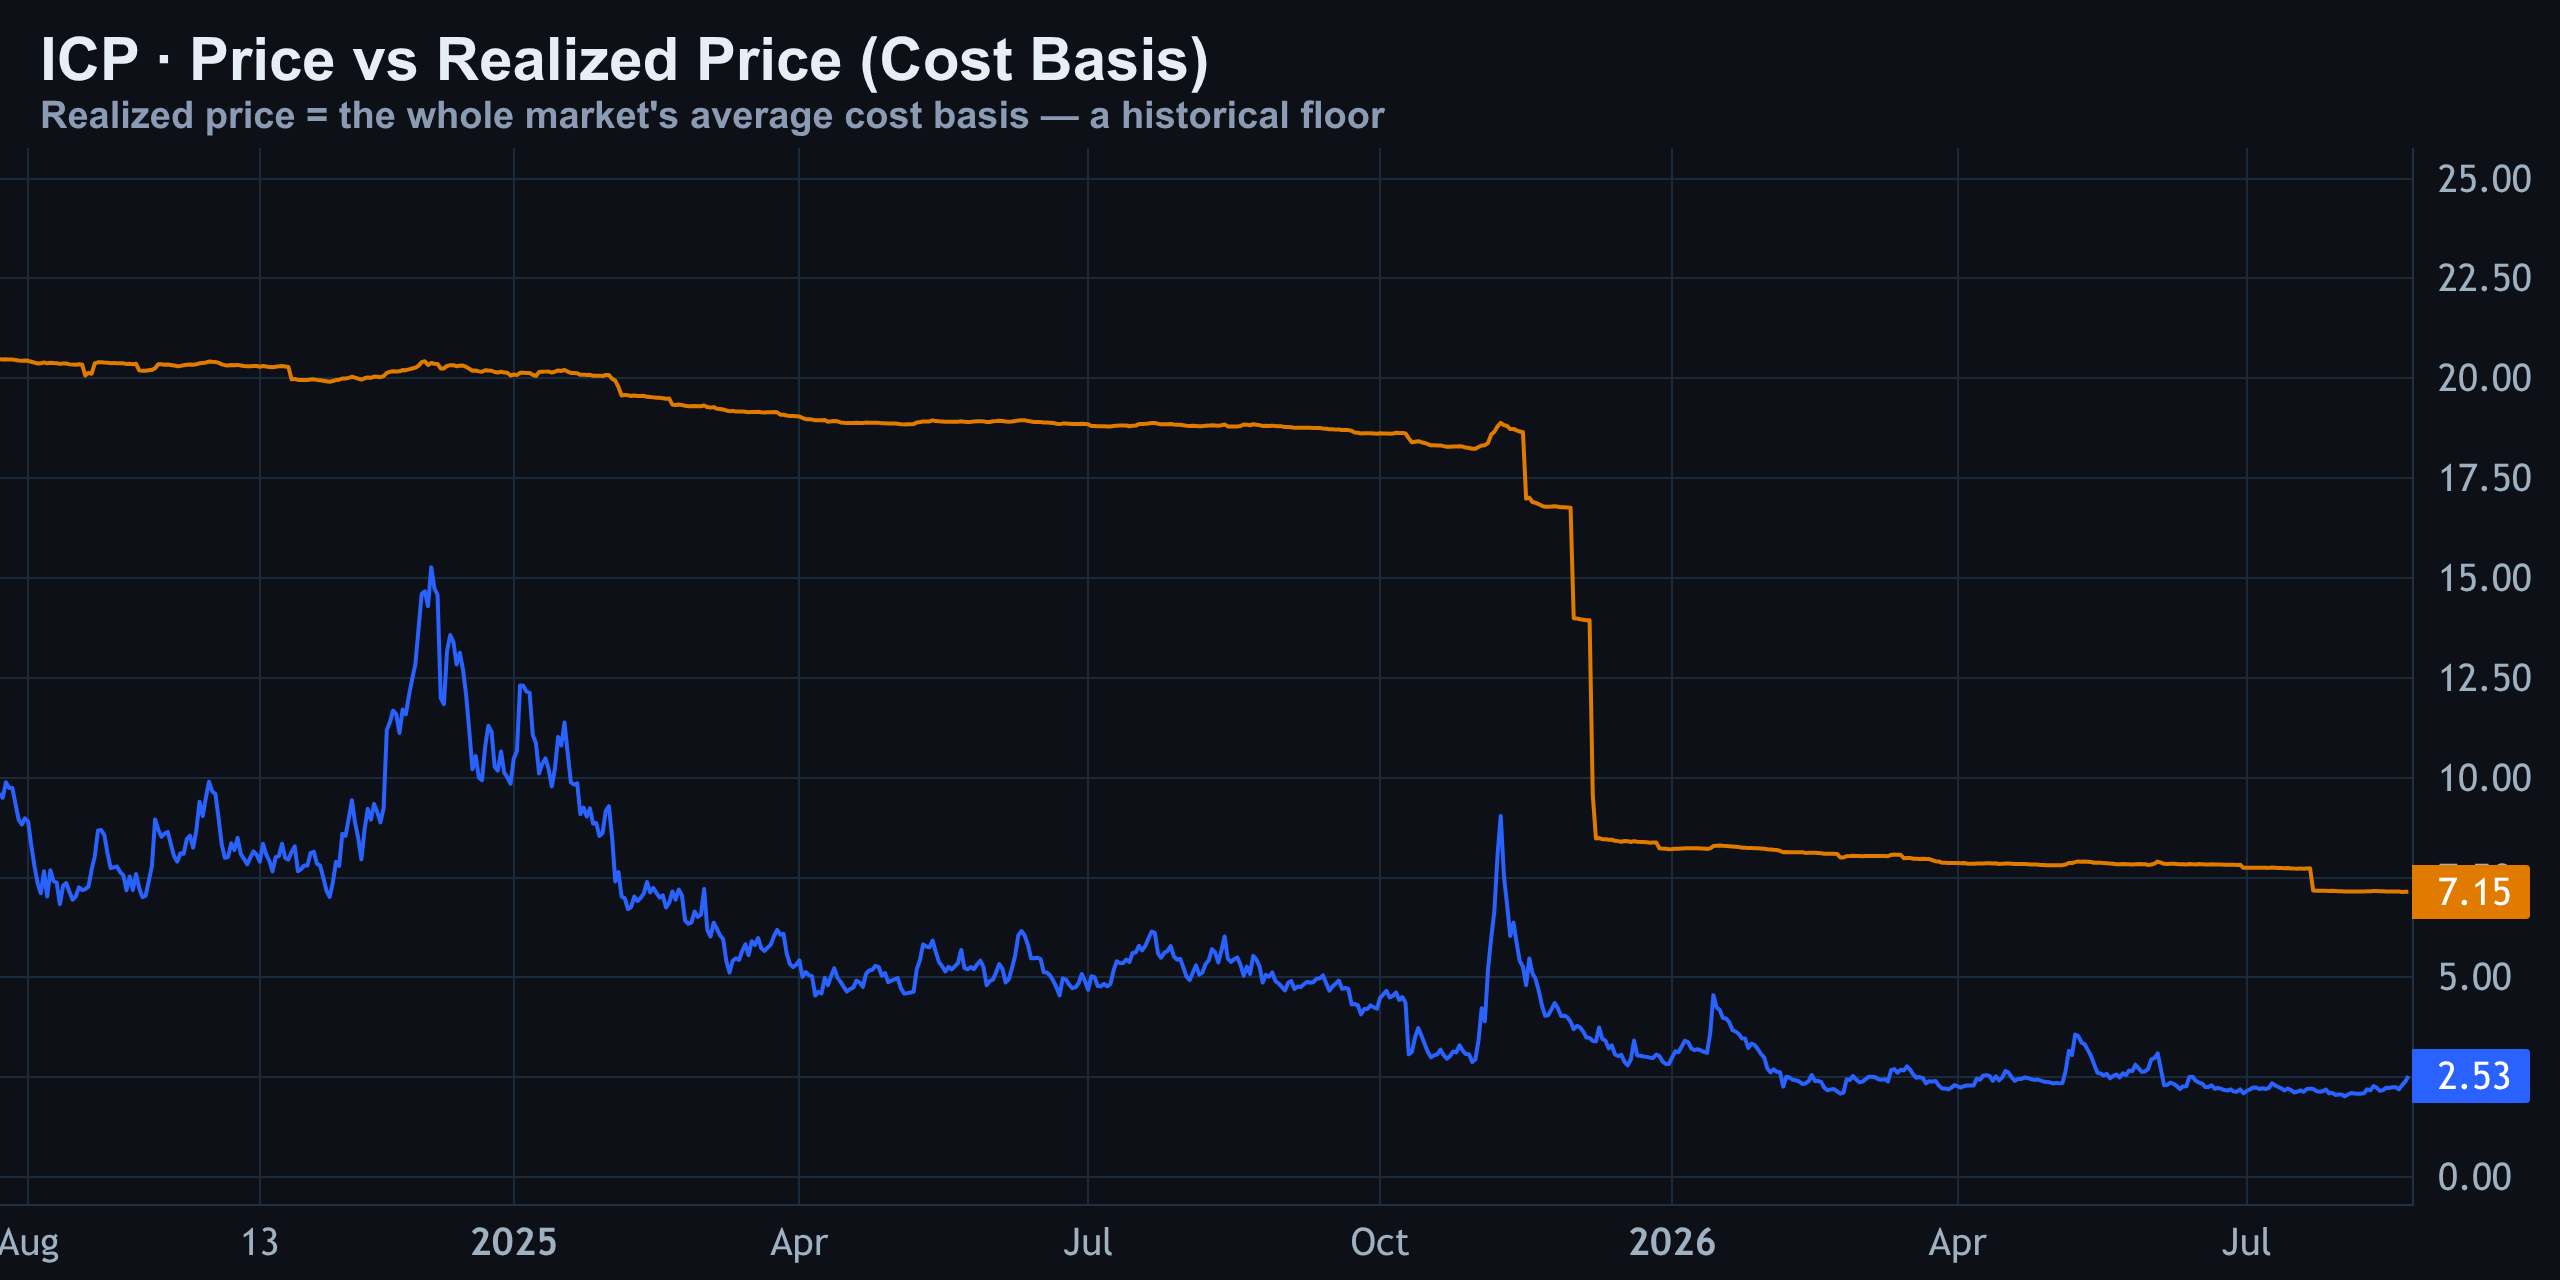
This creates a familiar psychological conflict. Value-oriented participants may see a discounted asset and expect mean reversion. Short-term traders see a failed push into resistance, a Coinbase discount, and a long-heavy derivatives book. When those groups disagree, price often searches for liquidity before choosing direction.
The practical lesson is simple: on-chain value can explain why buyers may defend lower prices, but it cannot replace a technical trigger. For the next decision, the market still needs to prove whether $2.354 is support or merely a temporary pause before another leg lower.
The trade plan: wait for the level that wakes ICP up
There is no clean new trade at the required 1:2.5 risk-reward today. Chasing a long beneath $2.40 means buying directly into resistance while longs are already crowded. Shorting immediately near $2.37 is also unattractive because the market is close to the $2.354 pivot and the larger $2.20 bid zone. In both directions, the nearby invalidation and liquidity conditions are too messy.
| Scenario | Confirmation | Potential path | Response |
|---|---|---|---|
| Bullish reclaim | Four-hour or daily close above $2.40, followed by a hold | $2.50 and then the upper-$2 area | Only consider continuation after the retest holds |
| Pivot holds | Price defends $2.354 and recovers short-term momentum | Retest of $2.40 | Monitor; wait for confirmation rather than chase |
| Bearish breakdown | Sustained loss of $2.354 | $2.20 liquidity zone | Expect volatility and possible liquidation acceleration |
| Failed breakout | Price rejects $2.40 again and loses $2.354 | Range continuation or deeper pullback | Avoid fresh longs until structure improves |
For traders already involved, the key management question is whether the original stop remains appropriate under the published plan. For traders on the sidelines, patience is a position. The best signal would be a reclaim of $2.40 with stronger spot demand, lower long crowding, and a successful retest. The best bearish signal would be a clean loss of $2.354 accompanied by expanding sell volume.
Across traditional finance and crypto, the broader backdrop still matters. Shifts in dollar strength, interest-rate expectations, equity-market risk appetite, and Bitcoin direction can all influence whether an altcoin recovery receives enough liquidity to continue. ICP should not be analysed in isolation, particularly while its own order book and derivatives data are sending conflicting messages.
ICP August 22, 2026: final verdict
ICP is not giving traders a clean directional answer yet. The bullish case has evidence: daily MACD is positive, RSI has room, the asset remains near deep-value on-chain territory, and active-address data is improving. The bearish case is equally practical: price rejected the upper channel, the $2.40 area remains overhead resistance, Coinbase is at a discount, taker flow is selling, and the liquidation map shows vulnerable longs below spot.
That leaves $2.354 as the decision level. Above it, ICP can attempt to stabilise and retest $2.40. Below it, the market may seek the larger liquidity pocket around $2.20. Until one of those scenarios confirms, standing aside is not indecision—it is disciplined risk management.
Watch the level, not the narrative. If ICP reclaims resistance with real spot participation, the recovery thesis strengthens. If it loses support while leverage remains crowded, the market may punish late longs quickly. This is Finance With FM, and the next update should become clearer once ICP chooses which side of the pivot it wants to own.
More on Internetcomputer: elliott wave
Analysis and education, not investment advice. See our editorial policy.