Daily market analysis
Internetcomputer (ICP) elliott wave
Last updated
ICP Elliott Wave: $2.33 Cap Holds, Wave C Targets $2.16
Invalidation Held, Trigger Fired
Two days ago we flagged $2.33 as the wall to watch and said wave C was targeting $2.27. ICP didn't just tag that target — it blew straight through it. The token dropped roughly 3.5% from $2.28 to $2.20, printed a low near $2.17, bounced, and is now trading around $2.20, down about 2.3–3.2% on the day according to live trackers.
That's the key development. The $2.33 ceiling held perfectly on the bounce back, which means the bearish count isn't just intact — it's confirmed. We're now tracking the next leg down toward the $2.16 and $2.10 zones.
| Metric | Level |
|---|---|
| Current price (approx.) | $2.20 |
| Prior target hit | $2.17 (tagged) |
| Resistance / invalidation | $2.33 |
| Next downside target | $2.16 |
| Extended downside target | $2.10 |
4H — Higher-Degree Bias: A Broken Impulse, Not a Clean Five
Zoom out to the four-hour chart and the automatic pivot count wants to label the move from $2.25 up to $2.40 as a clean one-through-five impulse. The math disagrees.
- Wave two dropped all the way to $2.10 — a retrace of nearly 150% of wave one. Elliott's first hard rule says wave two can never retrace more than 100% of wave one. This one did.
- Wave four dragged down to $1.99, deep into wave one's territory. Overlap like that is forbidden in a standard impulse.
- Two rule breaks in the same count means the structure is corrective, not directional.
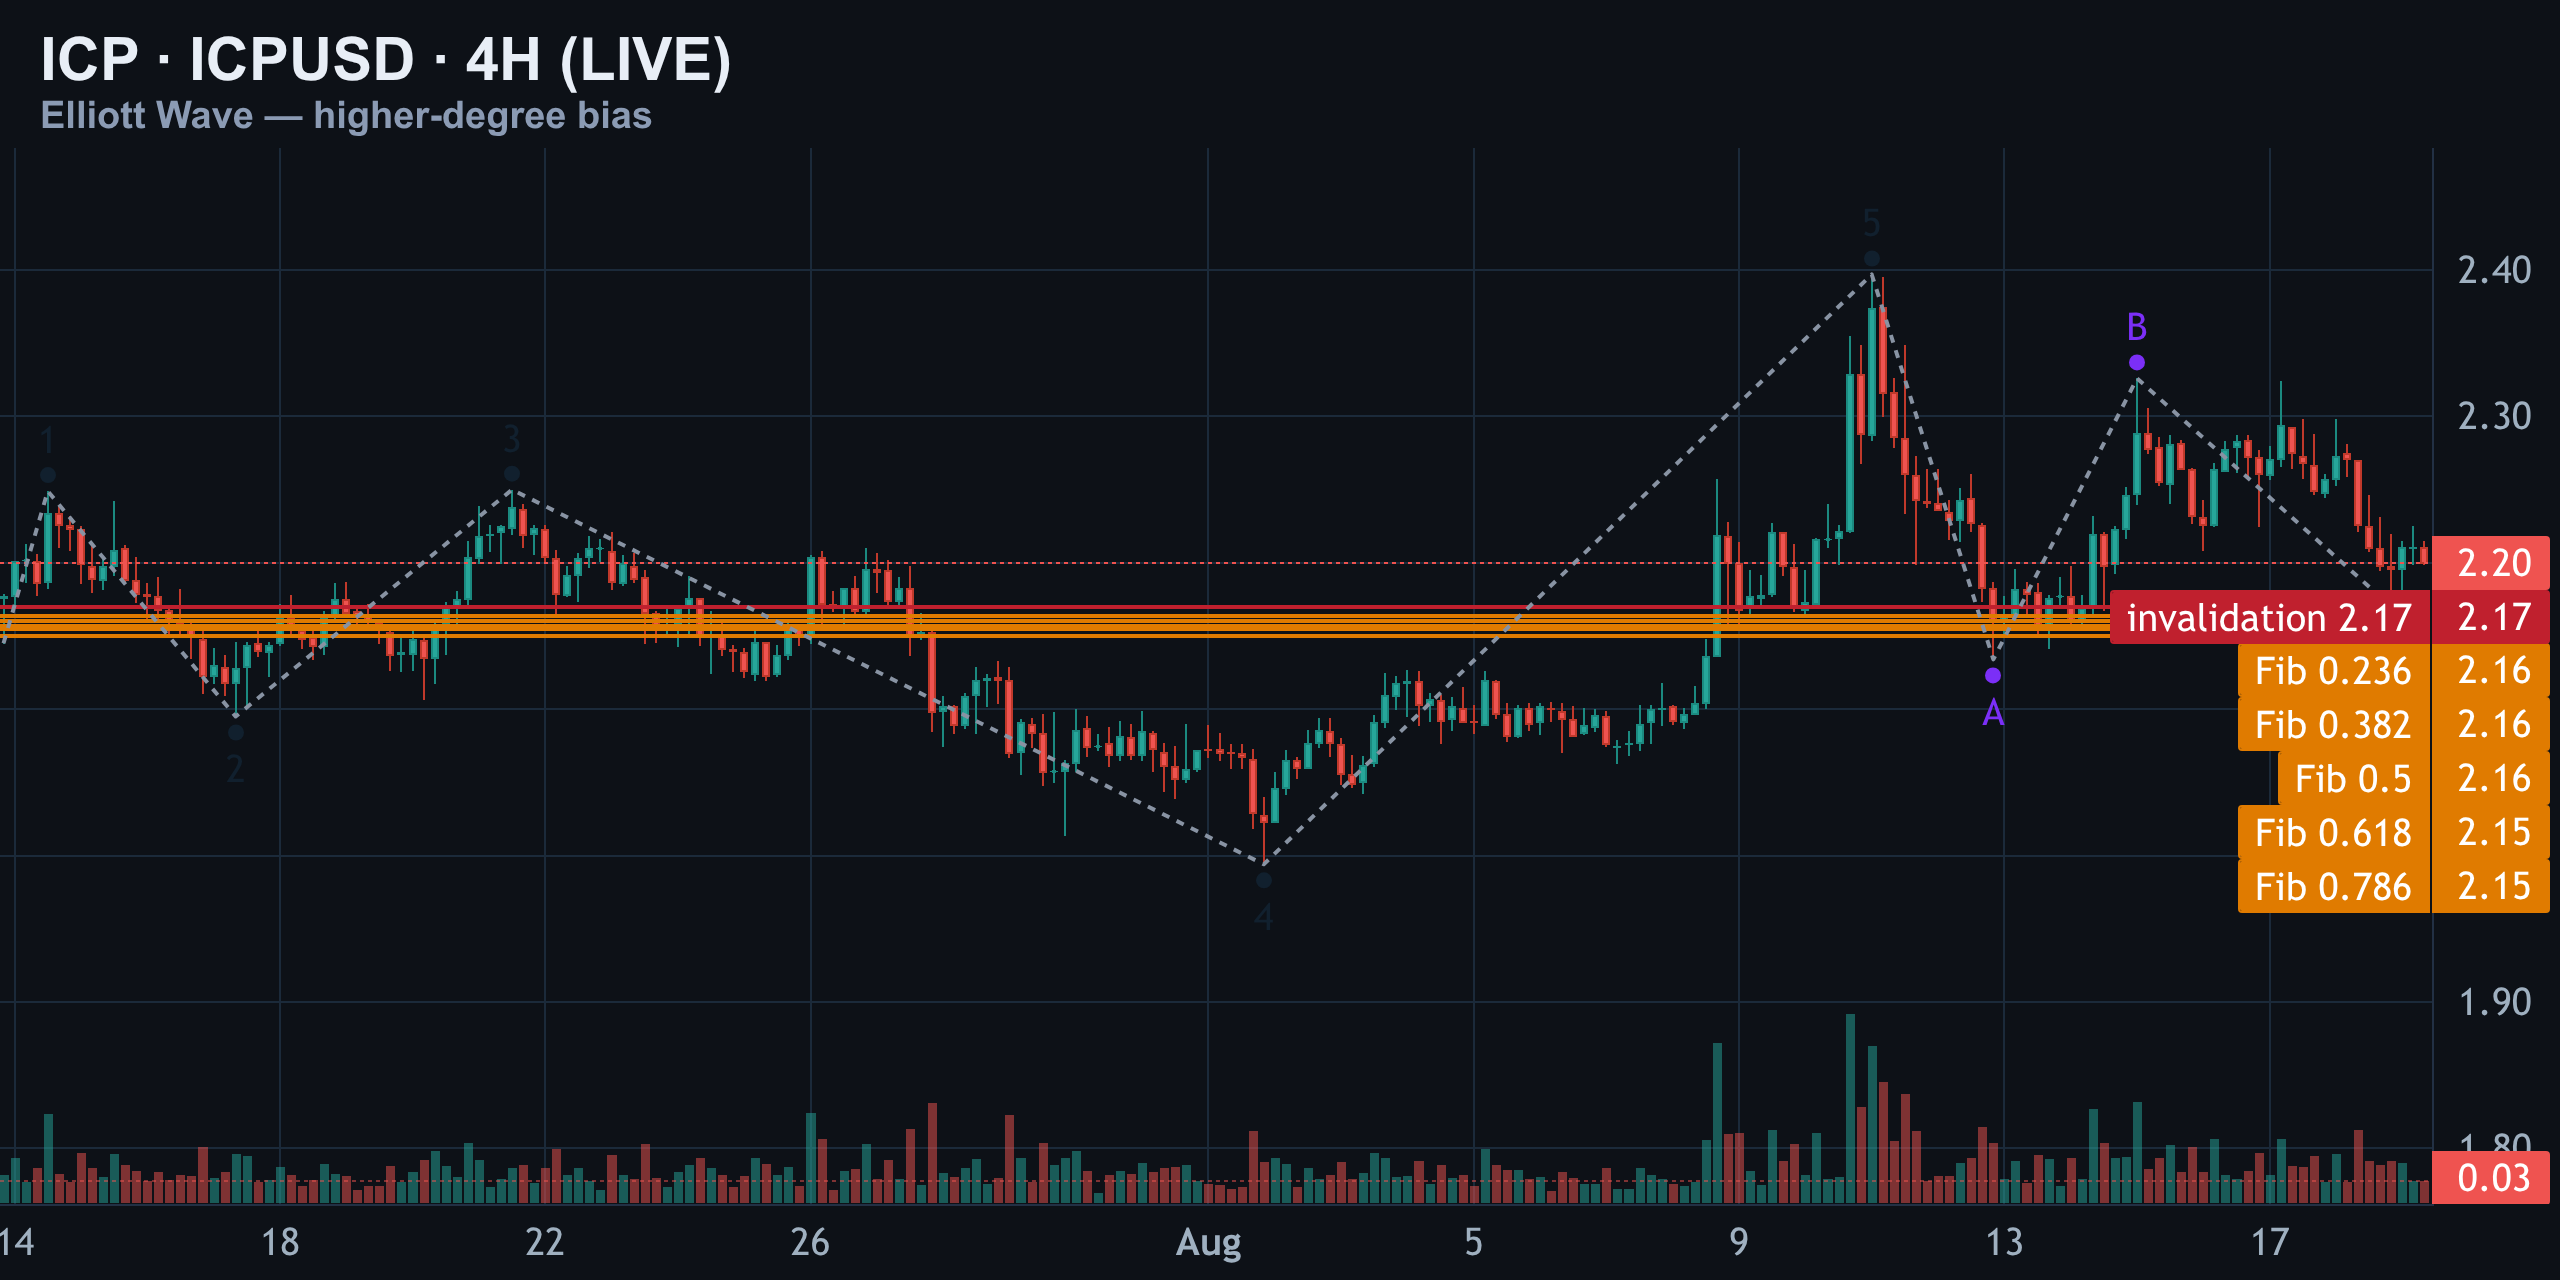
What this five-legged shape into $2.40 more likely represents is the final leg of a larger corrective sequence — a double zigzag or WXY pattern completing, not a fresh uptrend starting. From that $2.40 high, price rolled into an A-wave low at $2.13, bounced into a B-wave at $2.33 — and got rejected there hard, for the second time this week. That rejection is the single most important reaction on this chart, and it's also our invalidation line.
1H — Primary Count vs the Alternate: The $2.33 Line Decides It
On the one-hour, the primary count opens with a five-wave move: wave one to $2.35, wave two down to $2.27, wave three spiking to $2.40, wave four diving to $2.13, and wave five topping at $2.33. But wave three here is actually shorter than wave one — a hard rule break, since wave three can never be the shortest impulse wave. Combined with wave four dragging back into wave one's range, this five-wave shape is again corrective, not a launch pad.
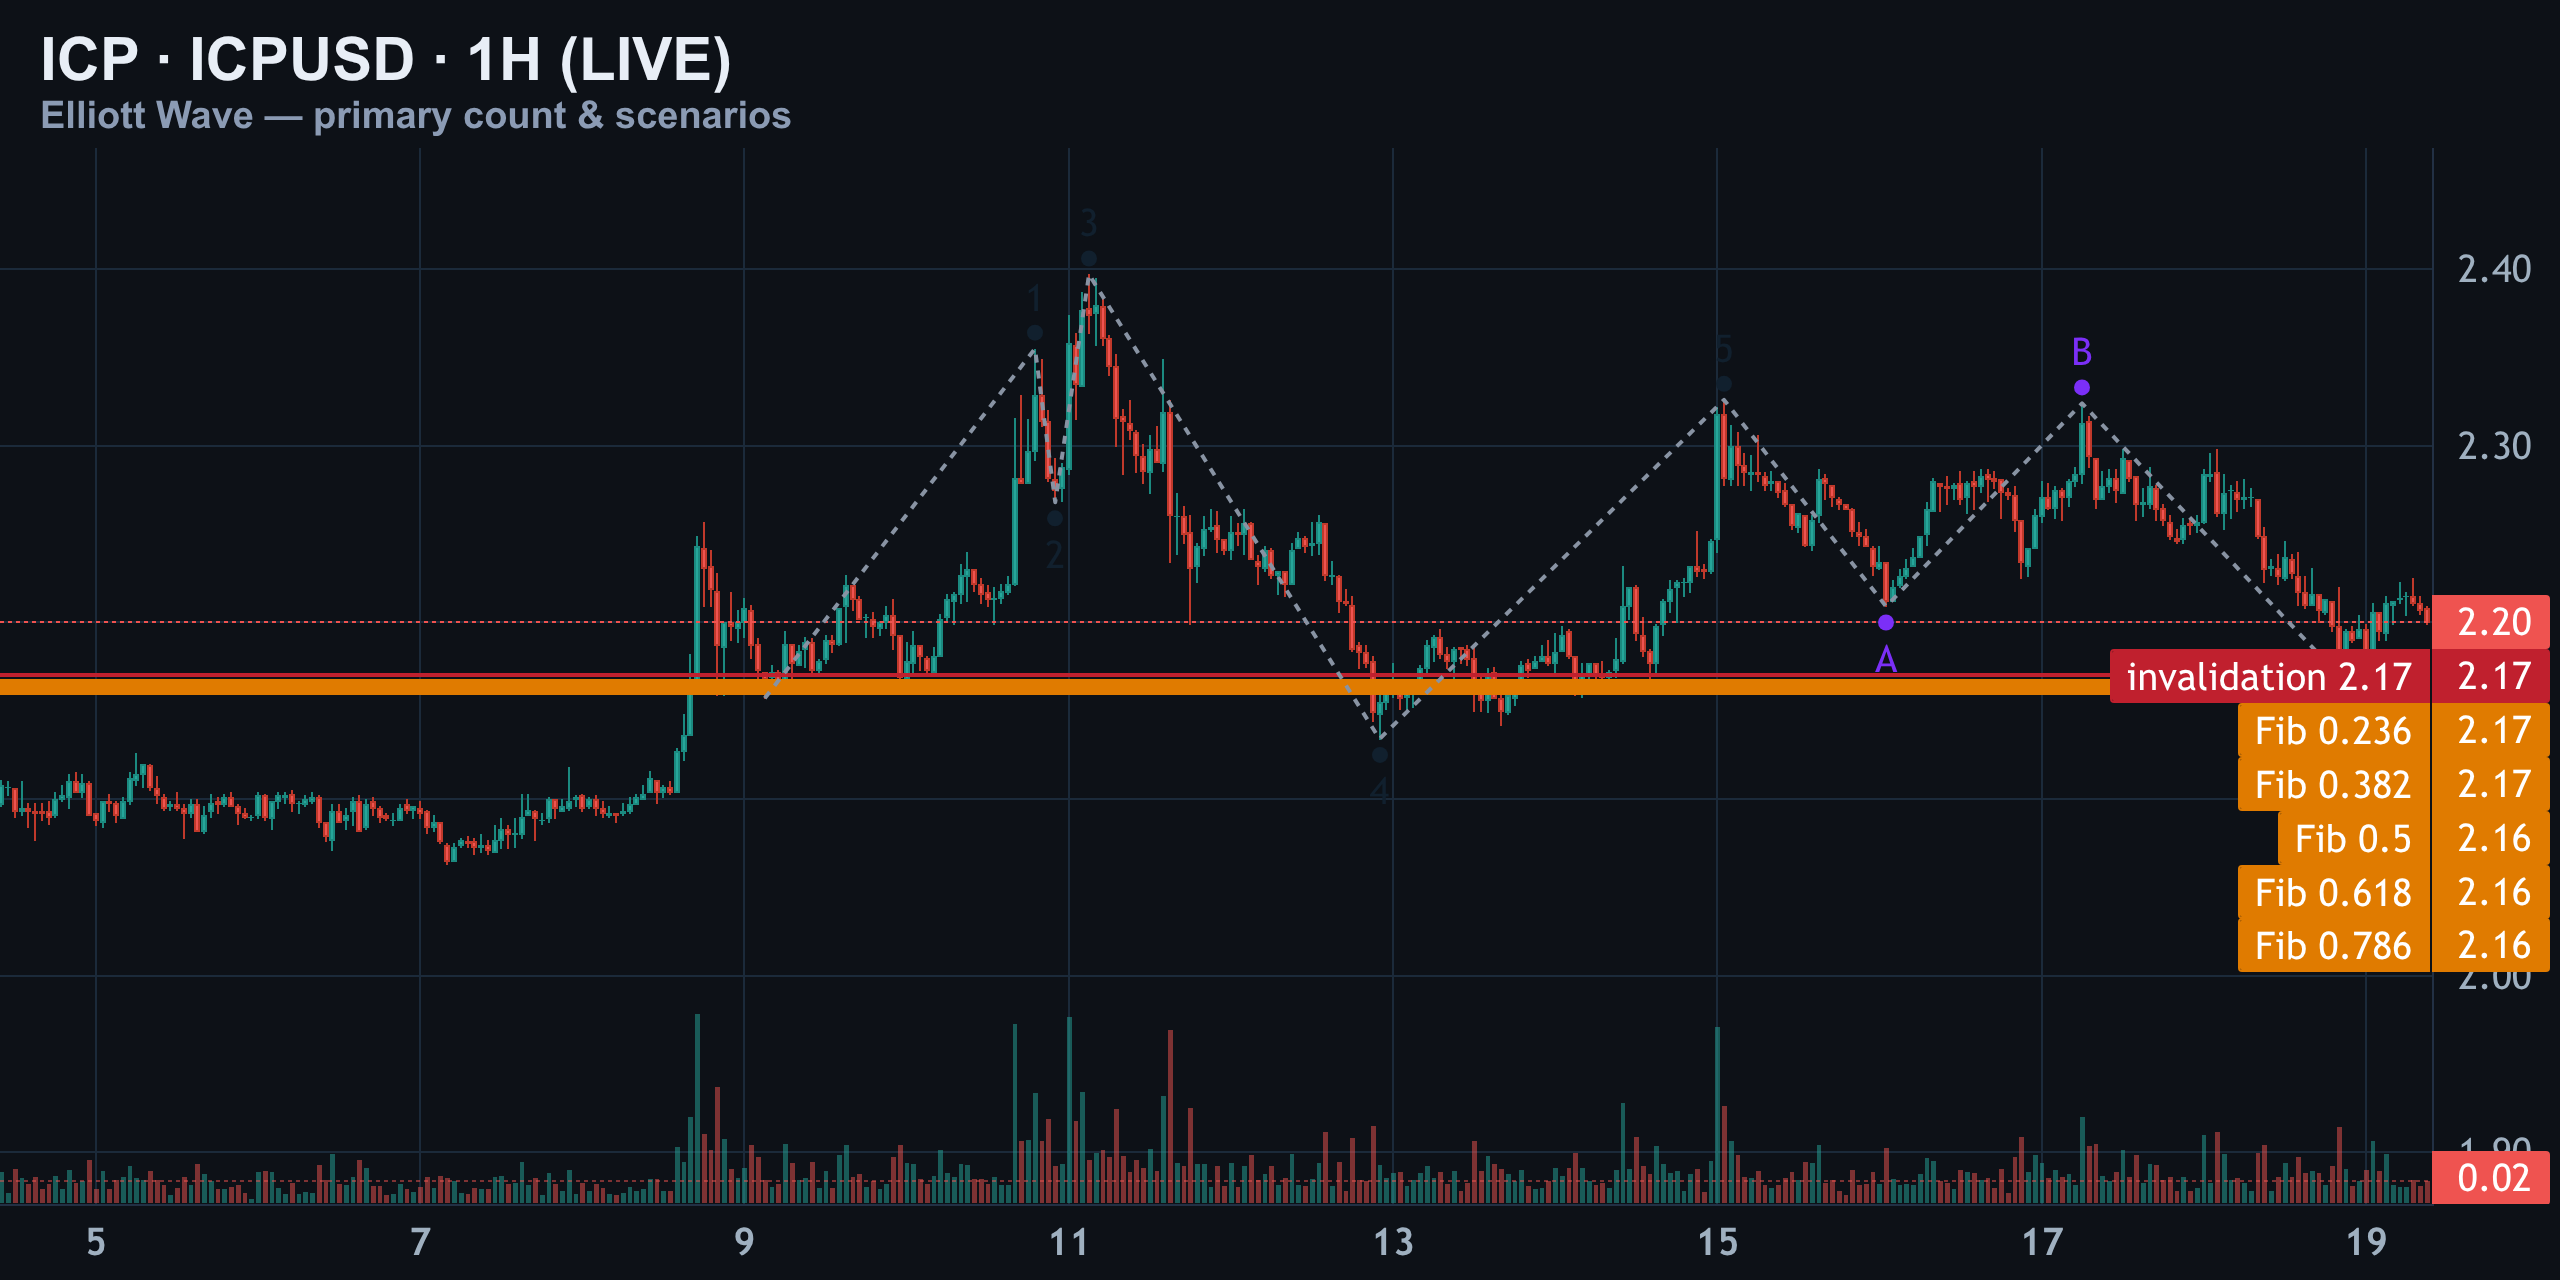
From that $2.33 high, we get an A-wave down to $2.21, a B-wave bounce back up to $2.32 — rejected again at the same shelf — and now a C-wave pressing toward $2.17. That's the primary count: wave C still unfolding, targeting the $2.16 to $2.10 zone below.
The alternate scenario
If price reclaims and holds above $2.33 — the same level that's rejected price twice now — the entire bearish reading breaks. A reclaim there means we're not in a C-wave down, we're building a fresh impulsive leg, with the next stop being a retest of the $2.40 high and room to extend beyond it.
| Scenario | Trigger | Target |
|---|---|---|
| Primary (bearish) | Rejection continues at $2.33 | $2.16 → $2.10 |
| Alternate (bullish) | Confirmed reclaim/hold above $2.33 | Retest of $2.40, extension beyond |
15M — Entry Trigger: Local Structure Inside the Bounce
Drop to the fifteen-minute chart for timing. This is the micro structure inside the bigger C-wave. We see a small one-through-five: wave one basing near $2.21, wave two popping to $2.29, wave three at $2.23, wave four spiking to $2.32, wave five settling at $2.25. Same story as the bigger frames — wave two retraces the full length of wave one, and wave three is the shortest leg. Not a clean impulse, another local exhaustion pattern.
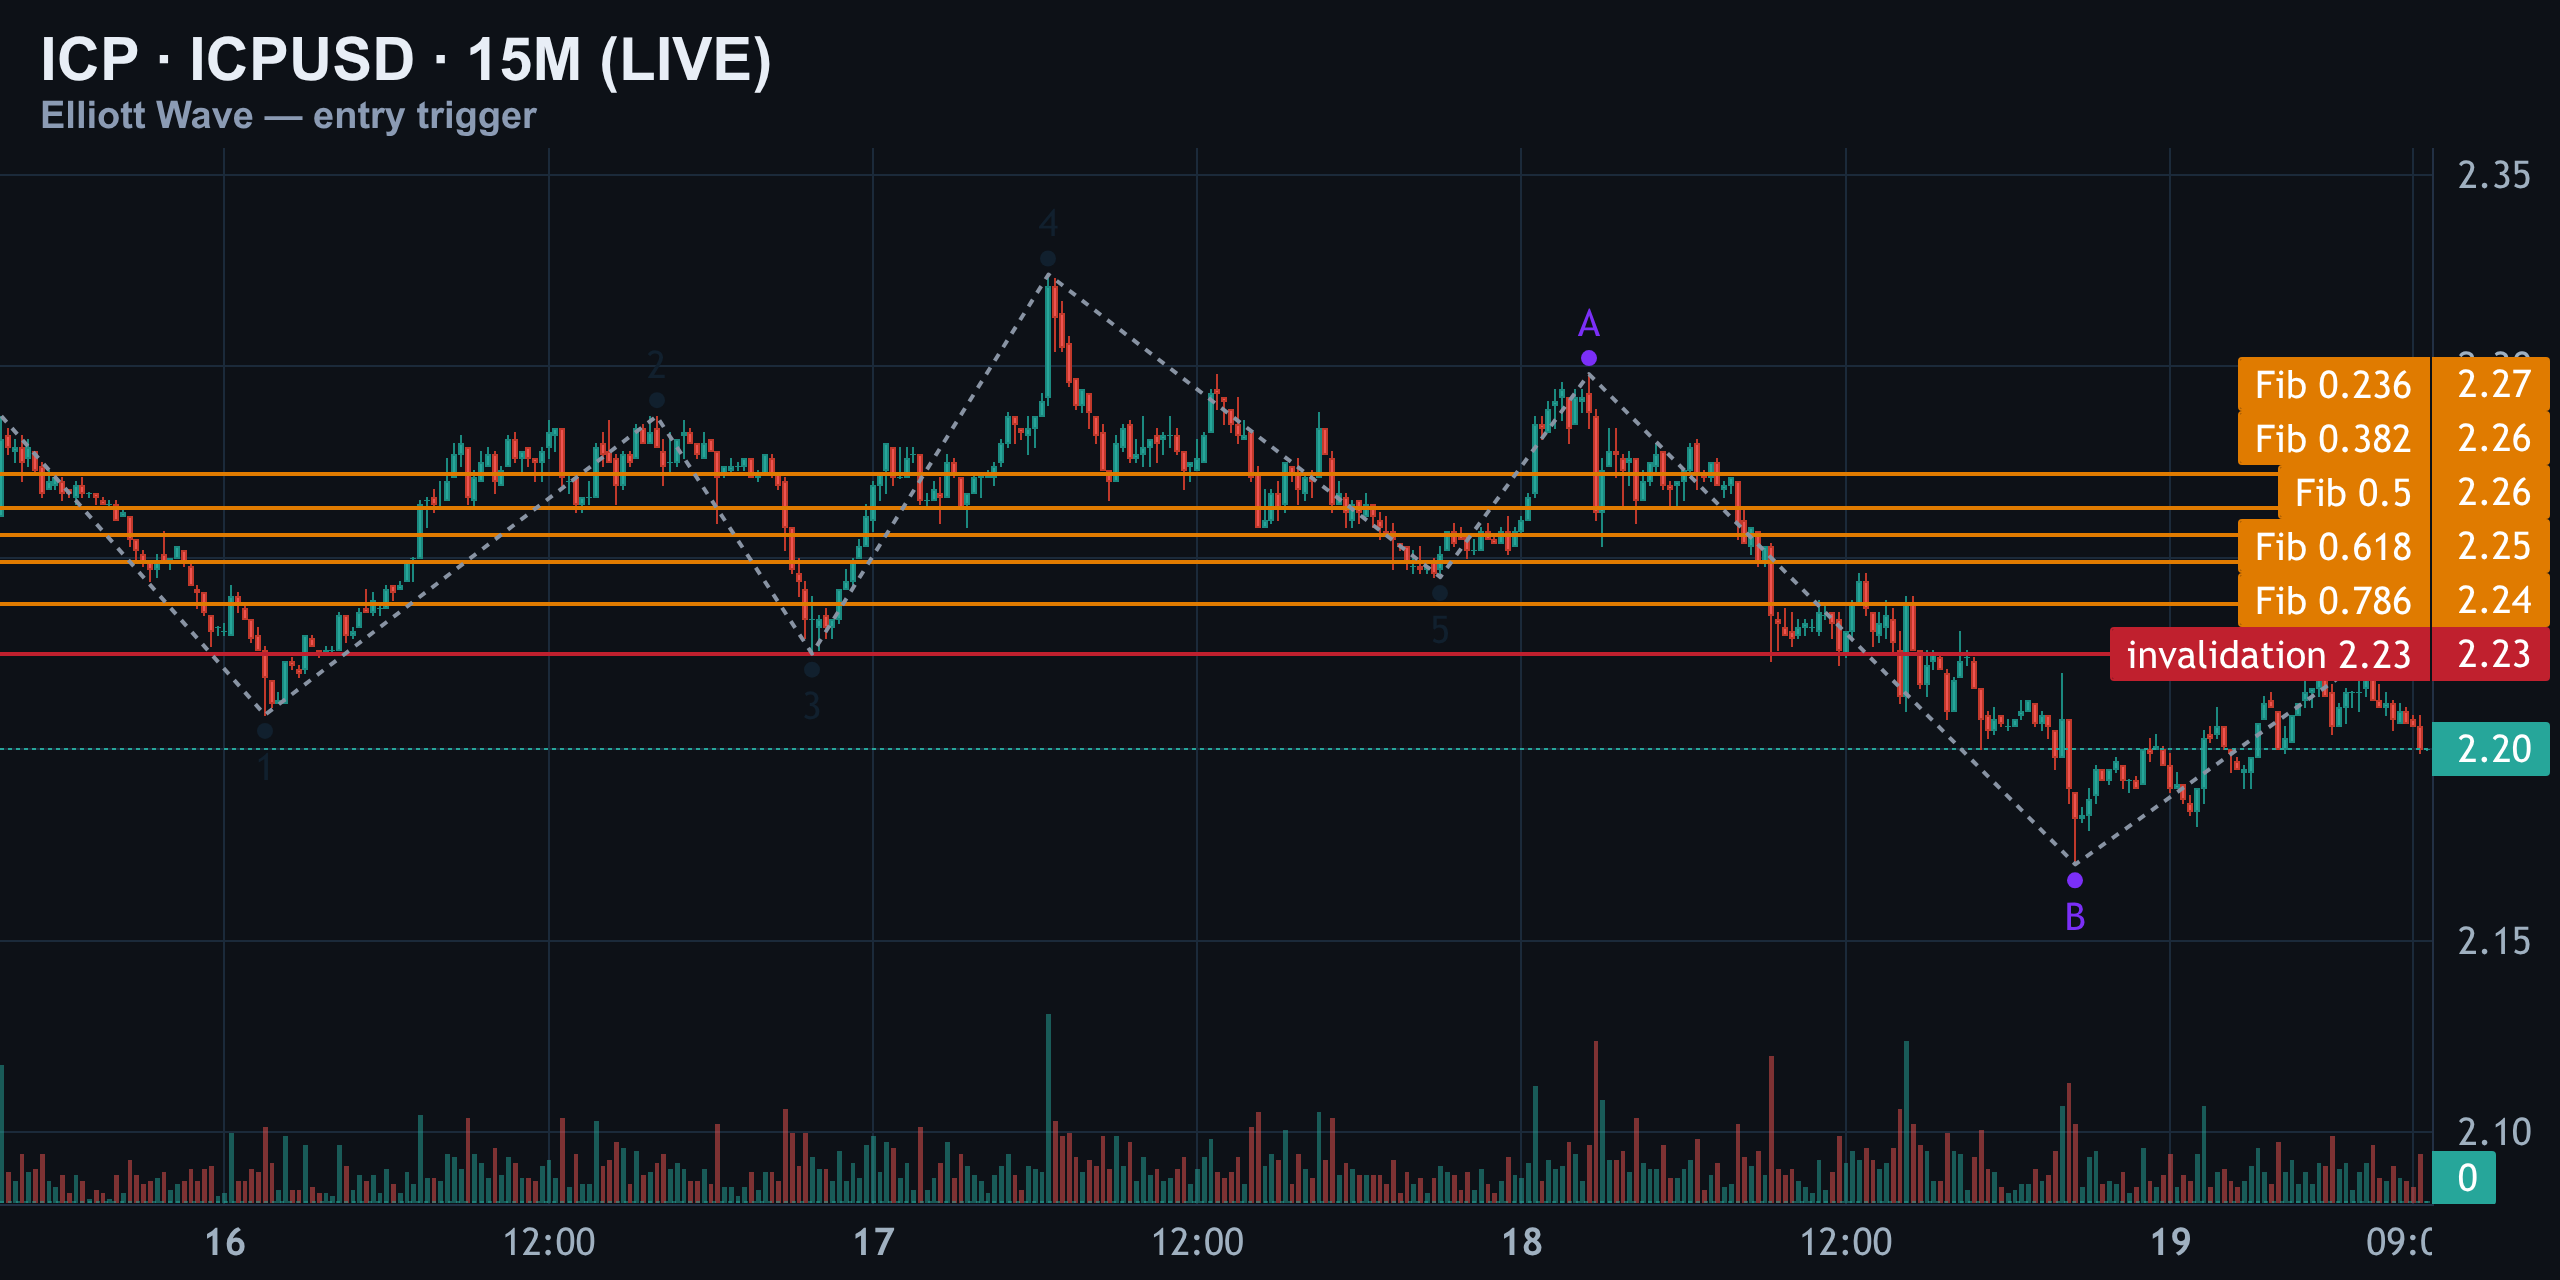
After that five, price rolled over into an A-wave at $2.30, dropped hard into a B-wave low at $2.17 — right on our invalidation shelf — then bounced into a C-wave at $2.23. The flag worth noting: that B-wave is more than double the size of the A-wave, a 2.42 ratio. That's well beyond normal proportion and pushes this into expanded-flat or irregular-correction territory. It tells you the $2.17 low wasn't calm — it was a shakeout, a liquidity grab before the bounce.
Right now price sits around $2.20, having failed to hold above $2.23. As long as that level caps the bounces, sellers stay in control and the path toward $2.17, then the bigger $2.16 target, stays open.
The Scenarios, Ranked
Putting the three timeframes together, here's how the paths stack up in order of probability given current structure and the confirmed rejection at $2.33.
| Rank | Scenario | Key Level | Target |
|---|---|---|---|
| 1 | Wave C continues lower | Reject below $2.23 | $2.16 → $2.10 |
| 2 | Local bounce, thesis intact | Hold below $2.33 | Retest $2.17 zone first |
| 3 | Bearish count invalidated | Reclaim + hold above $2.33 | Retest $2.40, extension |
Some independent forecast models are actually leaning toward the $2.25 area holding into the next session, which lines up with the alternate scenario staying on the table rather than being dismissed outright.
Structure vs Positioning — Do They Agree?
Wave counts are only half the picture. It helps to check whether broader price-prediction models and market trackers are leaning the same direction as the Elliott structure right now.
Several trackers show ICP trading in the $2.20–$2.25 band with modest daily declines, which is consistent with a market still digesting the rejection at $2.33 rather than one that's decisively broken out. Longer-range models covering the broader 2026 window put average expected prices in a wider $2.00–$2.86 range, which tells you the market hasn't picked a firm direction over the medium term — it's the shorter-term structure that's giving the cleaner signal right now.
Levels to Watch
Here's the full level map across all three timeframes, condensed into one reference table.
| Level | Price | Role |
|---|---|---|
| Invalidation (hard) | $2.33 | B-wave rejection zone, flips bearish → bullish if reclaimed |
| Local trigger | $2.235 | 15M close above = local leg may be over |
| Current price | ~$2.20 | Sitting below both trigger levels |
| First downside target | $2.17 | B-wave low / prior shakeout level |
| Primary target | $2.16 | Wave C completion zone |
| Extended target | $2.10 | Fib shelf, deeper C-wave completion |
| Bullish alt target | $2.40 | Prior swing high, retest if $2.33 reclaimed |
Setup Per the Count (Not Advice)
This section reflects what the wave count implies structurally — it is analysis, not financial advice, and shouldn't be treated as a trade recommendation.
- Bearish continuation bias remains valid as long as price stays capped below $2.33.
- A 15-minute close above $2.235 would be the first warning that the local C-wave leg inside the bounce is losing steam.
- A confirmed reclaim and hold above $2.33 invalidates the bearish wave C count entirely and opens the door to a retest of $2.40.
- Downside targets stack at $2.17, then $2.16, with $2.10 as the deeper fib shelf if selling pressure extends.
The setup is straightforward in structure but the timing is the hard part — that's exactly why the 15-minute chart exists as the entry trigger window while the 4H and 1H charts carry the higher-degree thesis.
Where Every Coin Sits in Its Count
ICP isn't trading in isolation — it's part of a broader market backdrop where several large-cap alts have been showing similar corrective, capped structures rather than clean fresh impulses. The rejection pattern at a well-defined resistance shelf, followed by a grind lower, is a recurring theme across multiple charts this week, which is part of why the $2.33 rejection on ICP carries extra weight rather than looking like a one-off. Live price data continues to confirm ICP sitting in the $2.20 handle with negative daily momentum, keeping the corrective bias in play.
Summary
ICP called the $2.33 wall two days ago, said wave C was targeting $2.27, and price blew straight through both, tagging $2.17 before bouncing back to test that same $2.33 ceiling — and getting rejected again. The invalidation held. The count is alive. Structure across 4H, 1H, and 15M all point to a corrective, capped setup with wave C still eyeing $2.16, and $2.10 beyond that.
The entire bearish thesis hinges on one number: $2.33. Below it, wave C keeps unfolding lower. Above it — reclaimed and held — this flips into a fresh impulsive leg targeting a retest of $2.40. Until that flip happens, the bias stays down, and $2.16 remains the level to watch next.
Previous days
08/17/2026 — ICP Elliott Wave: $2.33 Wall Holds, Wave C Verdict at $2.27
ICP Elliott Wave: $2.33 Wall Holds, Wave C Verdict at $2.27
Accountability Check: The $2.33 Wall Holds Again
Yesterday's call on ICP was simple: $2.33 is the line in the sand. If price closes above it and holds, the bearish Elliott Wave case dies. If it fails there, the corrective drop toward $2.16, $2.10 and $2.04 stays alive. Twenty-four hours later, the wall held perfectly — ICP crept up roughly 0.4%, from $2.271 to $2.281, staying entirely inside the same tight range.
As of today, August 17, ICP is changing hands around $2.27, up modestly on the day but still boxed inside the same corrective range that's defined the last week of price action.
Some third-party forecast models are already flagging a similar near-term floor: one widely cited price model puts ICP's August low around $2.16, which lines up almost exactly with our first downside target from the higher-degree count.
4H View — A Corrective Machine, Not an Impulse
Zoom out to the 4-hour chart and the automated wave count wants to label the move off the lows as a clean five-wave impulse: Wave 1 up to $2.31, Wave 2 down to $2.10, Wave 3 up to $2.25, Wave 4 down to $1.99, Wave 5 up to $2.40. It reads well until you check it against Elliott Wave rules — and it fails on two of them at once.
- Wave 2 retraces more than 3x the length of Wave 1 — a full round-trip and then some, which is never allowed in a valid impulse.
- Wave 4 drops back into Wave 1's price territory near $1.99 — a direct overlap, also forbidden in a standard five-wave move.
Two structural violations in one count means the impulse label is off the table entirely. What's actually printed here is a larger corrective structure — most likely a flat or a double corrective, not a trending five-wave advance.
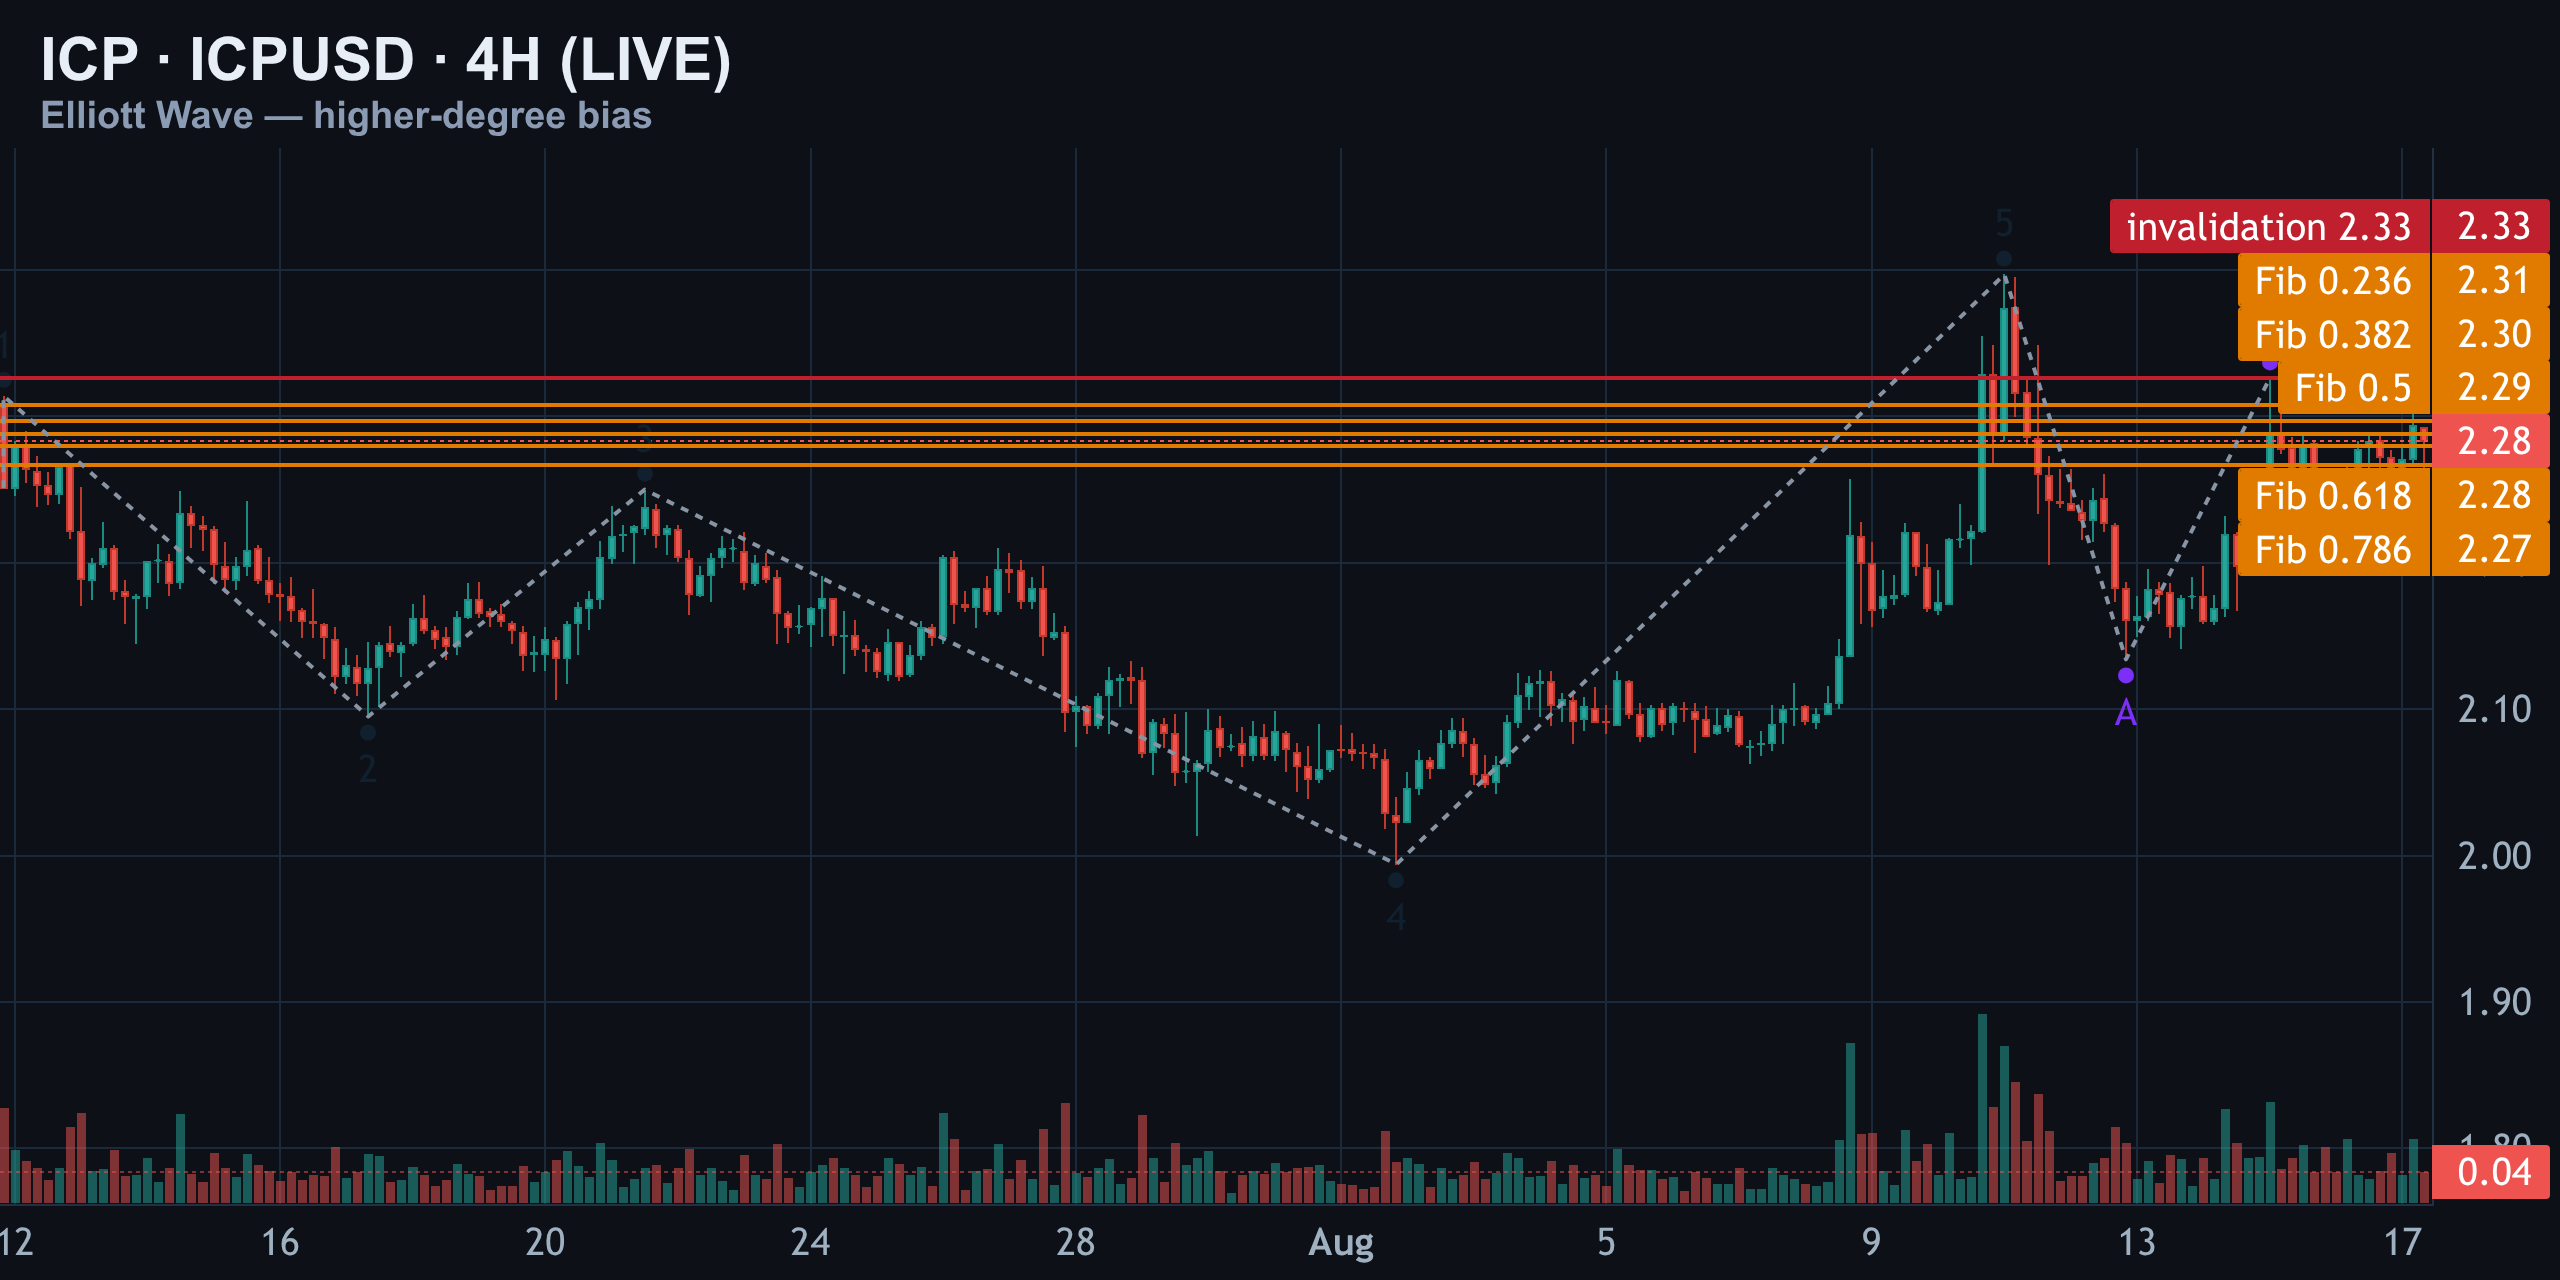
Strip away the mislabeled internal waves and look at the skeleton instead: high at $2.31, low at $1.99, high at $2.40. That's the real shape of this move — one broad arc up, now fading. Since the $2.40 top, price has traced Wave A down to $2.13, Wave B up to $2.33 (straight into that resistance wall), and the market is now deciding whether Wave C is ready to run.
1H View — Primary Count vs the Alternate
The 1-hour chart is where the real decision plays out. The primary count picks up after the five-wave-looking drop to $2.13: Wave A rallies to $2.33, Wave B pulls back to $2.21, and Wave C is now stalling right at $2.32 — just under that same resistance shelf.
| Wave | Price | Note |
|---|---|---|
| Prior low | $2.13 | Start of the A-wave rally |
| Wave A | $2.33 | Rejected at the wall |
| Wave B | $2.21 | Retracement leg |
| Wave C (current) | $2.32 | Fails to clear the A-wave high |
The tell here is in the ratios: Wave C measures 0.60x Wave A, almost identical to Wave B's 0.61x retracement of the prior move. That kind of symmetry, combined with a C-wave that can't clear the A-wave high, is the signature of an exhausted bounce — not the start of a fresh impulse.
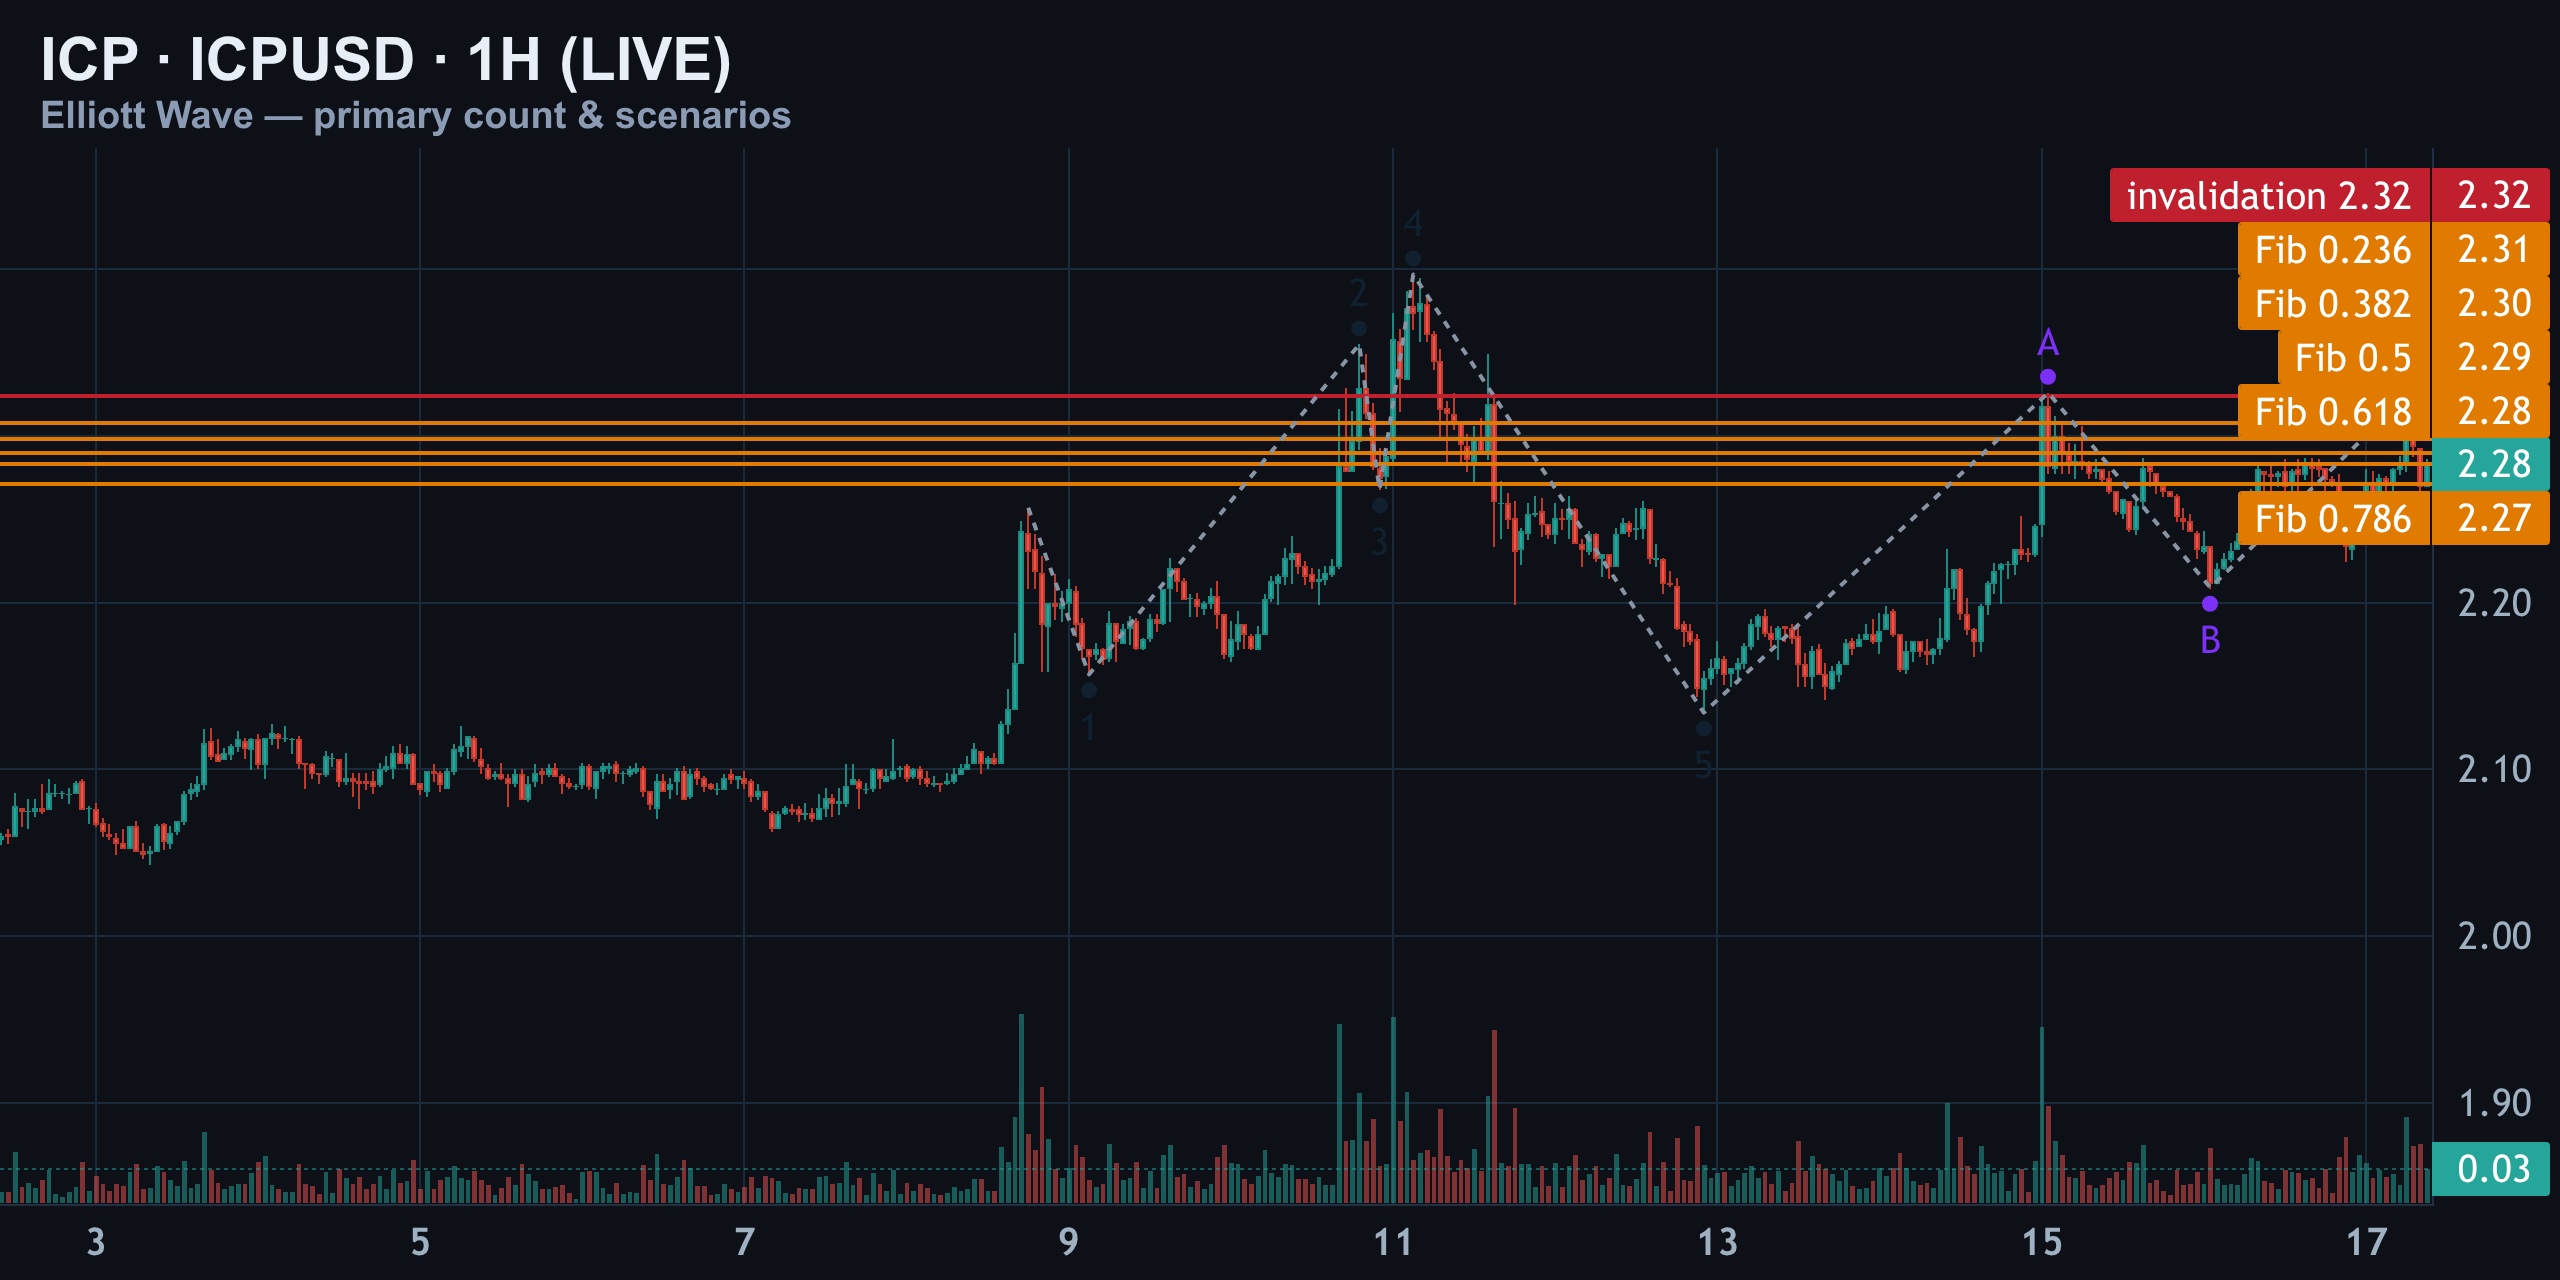
Two paths, one level
Scenario one (primary): confirmation arrives if ICP breaks back below $2.27. That reopens the door to $2.16 and lower, keeping the bearish target ladder alive.
Scenario two (alternate): forget the labels — if ICP closes above $2.33 and holds it on a retest, the bearish read is dead. That flips the structure into an impulsive continuation, with the next magnet being the recent $2.40 high, and room to run further if buyers show up in size.
15M View — The Expanded Flat and the $2.27 Trigger
This is the chart that matters most today. After Wave 5 bottomed near $2.29, ICP traced a textbook corrective sequence: Wave A down to $2.23, then Wave B ripped all the way up to $2.32 — a 1.6x extension of Wave A, well beyond a normal bounce and squarely in expanded-flat territory.
Wave C then came down and almost perfectly mirrored Wave A, landing at $2.27 — 0.95x the length of the A-leg. B overshoots, C matches: that's about as clean an expanded flat as this chart gets, and it prints exactly at today's invalidation line.
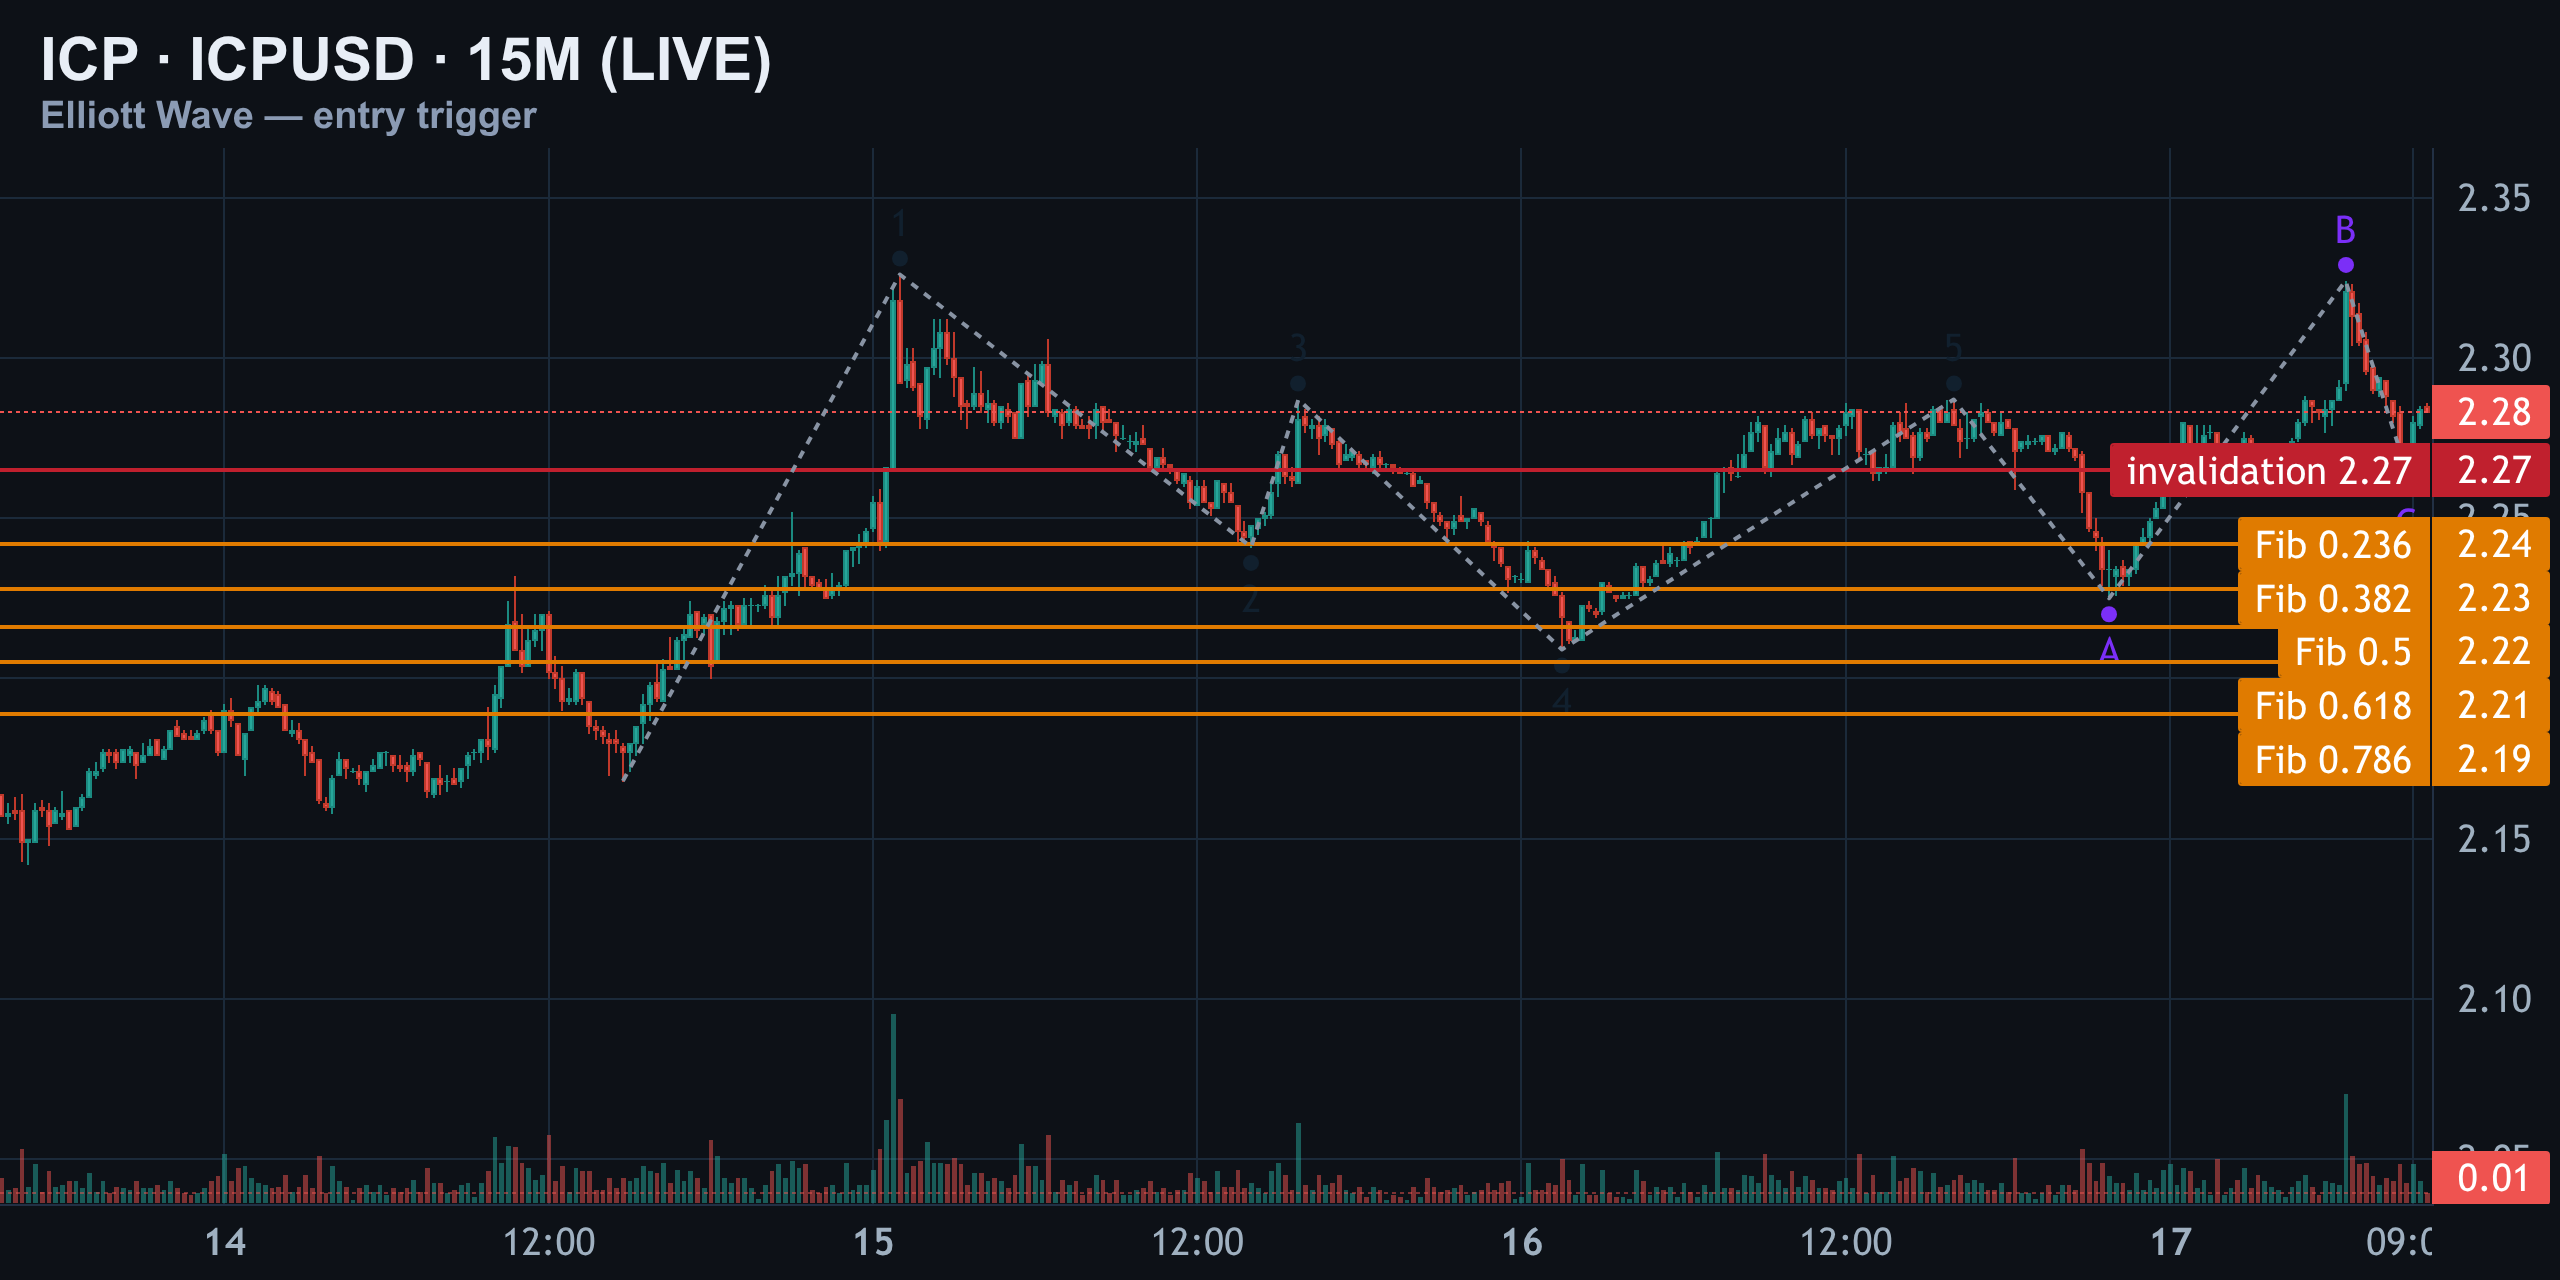
| Sub-wave | Price | Ratio |
|---|---|---|
| Wave A | $2.23 | Base leg |
| Wave B | $2.32 | 1.6x Wave A |
| Wave C | $2.27 | 0.95x Wave A |
For an entry, the zone to watch is any bounce back into the $2.29–$2.31 pocket, where the 0.5 and 0.382 Fibonacci retracements stack up — that's the spot to lean short if the higher-degree bearish case is correct. A clean break and close below $2.27, on the other hand, is the green light that Wave C on the bigger chart is finally moving, not stalling.
Positioning, Liquidations & Order Flow
Structure is only half the picture — positioning tells you whether the crowd agrees or is set up to be squeezed. Recent 24-hour volume on ICP has held steady in the $20–30 million range, with price action compressing tighter as the $2.27–$2.33 range gets tested repeatedly.
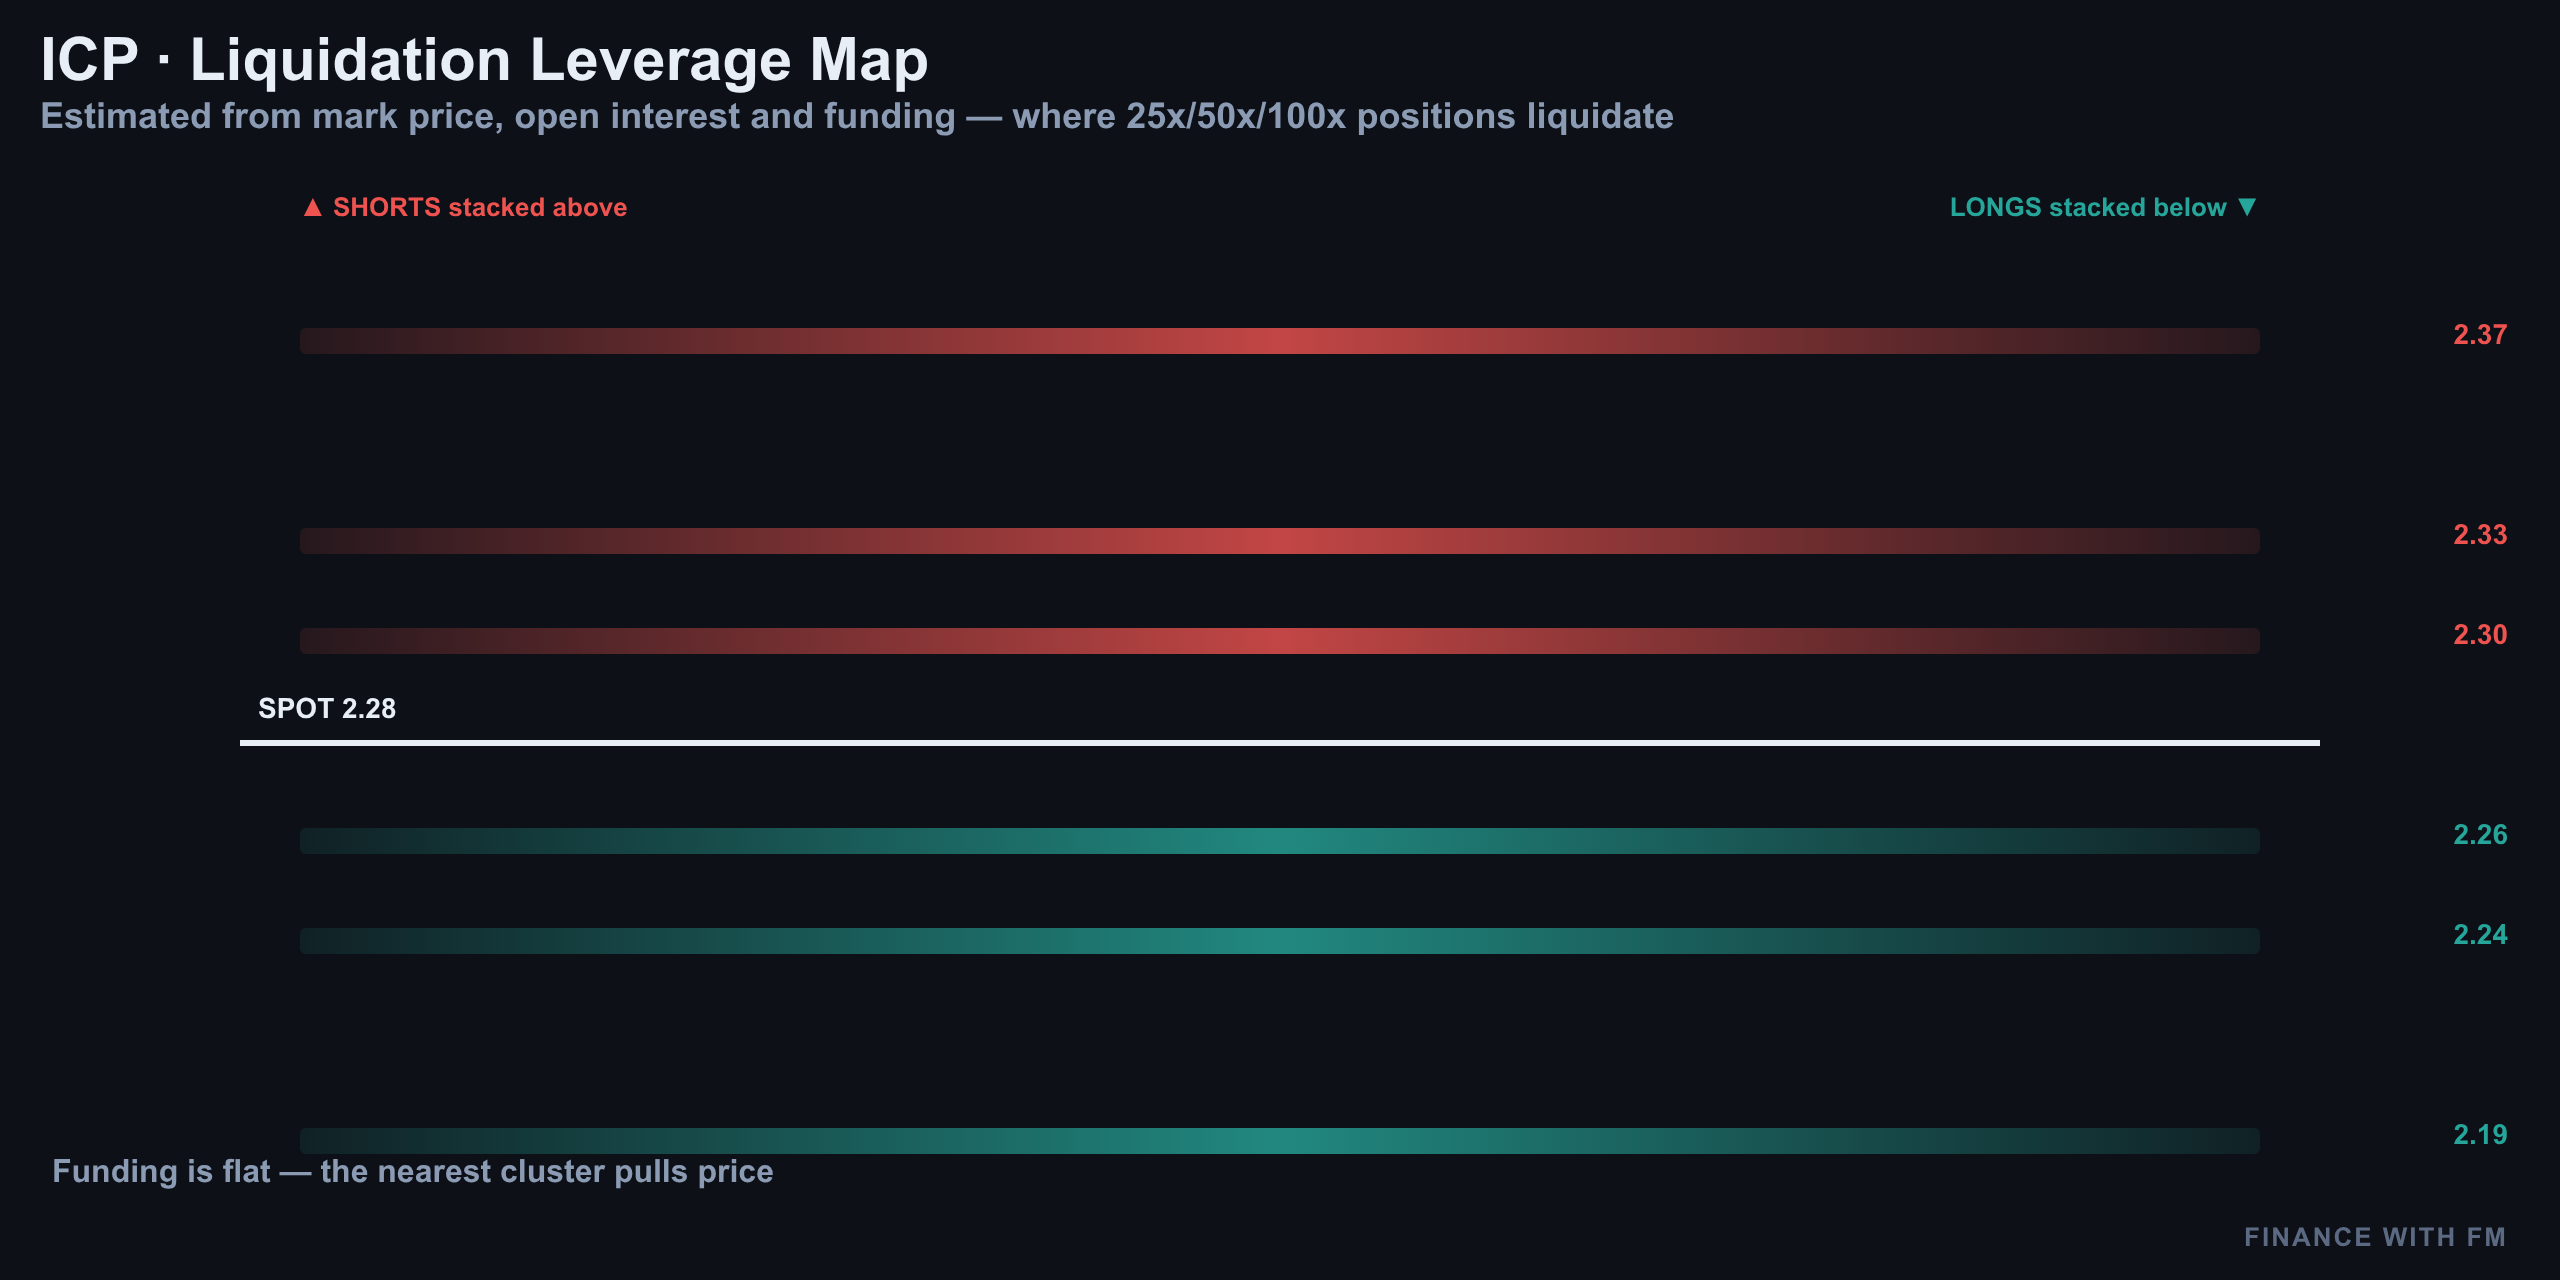
The liquidation map shows a meaningful cluster of leveraged long positions sitting just below $2.27. If that level breaks and closes, those longs get forced out, adding fuel to a move toward $2.21 and then the deeper $2.16 target. Above $2.33, the liquidation density thins out noticeably — which is exactly why a genuine breakout there tends to run fast, since there's less resistance from trapped short positions once the wall is cleared.
Structure vs Positioning — Do They Agree?
Right now, yes — mostly. The Elliott Wave structure across all three timeframes points to an exhausted bounce capped at $2.33, and the positioning data backs that up: longs are stacked below current price, meaning any slip under $2.27 has real fuel behind it, not just chart geometry.
- Structure says: Wave C is stalling, symmetry between B and C legs suggests exhaustion, invalidation sits cleanly at $2.33.
- Positioning says: long liquidations cluster just below $2.27, thin resistance above $2.33 — a break either direction likely moves fast.
- Agreement: both point to $2.27 and $2.33 as the two levels that actually matter this week.
Levels to Watch & The Setup
| Level | Price | Significance |
|---|---|---|
| Key resistance / invalidation | $2.33 | Wave B / A high — bearish case dies above here |
| Entry pocket (short bias) | $2.29 – $2.31 | 0.5 / 0.382 Fib confluence |
| Trigger / current price | $2.27 | 15M expanded-flat completion, today's pivot |
| First downside target | $2.21 | 1H Wave B low |
| Second downside target | $2.16 | Ladder target #1 |
| Third downside target | $2.10 | Ladder target #2 |
| Fourth downside target | $2.04 | Ladder target #3 |
| Bullish invalidation flip target | $2.40 | Prior swing high, next magnet if $2.33 reclaims as support |
Setup per the count (not advice): a short bias only makes sense on a bounce into the $2.29–$2.31 pocket followed by rejection, or on a clean close below $2.27 confirming Wave C has resumed. Either trigger targets the $2.21 → $2.16 → $2.10 → $2.04 ladder. The setup is invalidated the moment $2.33 flips from resistance to support on a retest — at that point the count flips bullish toward $2.40.
Summary: Wave C Verdict Still Pending
The $2.33 wall has now held twice in a row, and the higher-degree structure remains a corrective sequence, not an impulse — the two rule violations on the 4H chart (Wave 2 overshoot, Wave 4 overlap) make that call unambiguous. The 1-hour chart shows a Wave C that can't clear its own A-wave high, and the 15-minute chart just delivered a clean expanded flat that lands exactly on today's key trigger.
Everything now funnels through one number: $2.27. Lose it on a closing basis and the $2.21 → $2.16 → $2.10 → $2.04 ladder is back in play. Hold it, and reclaim $2.33 as support, and the entire bearish read gets scrapped in favor of a run at $2.40 and beyond. ICP is currently pinned right between those two levels, and where it settles by the next 4-hour close will likely decide which count survives the week.
08/16/2026 — ICP $2.33 Wall Holds: Elliott Wave C-Wave Verdict at $2.31
ICP $2.33 Wall Holds: Elliott Wave C-Wave Verdict at $2.31
ICP's $2.33 Wall Held — Now the C-Wave Verdict at $2.31
Yesterday we drew a line at $2.33 and said that if ICP couldn't close above it, the bears would keep control. It didn't. Price got rejected right at the wall again and is now sitting near $2.27, with live quotes showing ICP trading around $2.23–$2.30 depending on the venue at the time of writing.
Here's the twist that makes this level worth watching closely: top traders on major derivatives exchanges are reportedly net long roughly five-to-one, while a wall of sell orders sits stacked right at $2.31. Something has to give — and the Elliott Wave structure across three timeframes tells us which side is more likely to win.
4H — The Bigger Picture: A Flat, Not an Impulse
Zoom out to the four-hour chart and the story is simple: this is not a clean five-wave impulse. The auto-generated count tags wave 1 at $2.33, wave 2 crashing all the way to $2.10, wave 3 back up to $2.25, wave 4 diving to $1.99, and wave 5 spiking to $2.40. Run the Elliott Wave rules against that sequence and it falls apart immediately.
- Wave 2 retraced more than 3x the length of wave 1 — not a deep pullback, a full round-trip. That hard-breaks the wave-two rule.
- Wave 4 at $1.99 drops straight into wave-one territory, overlapping it completely — the second hard rule break.
- Two rule violations in one count means this isn't an impulse at all. It's corrective.
The far more coherent read is a higher-degree flat or double zigzag: a big A-wave down to $2.13, a B-wave rally that stretched all the way back to $2.40 and even briefly tagged $2.33, and now a C-wave attempting to complete the structure. That B-wave overshoot — rallying above where wave A started — is a textbook expanded flat signature, and it tells you this correction has more room to run before it's actually finished.
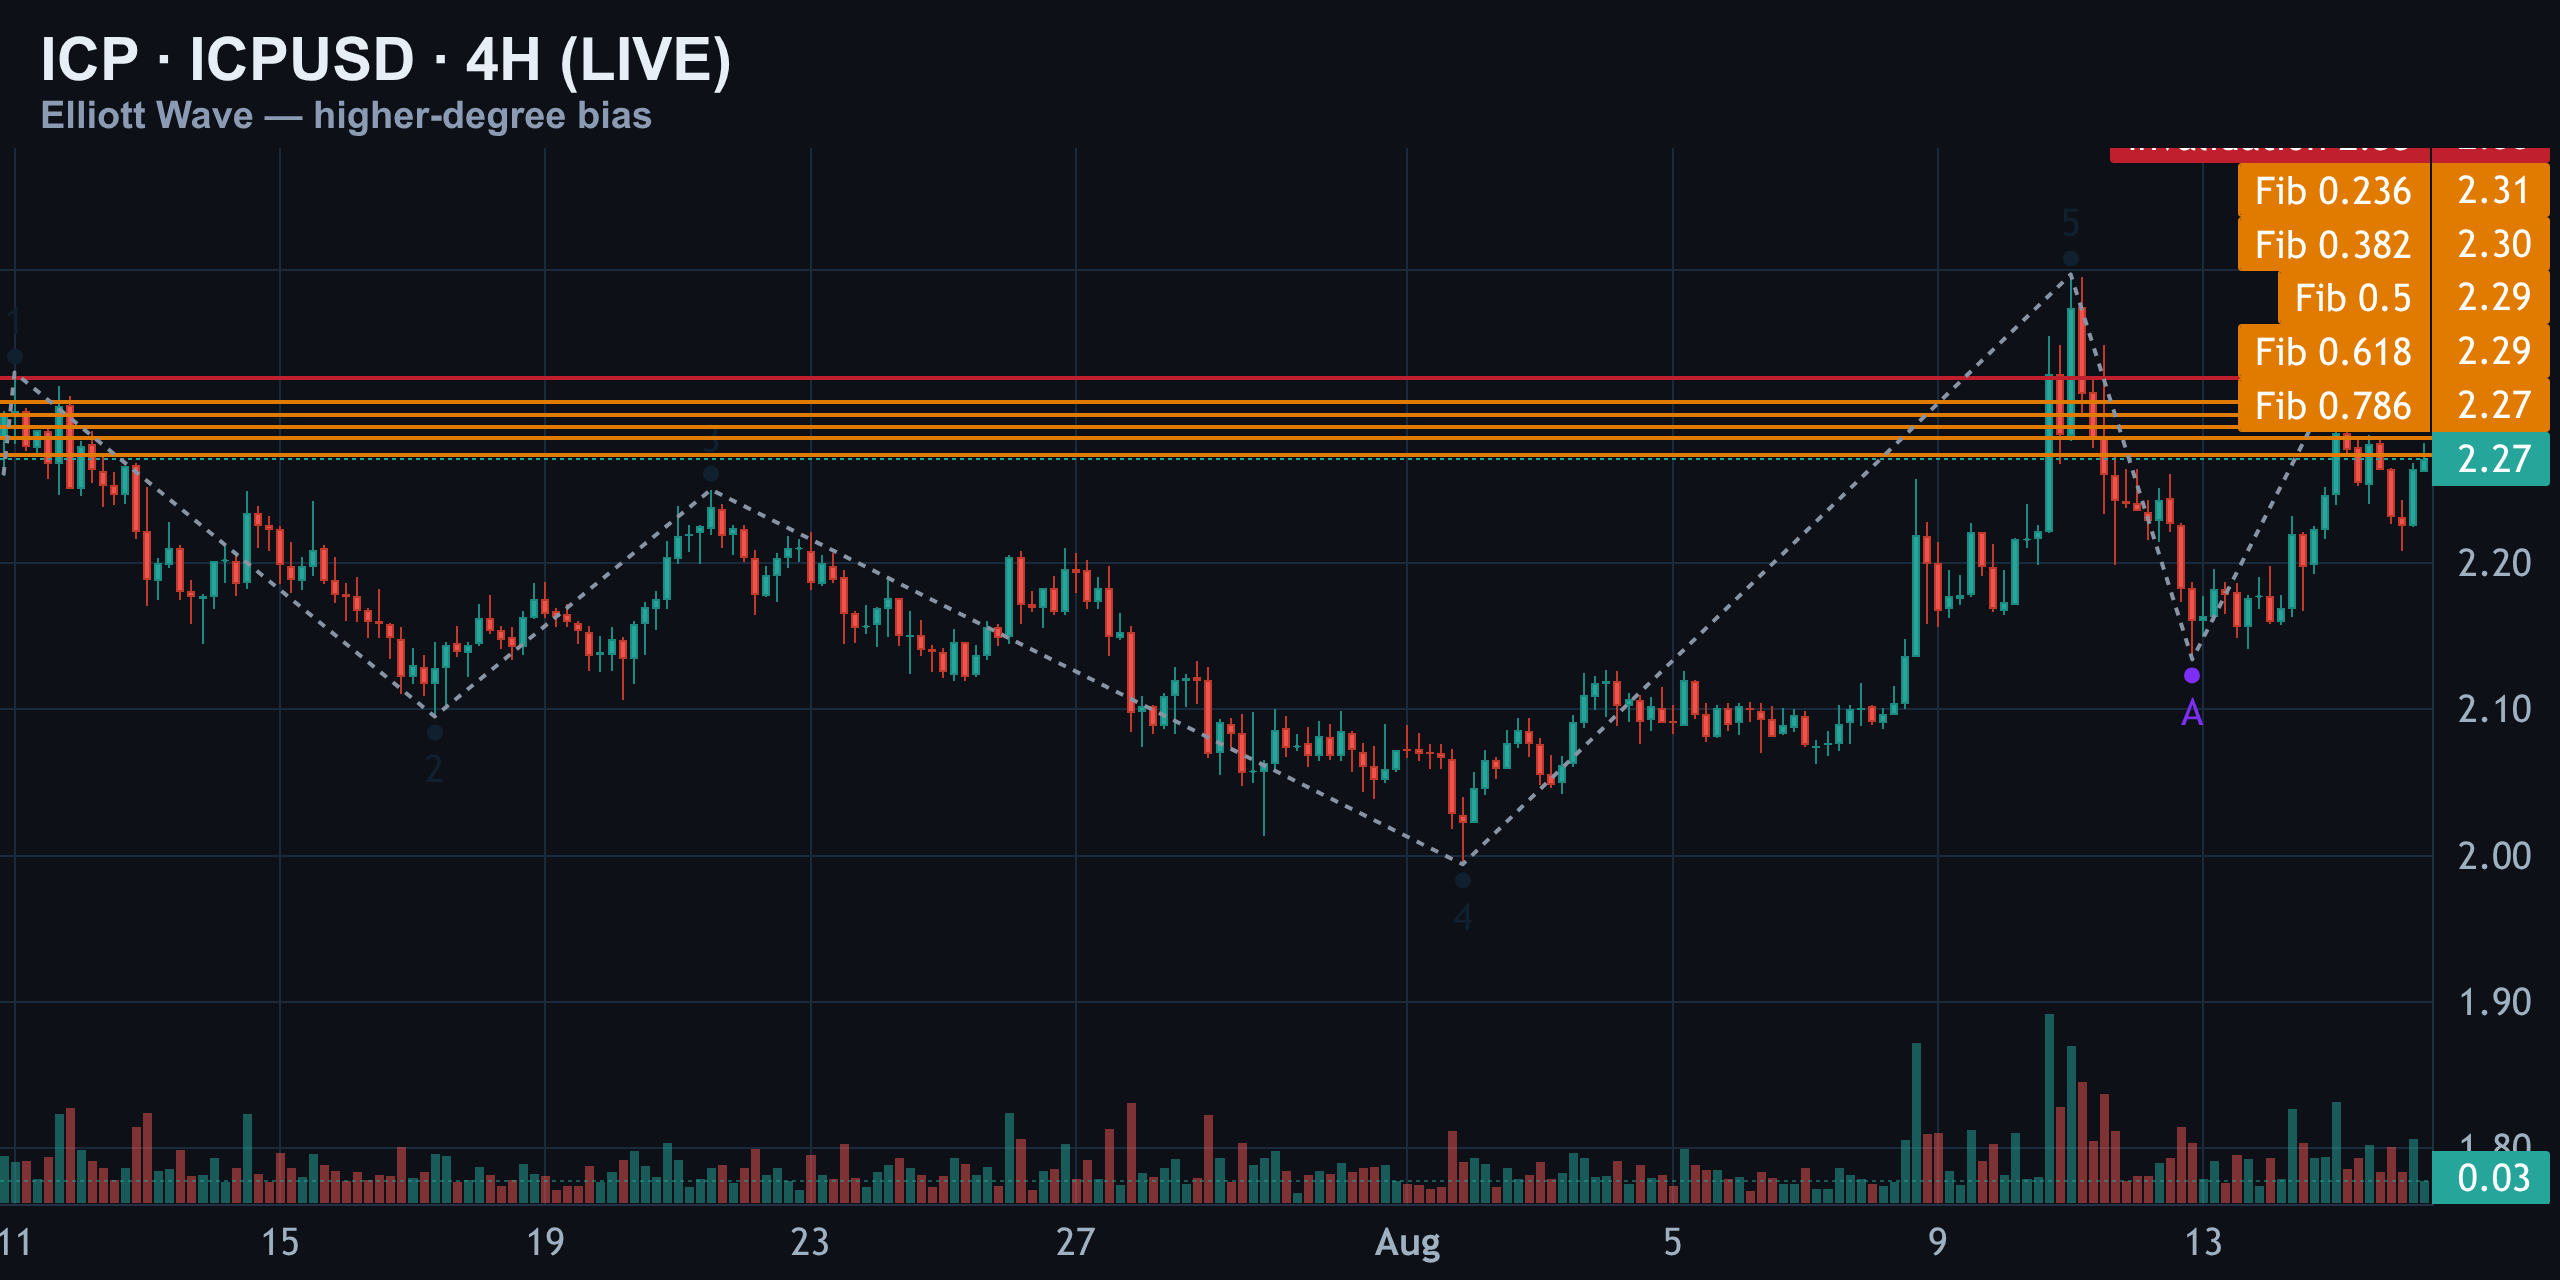
The higher-degree skeleton is straightforward: high at $2.33, low at $1.99, high at $2.40. Every swing since has been trying to carve out the final leg down. Price rejected the $2.33 zone again yesterday — exactly the ceiling this flat count needs to hold. As long as that level caps the rallies, the bigger picture stays bearish, and every bounce into resistance is a level to fade, not chase.
1H — Primary Count vs the Reclaim Scenario
On the one-hour chart, the picture sharpens considerably. Here the impulse actually holds up: wave 1 from $2.26, wave 2 down to $2.16 (a 0.38 retrace), wave 3 stretching to $2.35, wave 4 holding at $2.27 without overlapping wave 1, and wave 5 spiking to $2.40. No hard rules broken — this is a valid five-wave skeleton, though wave 3 came in a touch undersized relative to wave 1, a minor flag worth noting.
After the top at $2.40, the correction begins: wave A drops hard to $2.13, wave B rallies aggressively back to $2.33 — a strong, almost-equal-to-the-high B-wave, another classic sign of an expanded flat rather than a simple zigzag. From there, wave C should be unfolding lower right now, first probing $2.21.
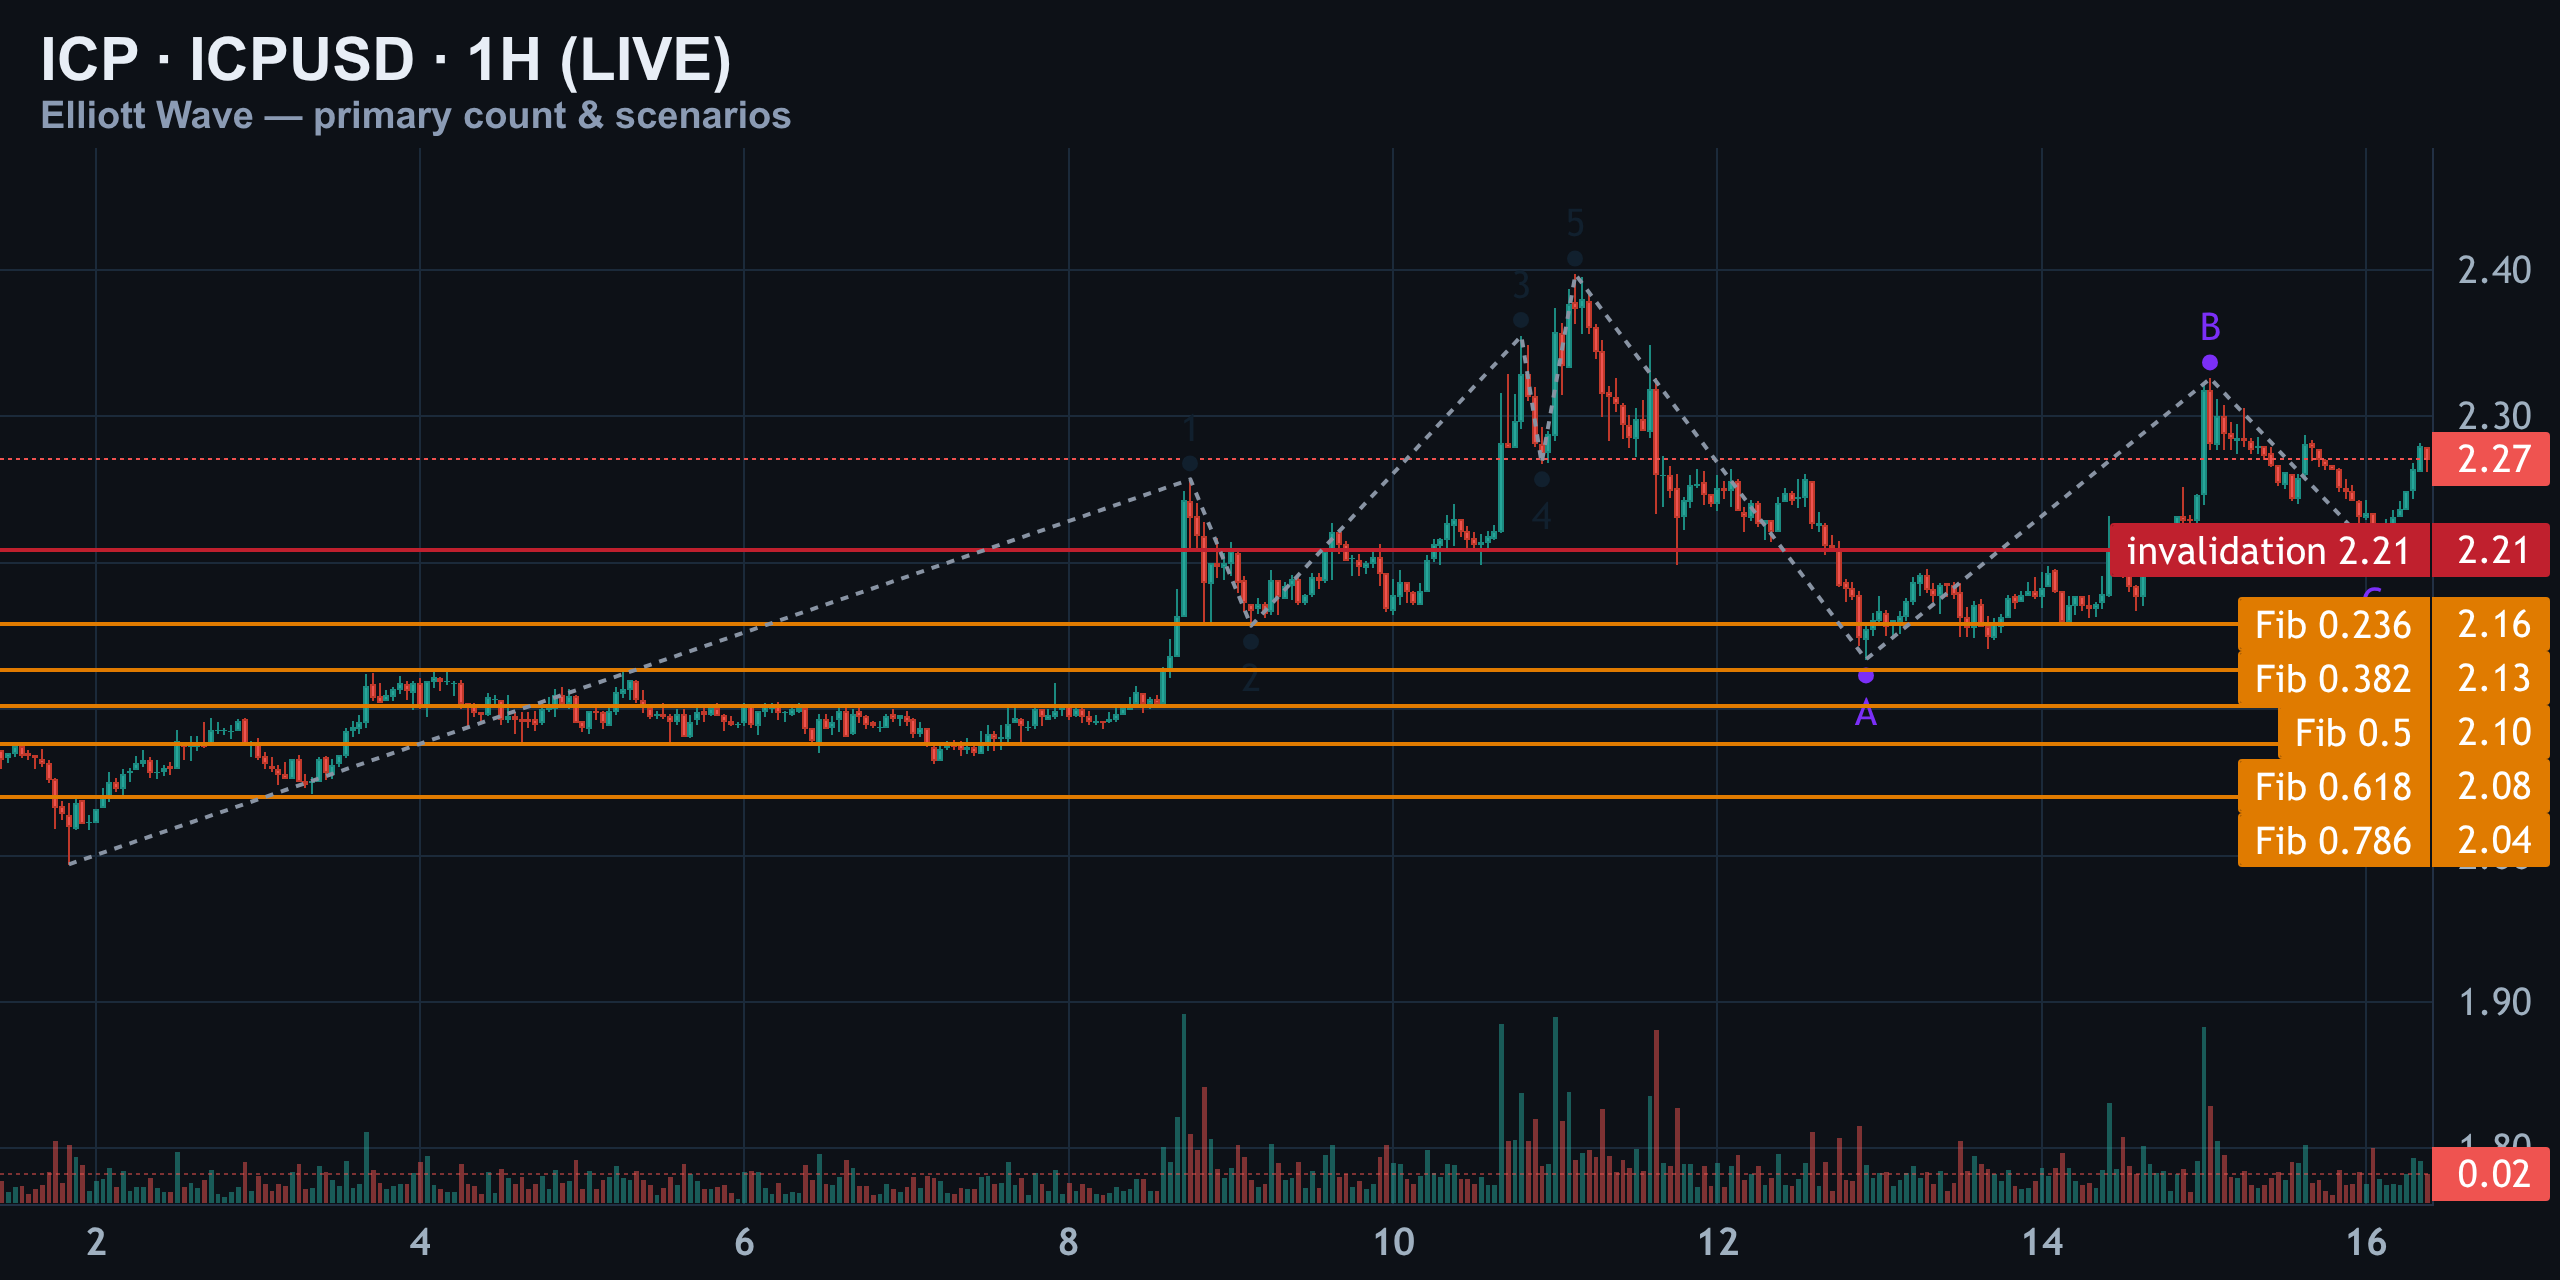
| Fib Level | Price Target |
|---|---|
| 0.50 | $2.16 |
| 0.618 | $2.13 |
| 0.786 (extended) | $2.10 – $2.08 |
| Deep extension | $2.04 |
The Alternate: A Bullish Reclaim
Clear the chart and look at the alternate. If price instead reclaims and holds above $2.33 on a close, the correction is over, wave C doesn't happen, and this becomes a fresh impulsive leg — a wave 3 of a larger degree pushing well beyond the $2.40 high. That's the bullish flip, but it needs a decisive close above $2.33, not just a wick.
A second, lower-probability alternate: price chops sideways between $2.21 and $2.33 for longer, building a triangle before either resolution. That would delay both counts but wouldn't change the ultimate direction once it breaks.
15M — Timing the Entry Under $2.28
Drop to the fifteen-minute chart and this is purely about timing. The auto count here also breaks the rules — wave 2 retraced more than 13x wave 1, and wave 4 overlaps wave 1 again — so don't treat this as a real impulse either.
What we're actually watching is a small ABC: wave A dropped to $2.21, and price is now inside a wave B bounce that's climbed back to $2.28, sitting right on the invalidation line for this local structure.
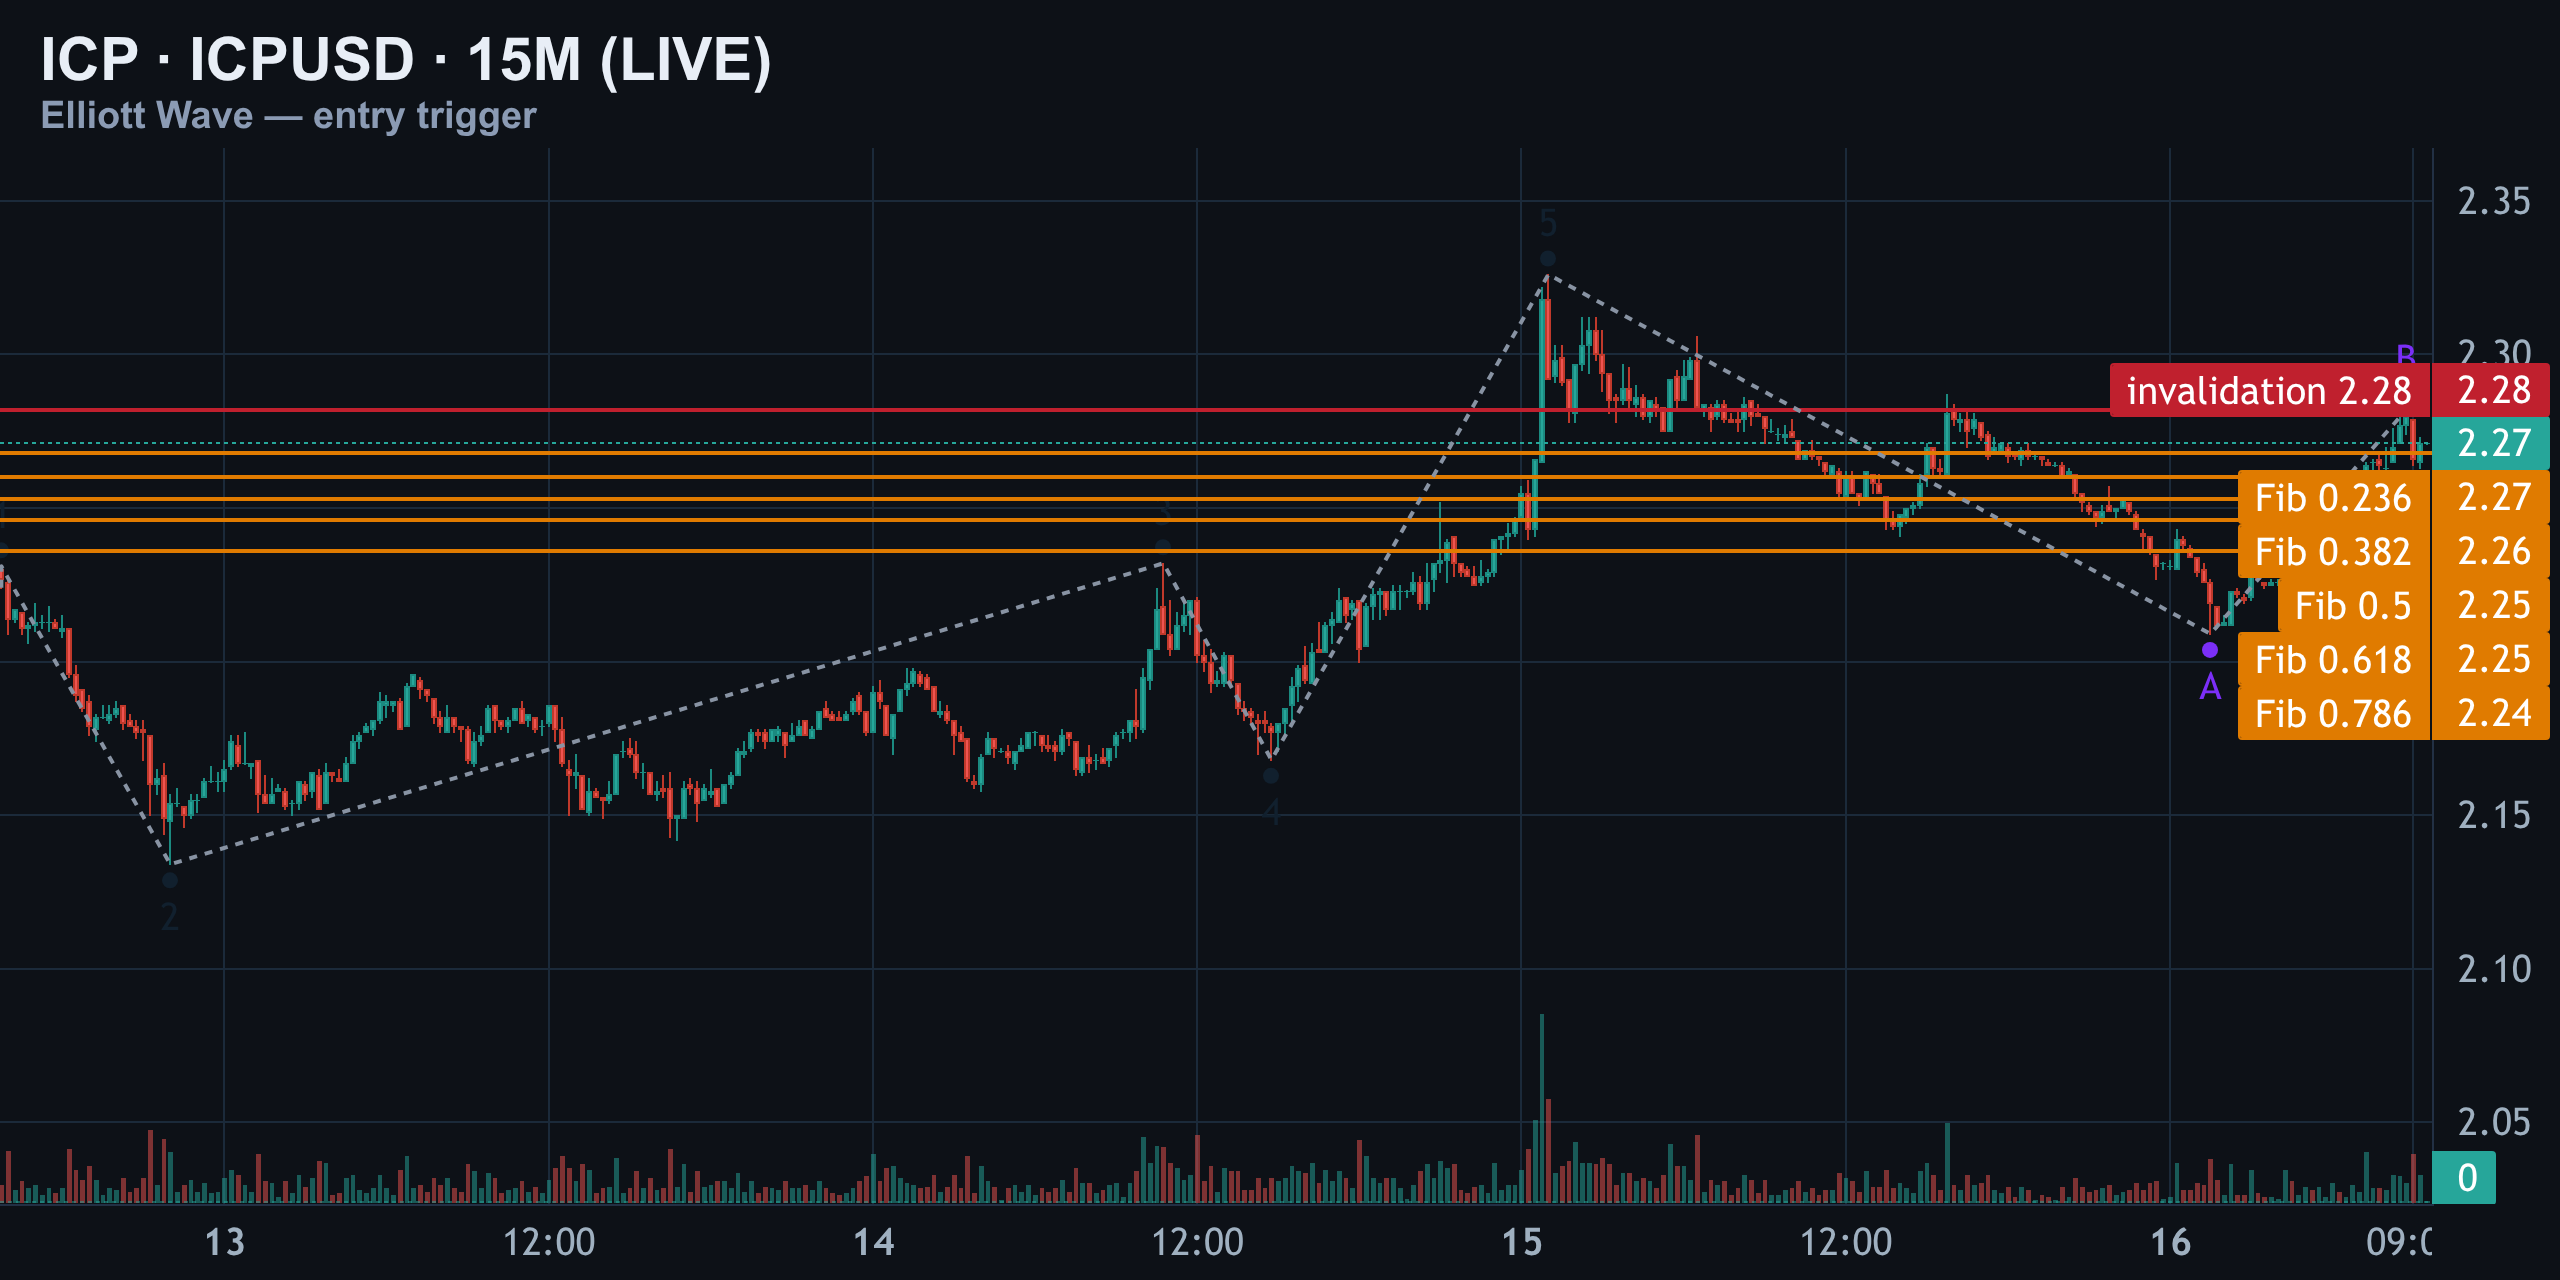
| Fib Level | Price |
|---|---|
| 0.236 | $2.27 |
| 0.382 | $2.26 |
| 0.786 | $2.24 |
That's the shallow retracement zone you'd expect from a B-wave inside a bigger downtrend — not a full reversal. This is the exact spot the entry needs to prove itself. If price stalls and rolls over anywhere between $2.27 and $2.28, that's the local C-wave beginning, and it lines up perfectly with the 1H wave-C-down thesis and the 4H flat-completion thesis. All three timeframes agree on the same ceiling.
The Scenarios, Ranked
| Scenario | Trigger | Target | Read |
|---|---|---|---|
| Primary: C-wave down | Rejection at $2.27–$2.28 | $2.16 → $2.13 → $2.04 | Highest probability — all 3 timeframes align |
| Triangle chop | Range $2.21–$2.33 persists | Delays resolution | Possible if neither side commits |
| Bullish reclaim | Confirmed close above $2.33 | New leg beyond $2.40 | Invalidates the C-wave-down thesis |
Live pricing near $2.23–$2.30 shows ICP still trapped in exactly the zone this framework predicted, with broader forecast models also pegging near-term ranges in the $2.00–$2.86 band for the coming weeks.
Positioning & Order Flow — The Edge
This is where it gets interesting. Structure says one thing; positioning is telling a slightly different story. Top traders on major derivatives platforms are reportedly net long roughly 5-to-1 at current levels — a crowded long positioning that often precedes exactly the kind of shakeout the C-wave count is calling for. Crowded longs into resistance are classic fuel for a liquidation-driven leg lower.
Liquidation Clusters
Liquidation heatmaps show dense clusters of leveraged long positions stacked just below current price, with a mirrored wall of sell orders parked at $2.31. If price can't clear that wall and instead rolls over, a cascade through those long liquidation clusters would accelerate any move toward the $2.16–$2.13 zone — adding fuel exactly where the wave count expects the C-wave to accelerate.
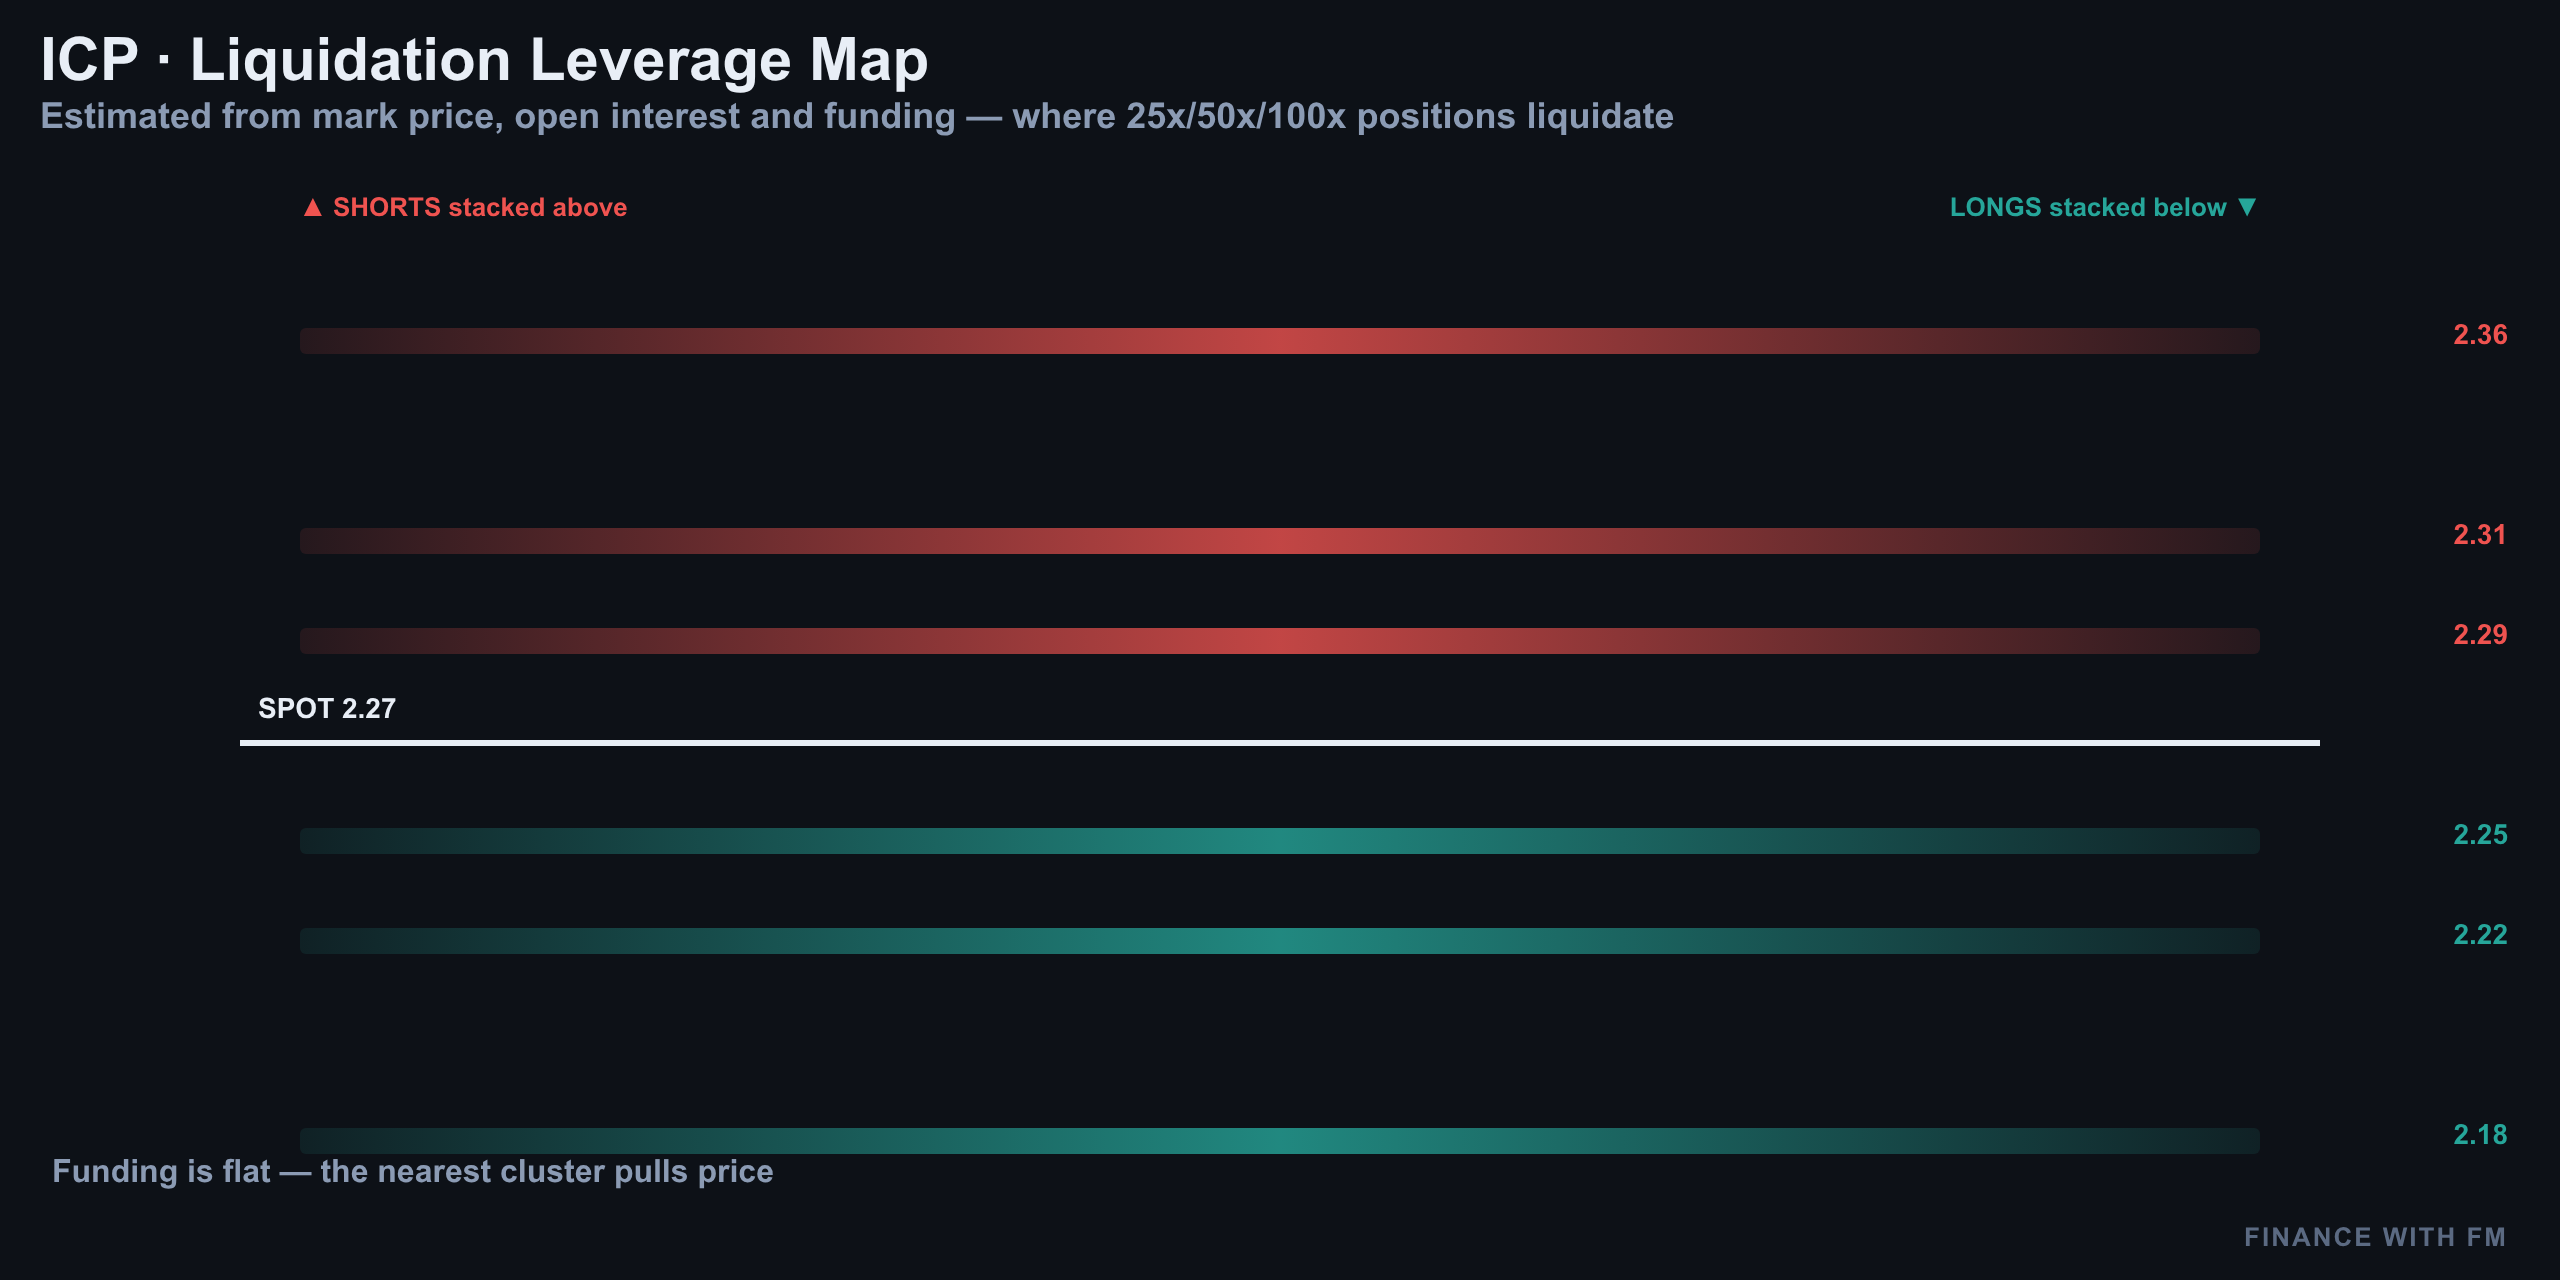
In other words: the positioning data doesn't contradict the wave count — it amplifies it. A break below $2.27–$2.28 with the sell wall at $2.31 already rejecting rallies gives dip-driven liquidations a clean runway lower.
Structure vs Positioning — Do They Agree?
Yes, largely. The 4H flat count, the 1H wave-C-down primary, the 15M timing setup, and the order-flow picture (crowded longs + a stacked sell wall at $2.31) all point the same direction: fade the bounce, don't chase it, unless $2.33 gets reclaimed on a confirmed close.
- Structure: bearish while capped under $2.33
- Positioning: net long 5-to-1 — a crowded trade vulnerable to a flush
- Order flow: sell wall at $2.31 matches the wave count's C-wave trigger zone
- Conclusion: multiple independent signals converge on the same downside bias
Levels to Watch & Setup (Not Advice)
| Level Type | Price | Significance |
|---|---|---|
| Hard invalidation | $2.33 | Bull flip if closed above — kills the C-wave thesis |
| Trigger / sell wall | $2.31 | Order-flow resistance matching wave count |
| Local B-wave ceiling | $2.27 – $2.28 | Where the 15M setup needs to roll over |
| First downside target | $2.24 | 0.786 on the 15M fib |
| Primary target 1 | $2.16 | 0.50 retrace on the A-B swing |
| Primary target 2 | $2.13 | 0.618 retrace + prior A-wave low |
| Extended target | $2.09 – $2.04 | 0.786+ extension zone |
Per the count — and this is analysis, not financial advice — the cleanest setup is a short bias triggered on a rejection between $2.27 and $2.28, invalidated only by a confirmed close above $2.33. Anyone leaning bullish should wait for that close, not a wick, before treating the correction as over.
Where Every Timeframe Sits in Its Count
| Timeframe | Count Status | Current Phase | Bias |
|---|---|---|---|
| 4H | Corrective flat (not impulsive) | Awaiting final C-wave leg | Bearish under $2.33 |
| 1H | Valid 5-wave impulse, now correcting | Wave C unfolding, testing $2.21 | Bearish primary / bullish alternate above $2.33 |
| 15M | Invalid impulse, treated as ABC | Wave B bounce near invalidation | Watching $2.27–$2.28 for rollover |
Current spot pricing keeps ICP oscillating in this exact decision zone, roughly between $2.23 and $2.30 across major venues, which is precisely why $2.33 above and $2.21–$2.24 below remain the levels that matter most this week.
Summary
ICP defended its rejection at $2.33 for a second consecutive session, keeping the bearish C-wave-down primary count fully intact across the 4H, 1H and 15M timeframes. The bigger-picture structure is corrective, not impulsive — a flat or expanded flat that still needs one more leg lower to complete. Order flow adds weight to that read: traders are crowded net-long 5-to-1 into a stacked $2.31 sell wall, a combination that often resolves with a liquidation-driven flush rather than a clean breakout.
The trigger to watch is simple — a rollover between $2.27 and $2.28 opens the door toward $2.16, $2.13 and eventually $2.04. A confirmed close above $2.33 is the only thing that flips this bearish, turning the correction into a fresh impulsive leg beyond $2.40. Until then, every bounce into resistance remains a level to fade, not chase.
More on Internetcomputer: elliott wave · technical analysis
Analysis and education, not investment advice. See our editorial policy.