Daily market analysis
Dogecoin (DOGE) technical analysis today
Last updated
Dogecoin Price Today: The Level That Flips the Bias
Where We Left It: The Scorecard Since Last Week
Seven days ago in our Squeeze Under Seven Cents update, we flagged a short setup and called the bias neutral. Since then, Dogecoin has drifted from about $0.0694 to roughly $0.0700 — a modest 0.8% gain that hides a much choppier story underneath.
| Metric | 7 Days Ago | Today |
|---|---|---|
| DOGE Price | $0.0694 | $0.0701 |
| Weekly Change | — | +0.8% |
| Bias | Neutral | Neutral, leaning cautious |
| Short Trade Entry | $0.0699 | Still live |
| Short Trade Stop | $0.0713 | Not hit |
| Short Trade Target | $0.0664 | Not hit |
Today's Snapshot: A Sharp Bounce Into a Wall
Dogecoin is trading around $0.0701, up roughly 1.5% on the day after bouncing hard off a $0.0682 low. That bounce is real — structure is improving on both the 15-minute and 4-hour charts — but it's running straight into a wall of positioning headwinds.
- Funding is crowded long — longs are paying to stay in their trades
- Taker flow shows sellers are more aggressive than buyers, even as price climbs
- Coinbase is trading at a discount to Binance, hinting at US spot selling
- Open interest is up 5.2% over the past week — leverage is building, not unwinding
15-Minute Intraday: A Rising Wedge Into Resistance
Zoom into today's session and the pattern is a textbook rising wedge. Price dumped hard to about $0.0685 around midday yesterday, then spent hours grinding higher inside a steadily tightening channel. The last few candles punched through the wedge's upper rail on rising volume, tagging the $0.0701 level.
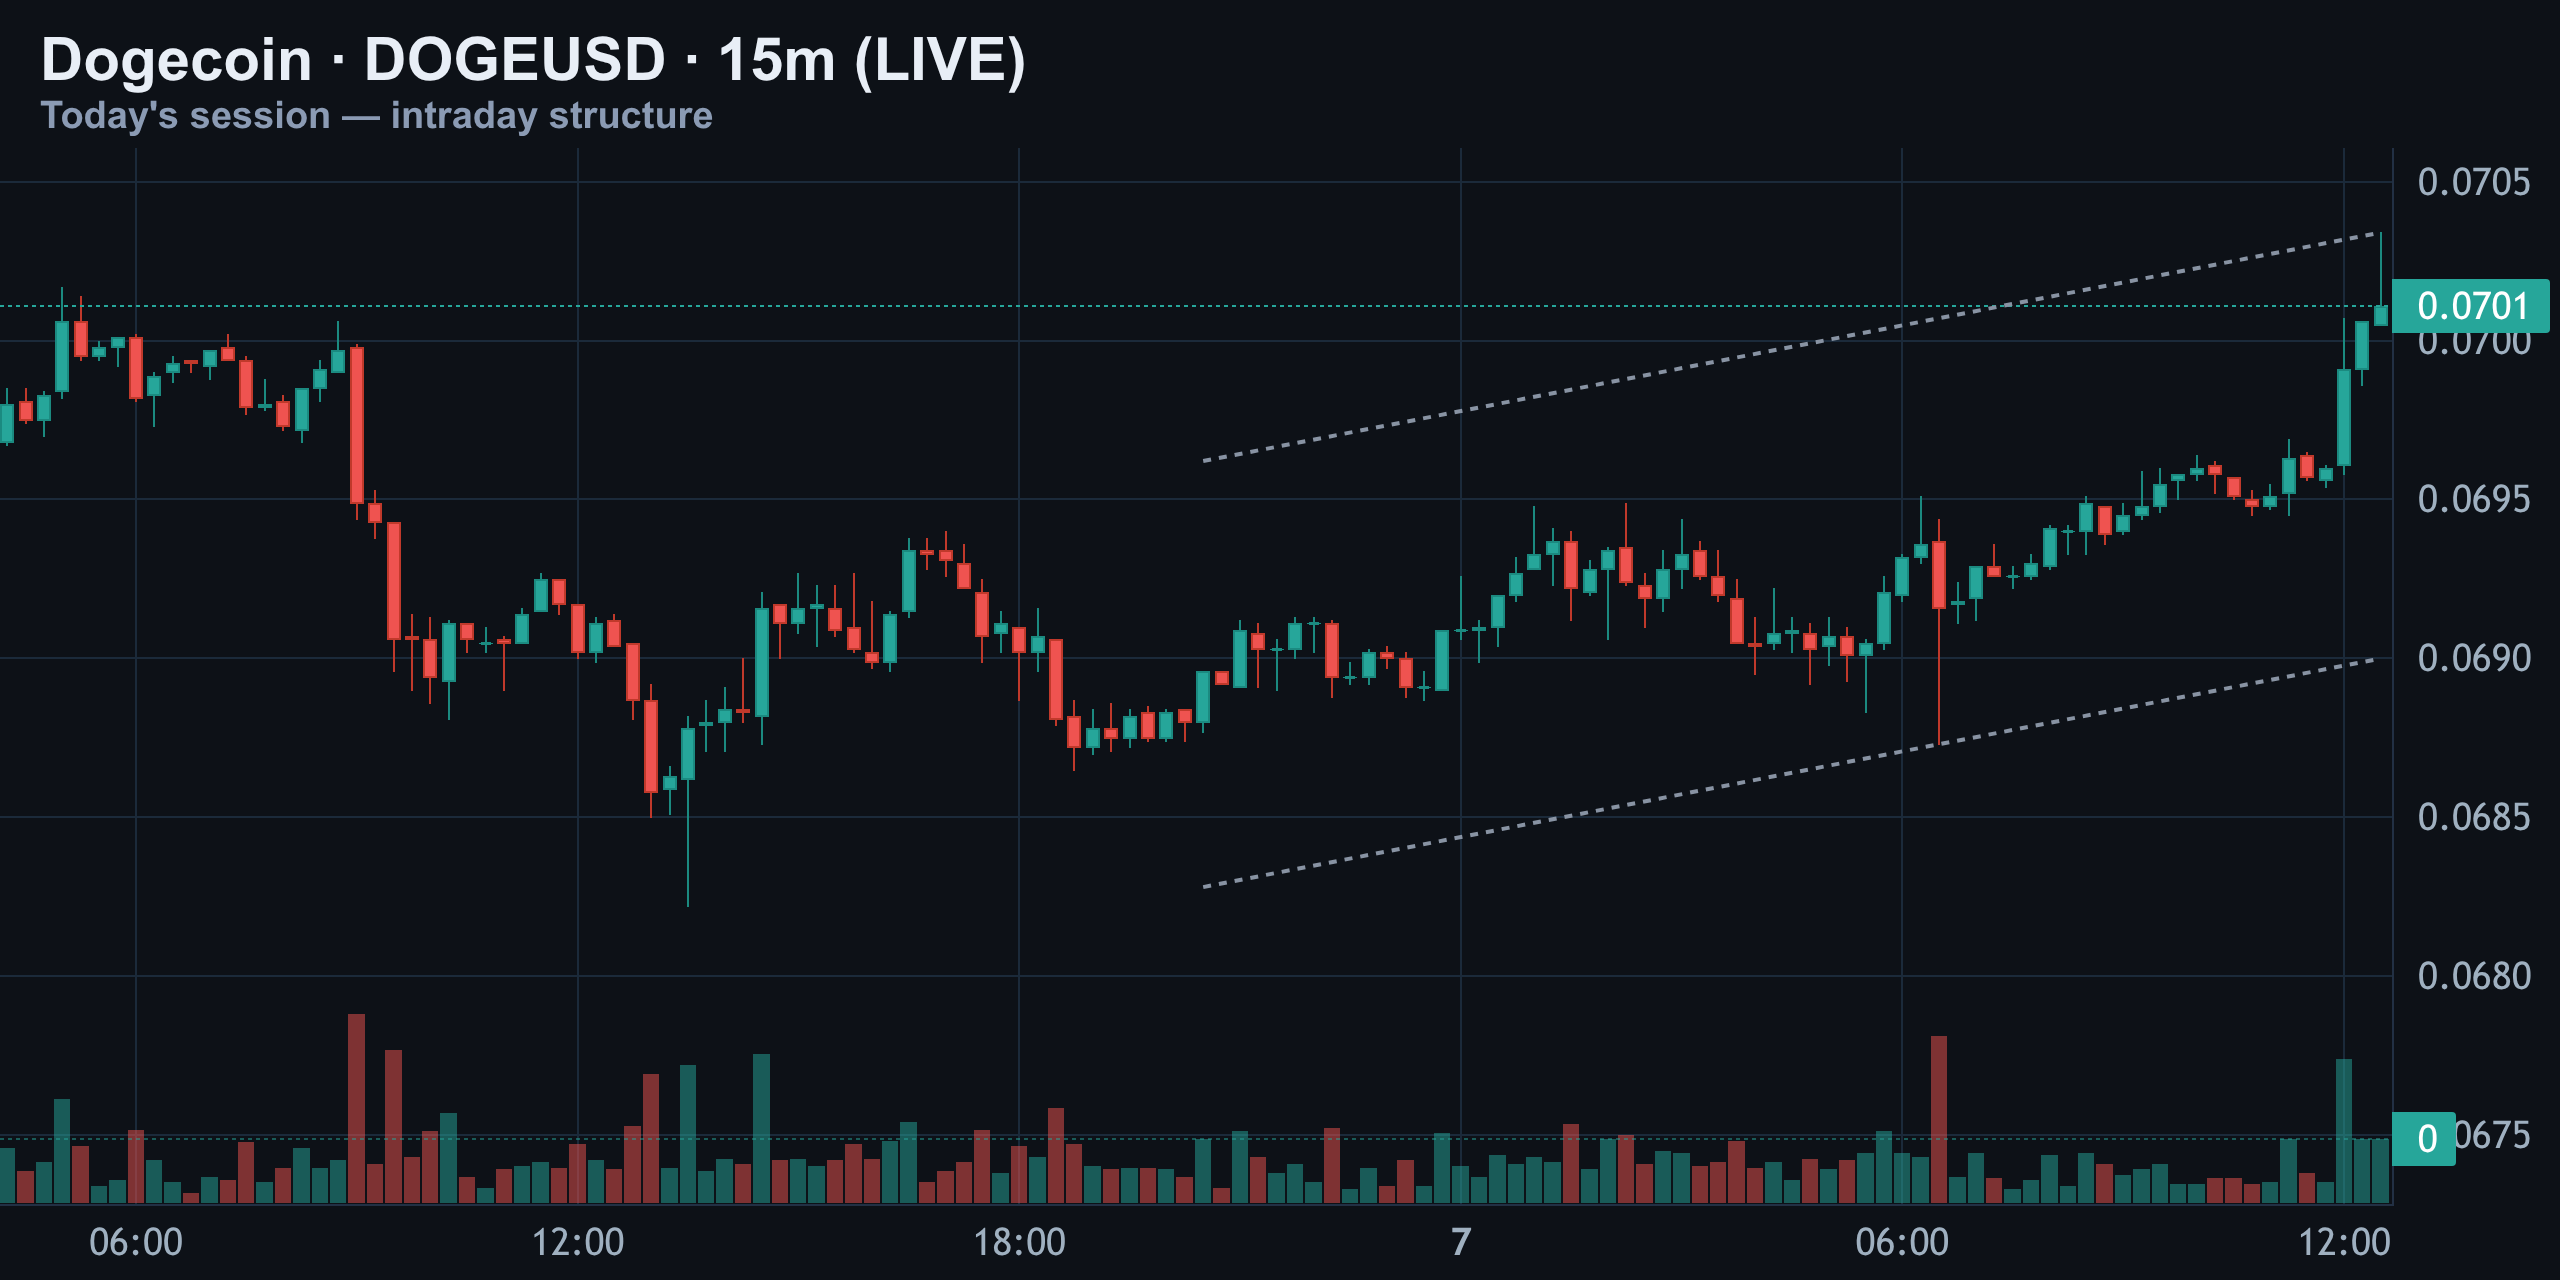
That's a genuine breakout attempt, not noise. But wedges that resolve after a sharp move lower have a habit of snapping back just as fast as they built. In plain terms: Dogecoin bounced off a dip and is now testing a key ceiling — the next few candles matter.
4-Hour Structure: The Descending Channel Is Still Intact
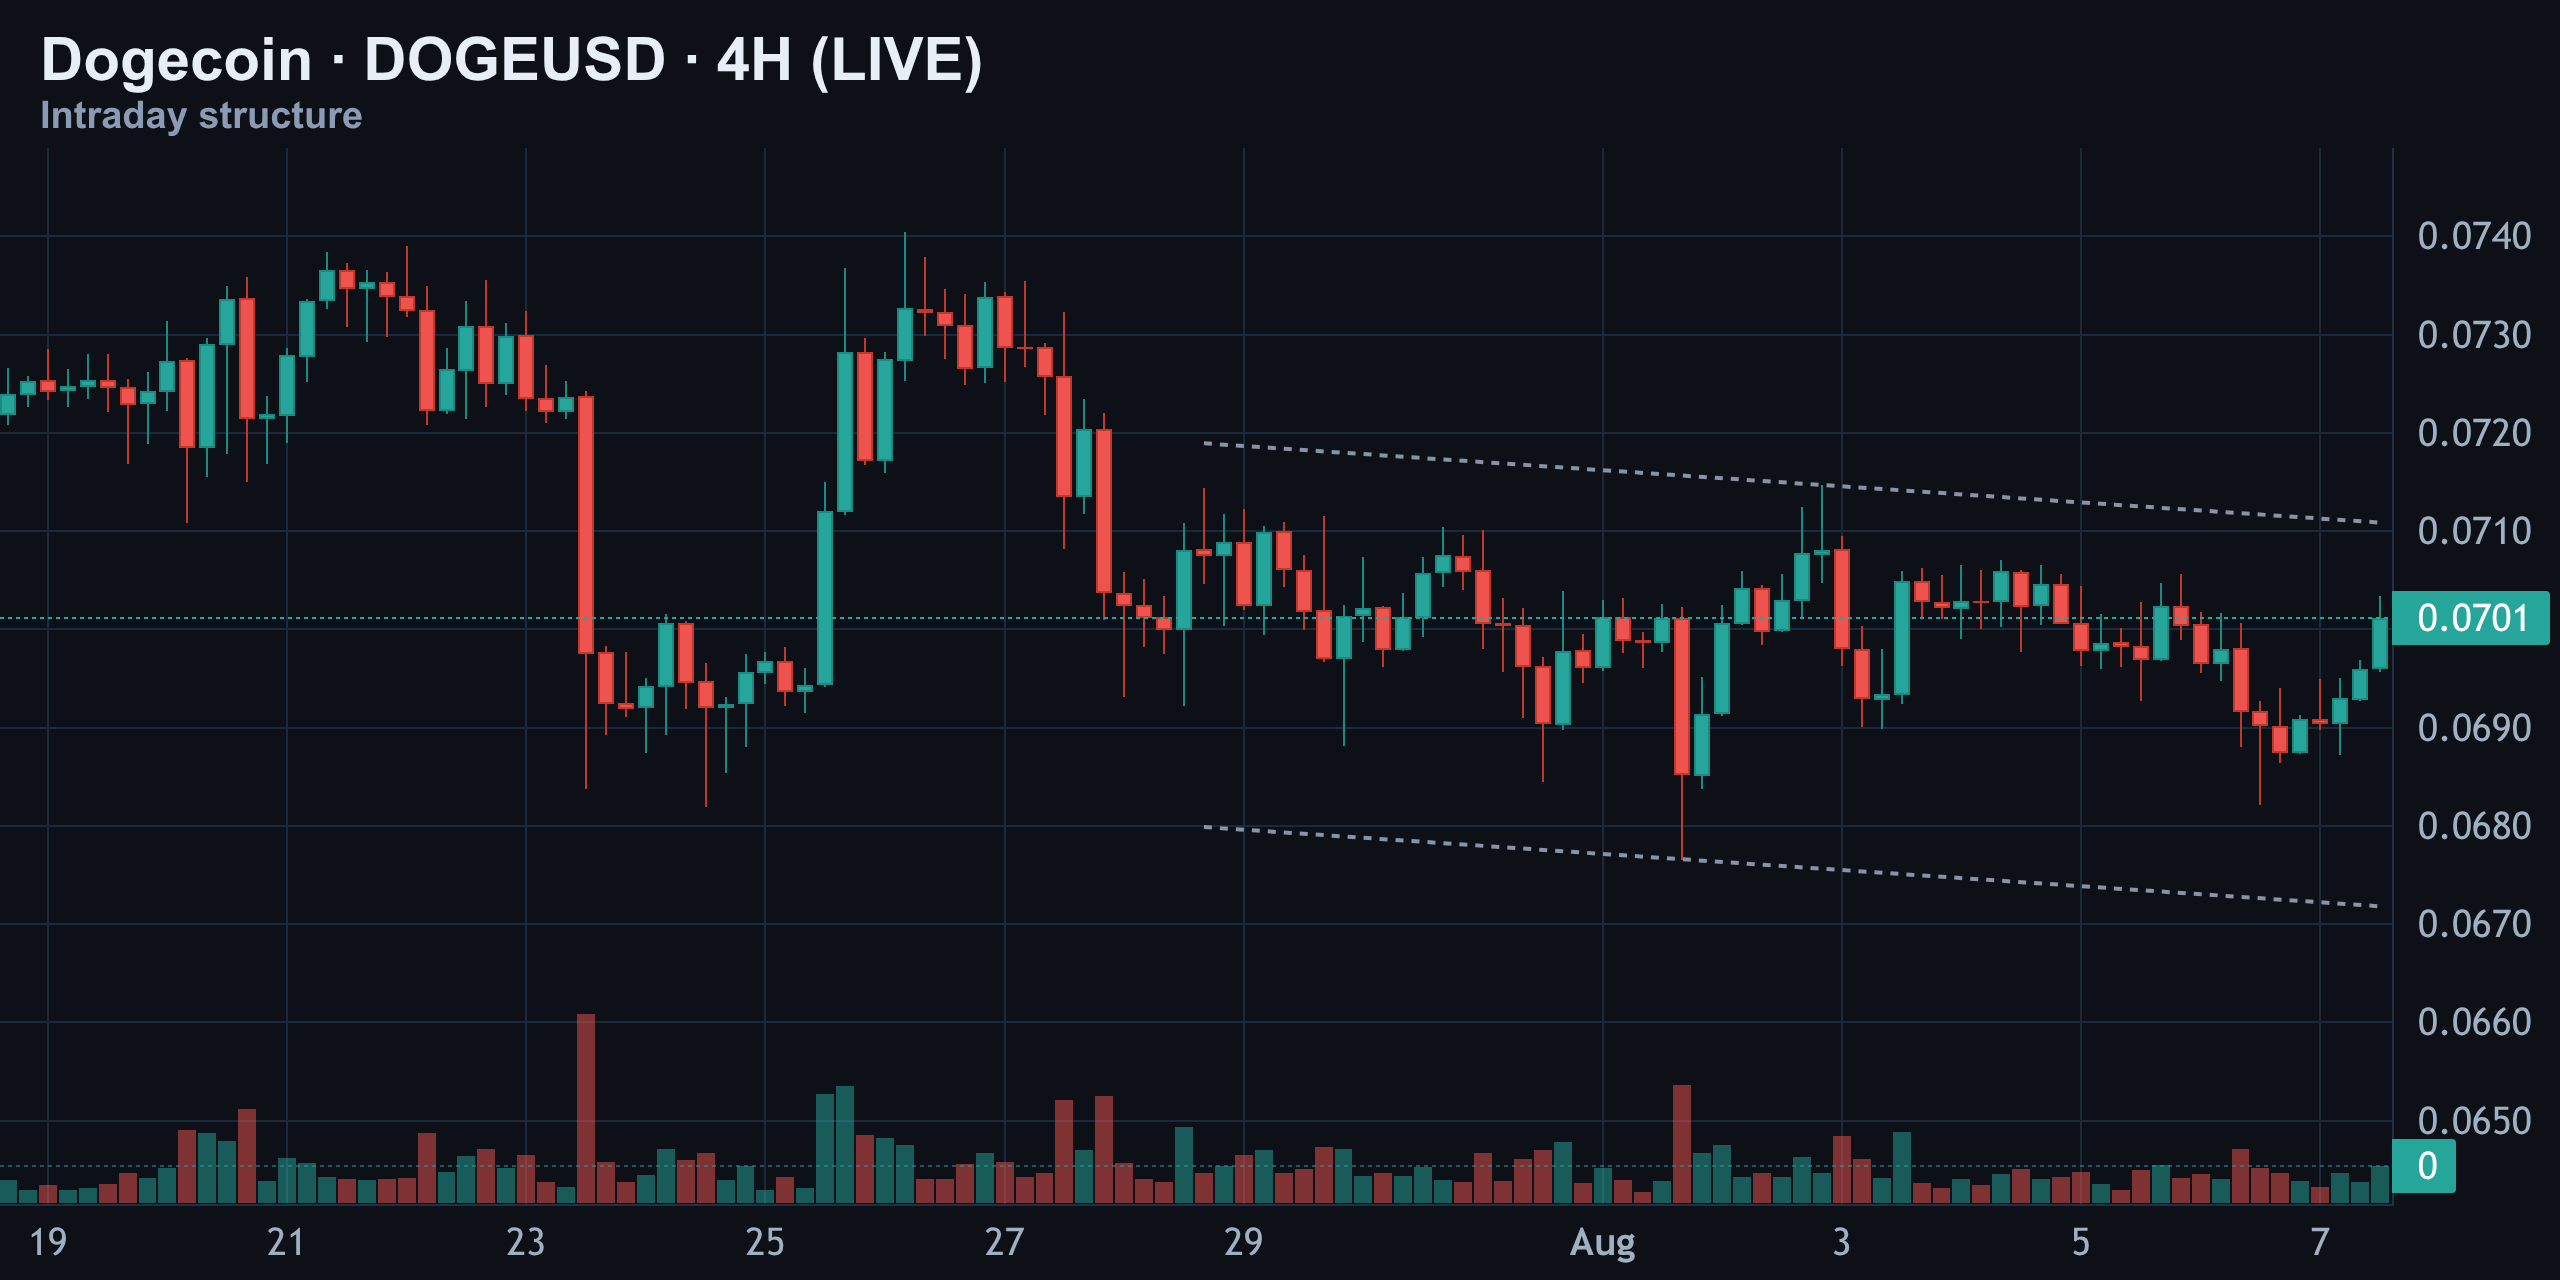
Widen the lens to the 4-hour chart and the picture is a descending channel that's been in force since late July. Twice now, price has rallied into the $0.0720 area near the top rail and been rejected back toward $0.0690. Today's push is the third attempt at that same rail.
Daily Chart: Falling Channel, Key Support Holding
On the daily timeframe, Dogecoin remains inside a well-defined falling channel that began after the May–July selloff. The support floor near $0.06766 has now held on two separate tests, and price is currently sitting right at the mid-channel area around $0.0701.
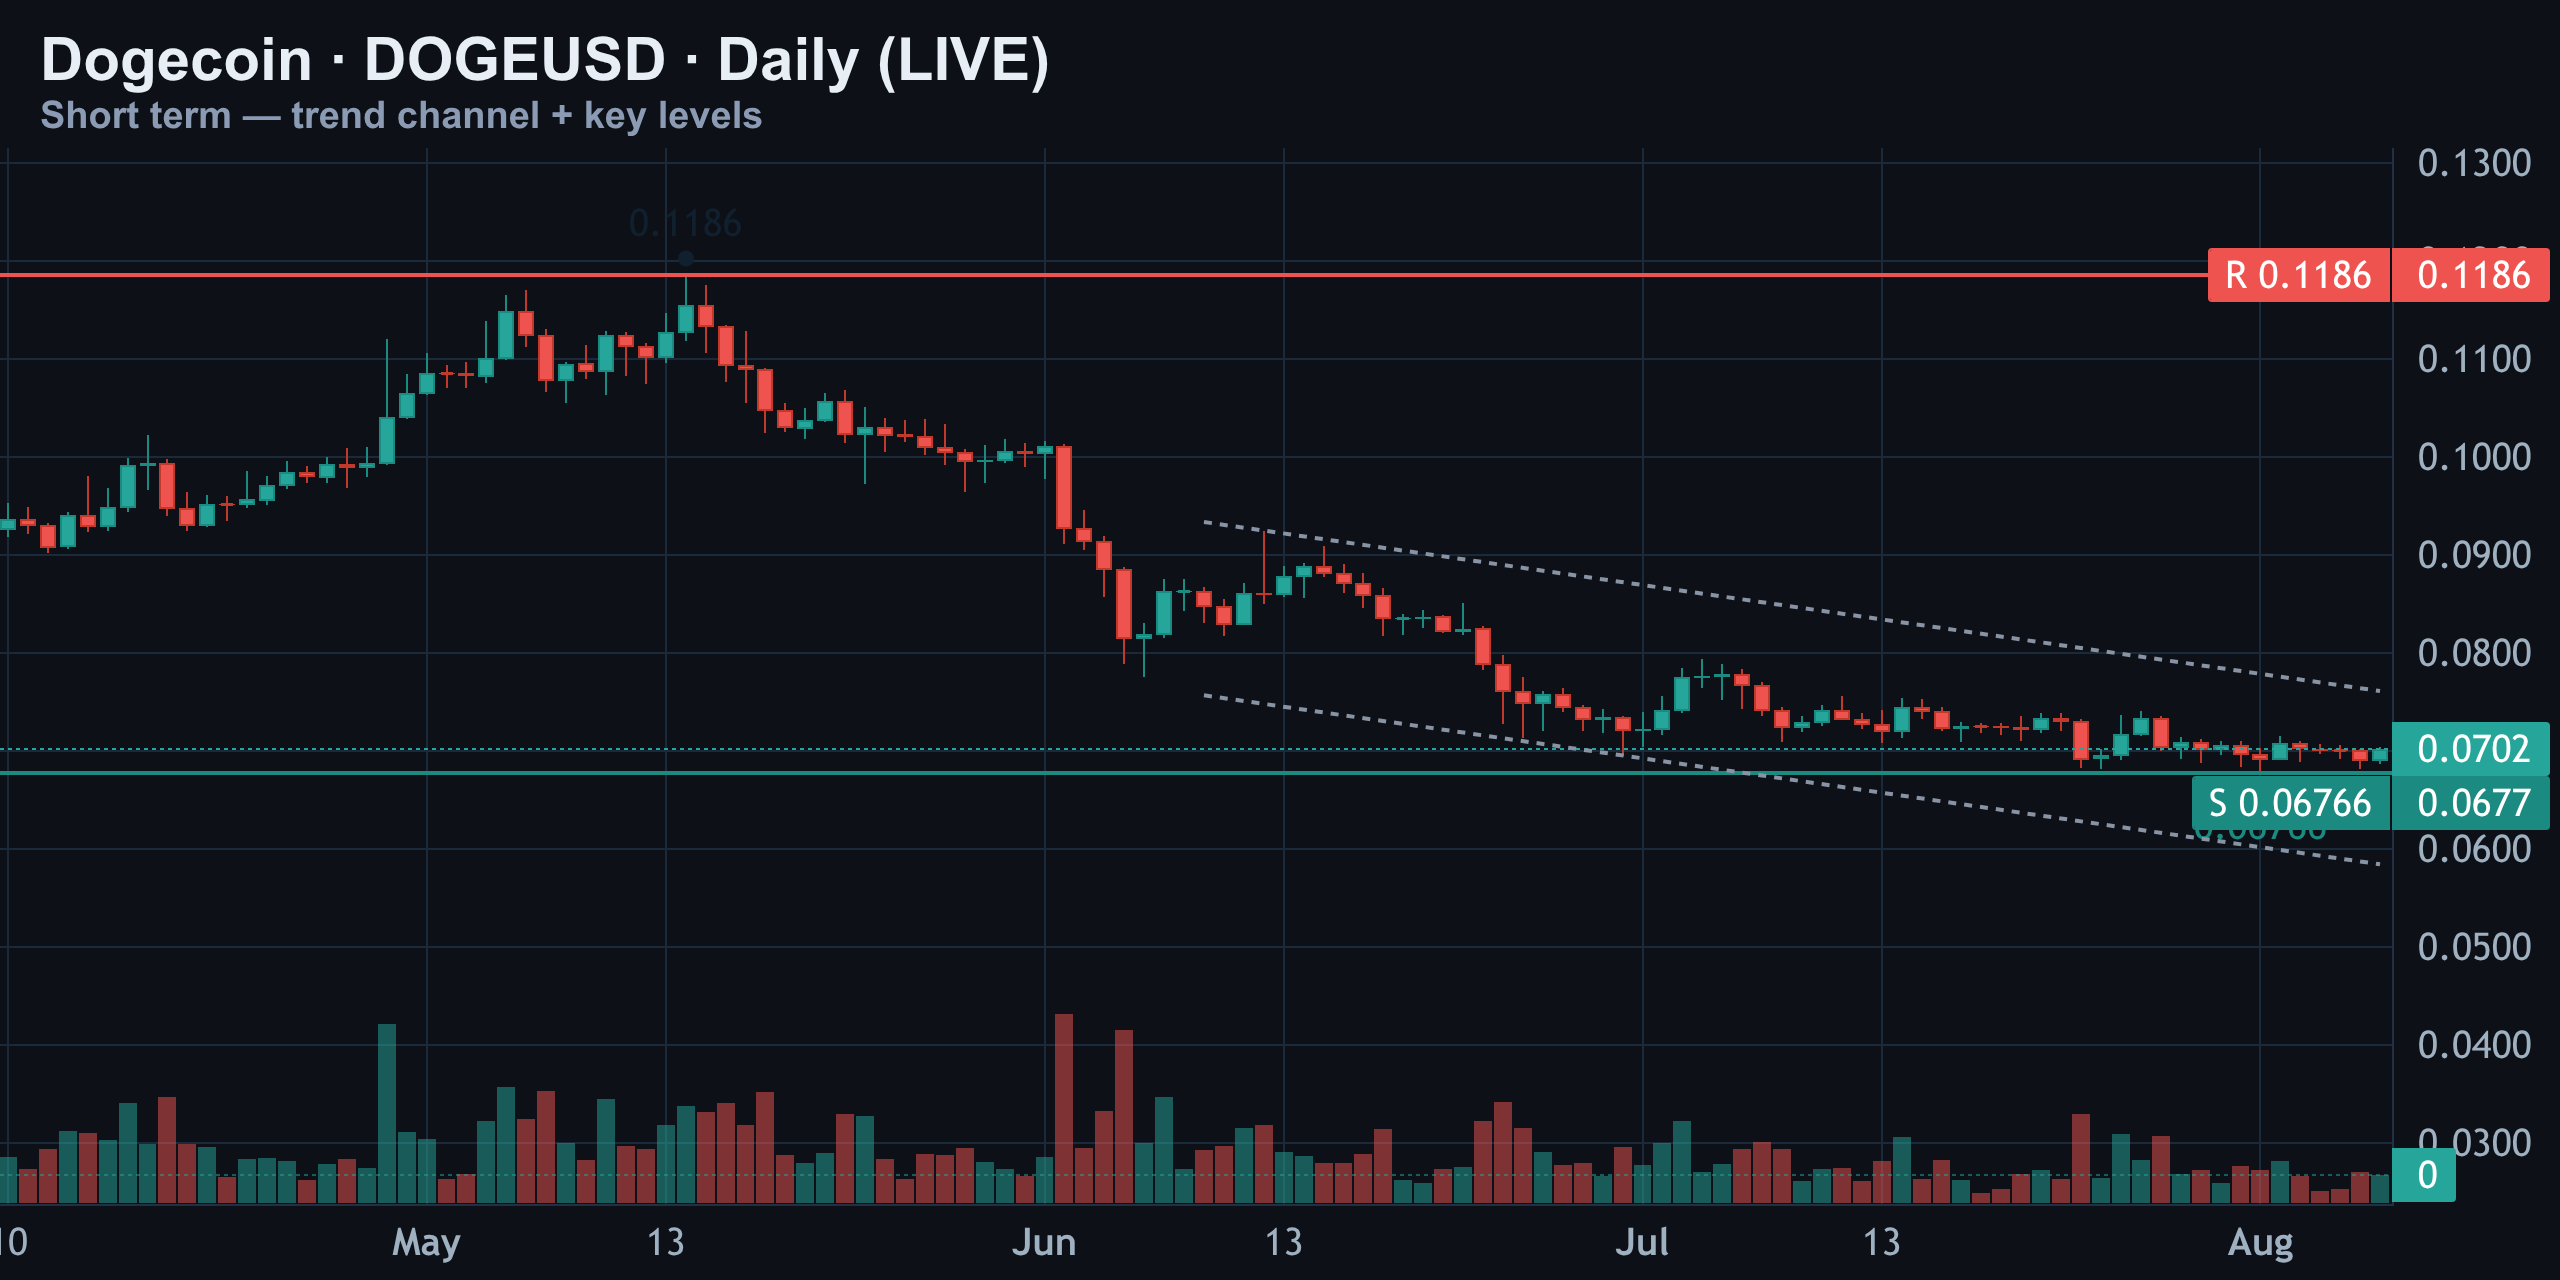
This is a coiling market — lower highs on the chart, but a floor that keeps proving sticky. That combination typically precedes one of two outcomes: a breakdown flush, or a channel-breaking reversal. In plain terms, Dogecoin is stuck in a slow downtrend, but the floor keeps holding.
Momentum Check: RSI Divergence and a Fresh MACD Cross
RSI (14): A Bullish Divergence Is Building
The RSI is sitting right in the middle at 44 — nothing overbought or oversold on its own. But look closer at the last two swing lows: price made a lower low near $0.0682, while RSI actually printed a higher low, around 38 versus 33 on the prior dip. That's a textbook bullish divergence.
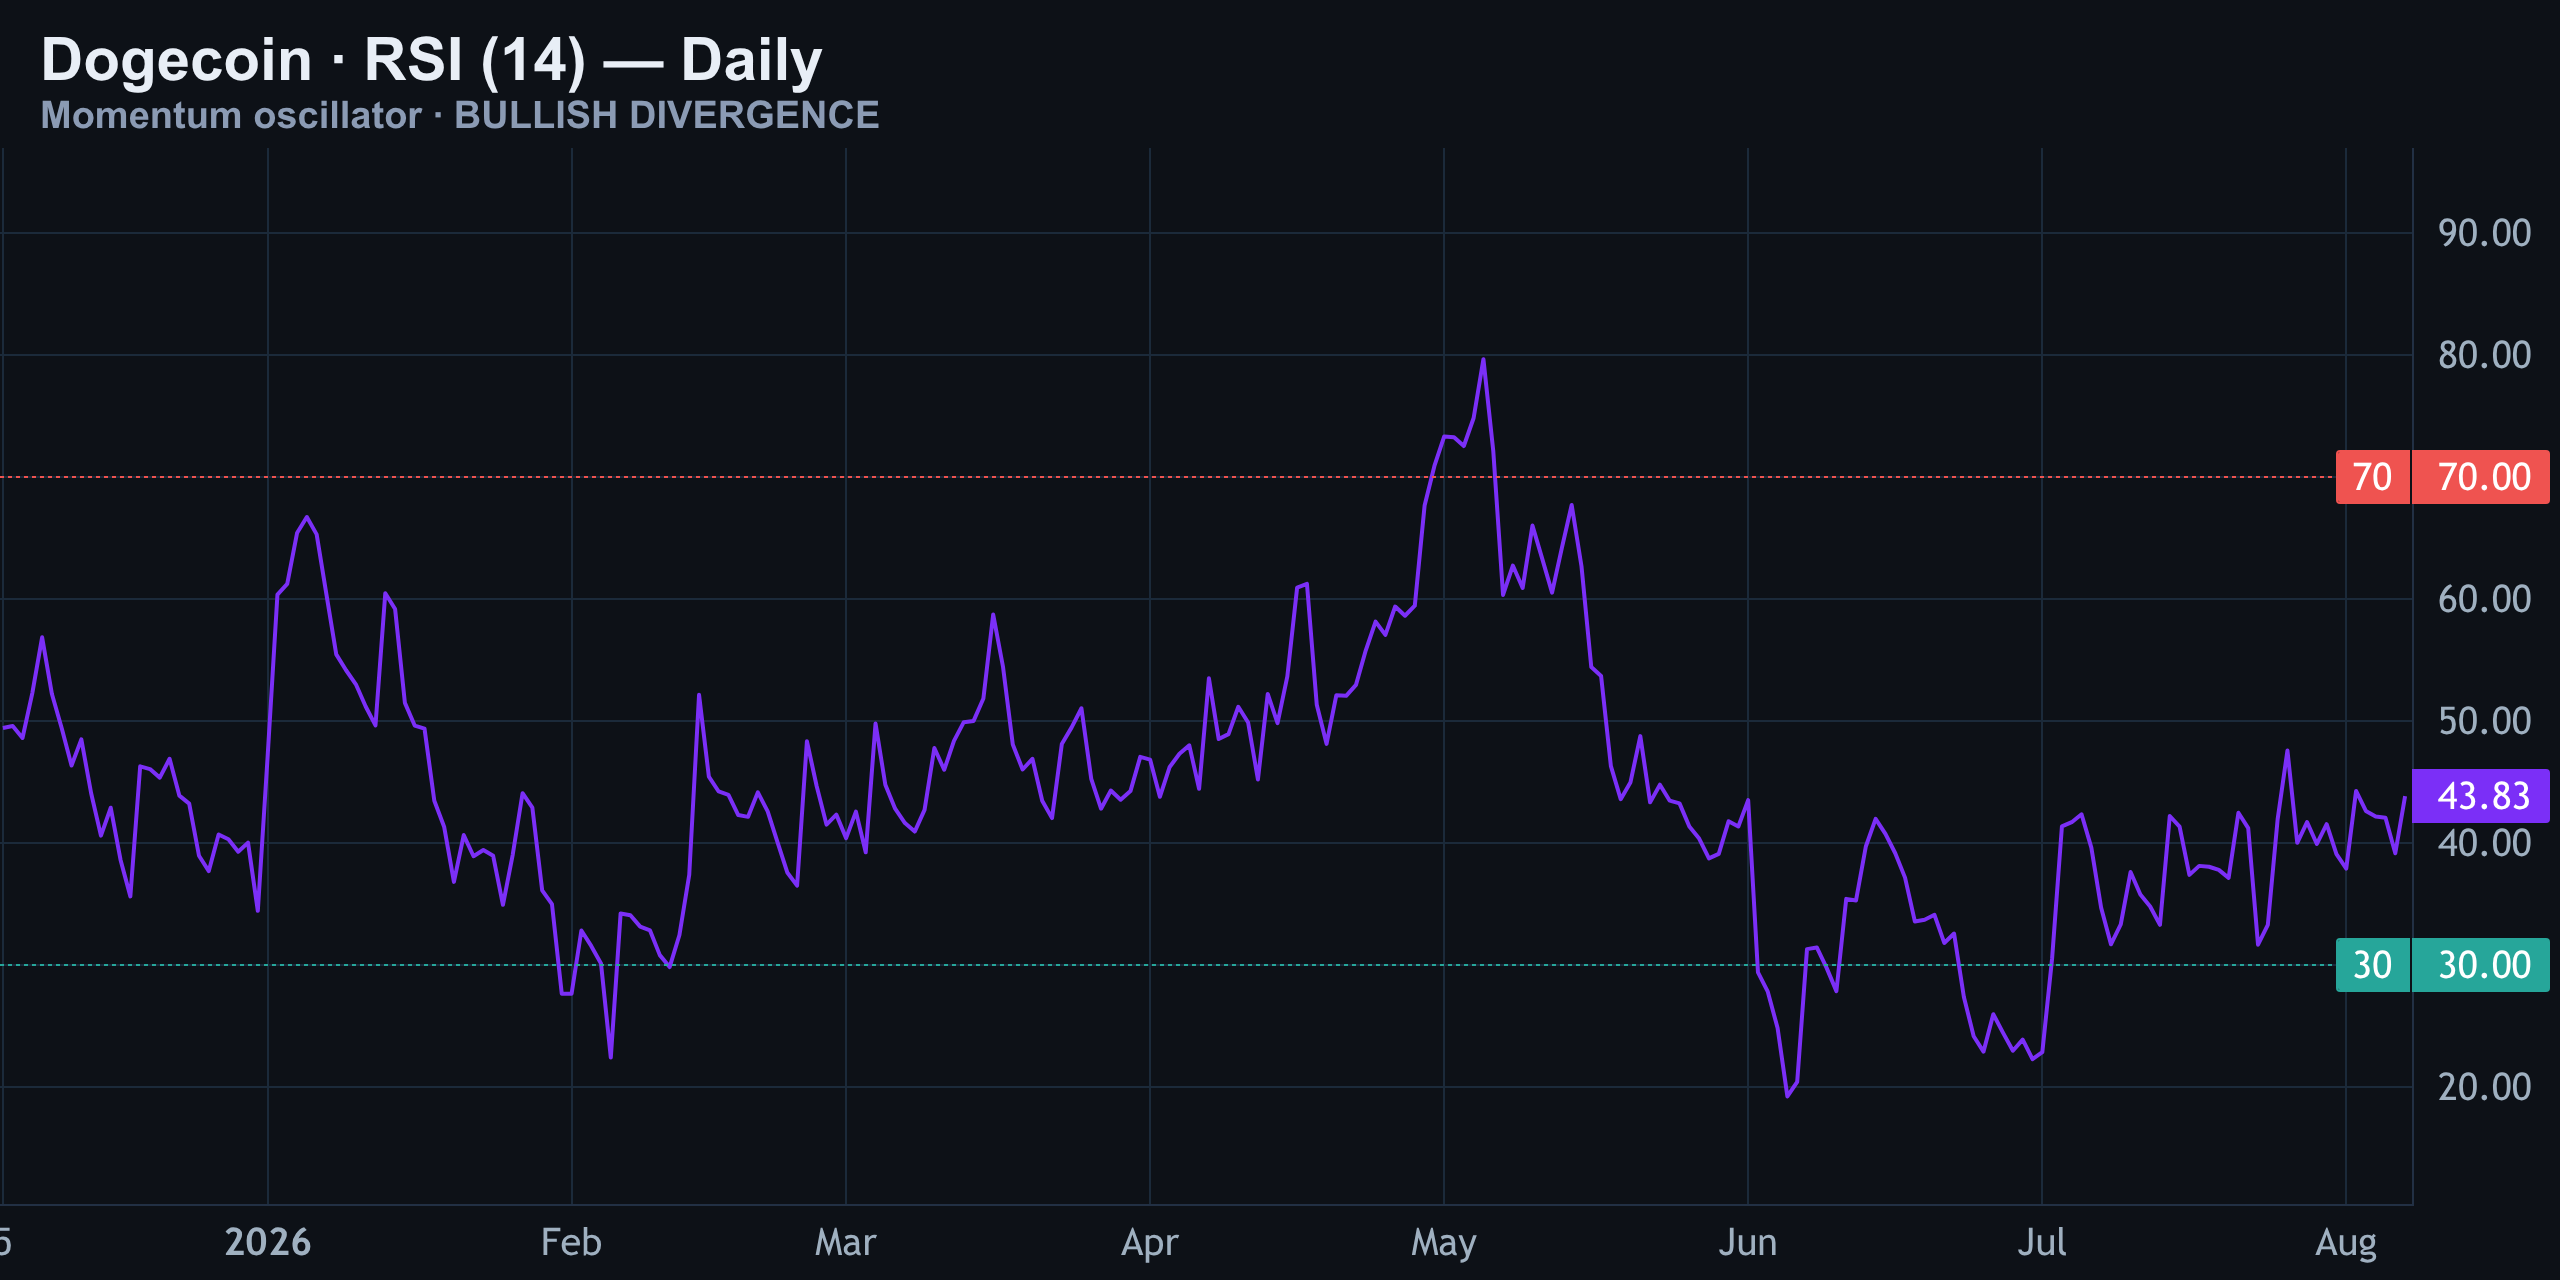
It doesn't guarantee a reversal, but it tells you sellers are running out of gas exactly where they pushed hardest.
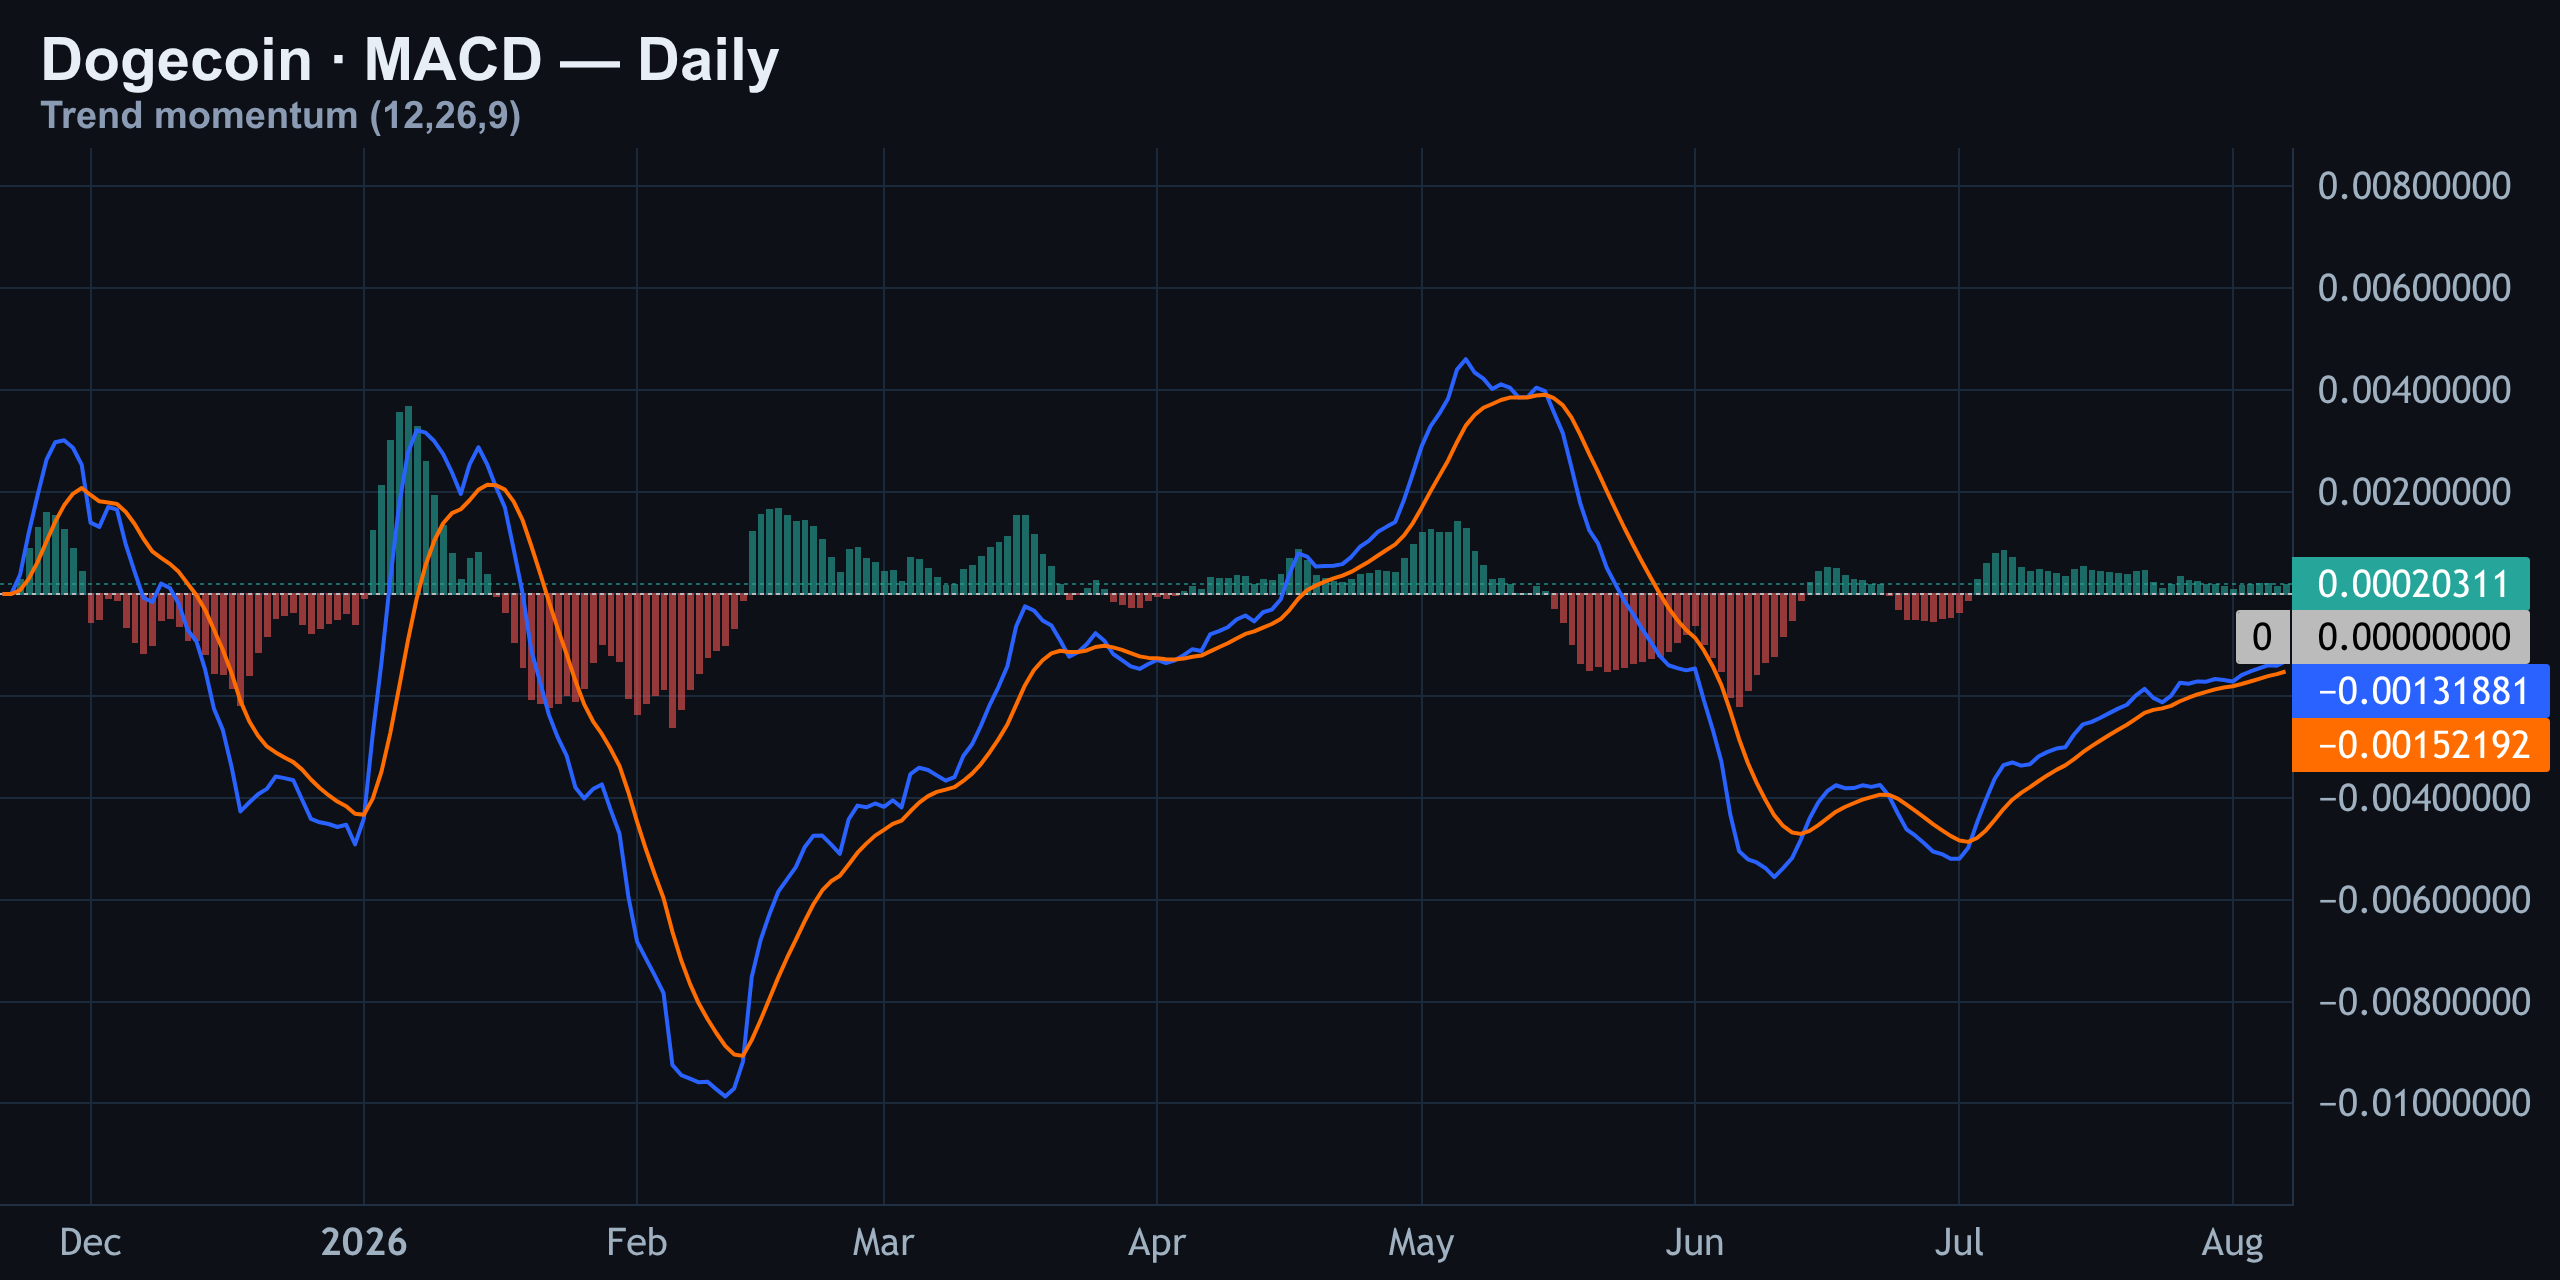
MACD: Bullish Cross, Histogram Turning Green
The MACD line just crossed above its signal line, and the histogram has flipped green. That lines up with the RSI divergence and the 15-minute wedge breakout — three signals now pointing the same direction.
Levels, Positioning & Order Flow: Who's Really in Control
Here's every level that matters for Dogecoin today, from the resistance overhead to the structural floor underneath.
| Level | Price | What It Means |
|---|---|---|
| Big ask wall | $0.0735 | Heavy order-book resistance |
| 4H channel ceiling / bias flip | $0.0714 | Trade invalidation — a close above flips the story bullish |
| Liquidation cluster | $0.0703 | Dense two-week liquidation zone |
| Spot price | $0.0701 | Current trading level |
| Big bid wall | $0.0680 | Order-book support |
| Daily structural support | $0.06766 | Held twice in the falling channel |
Positioning tells a more complicated story than price action alone. Funding is positive at roughly 11% annualized — longs are paying, meaning longs are crowded and vulnerable to a squeeze lower. Retail accounts are net long 2.64-to-1, and top traders are even more aggressively long at 2.96-to-1. Everyone's leaning the same way, which strips out the usual contrarian edge.
| Metric | Reading | Interpretation |
|---|---|---|
| Funding rate | +11% APR | Crowded longs — squeeze-down fuel |
| Open interest (7d) | +5.2% | Leverage building, not unwinding |
| Retail long/short | 2.64 : 1 | Aligned with top traders — no edge |
| Top trader long/short | 2.96 : 1 | Heavily long |
| Taker flow ratio | 0.88 | Aggressive sellers outpacing buyers |
| Coinbase premium | -0.086% | US side selling (discount to Binance) |
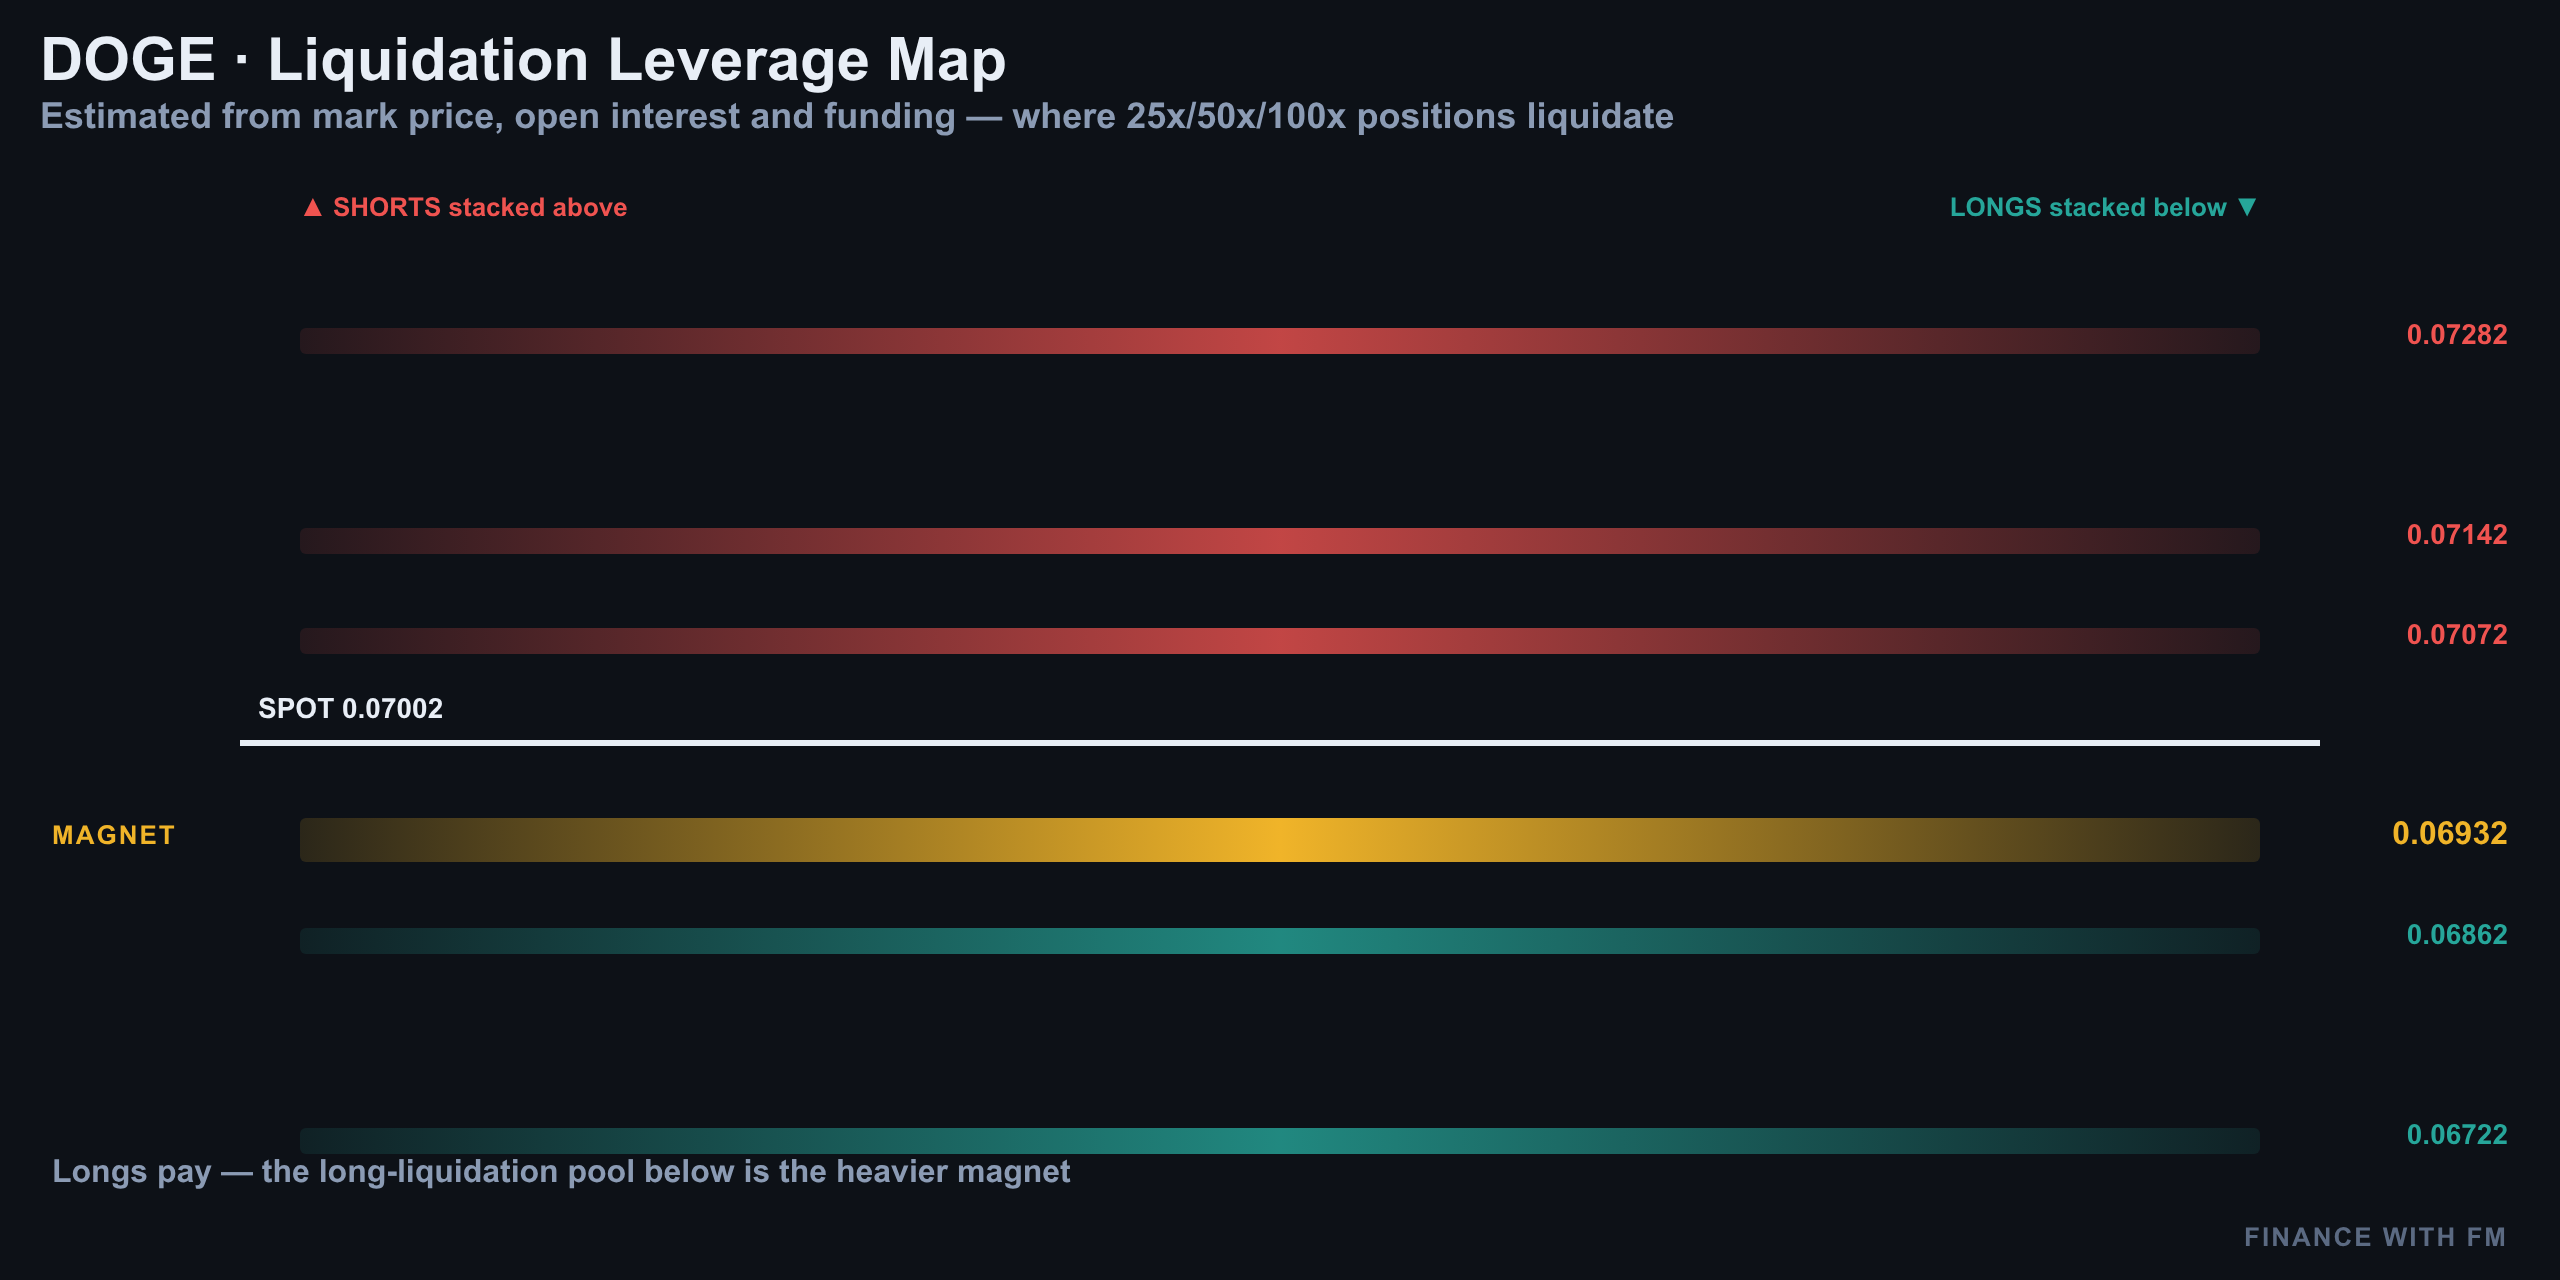
The liquidation heatmap shows dense long-liquidation clusters sitting just below spot, with mark price sandwiched between the $0.0703 cluster above and thinner air below toward $0.0680. That's the setup for a classic long squeeze if sellers press their advantage — but it's also exactly the kind of crowded positioning that can violently reverse if shorts get caught leaning the wrong way into a breakout.
The Trade Setup: Entry, Stop, Target
Putting it all together: structure is improving, momentum is quietly turning, but positioning and order flow are still fighting the bounce. That combination favors fading strength into resistance rather than chasing the breakout — with a tight invalidation right at the level that flips the entire bias.
| Parameter | Level |
|---|---|
| Entry (short) | $0.0701 |
| Stop-loss | $0.0714 |
| Target | $0.0666 |
| Risk / Reward | 1 : 2.7 |
The logic is straightforward. $0.0714 is the 4-hour channel ceiling — a decisive close above it is the one thing that kills this trade and flips the bias bullish. Below spot, the $0.0680 bid wall and the $0.06766 daily support are the first real magnets for price if sellers keep the upper hand.
Bottom line: Dogecoin's bounce off $0.0682 is technically encouraging, with RSI divergence and a fresh MACD cross both hinting that sellers are tiring. But crowded longs, aggressive taker selling, and a Coinbase discount mean the path of least resistance still favors a fade — until $0.0714 breaks on a clean 4-hour close. That's the level that flips everything.
Previous days
07/31/2026 — Dogecoin Price Today: The Squeeze Under Seven Cents
Dogecoin Price Today: The Squeeze Under Seven Cents
Where We Left It: The $0.0696 Squeeze Point, One Week Later
Seven days ago, this Daily Pulse flagged Dogecoin at what we called 'The $0.0696 Squeeze Point' — a coin pinned right under resistance with sellers quietly in control. A week on, almost nothing has changed, and that in itself is the story.
| Metric | 7 Days Ago | Today (July 31) |
|---|---|---|
| Price | $0.06958 | $0.06942 |
| 7-Day Change | — | -0.2% |
| Prior Thesis | Bearish squeeze | Still bearish |
| Trade Status | Short opened | Live, not stopped or filled |
That prior short — entered at $0.0702, stop at $0.0715, target $0.0670 — is still on the board. It hasn't been stopped out, and it hasn't hit target either. Seven days of pure chop, but the underlying thesis hasn't been invalidated once.
Dogecoin Price Today: Cautiously Bearish Under $0.07
Dogecoin is trading around $0.0695, down roughly 0.9% on the day, stuck inside a tight $0.0691–$0.0710 band. Momentum signals are genuinely mixed — the kind of setup that punishes traders who pick a side too early.
- MACD just flipped bullish on paper, but the histogram is barely above flat
- RSI (14) sits at a neutral 39 — no oversold bounce signal yet
- Open interest keeps bleeding lower, down almost 5% in a week
- Taker flow is aggressively selling into every bounce attempt
15-Minute Intraday: Coiling Under Resistance
Zoom into the 15-minute chart and the session tells a clean story: Dogecoin spent the day fighting between roughly $0.069 and $0.071 before rolling over into a tightening falling wedge. Price is now coiling directly on the $0.0695 level — today's pivot, flipping between support and resistance repeatedly.
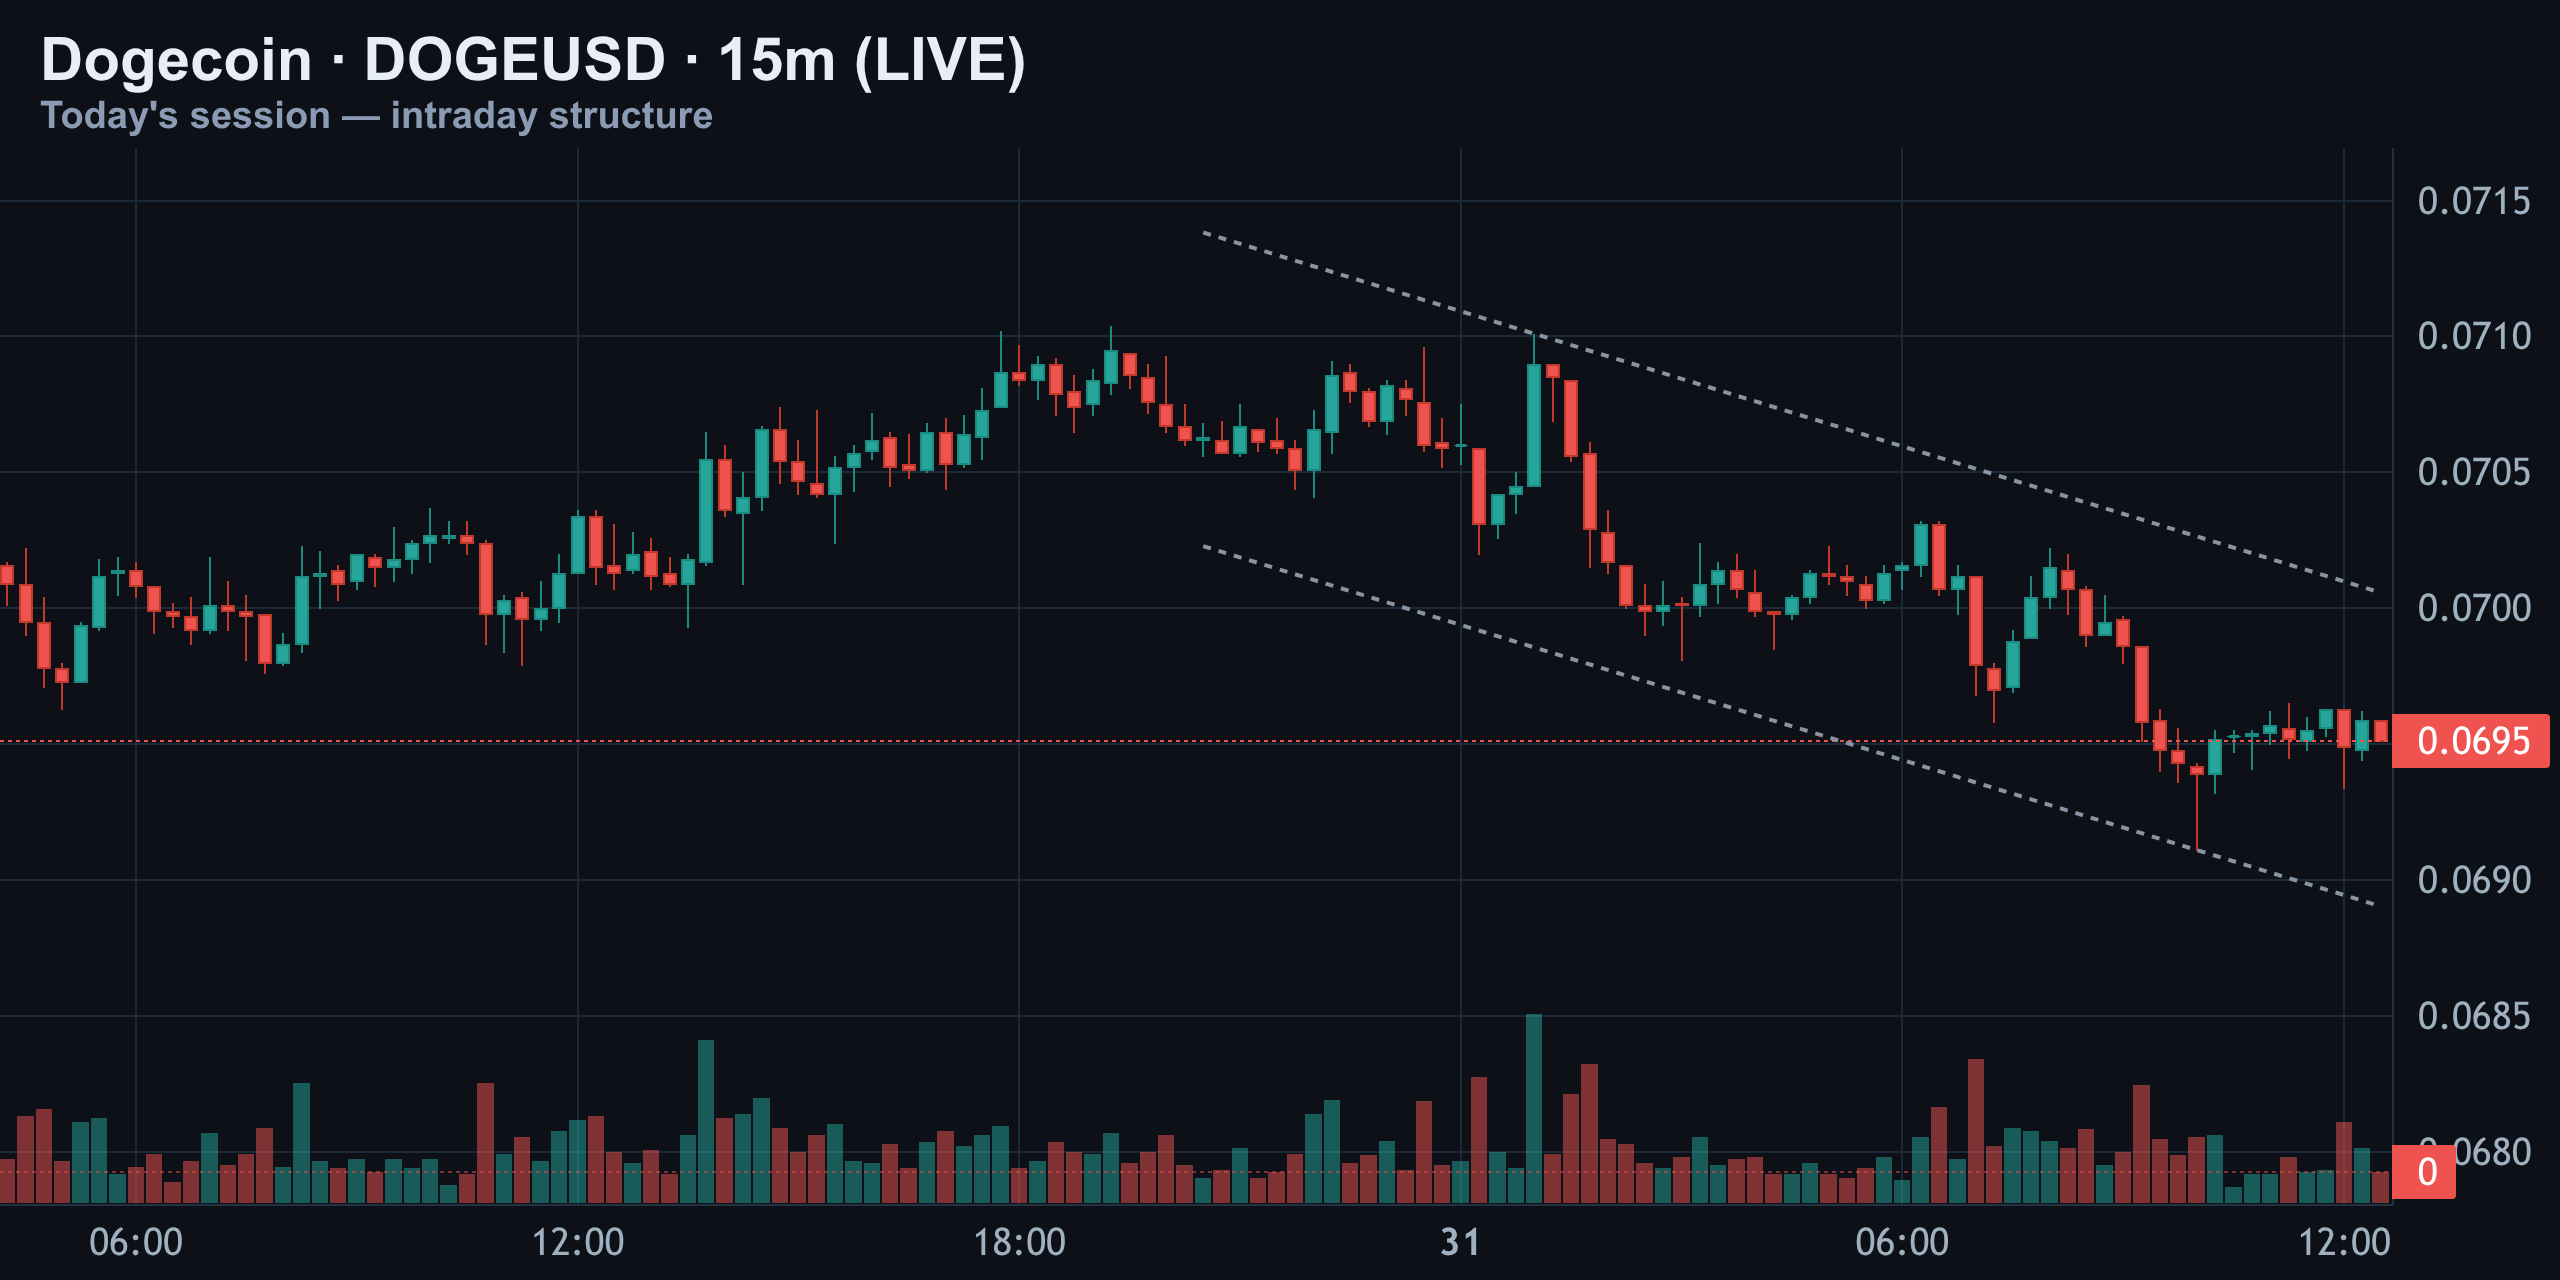
Volume dried up right into the squeeze, which is typically a sign that energy is building for a sharp move once price finally breaks either edge of the wedge. Watch which side gives first — that break is likely to set the tone for the next few hours of trading.
4-Hour & Daily Structure: Still Trapped in a Downtrend
Step back to the 4-hour chart and the bigger picture comes into focus: a descending channel has stayed fully in control since late July. Dogecoin tapped the top of that channel near $0.074, got rejected hard, and has been grinding lower in a clean series of lower highs ever since.
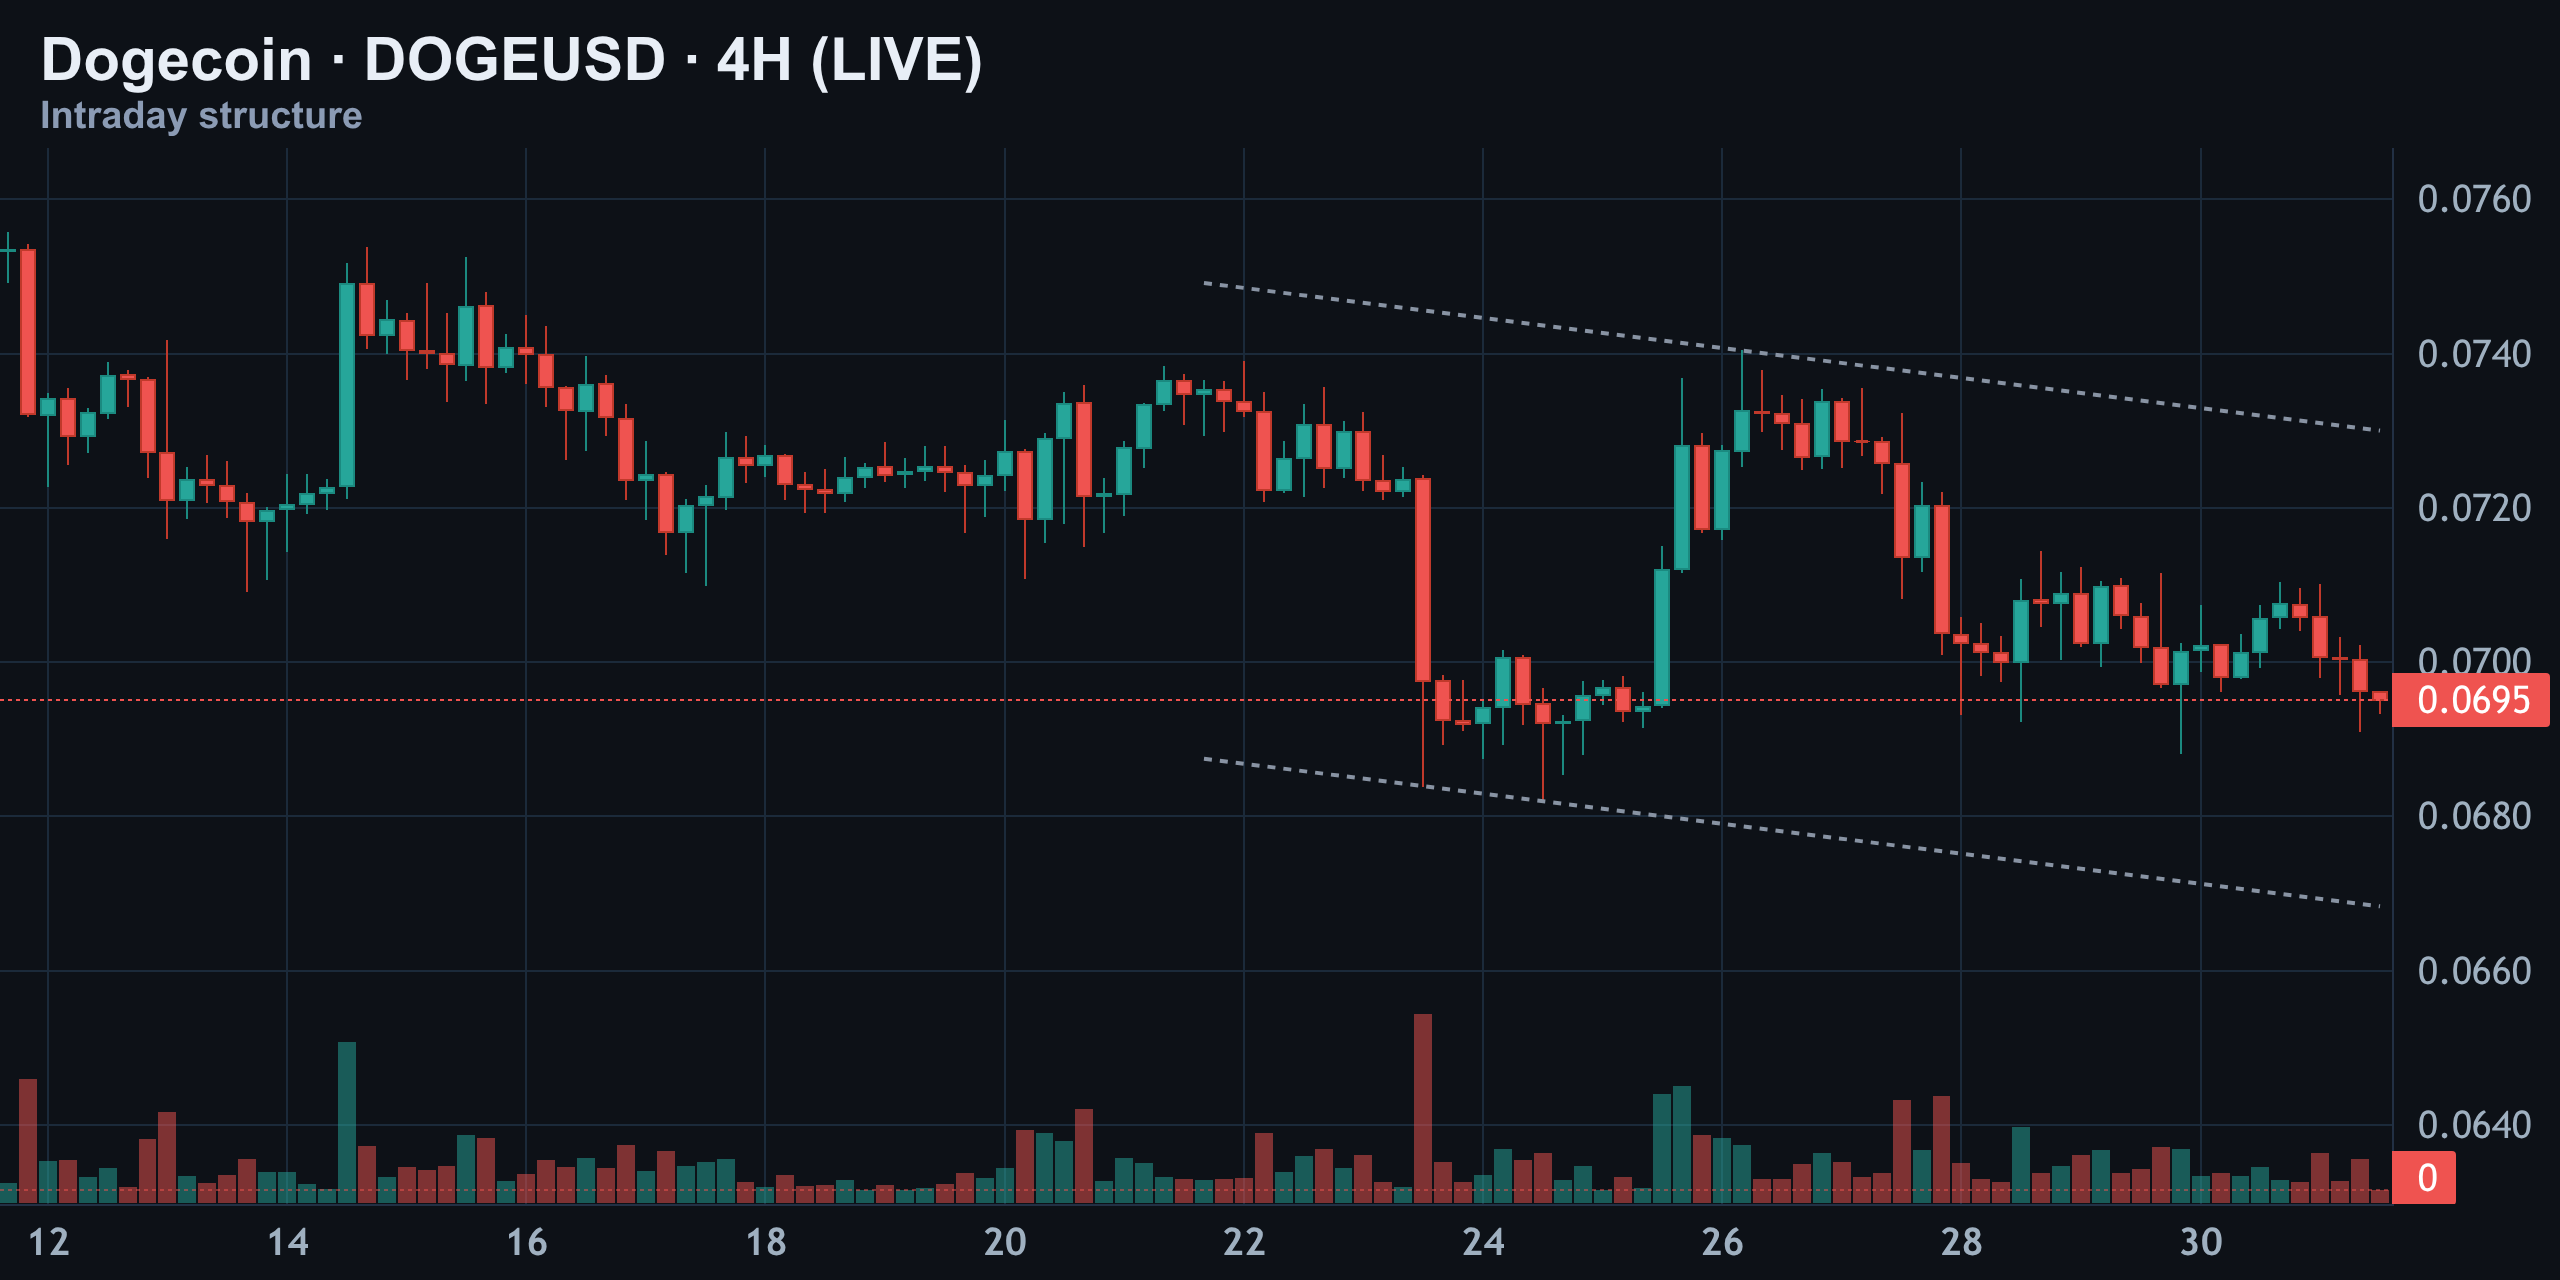
The spike higher on the 26th was the last real relief rally. It failed right at resistance and rolled straight back into the channel — a textbook bull trap. As long as price stays capped under that descending trendline, the 4-hour structure favors sellers on every bounce.
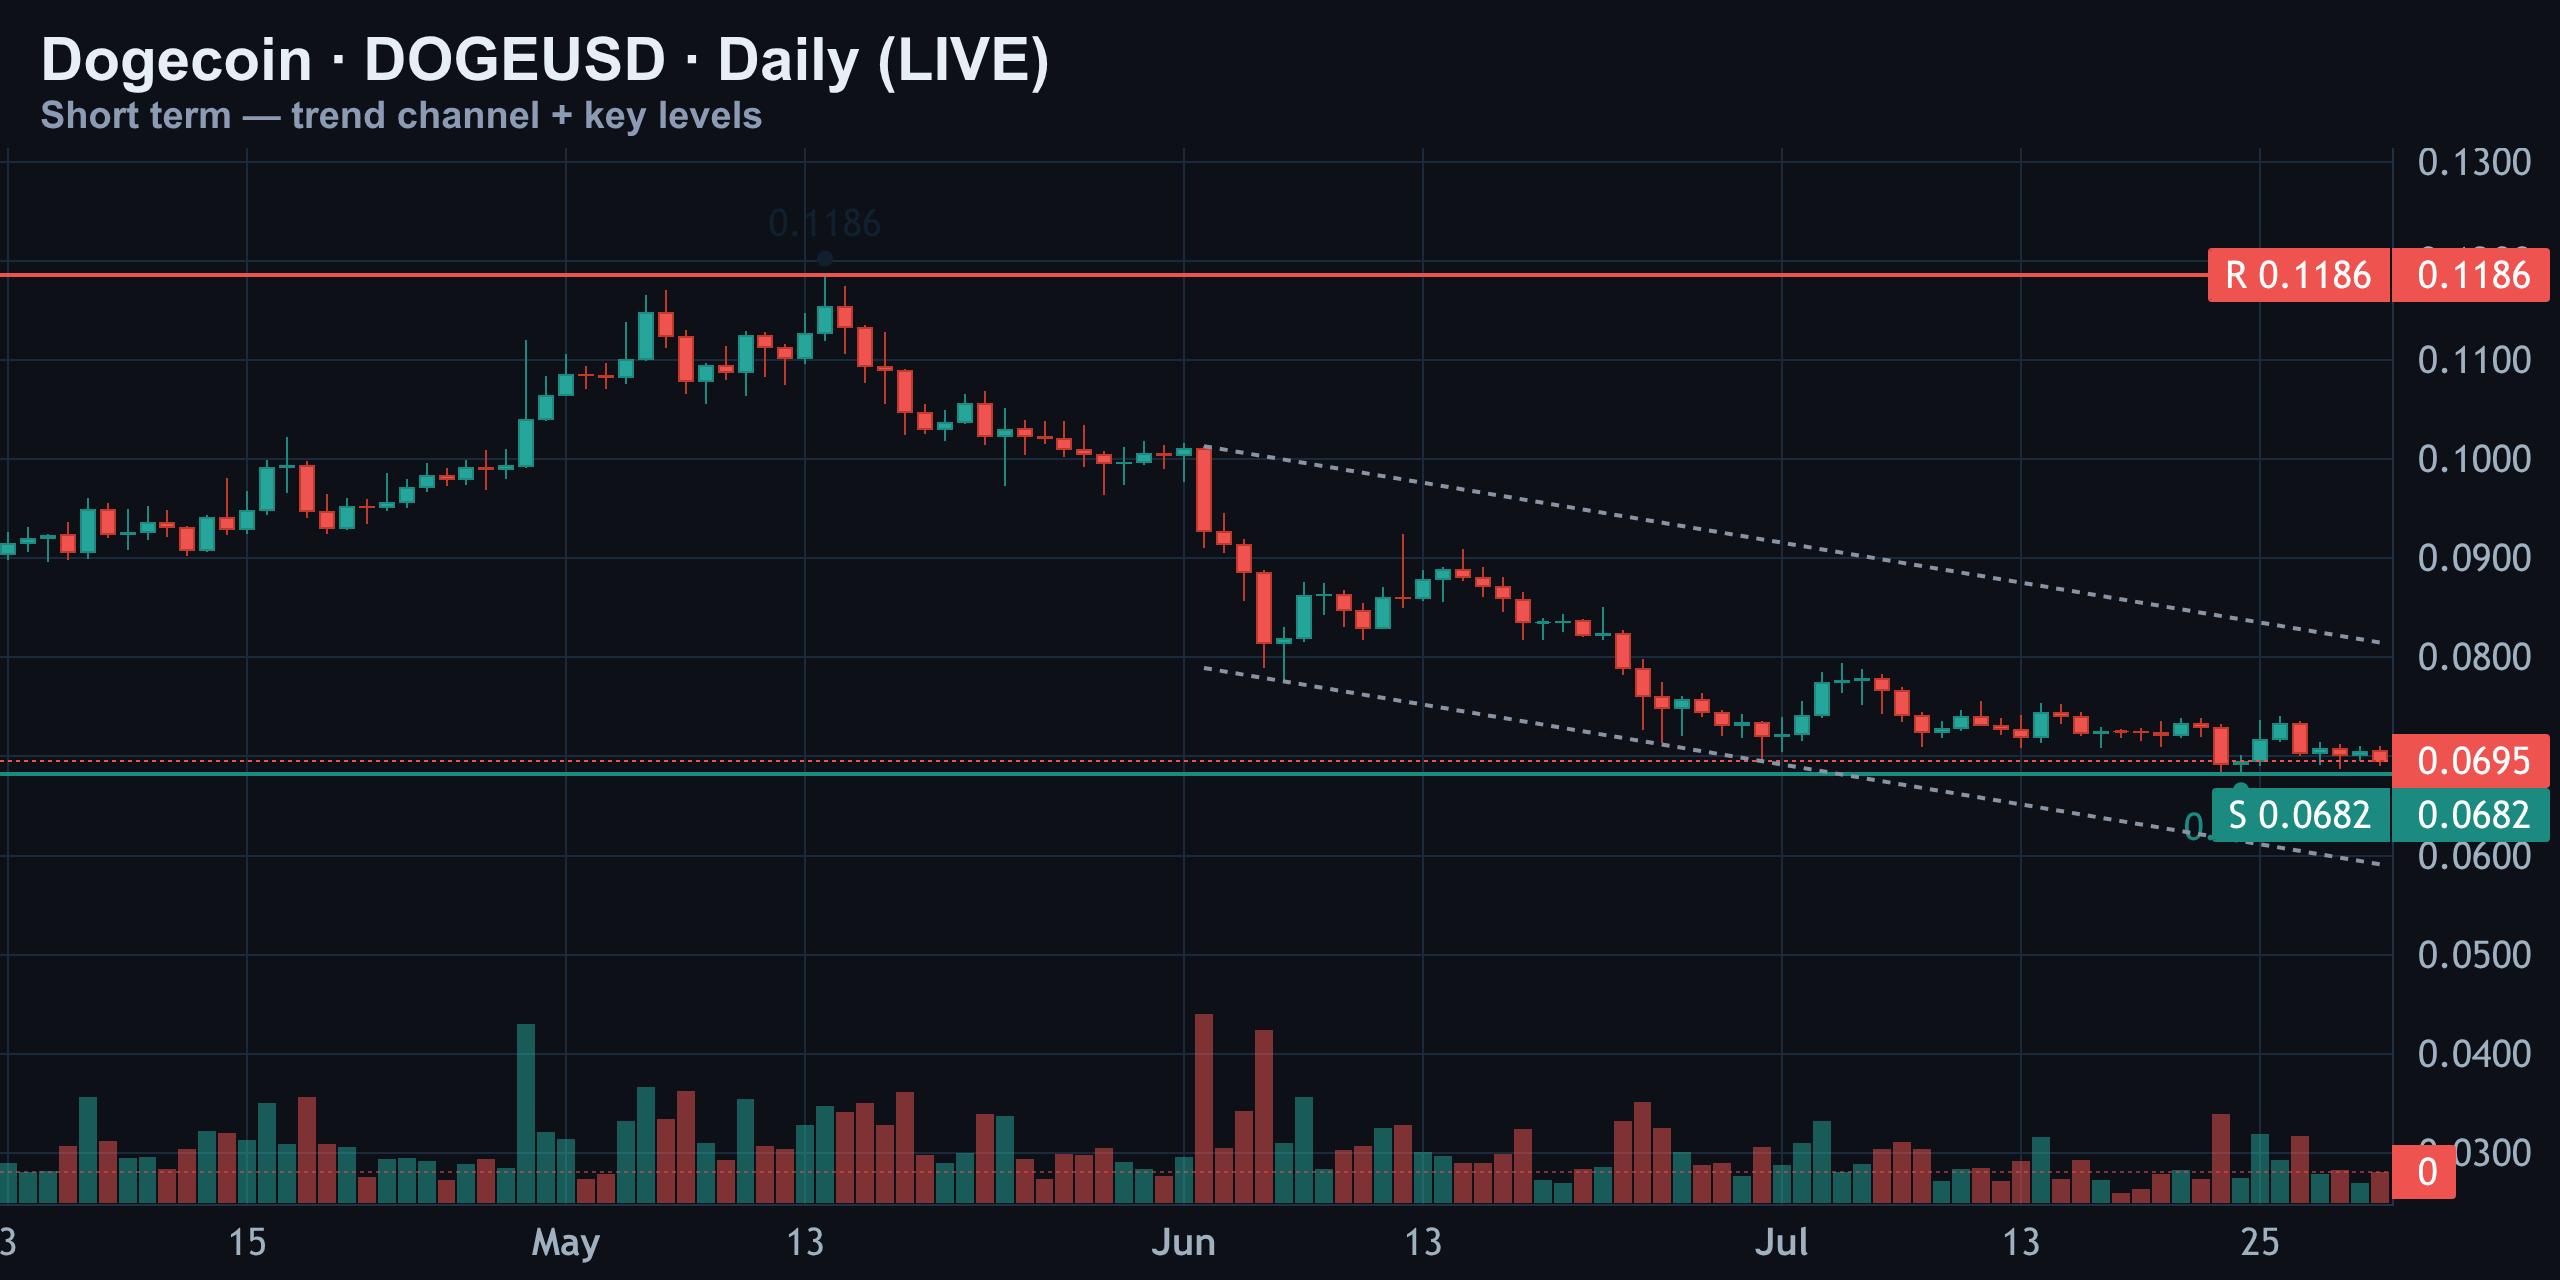
Zooming out further to the daily chart, Dogecoin remains deep inside a downtrend that started at the $0.1186 high back in May. Since then it's been lower highs and lower lows, with $0.0682 acting as the floor for the last few weeks. Price is currently pinned just above that support, squeezed inside a narrowing daily channel.
| Structural Marker | Level |
|---|---|
| May Swing High (Downtrend Start) | $0.1186 |
| 4H Channel Top (Rejected) | $0.074 |
| Daily Support Floor | $0.0682 |
| Current Price | $0.0694 |
Momentum Check: RSI Neutral, MACD's Fragile Cross
The daily RSI (14) is reading 39 right now — neutral, not oversold, not overbought. What's notable is that on the last two bounce attempts, RSI couldn't even reclaim the 50 line, meaning buyers keep running out of steam before momentum turns genuinely positive.
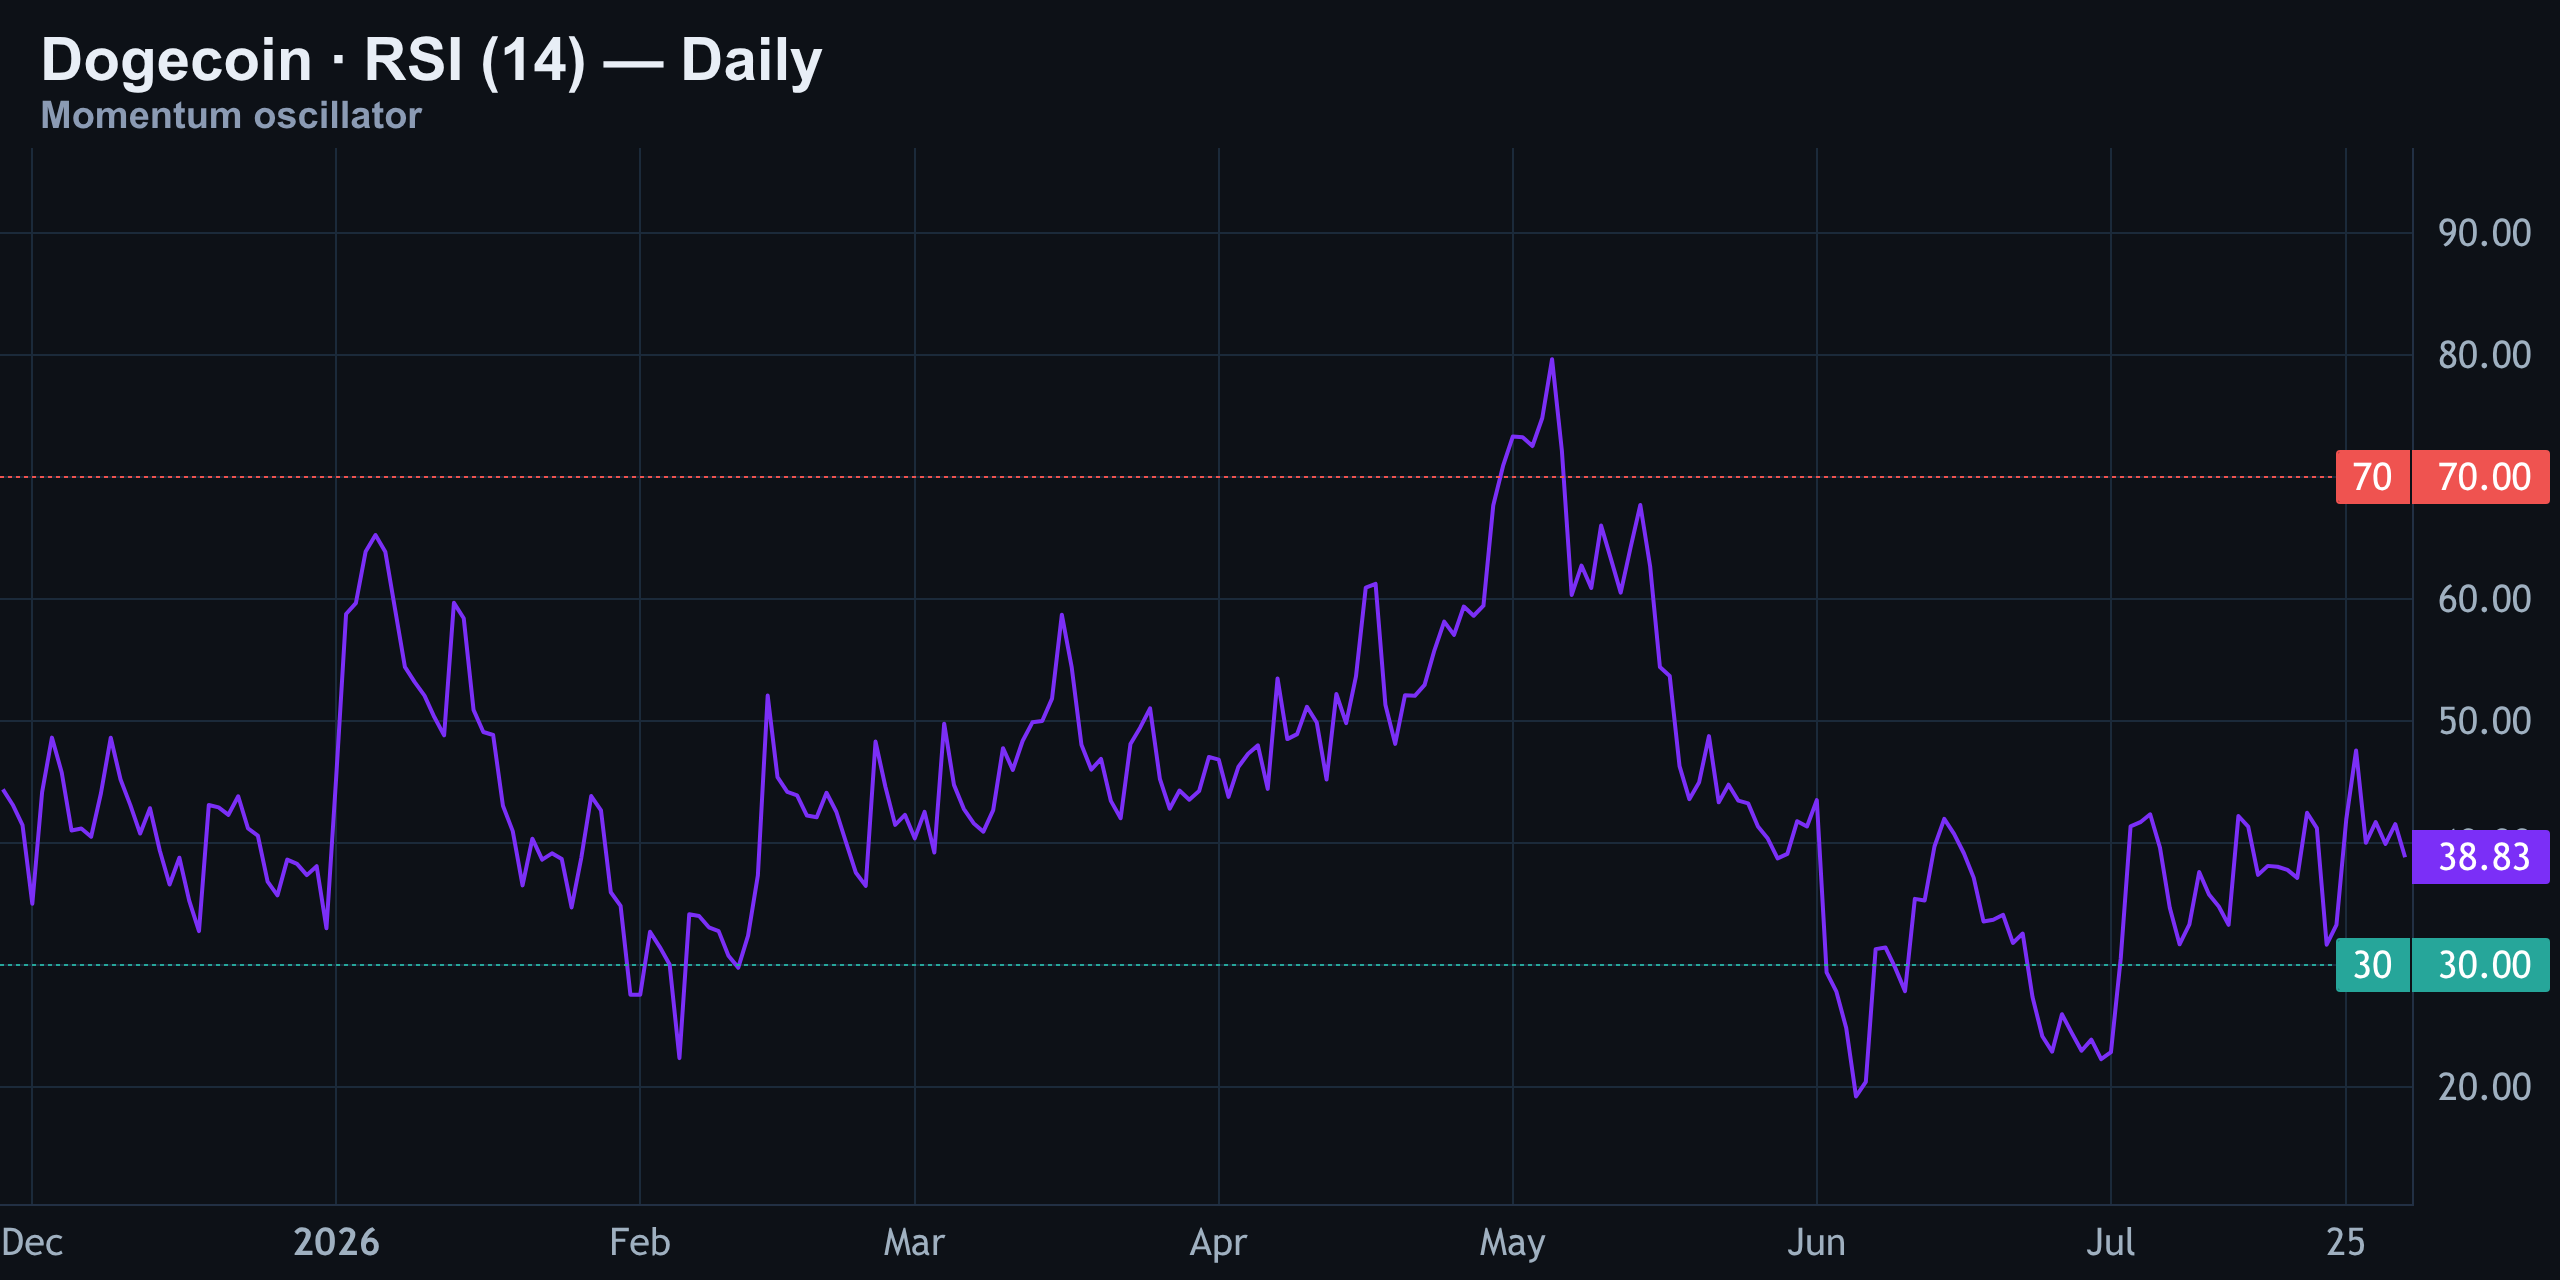
Compare that to early May, when RSI spiked all the way to 80 during the euphoric run to new highs. That's a huge comedown in momentum, and it tells you this market hasn't earned the right to be called bullish yet.
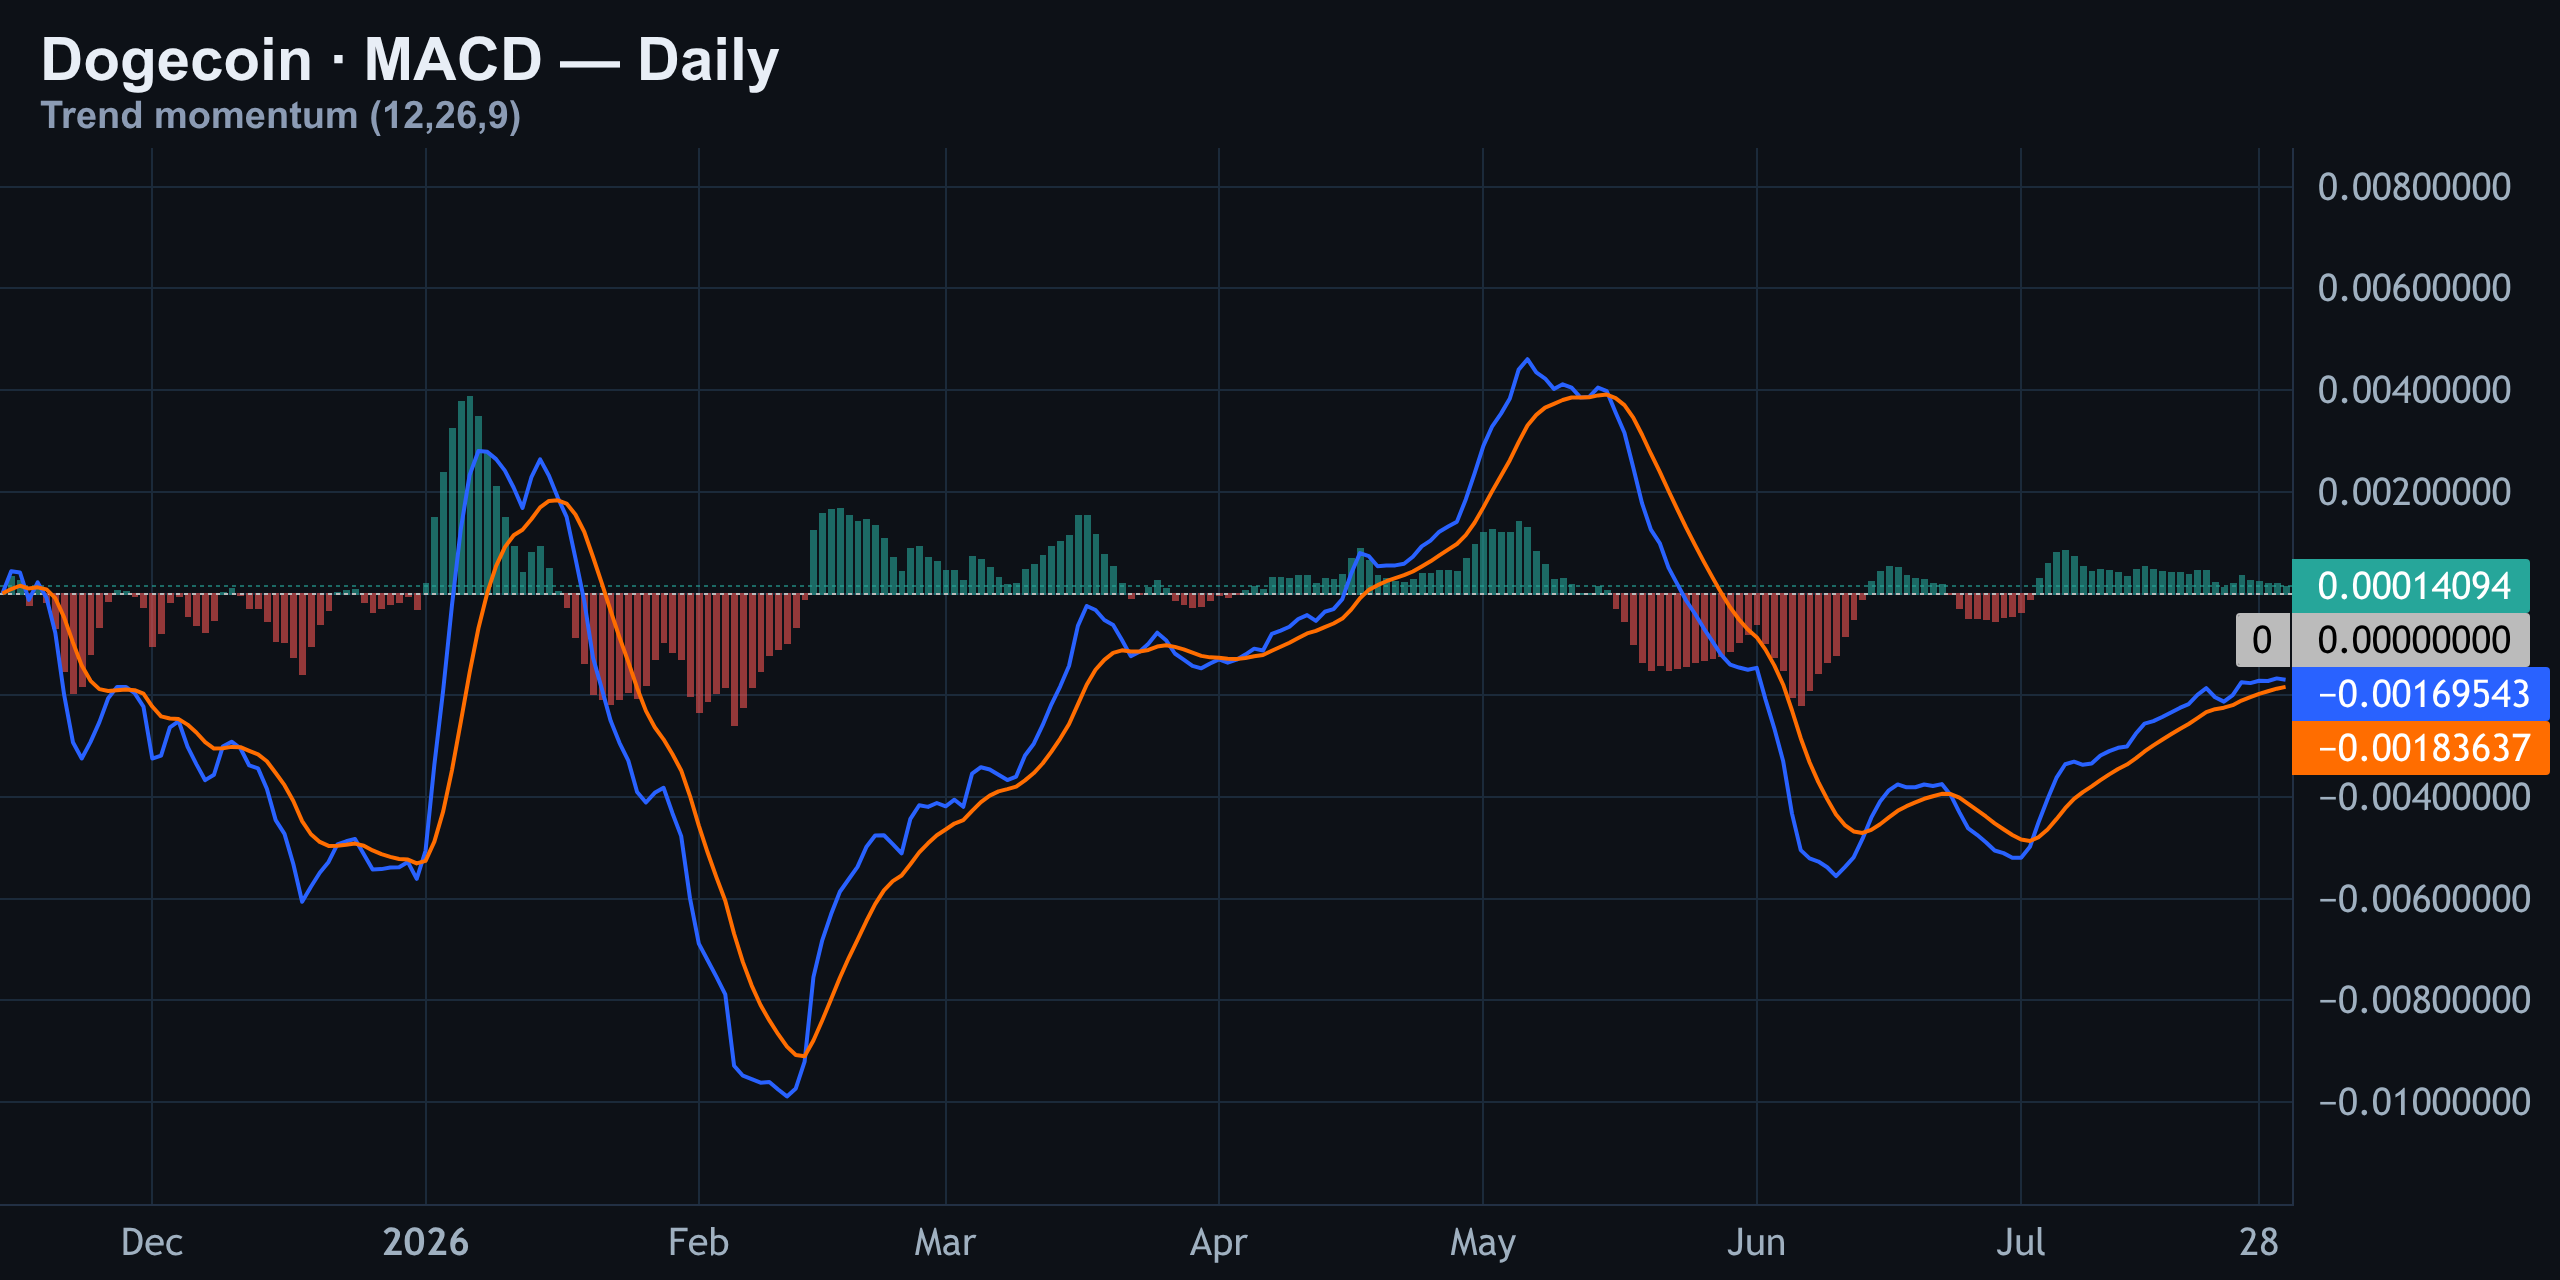
MACD just gave a bullish crossover, with the MACD line ticking above the signal line and the histogram turning slightly positive. But don't get excited — both lines are still sitting below the zero line, which is a bounce within a larger downtrend, not a trend reversal.
Order Flow, Positioning & the Liquidation Trap
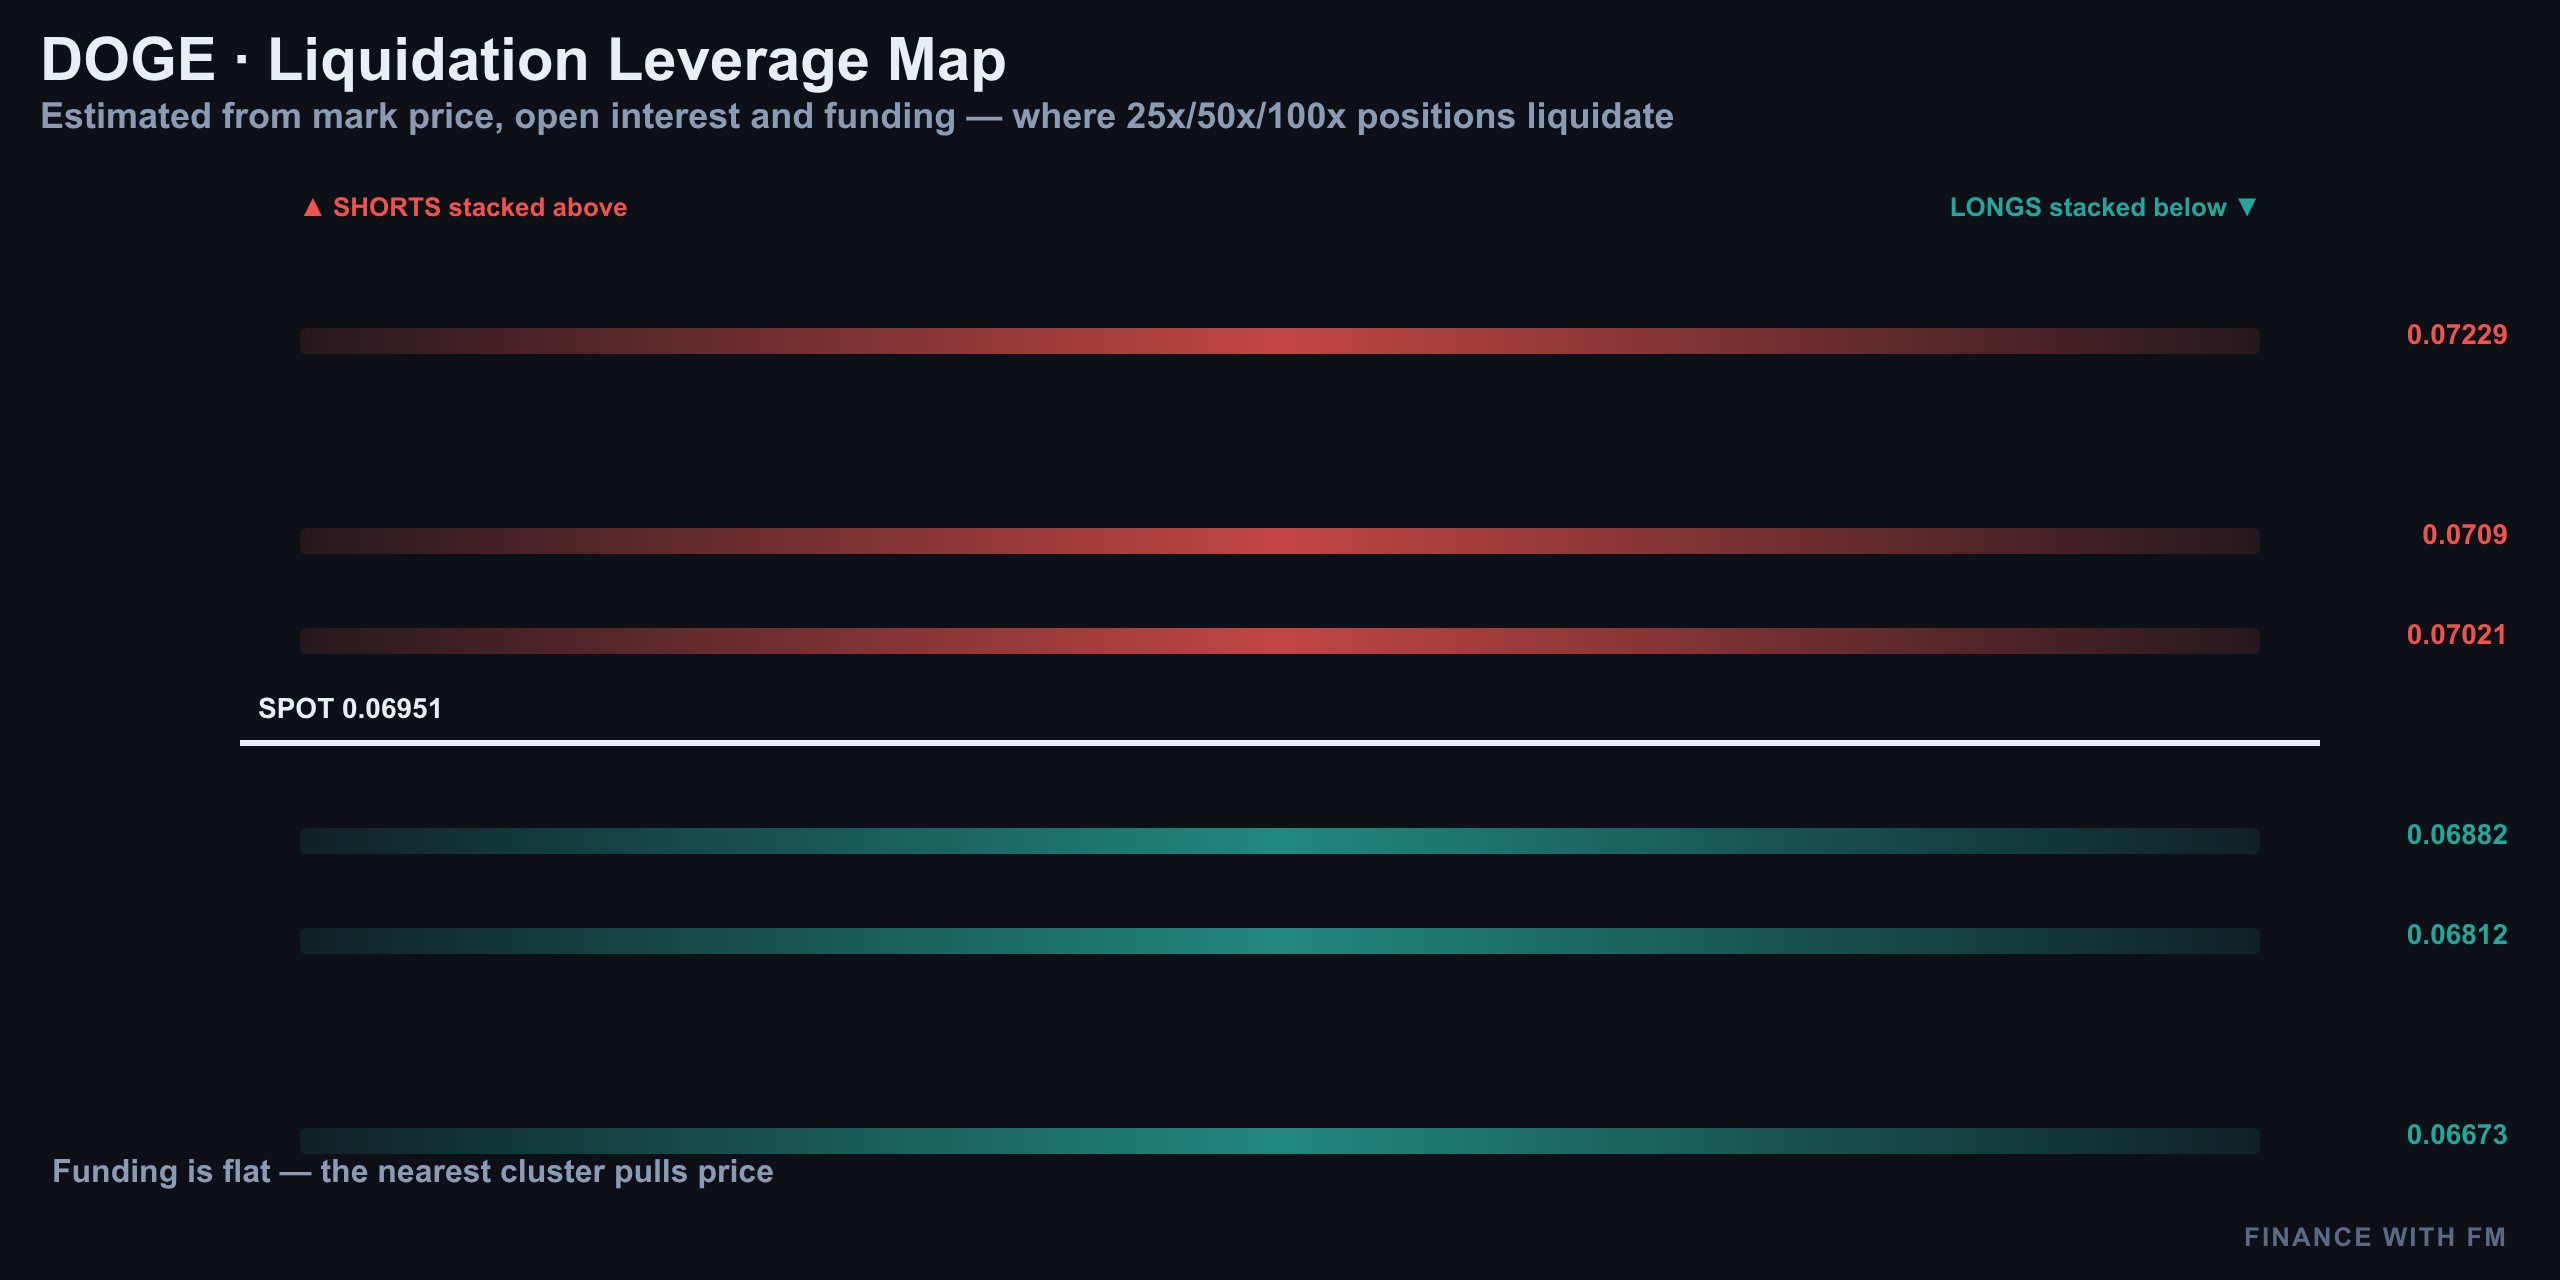
Here's where it gets interesting. There's a liquidation pool sitting just below spot that barely anyone's watching — a cluster of leveraged longs that would get flushed if price slips through nearby support. That's the trap sitting right under this market's feet.
| Metric | Reading | What It Means |
|---|---|---|
| Retail Positioning (Binance) | 2.91x long | Retail piled in long, no capitulation |
| Top Trader Positioning | 2.48x long | Smart money aligned with retail — no clean fade |
| Funding Rate | +0.0015% (near neutral) | Leverage isn't skewed hard either way |
| Open Interest (7-day) | -5% | De-risking, not fresh conviction building |
| Taker Flow | 0.91 | Aggressive selling into every bounce |
| Coinbase Premium | -0.115% | US spot side is selling, not buying |
Funding sitting near neutral means leverage isn't stretched in either direction right now. But open interest dropping almost 5% in a week is a de-risking signal, not a build-up of conviction — traders are stepping back, not doubling down.
The real tell is the Coinbase premium, a proxy for US institutional and retail spot demand. It's trading negative at -0.115% versus Binance, meaning American money is quietly the side selling into this bounce, not buying it. A persistent positive premium is normally the fingerprint of real US spot demand — and that fingerprint simply isn't here.
Levels to Watch
Every level below is doing real work on the chart right now. This is the map for the next 24 hours.
| Level Type | Price | Significance |
|---|---|---|
| Major Resistance / Ask Wall | $0.0700 | Heavy sell orders stacked here |
| Intraday Pivot | $0.0695 | Flipping support/resistance all session |
| Daily Support | $0.0682 | Multi-week downtrend floor |
| Major Bid Wall | $0.0650 | Large resting buy orders |
| Invalidation (Bias Flip) | $0.0713 | A close above this kills the bearish setup |
| Downside Target | $0.0664 | Objective if support breaks |
The Trade Plan (1:2.5) — Not Financial Advice
Based on everything above — a descending 4-hour channel, neutral-but-fragile momentum, falling open interest, aggressive taker selling, and a negative Coinbase premium — the desk's lean stays short-biased on rallies into resistance.
| Parameter | Level |
|---|---|
| Entry Zone | $0.0700 – $0.0702 (rejection at resistance) |
| Stop Loss | $0.0713 (above invalidation) |
| Target | $0.0664 |
| Approx. Risk:Reward | 1:2.5 |
This mirrors the same structure as last week's still-live short — nothing about the macro picture has flipped enough to change the plan, only enough to confirm patience. If Dogecoin instead closes decisively above $0.0713, the setup is invalidated and the bias should flip flat-to-bullish, not stubbornly bearish.
Summary: A Coiled Spring, Not a Trend Yet
Dogecoin at $0.0694 is a market holding its breath. Retail is long almost three-to-one, open interest is quietly deflating, taker flow keeps selling every bounce, and American spot money is a net seller right now via the Coinbase premium. None of that screams reversal — it screams distribution into strength.
The wedge on the 15-minute chart, the descending channel on the 4-hour, and the narrowing range on the daily are all pointing to the same conclusion: Dogecoin is coiled tight and close to a decisive move. Until $0.07 is reclaimed and held, the path of least resistance stays lower, with $0.0664 as the next real magnet for price.
Analysis and education, not investment advice. See our editorial policy.