Daily market analysis
Stellar (XLM) technical analysis today
Last updated
XLM Daily Pulse Aug 18: Crowded Shorts, Key Level to Watch
Where We Left It: Yesterday's Short Paid Off
Yesterday's Daily Pulse called a short on XLM from $0.1596, with a stop at $0.1613 and a target at $0.1553. That target was reached. Price has since drifted from around $0.1581 down to today's $0.1551 — roughly a 2% slide that confirms the bears were in control right where the call said they'd be.
| Item | Level |
|---|---|
| Entry (short) | $0.1596 |
| Stop | $0.1613 |
| Target | $0.1553 |
| Result | Target reached ✅ |
Today's setup picks up right where that move left off — watching for the same kind of exhaustion into resistance, but with a new wrinkle: the order book and derivatives data are starting to disagree with the chart.
Today's XLM Snapshot: Down Nearly 2%, Shorts Getting Crowded
XLM is trading around $0.1550 as of this writing, down almost 2% on the day after tapping an intraday low near $0.1525. Structure is still leaning bearish inside a descending channel on the 4-hour timeframe, even though the 15-minute chart shows a small relief bounce trying to form.
Momentum is soft, not oversold. Until price reclaims the mid-$0.15s with real conviction, the path of least resistance stays down toward the low-$0.15s and the $0.149 bid wall beneath it.
15-Minute Intraday: A Bounce Inside a Falling Channel
Zooming into today's session, XLM fell sharply from around $0.1580 down toward $0.1540, then carved out a clean descending channel. The last few candles are pressing against the upper rail of that channel, trying to reclaim the $0.155 area.
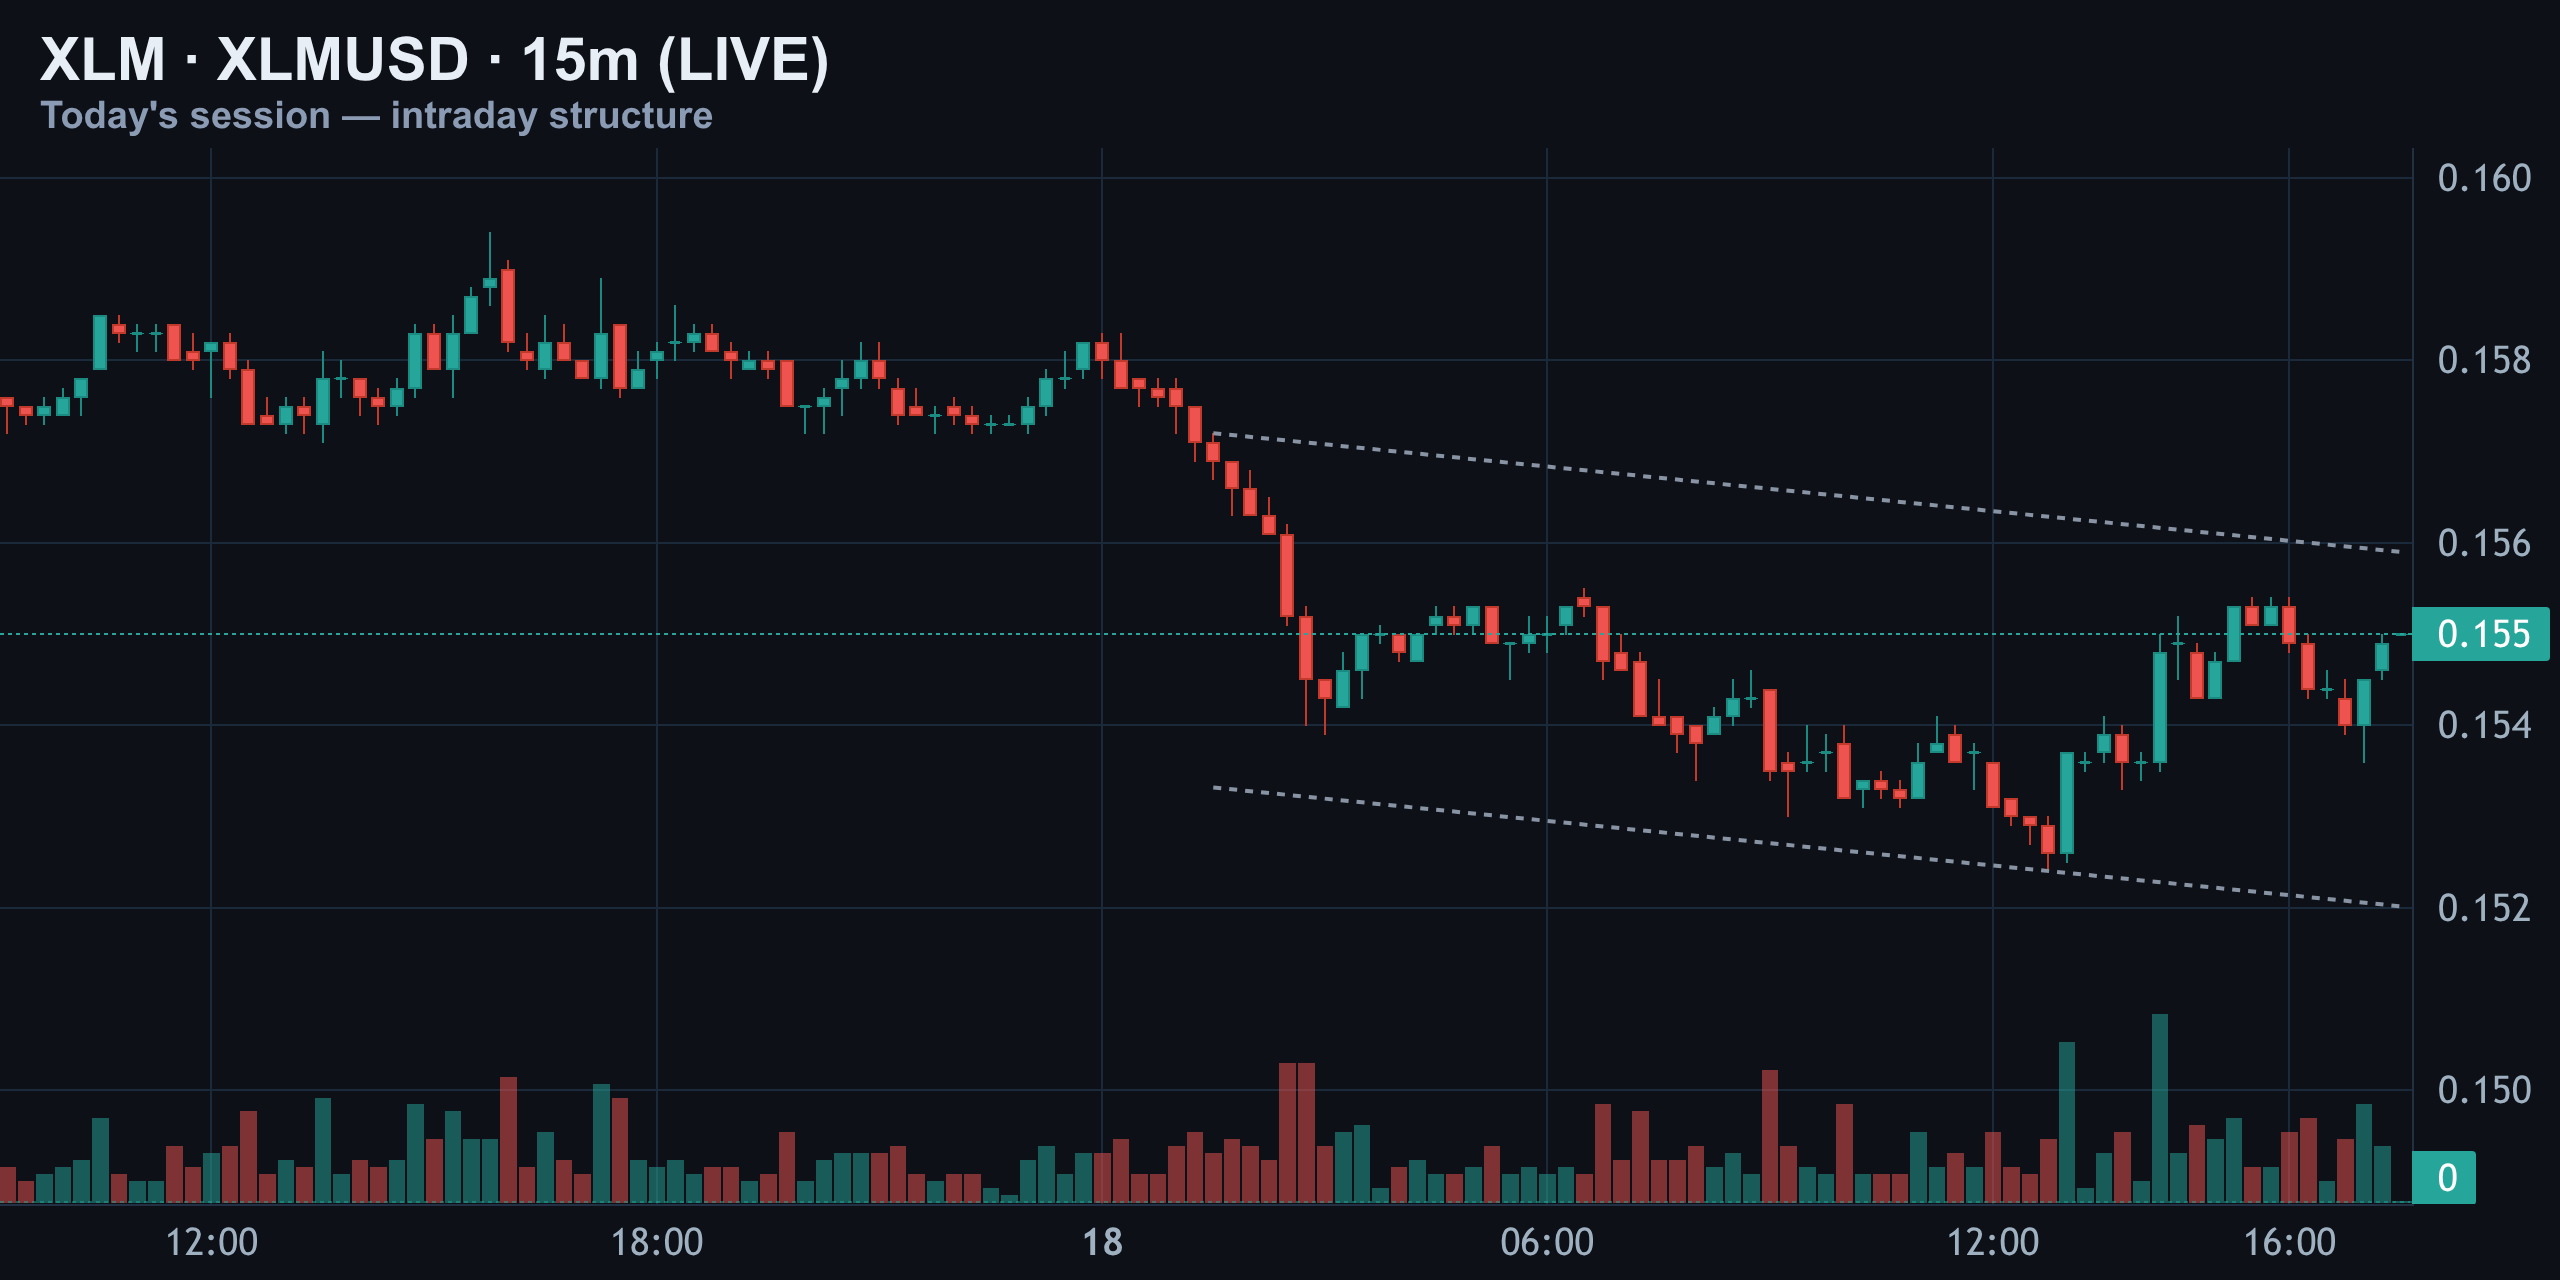
This looks like a relief bounce inside a still-bearish short-term structure, not a reversal yet. The real tell is whether price can close above that channel's top boundary — if it can't, sellers likely step back in fast. In plain terms: price is bouncing a little inside a falling short-term channel.
4-Hour Structure: Lower Highs Still in Control
On the 4-hour chart, the picture is a clean staircase of lower highs going back to the start of the month. XLM broke out of a tighter descending channel just above the $0.155 mark and is now chopping right on that level.
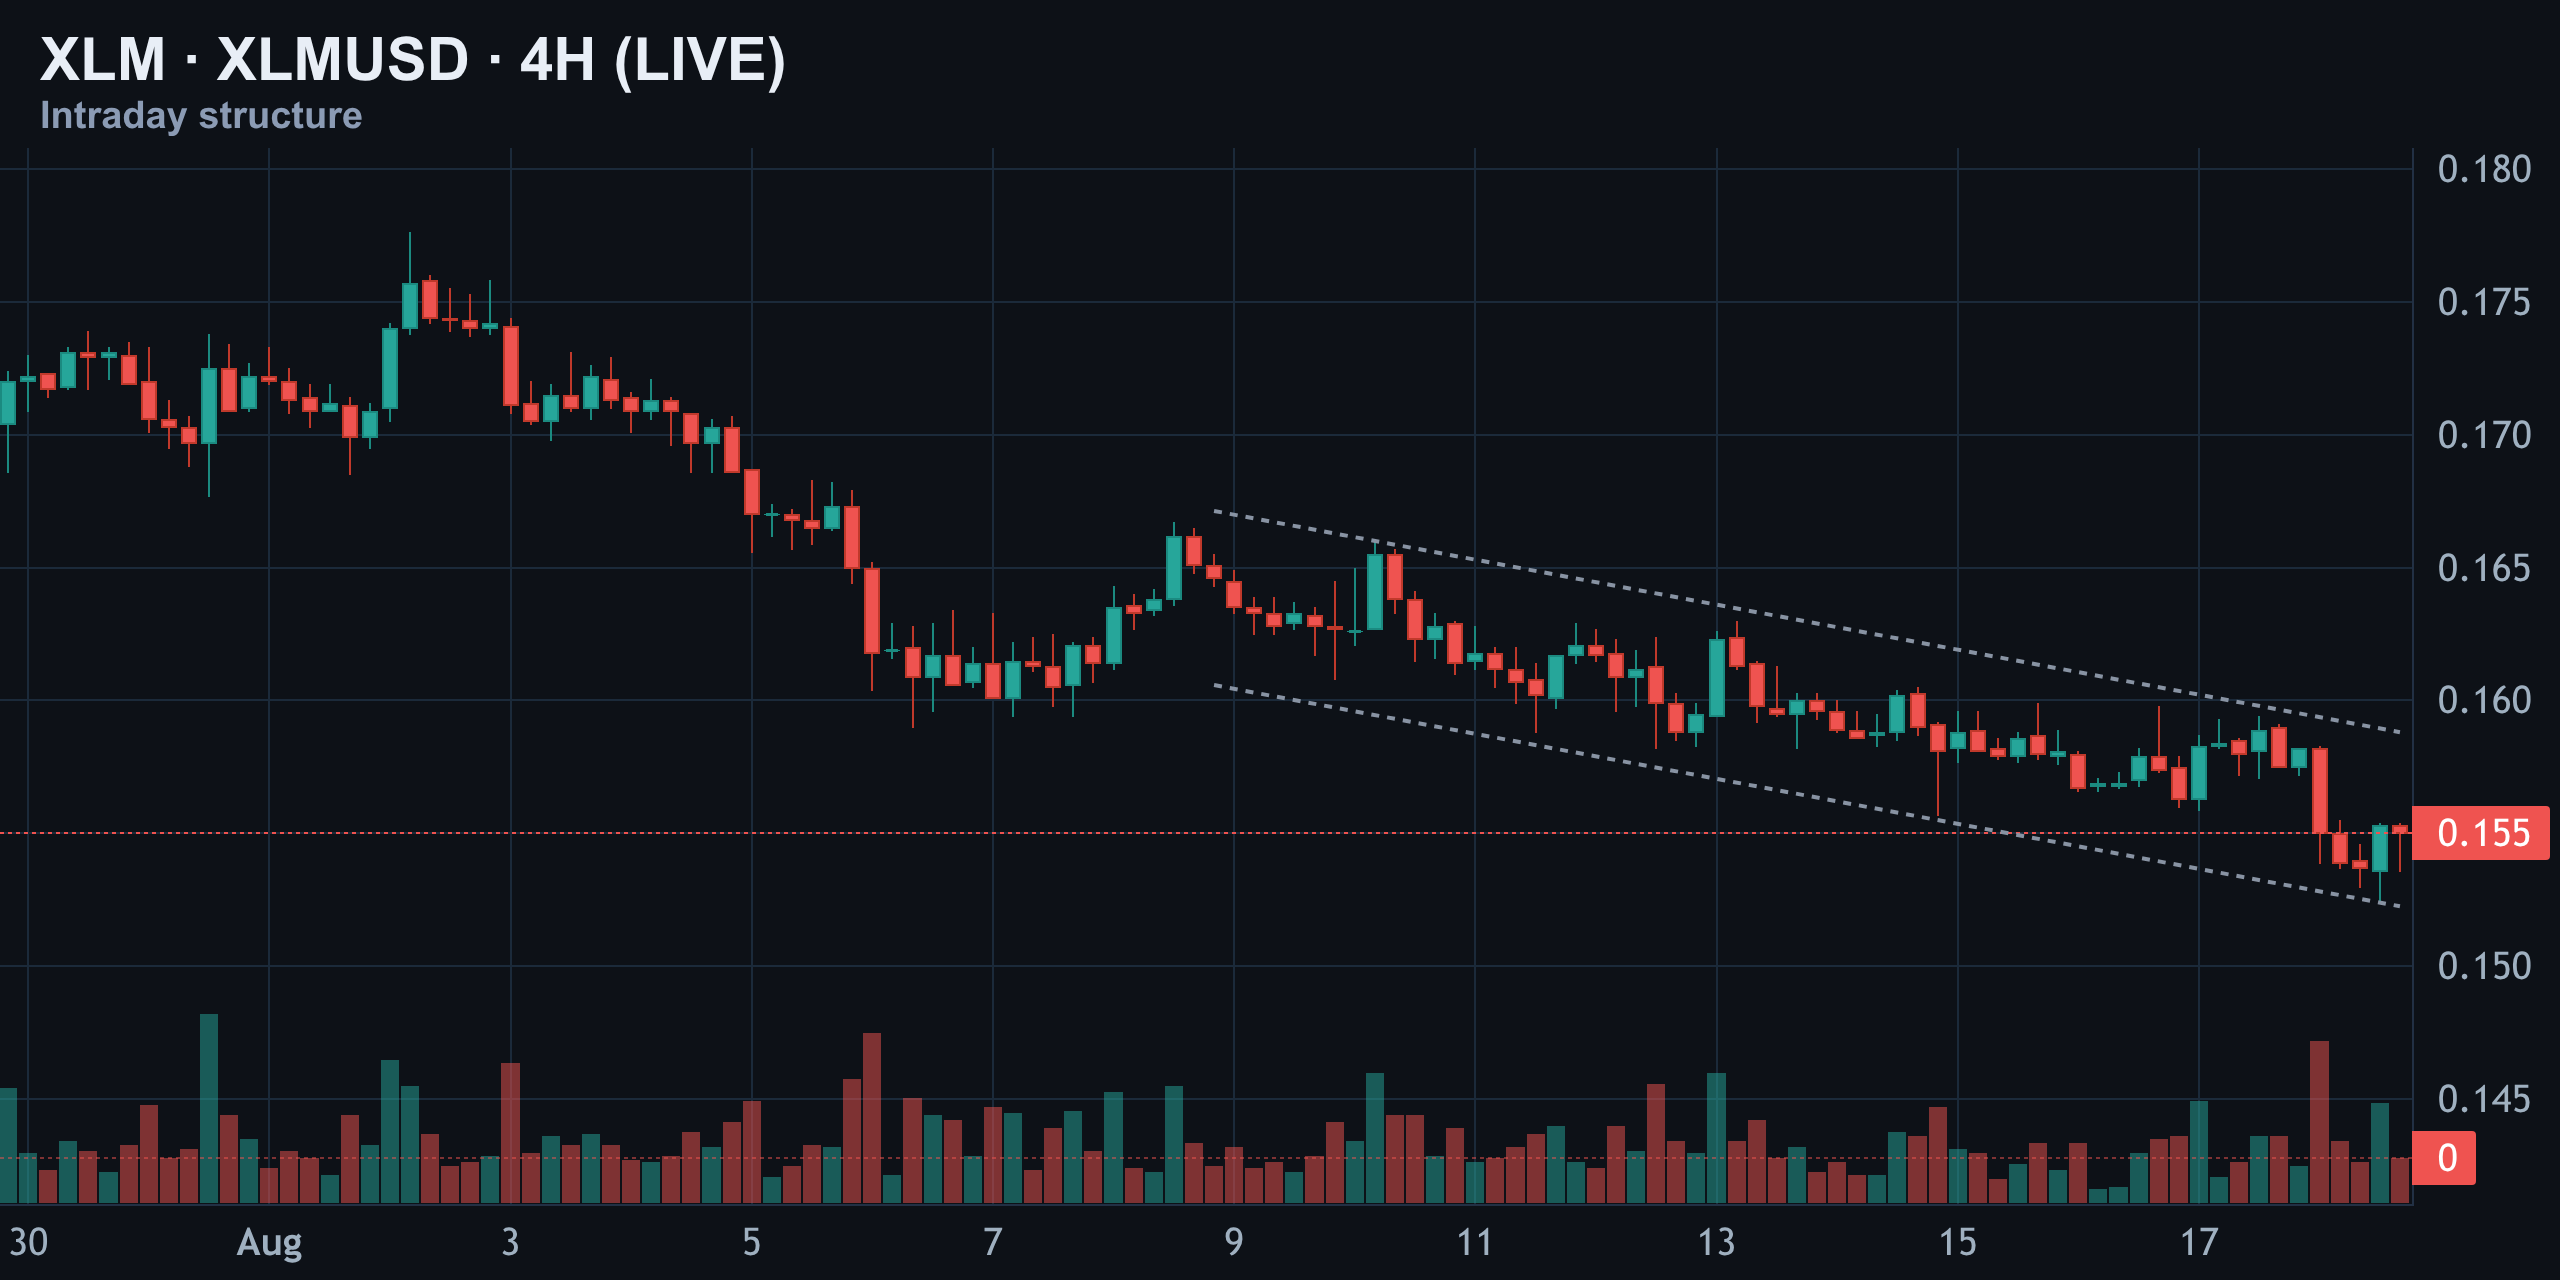
This is the zone that's held multiple times, but each bounce has been weaker than the last. The broader trend is still down, and this pause looks more like consolidation before continuation than a real bottom. In plain terms: the bigger 4-hour trend is still pointing down.
Daily Structure: Boxed Between Two Hard Levels
On the daily, XLM is still living inside a much bigger range, bounded by resistance up near $0.30 and support down near $0.14. Since early August, price has been sliding inside its own descending channel, and it's now sitting almost exactly on the $0.155 level that's acted as a magnet all month.
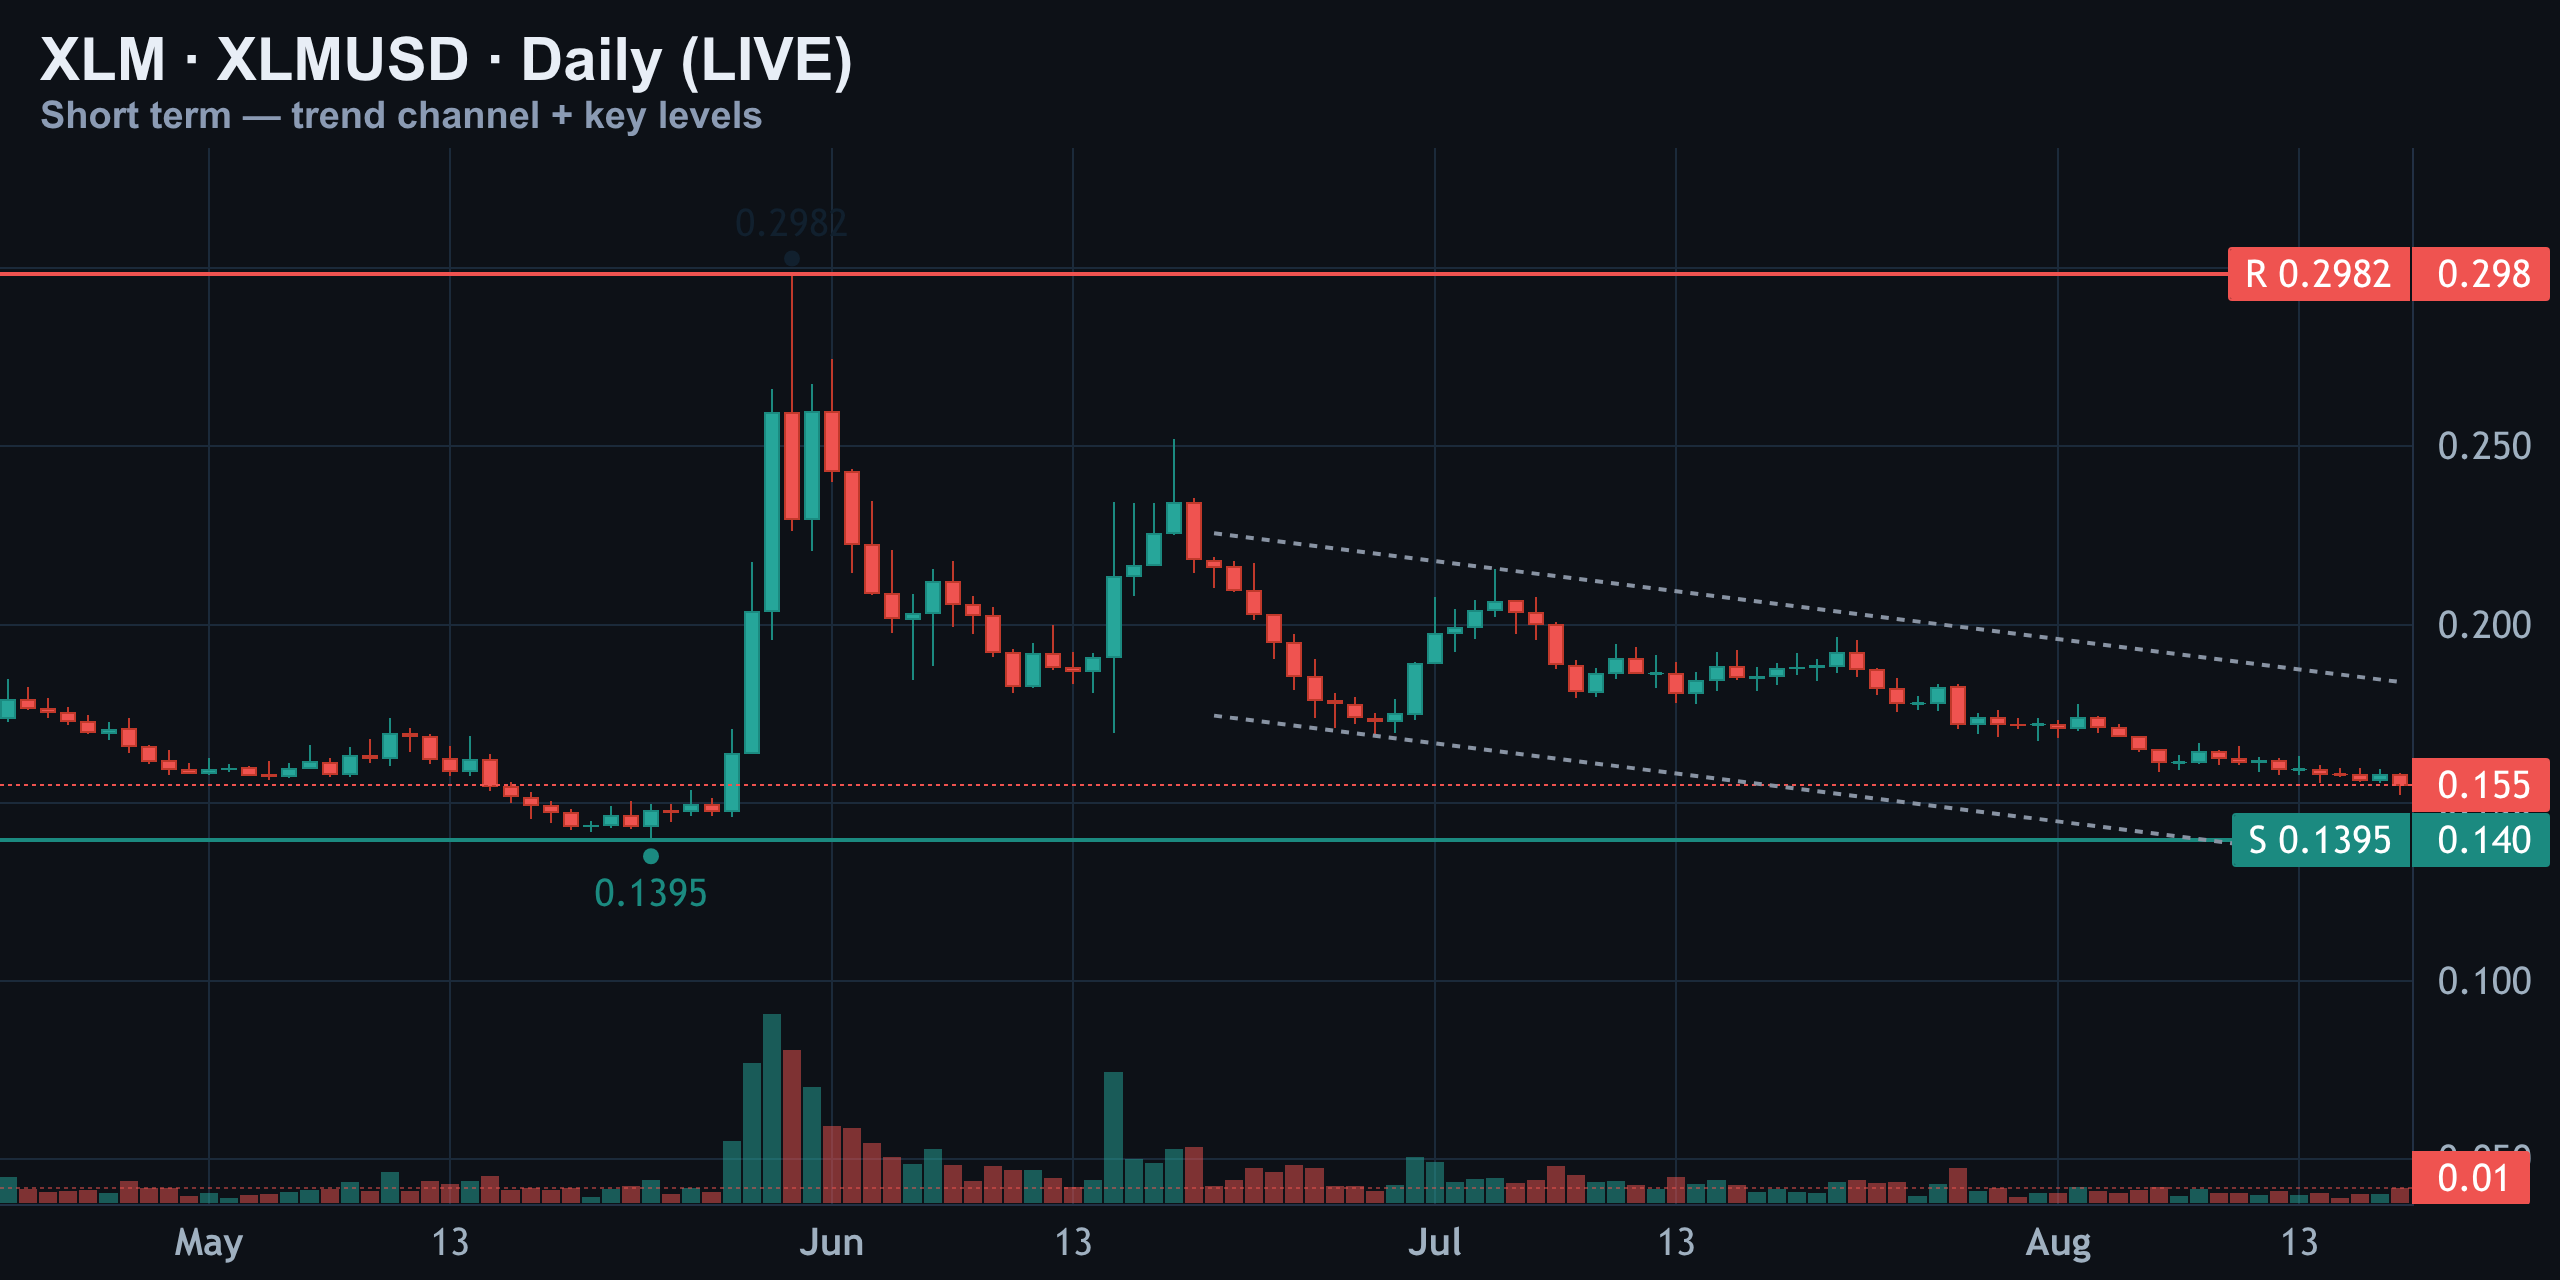
This daily channel is the frame everything else sits inside — until it breaks, dips toward the lower rail stay the base case. In plain terms: XLM is stuck in a slow downtrend inside a bigger range.
Momentum Check: RSI Cooling, MACD Still Bearish
RSI (14) — Cooling Off, Not Yet Oversold
The daily RSI is reading 31 right now — soft momentum but not technically oversold, since that line is drawn at 30. What's notable is there's no bullish divergence here; price and RSI are falling together, which tells you sellers still have control rather than momentum quietly building underneath.
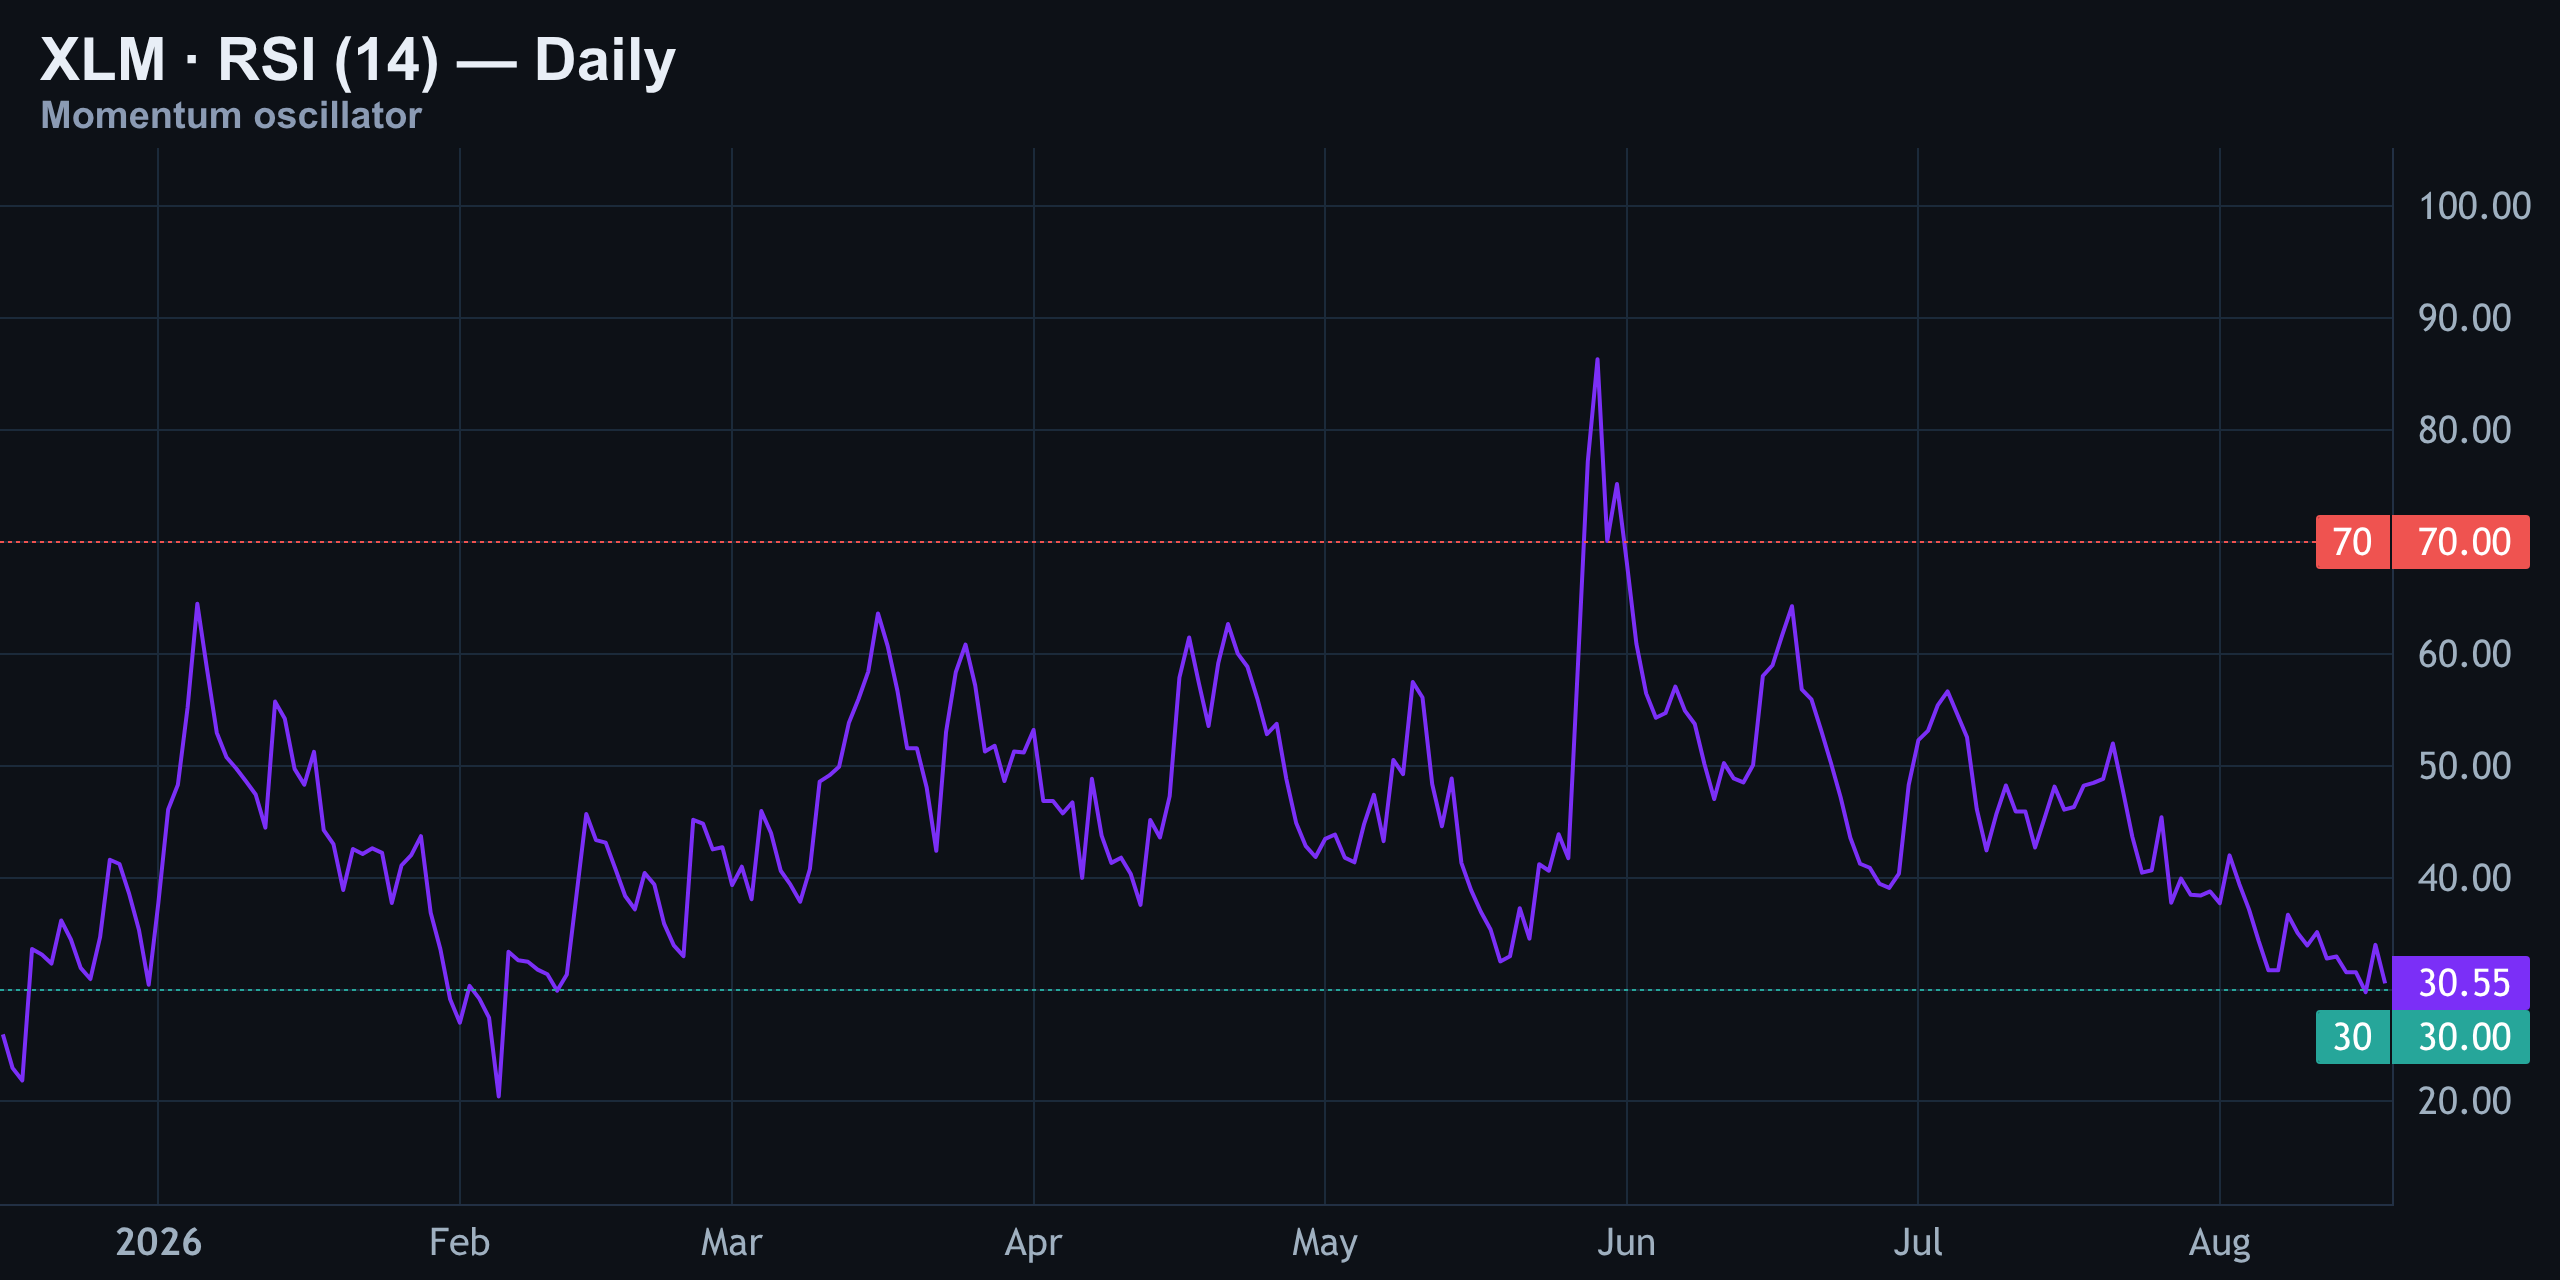
If RSI dips under 30 on the next leg down, that's when you'd start watching for an exhaustion bounce. In plain terms: momentum is weak but not yet at extreme oversold levels.
MACD — Bearish Cross Still Running
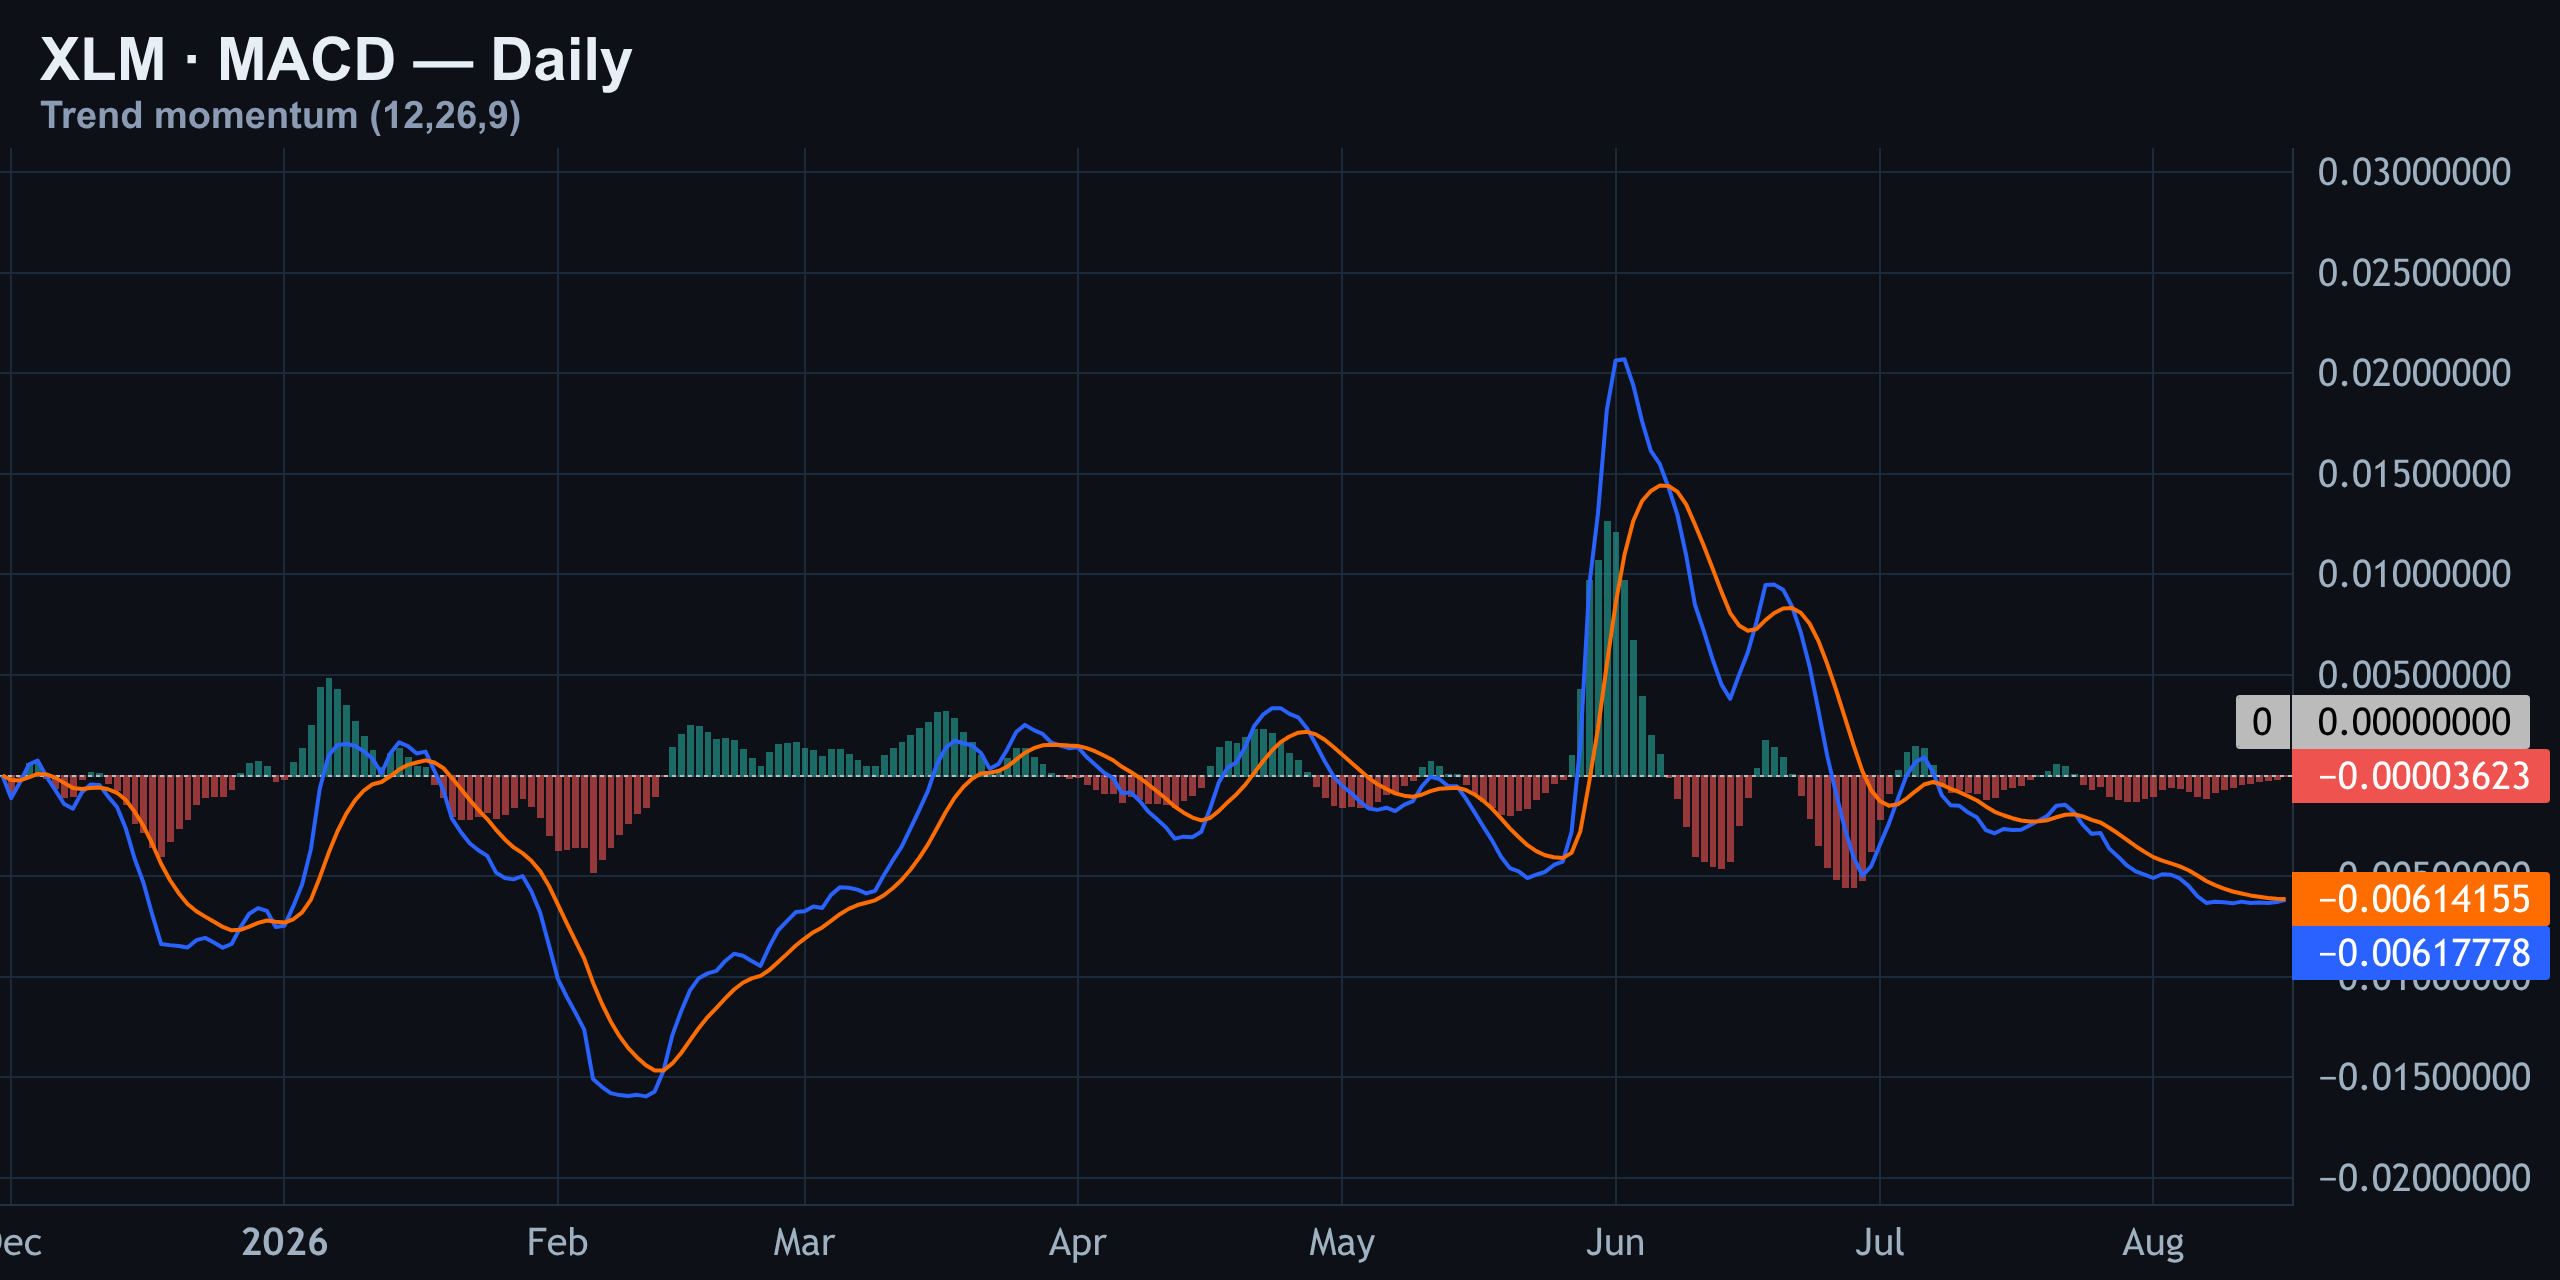
MACD confirms what price is already telling us. The MACD line is running below the signal line, and the histogram bars are negative, meaning sellers still have the momentum edge.
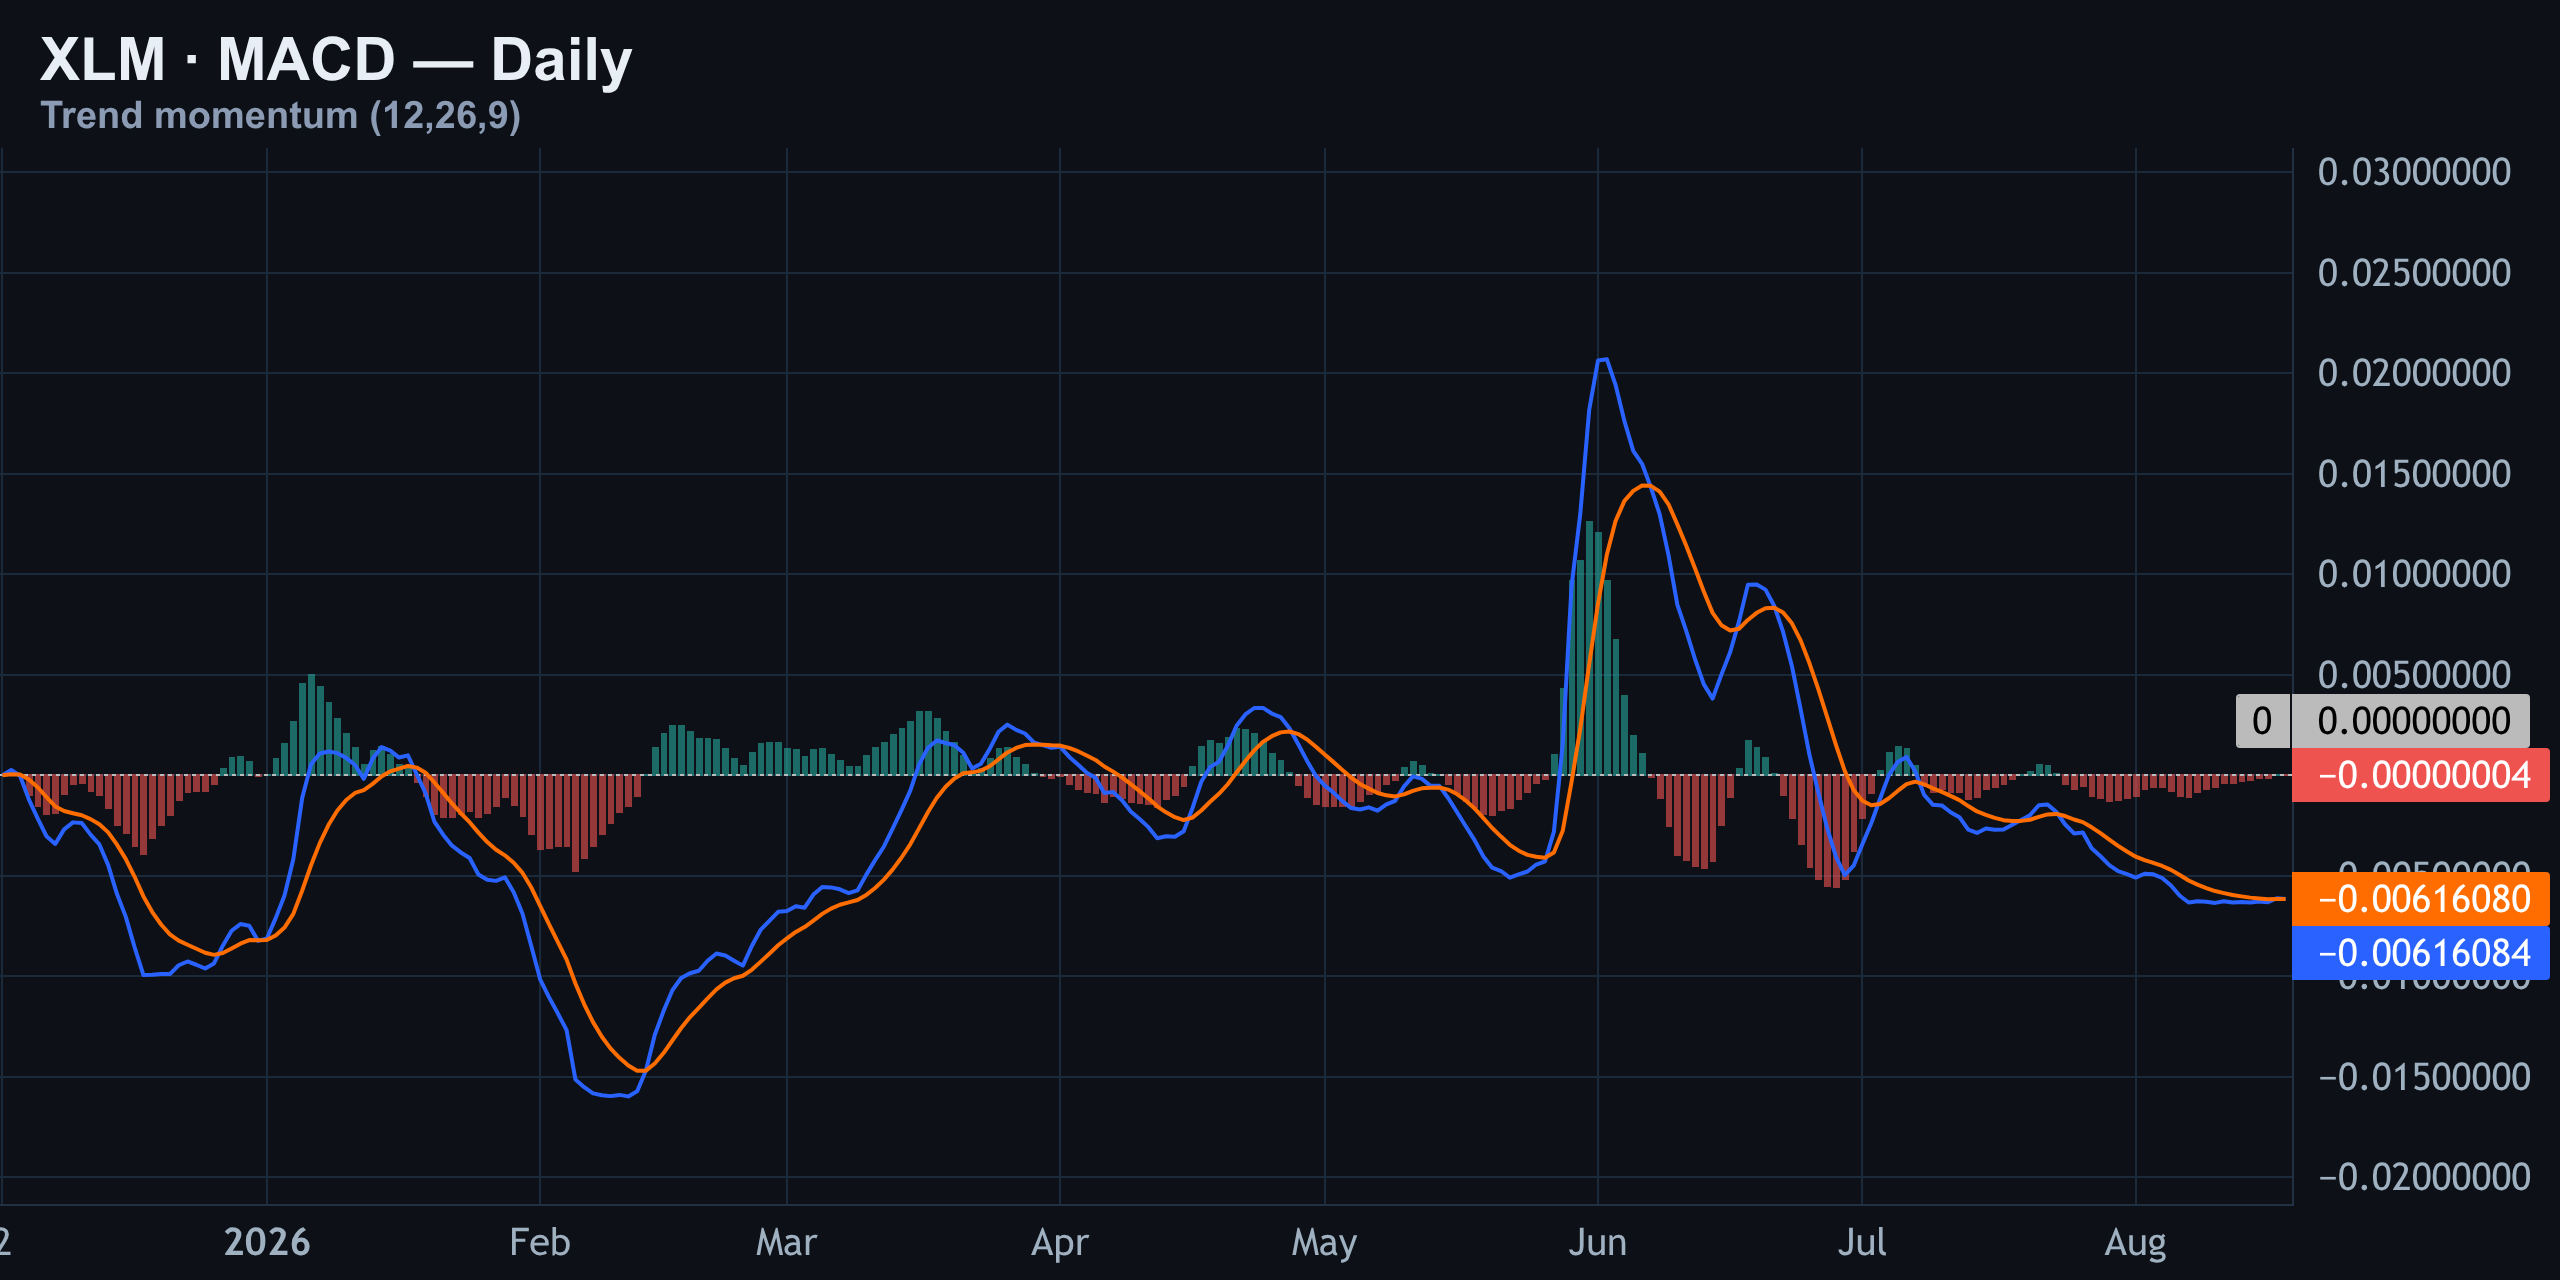
There's a slight flattening in the histogram, which sometimes hints at fading downside pressure, but there's no crossover yet. Until that blue line crosses back above the orange signal line, this indicator is siding with the bears. In plain terms: MACD still favors sellers with no reversal signal yet.
Liquidation Heatmap & Order Flow: The Hidden Squeeze Magnet
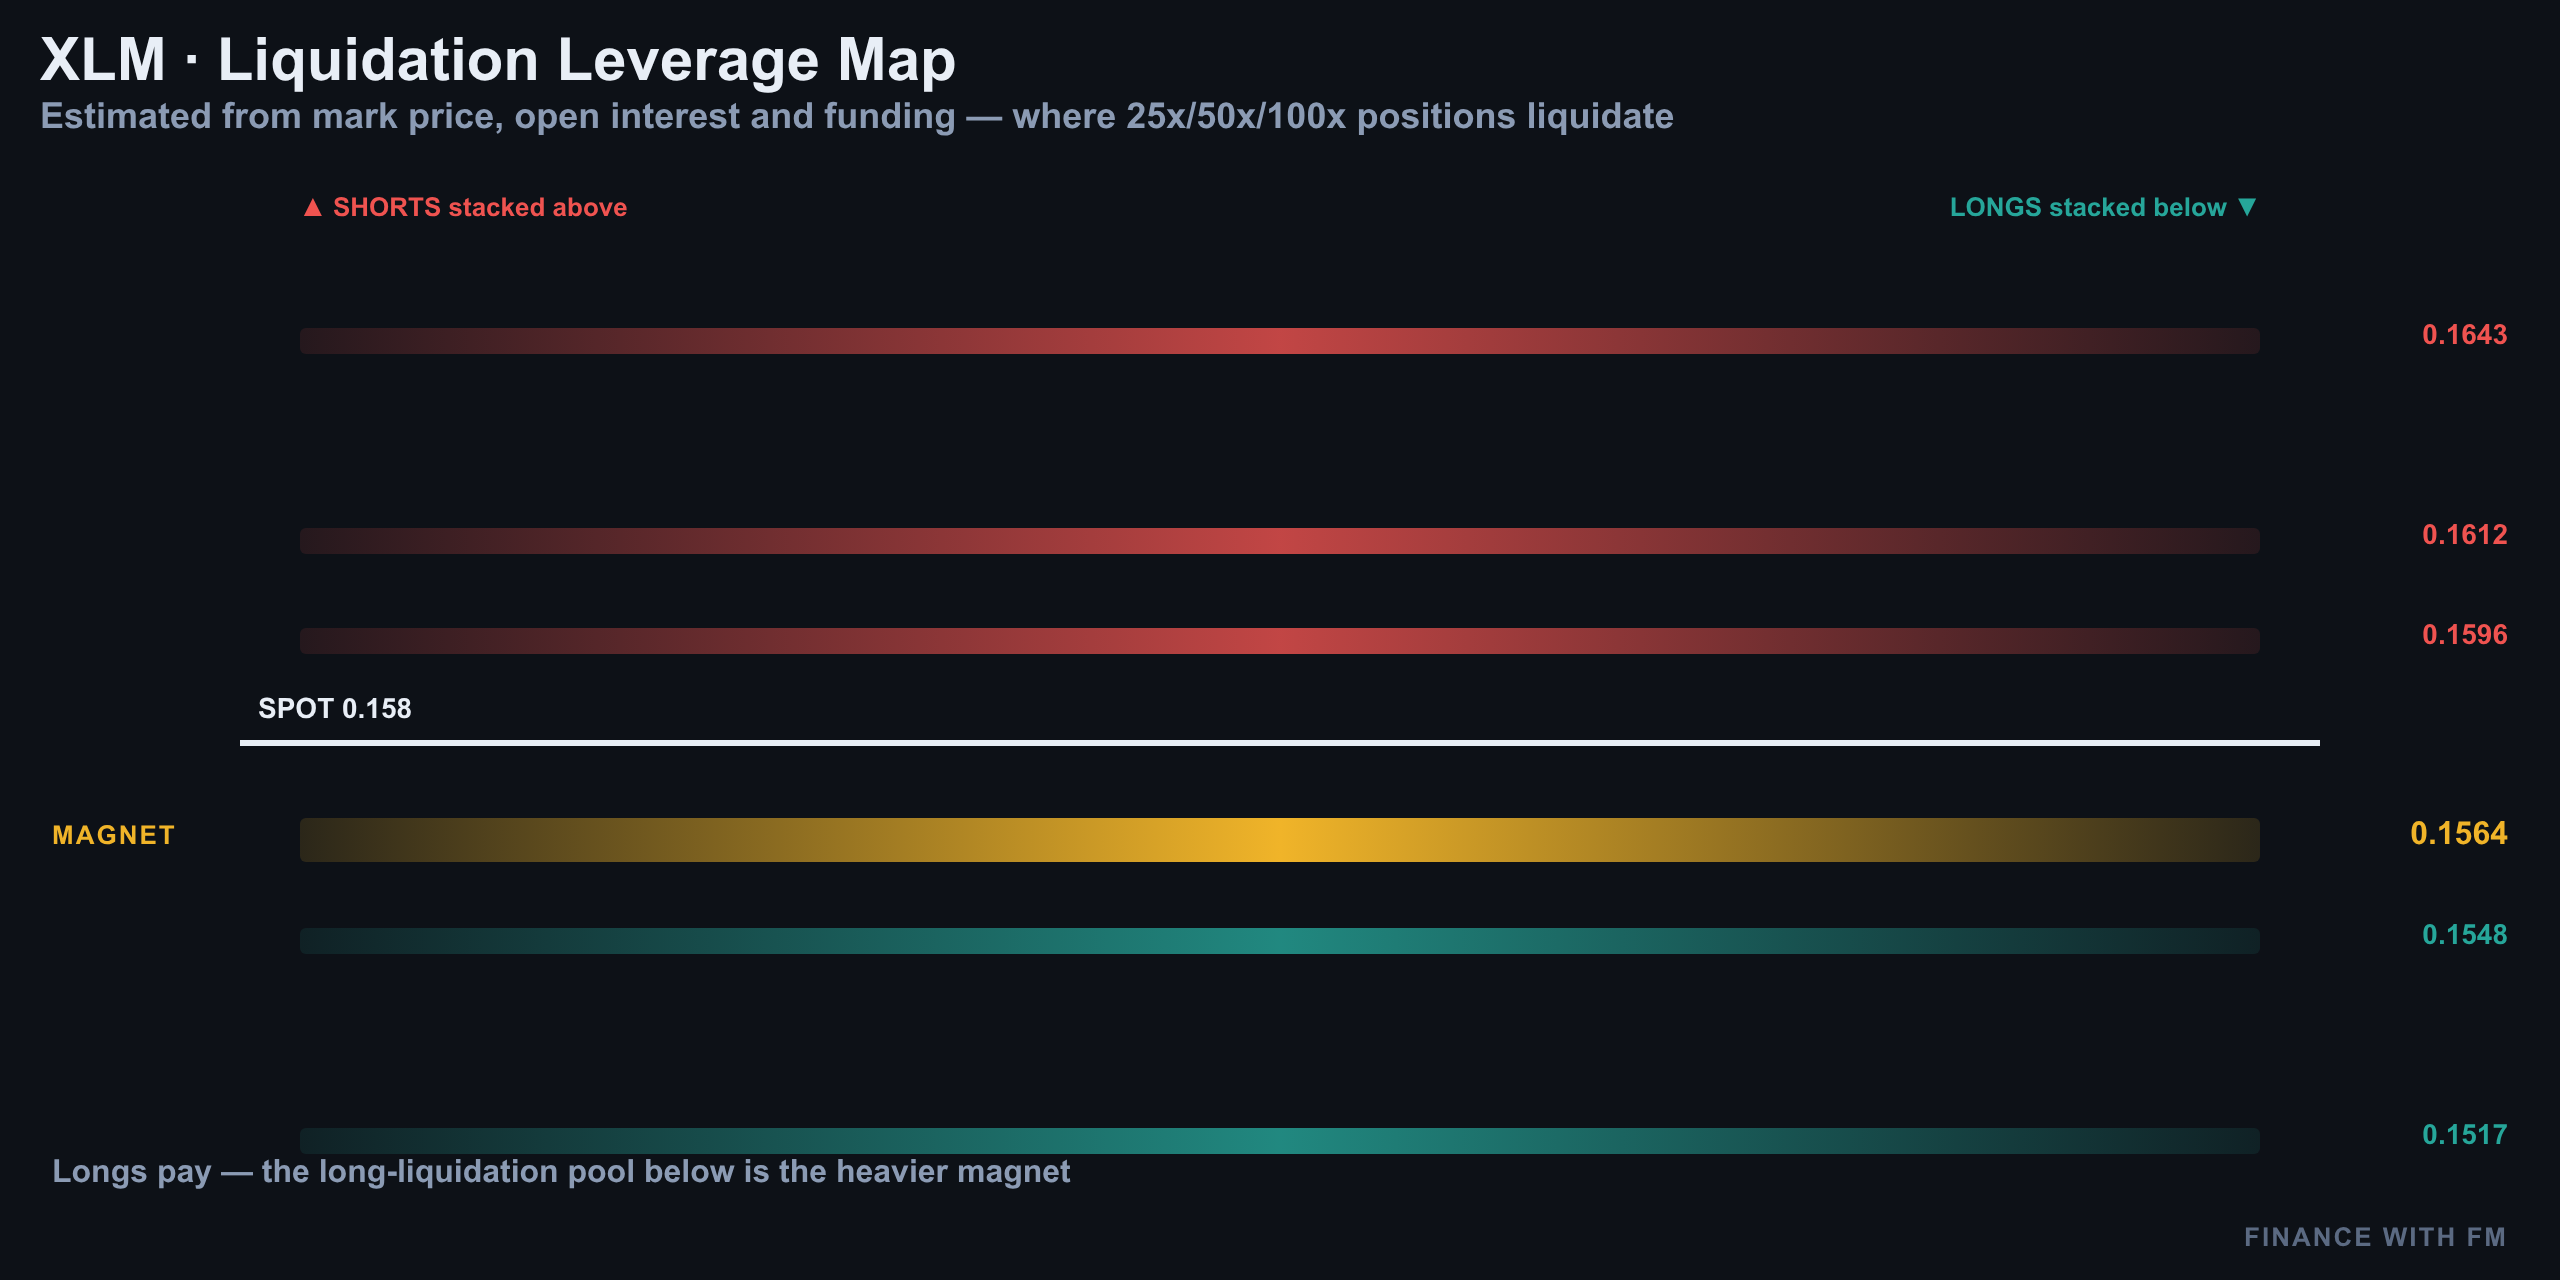
Here's where the picture gets interesting — and where the video's 'twist' comes from. With mark price near $0.155, dense long-liquidation clusters sit below on the 25x and 50x pools, while short-liquidation clusters sit above it. Funding is leaning the pressure to the upside: shorts are crowded and paying, so short liquidations above are the magnet price tends to hunt.
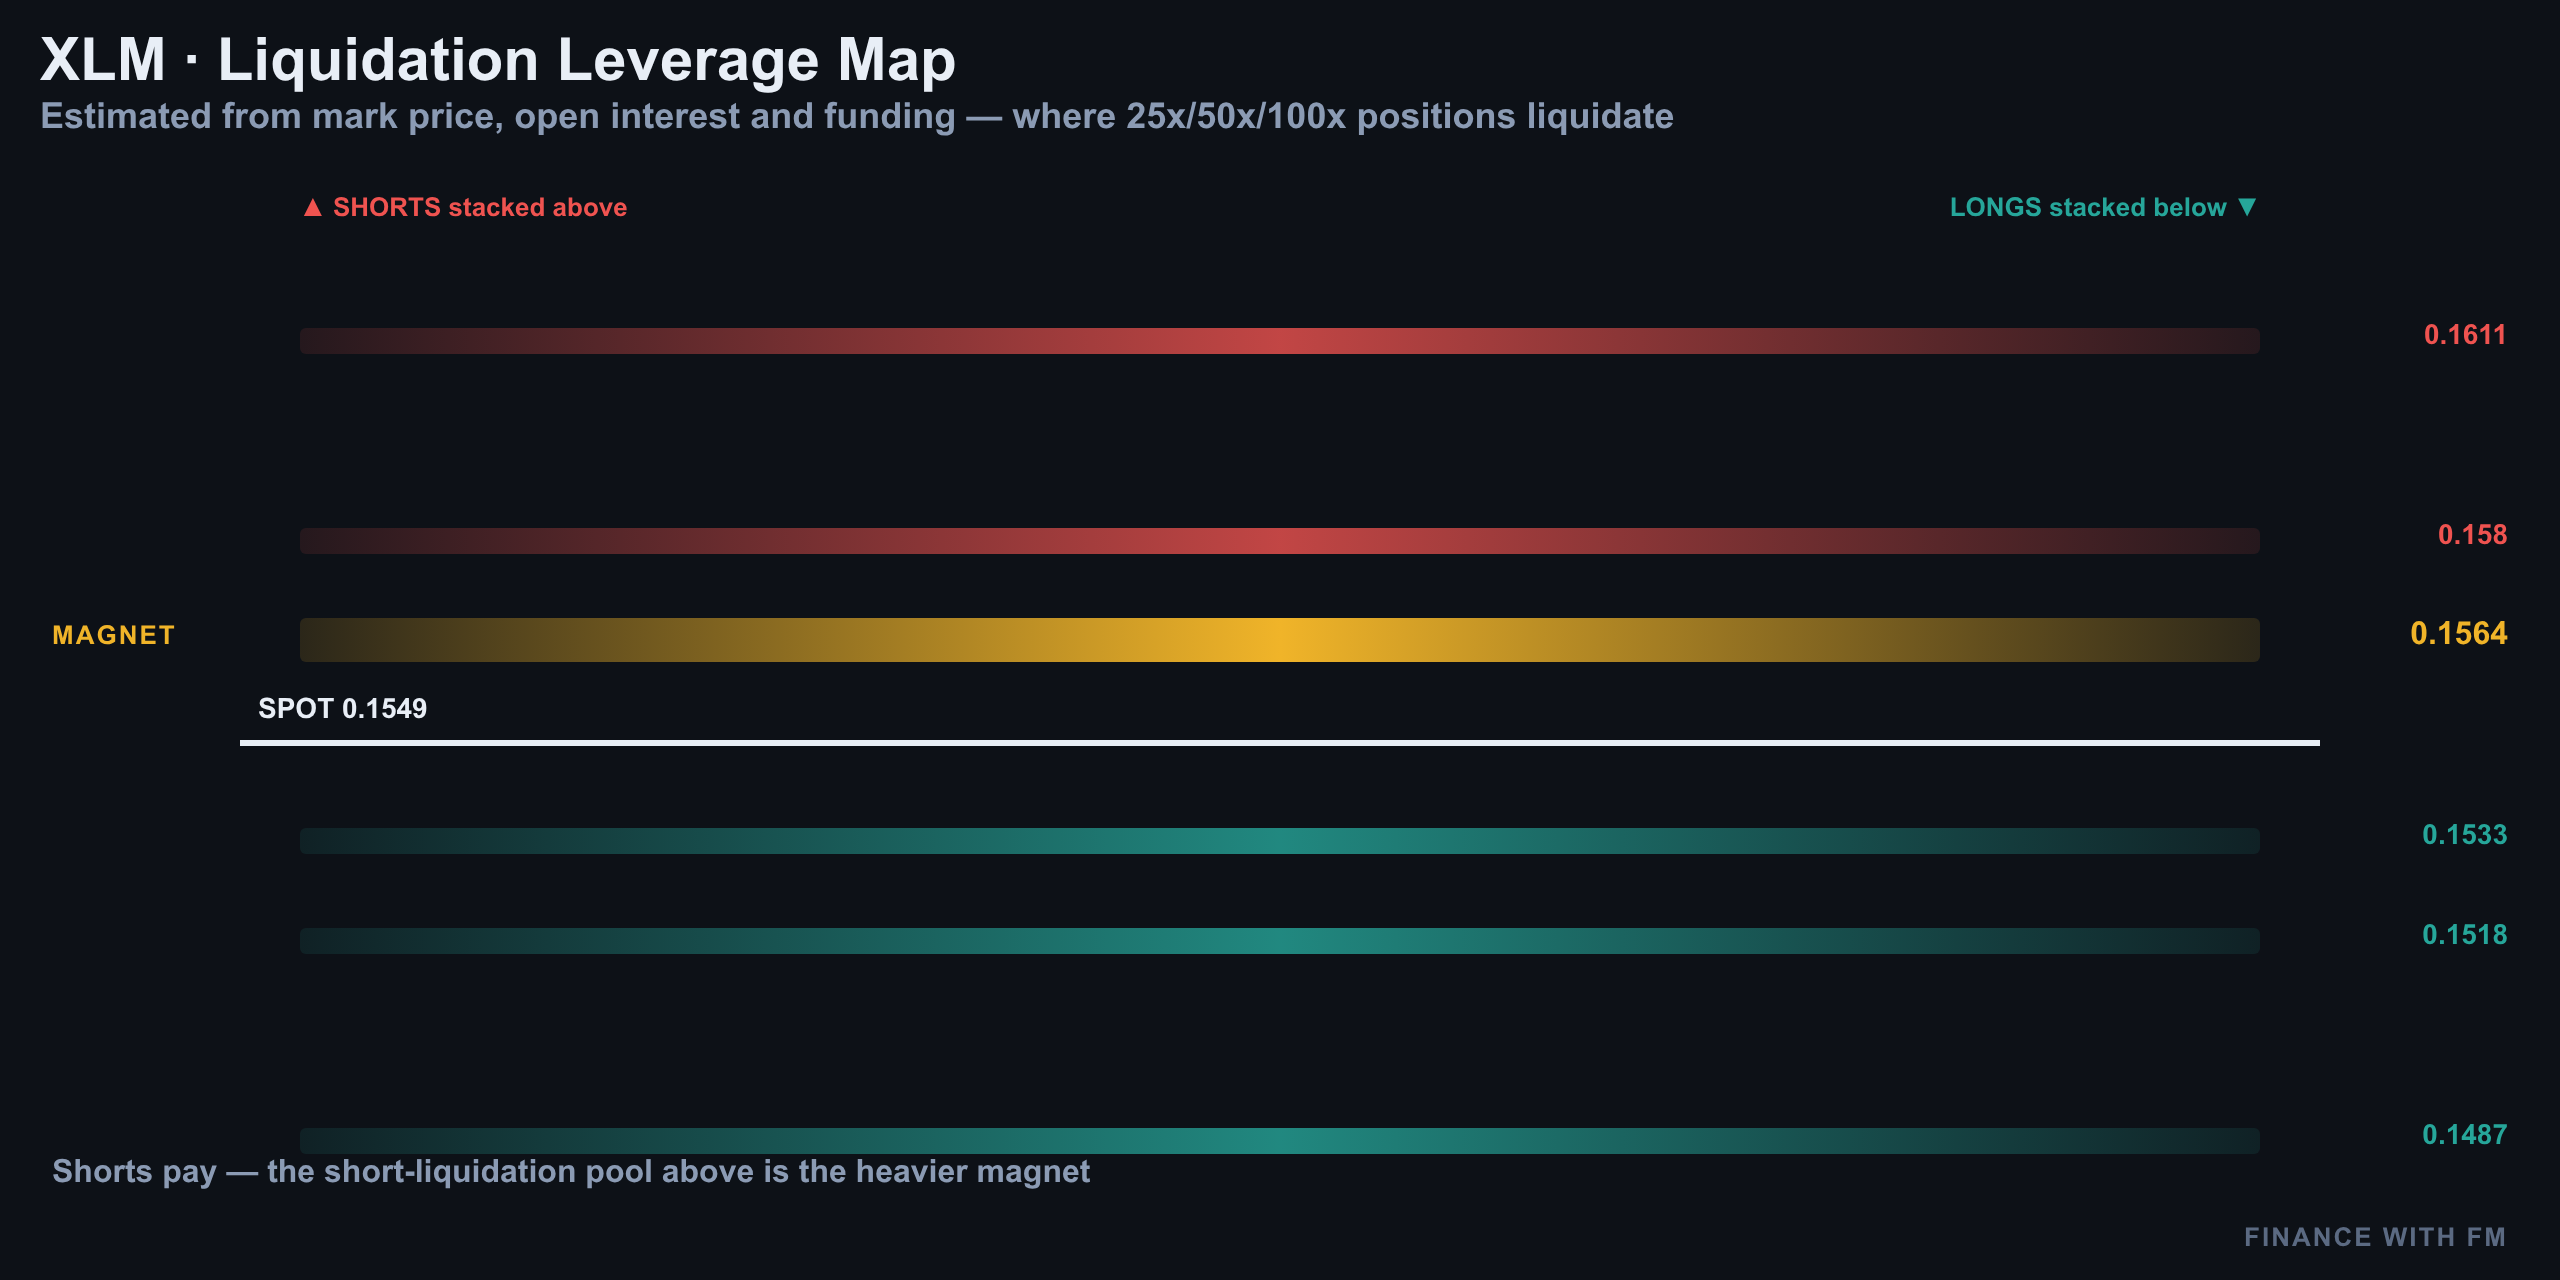
| Level | Price | What It Is |
|---|---|---|
| Ask wall | $0.1700 | Large resting sell order — resistance ceiling |
| Liquidation magnet | $0.1611 | Dense short-liquidation cluster — squeeze target |
| Spot price | $0.1551 | Current XLM price |
| Bid wall | $0.1490 | Deepest resting buy order — support floor |
Between those two extremes, today's action is happening entirely in the $0.15 zone — exactly where the trade plan below is built around.
| Metric | Reading | Read |
|---|---|---|
| Funding rate | ~-19% APR | Shorts paying longs — crowded shorts, squeeze fuel |
| Open interest (7d) | +3% | Leverage is building into this move |
| Top traders long/short | 1.21 | Net long, no clean fade signal |
| Retail long/short | 0.99 | Balanced — aligned with top traders |
| Taker flow | 0.71 | Aggressive active selling |
| Order book bids | 67% | Passive buyers absorbing the active sell pressure |
| Coinbase vs Binance premium | -0.068% | US side selling (Coinbase discount) |
Put together: retail and top traders are pointed the same direction (no edge there), but the funding and taker-flow data both scream 'crowded shorts.' Price tends to hunt the heavier pool of stops — and right now that pool sits above spot, near $0.1611.
The Trade Plan: Entry, Stop, Target
Structurally, XLM is still bearish — lower highs on the 4-hour, a falling daily channel, and MACD firmly negative. But the crowded-short positioning means the safest version of this trade waits for the bounce to fail rather than chasing the drop directly. One 4-hour close decides it.
| Parameter | Level |
|---|---|
| Bias | Bearish continuation (fade the bounce) |
| Entry (short) | $0.1555 — on rejection at the channel top |
| Stop | $0.1615 — above the $0.1611 liquidation magnet |
| Target | $0.1405 — toward daily support / below the bid wall |
| Risk : Reward | ≈ 1 : 2.5 |
This is not financial advice — it's a computed read of price structure, momentum, and positioning as of August 18, 2026. Markets move fast; manage risk accordingly and never size a position beyond what you can afford to lose.
Previous days
08/17/2026 — XLM Daily Pulse Aug 17: Resistance Trap at Range Top
XLM Daily Pulse Aug 17: Resistance Trap at Range Top
Stellar's Quiet Day Is Hiding a Loud Fight
Stellar (XLM) is trading around $0.1582 as of August 17, 2026, up roughly 0.1% over the past 24 hours from about $0.1580. On the surface, that's about as boring as crypto gets. Underneath it, though, taker flow is dumping hard, open interest just fell 4% in a week, and Coinbase is trading at a discount to Binance — a classic sign that American money is on the sell side while the order book itself still leans bullish. That's the trap: a market that looks asleep and is actually fighting itself in both directions at once.
Yesterday's call from this desk was a short from $0.1588, stop at $0.1604, target $0.1548. Twenty-four hours later, price is still basically flat near $0.1581 — meaning that short never got stopped out and never hit target. It's still live, still sitting in the exact same chop this whole setup describes. No win, no loss on the scorecard yet — just more range.
15-Minute Chart: Boxed In Between Two Rails
Zoom into the 15-minute chart and Stellar has been boxed in all day, bouncing between a dashed ceiling near $0.1595 and a floor closer to $0.1565. Every push into that top rail gets sold off. The dotted midline around $0.1580 marks where price keeps snapping back to — which is almost exactly where spot sits right now.
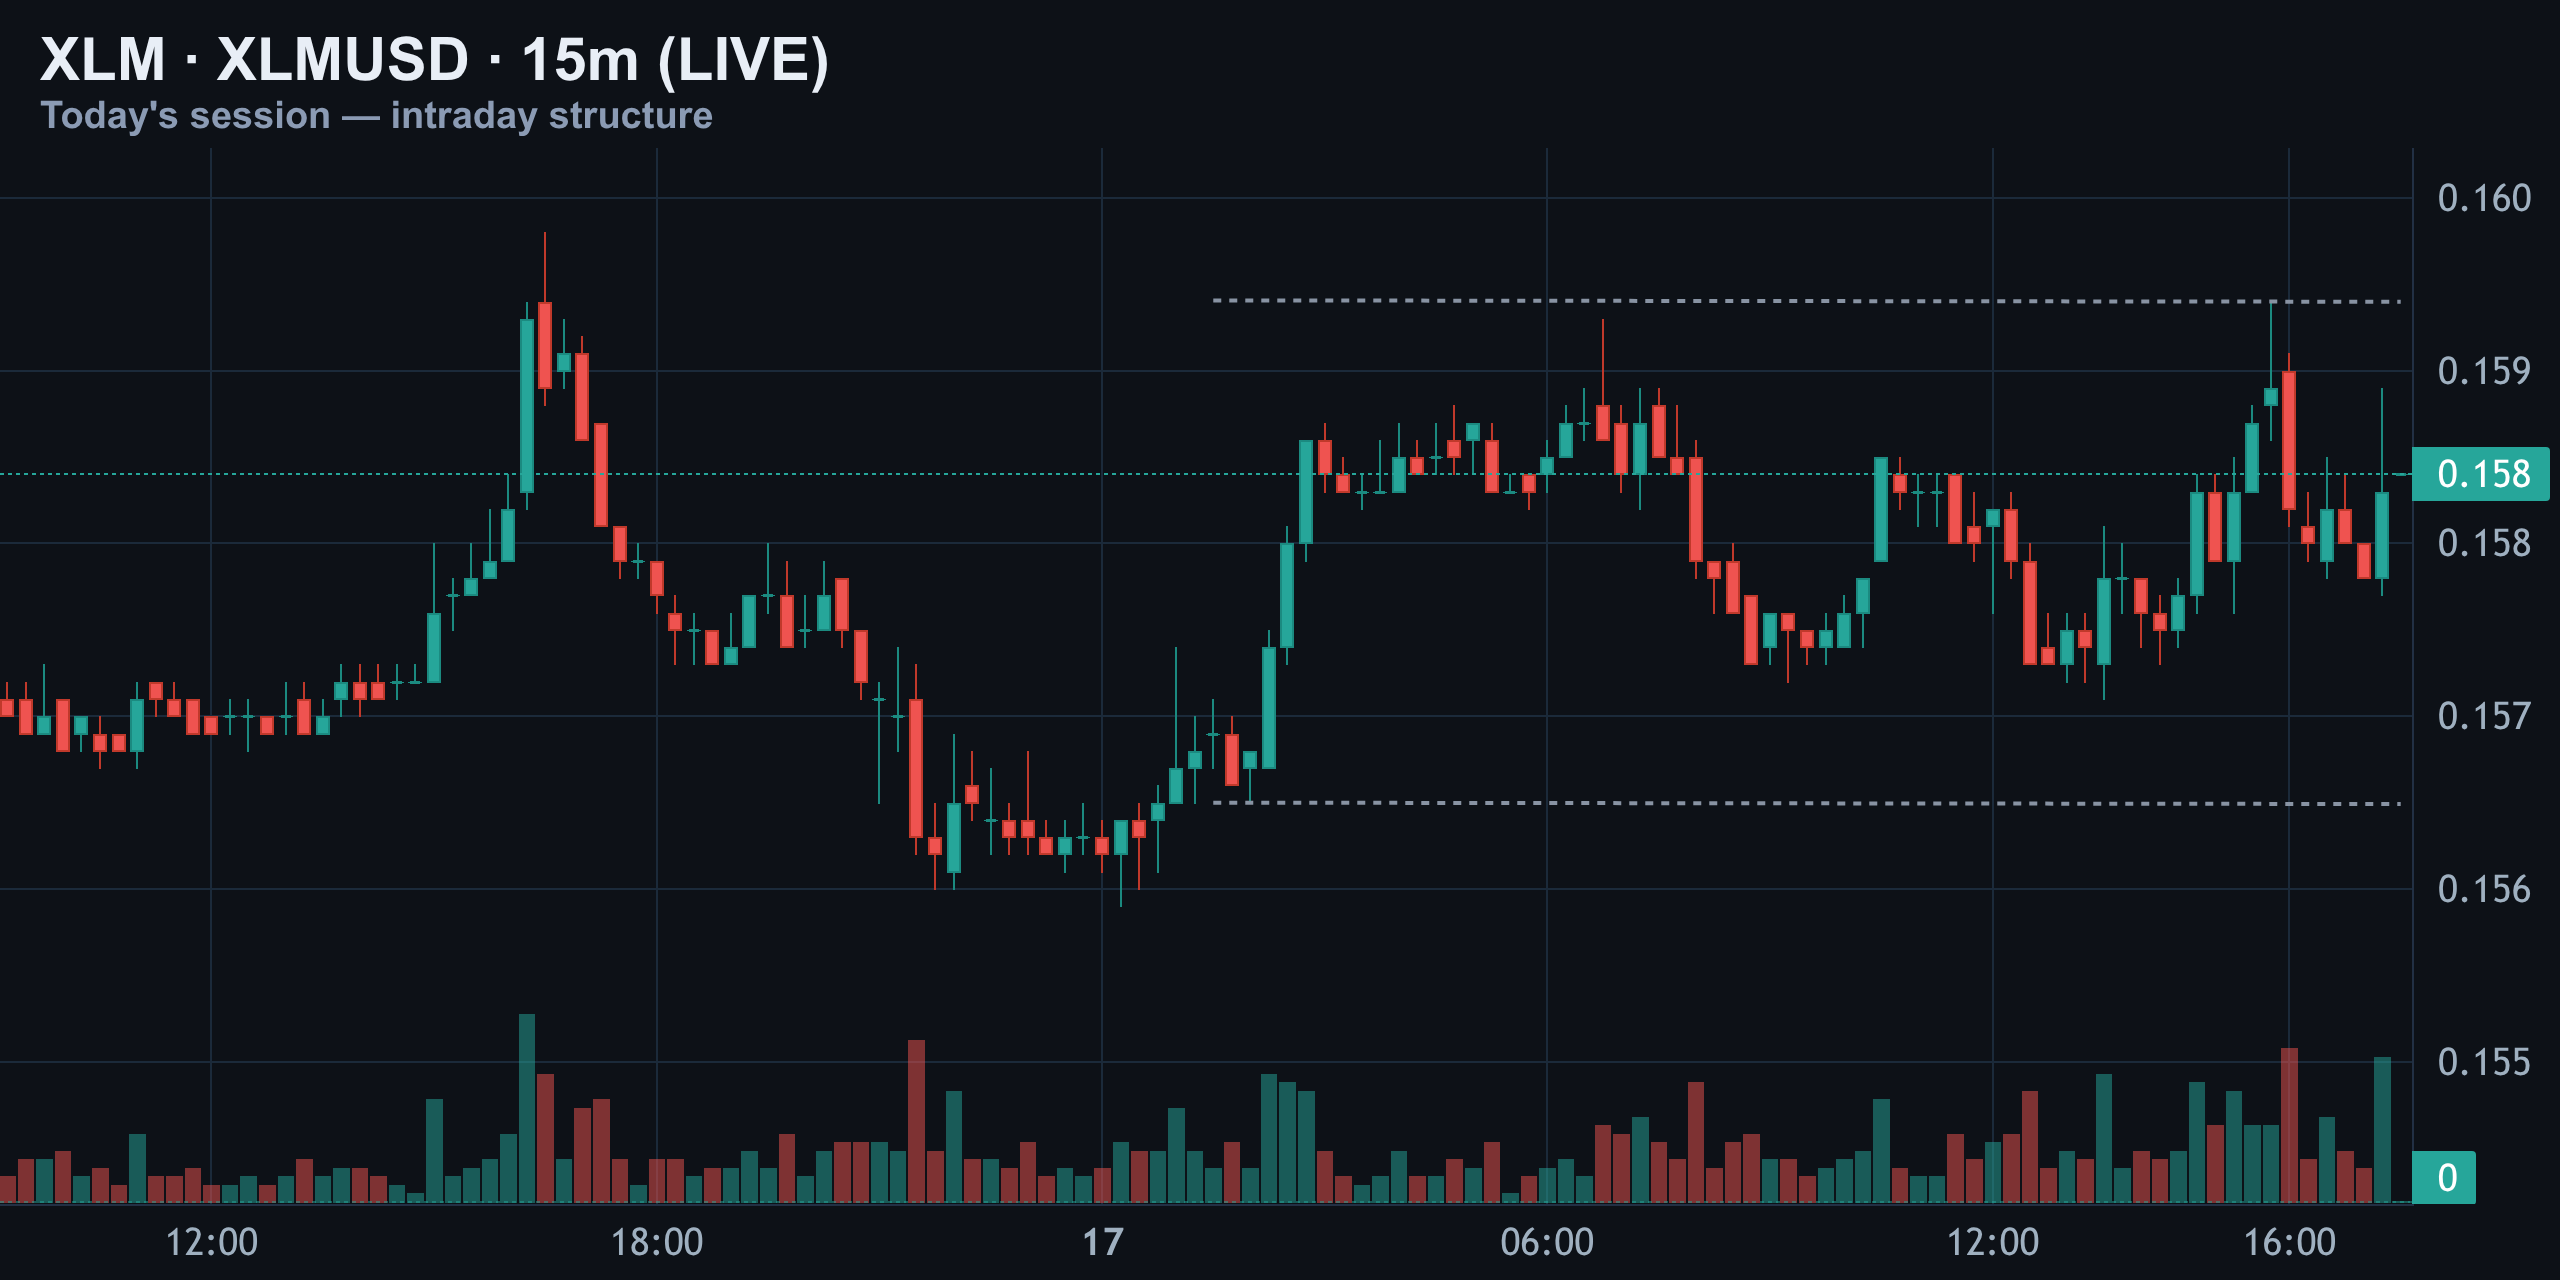
Volume has picked up on the last leg higher, but there's still no clean breakout candle closing above the ceiling. That's classic pre-breakout coiling, and coiling this tight usually resolves fast in one direction or the other. In plain terms: price is squeezed between two lines and hasn't picked a side yet.
4-Hour Structure: The Descending Channel Still Rules
The four-hour chart tells a different story than the 15-minute one. This entire bounce since August 9 has been happening inside a descending channel — lower highs, lower lows — even as price grinds upward inside it. Right now Stellar is testing the top rail of that channel, right around where spot sits.
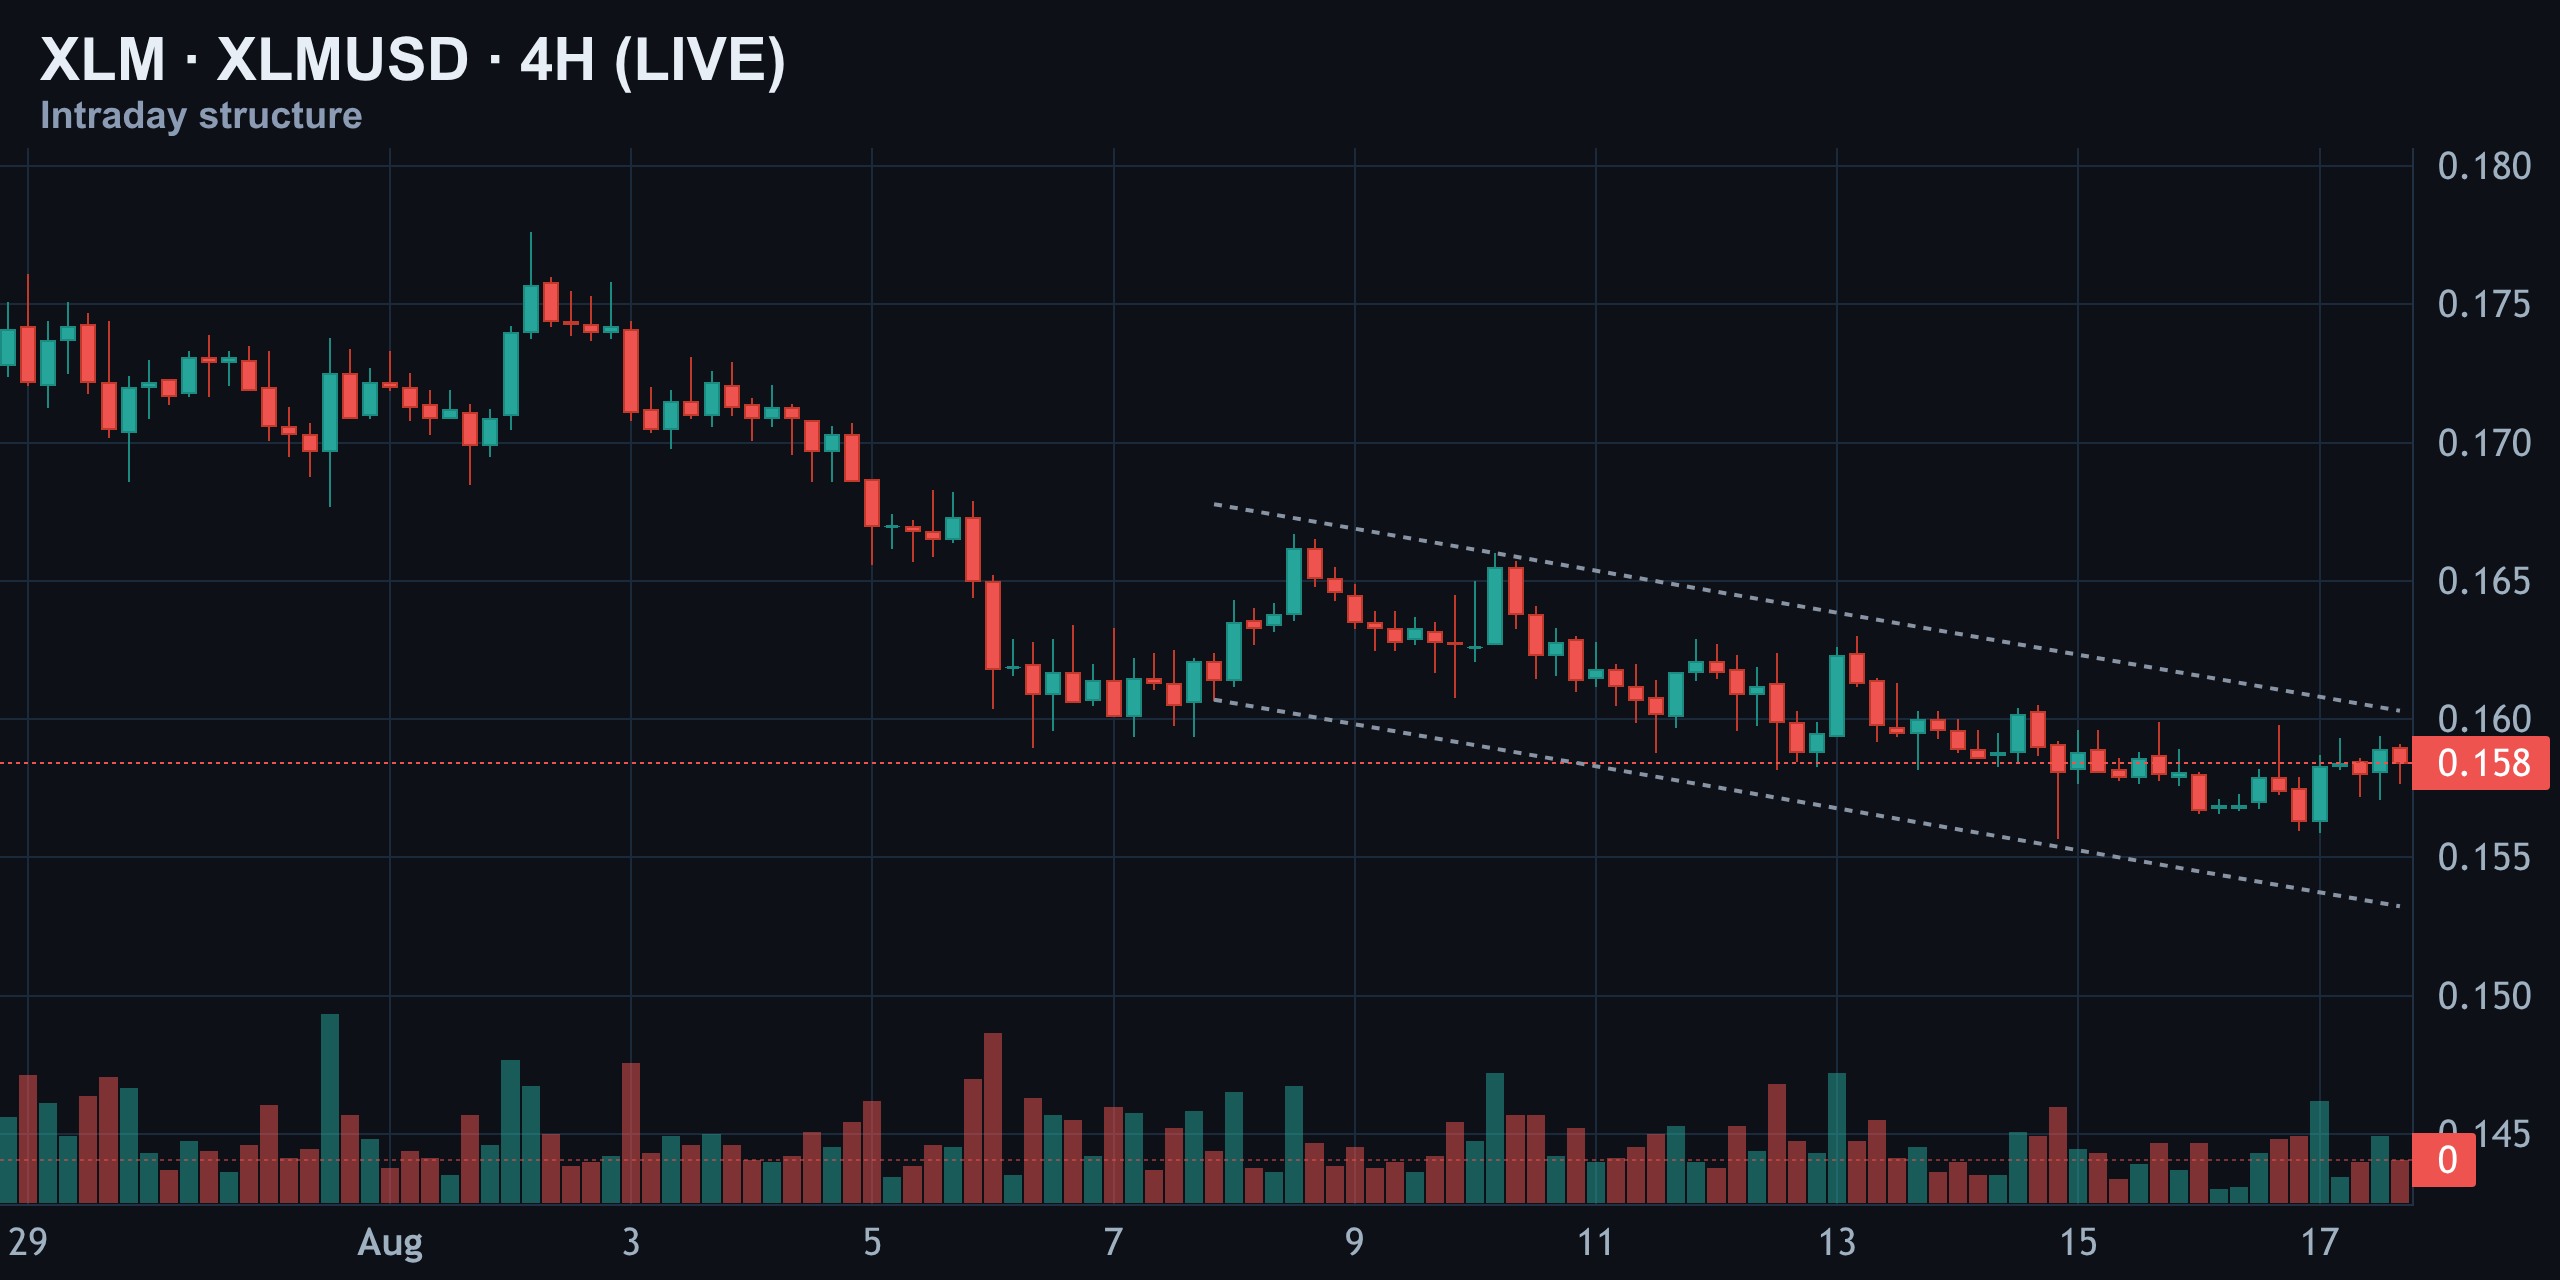
That rail has capped every rally since the 9th. Until a four-hour candle closes clean above it, the bigger trend here is still technically down, just consolidating. In plain terms: the bigger four-hour trend still points down, despite today's bounce.
Daily Chart: Between the Spike High and the June Low
Stepping back to the daily chart, Stellar's whole summer is bookended by two extremes — the spike high near $0.30 back in early June, and the pre-pump floor around $0.14. Since then it's been a long grind lower into a tightening descending channel, and today's price near $0.1582 sits right inside that channel, hugging the lower boundary.
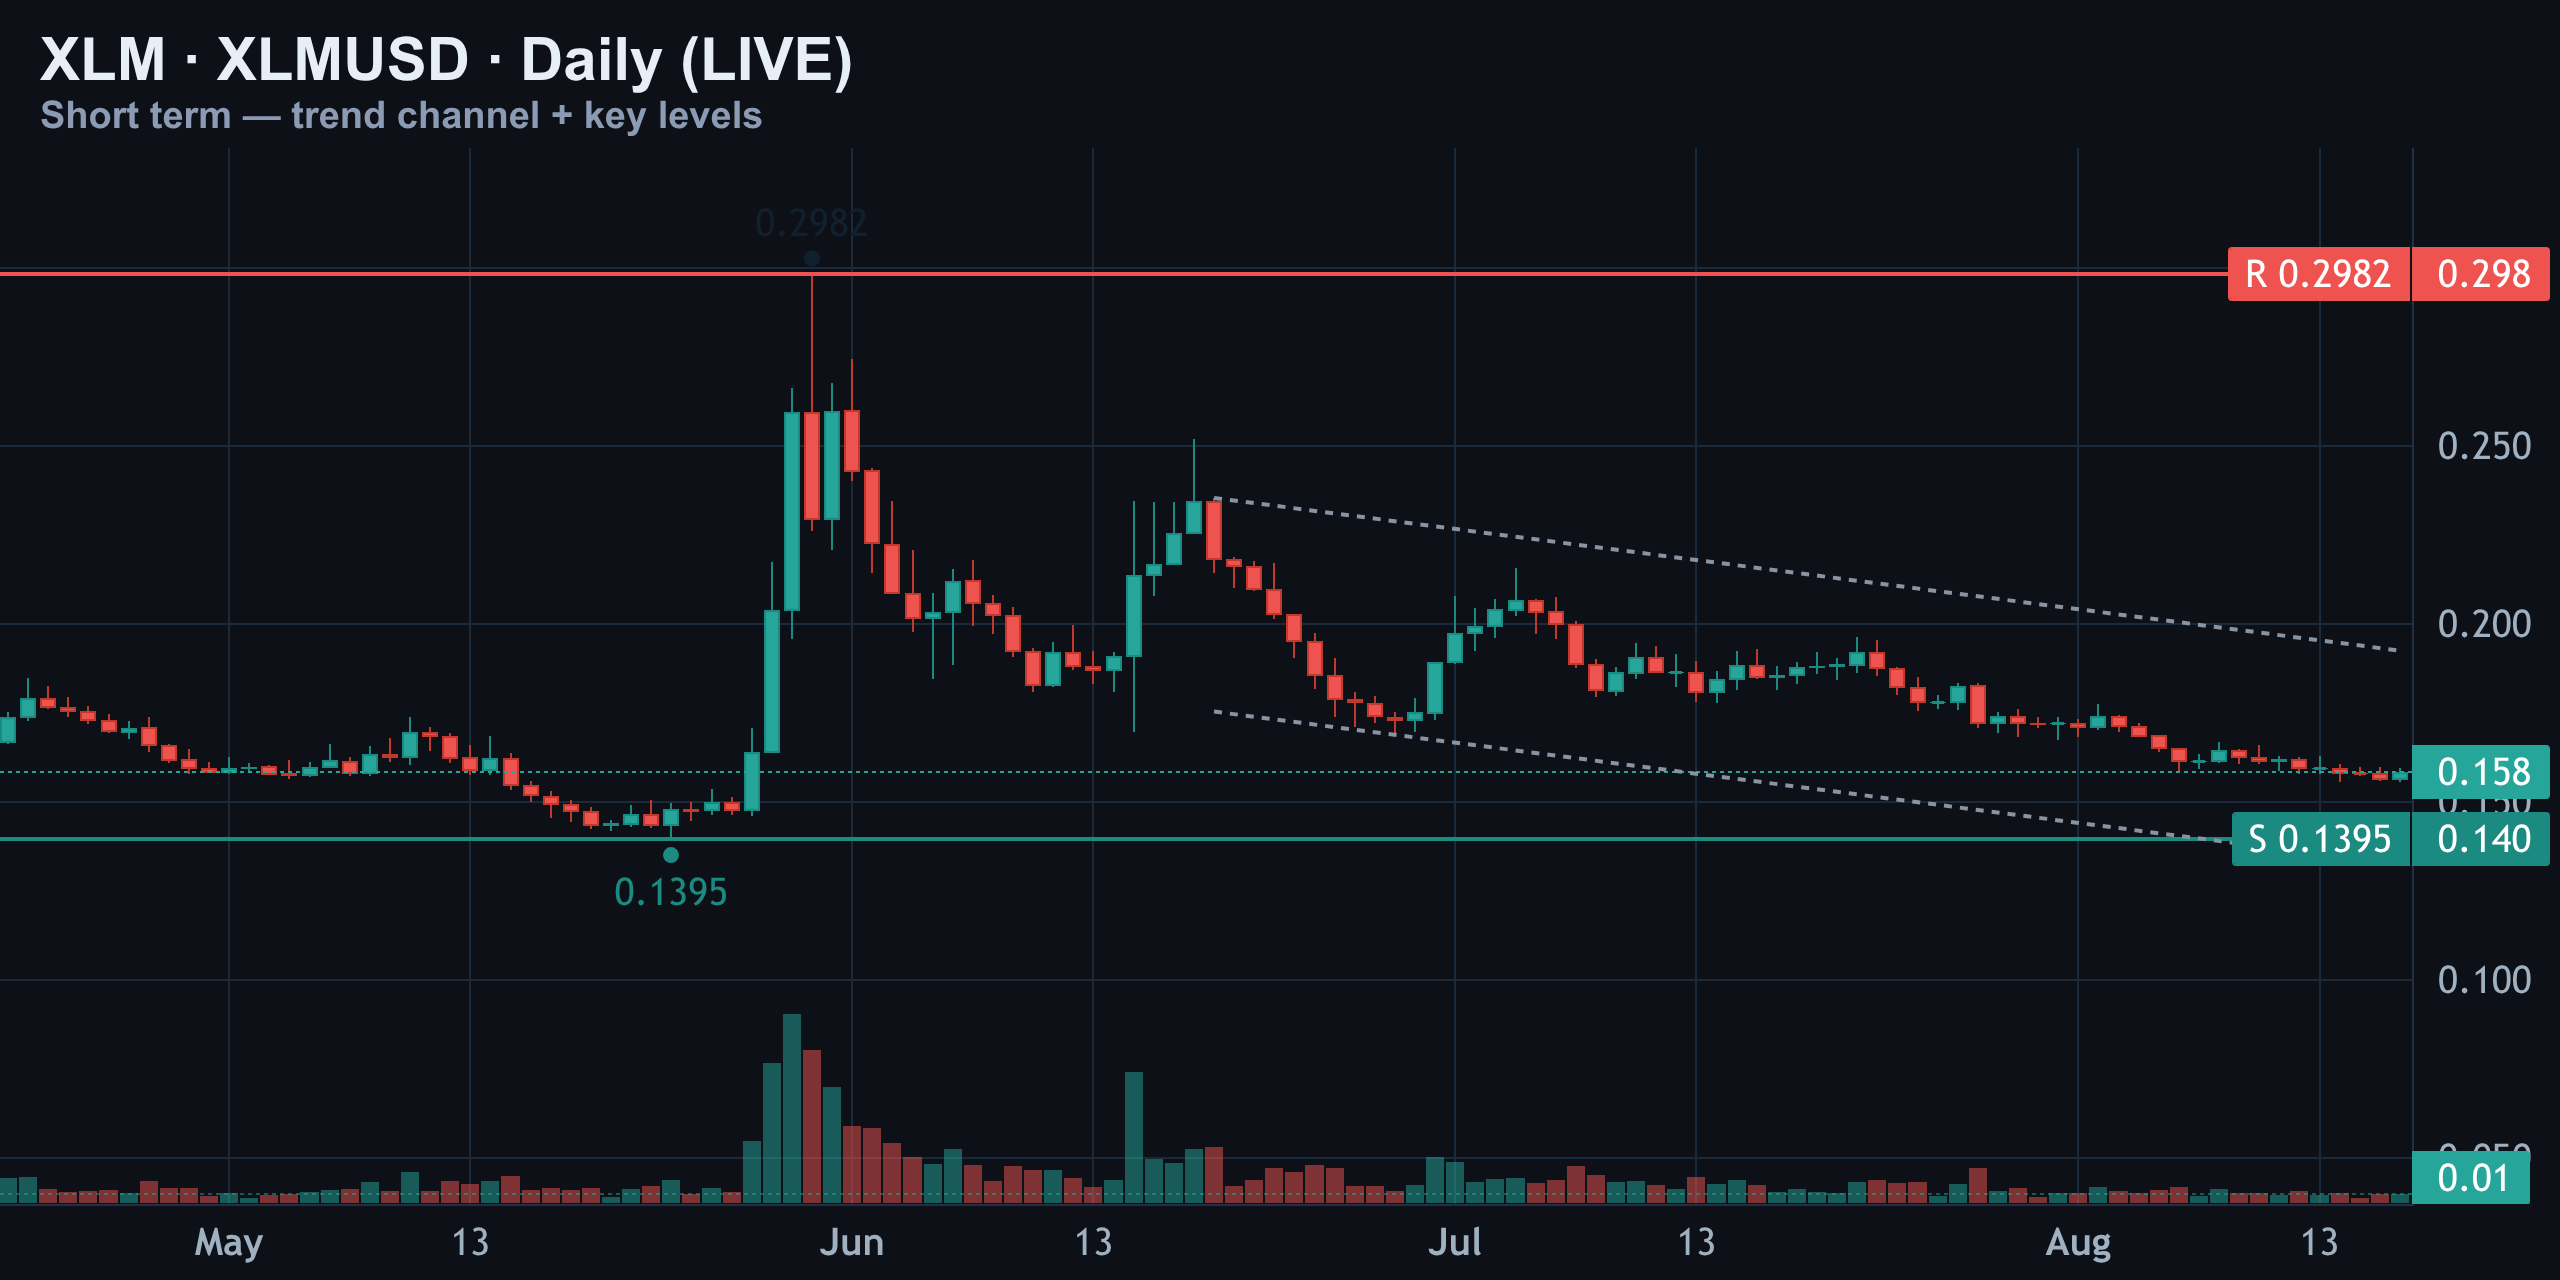
This is context, not the trade. The real signal today is on the shorter timeframes, but this channel is the cage price is still fighting inside. In plain terms: price has been sliding lower inside a shrinking channel for weeks.
Momentum Check: RSI Is Calm, MACD Just Flickered Bullish
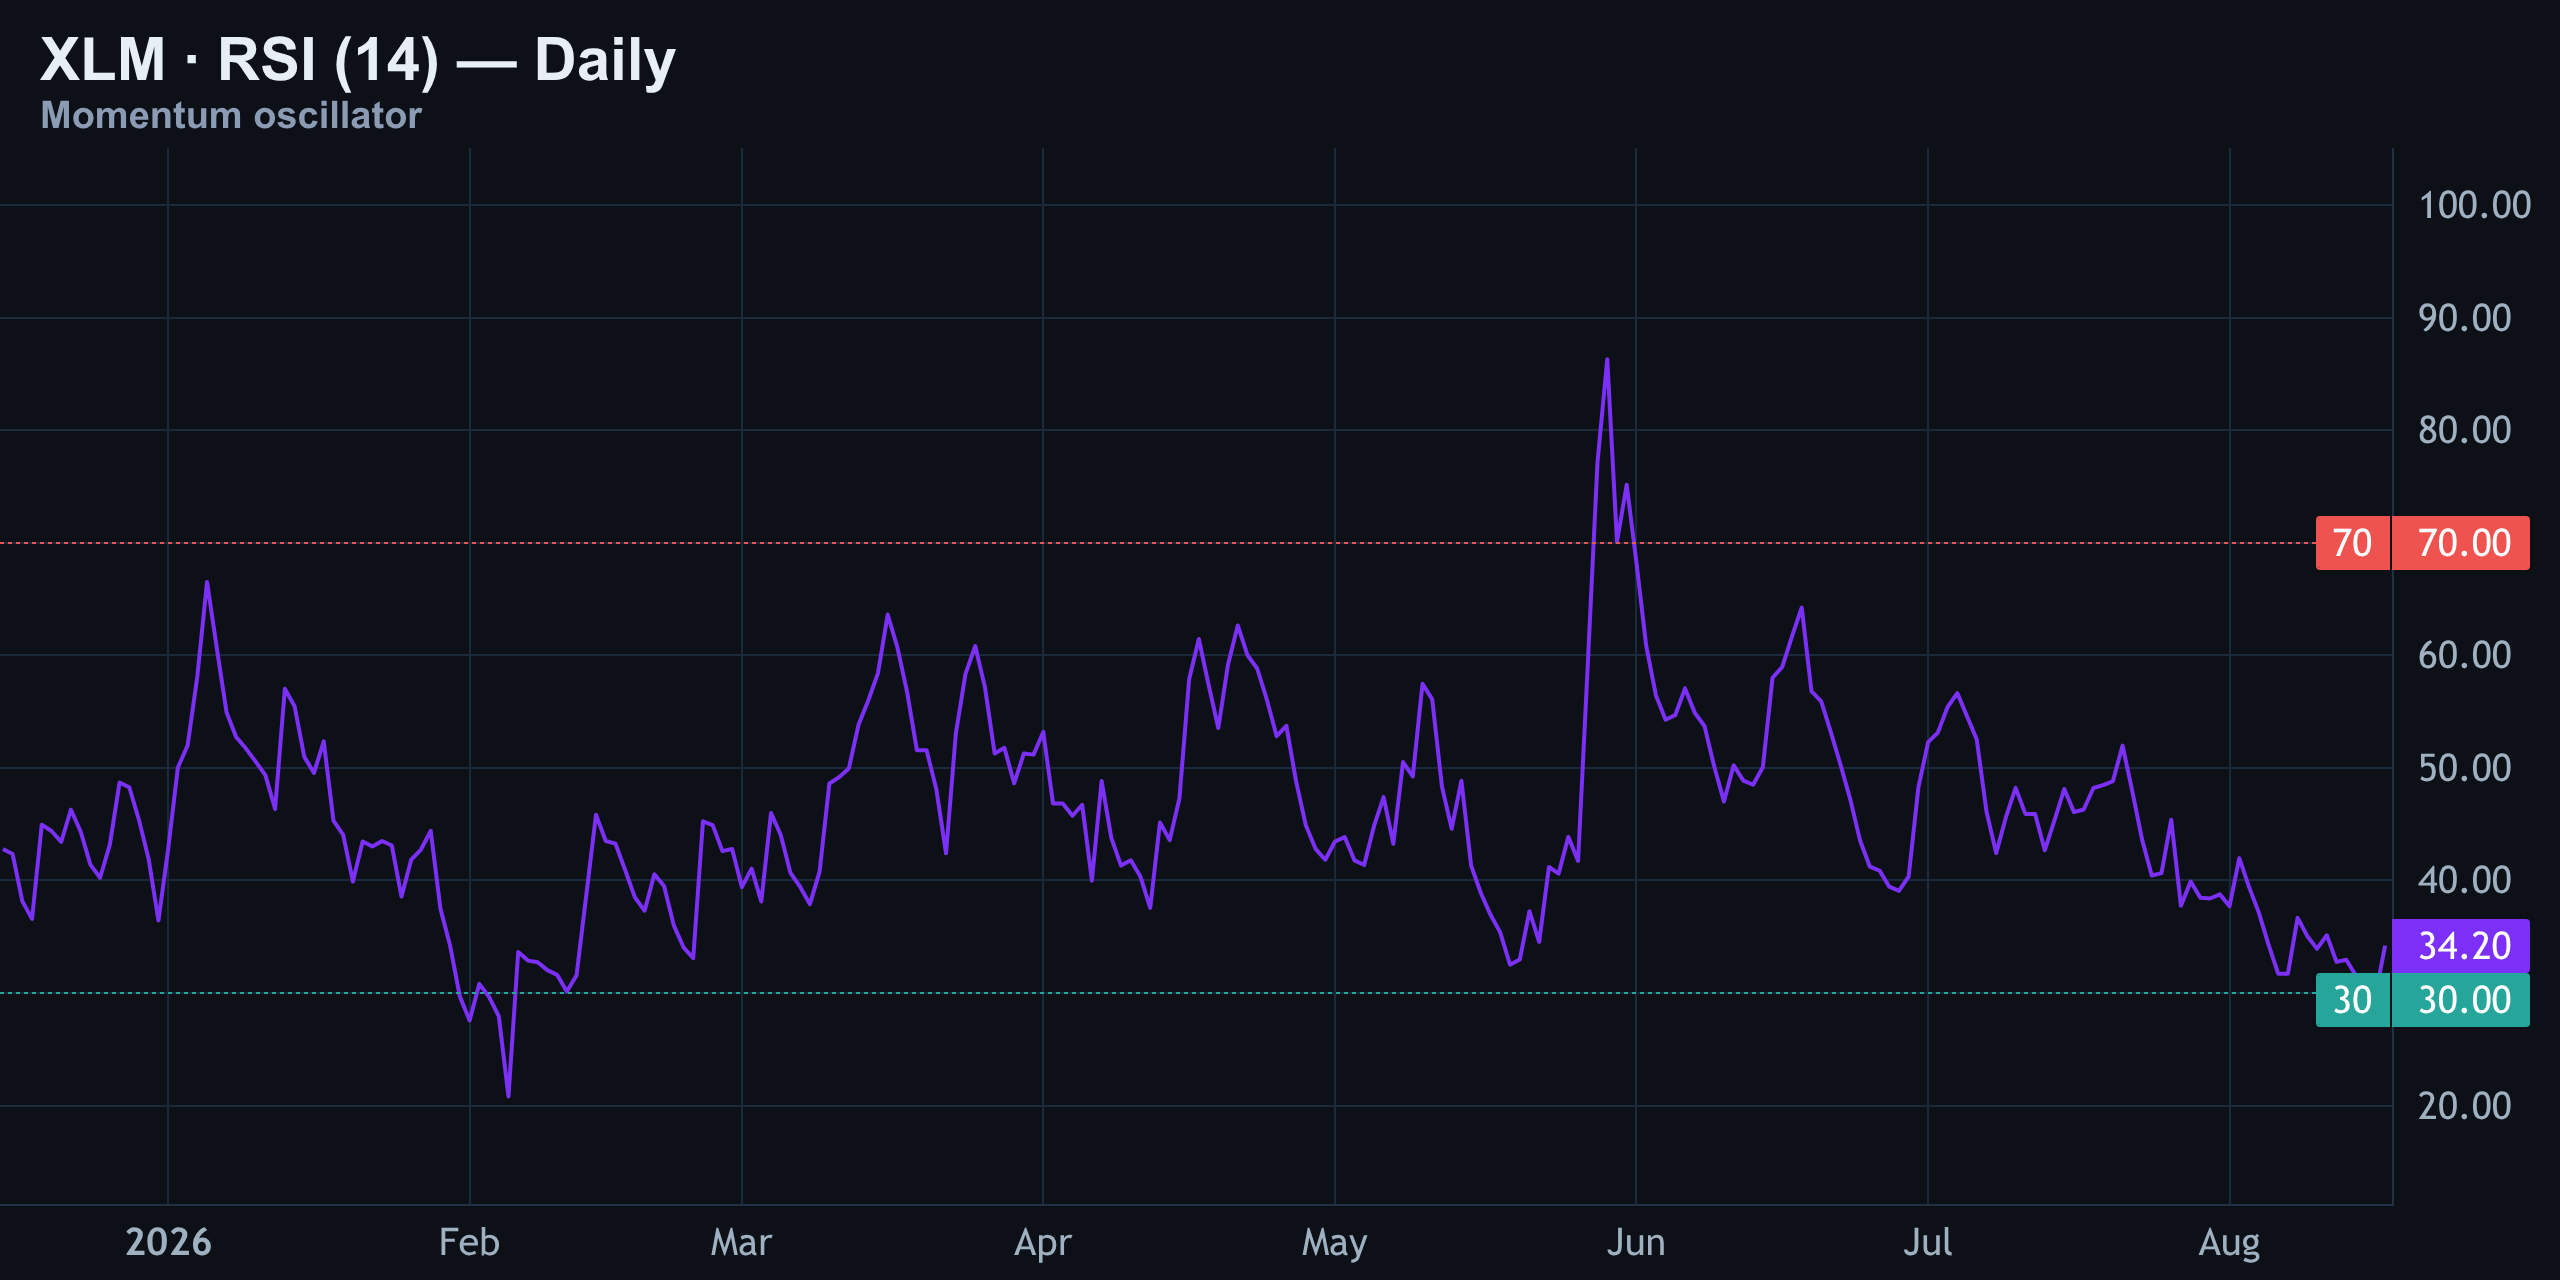
RSI (14) on the daily sits at 34 right now — that's neutral, not the oversold reading some might expect after the recent slide. Go back to late May and there's a spike above 70, an extreme overbought print that immediately rolled over into this whole downtrend. Since early August, RSI has been carving a shallow higher low, hinting at momentum trying to stabilize. It's not a bullish signal yet — just tired selling, not fresh buying.
MACD: A Fragile Bullish Cross
MACD just did something worth flagging — the MACD line has crossed above the signal line, and the histogram has ticked positive. On paper, that's a bullish cross. But compare the size of it against early June's surge, when the histogram spiked hard on that spike-high move — this current cross is a fraction of that size, barely above the zero line.
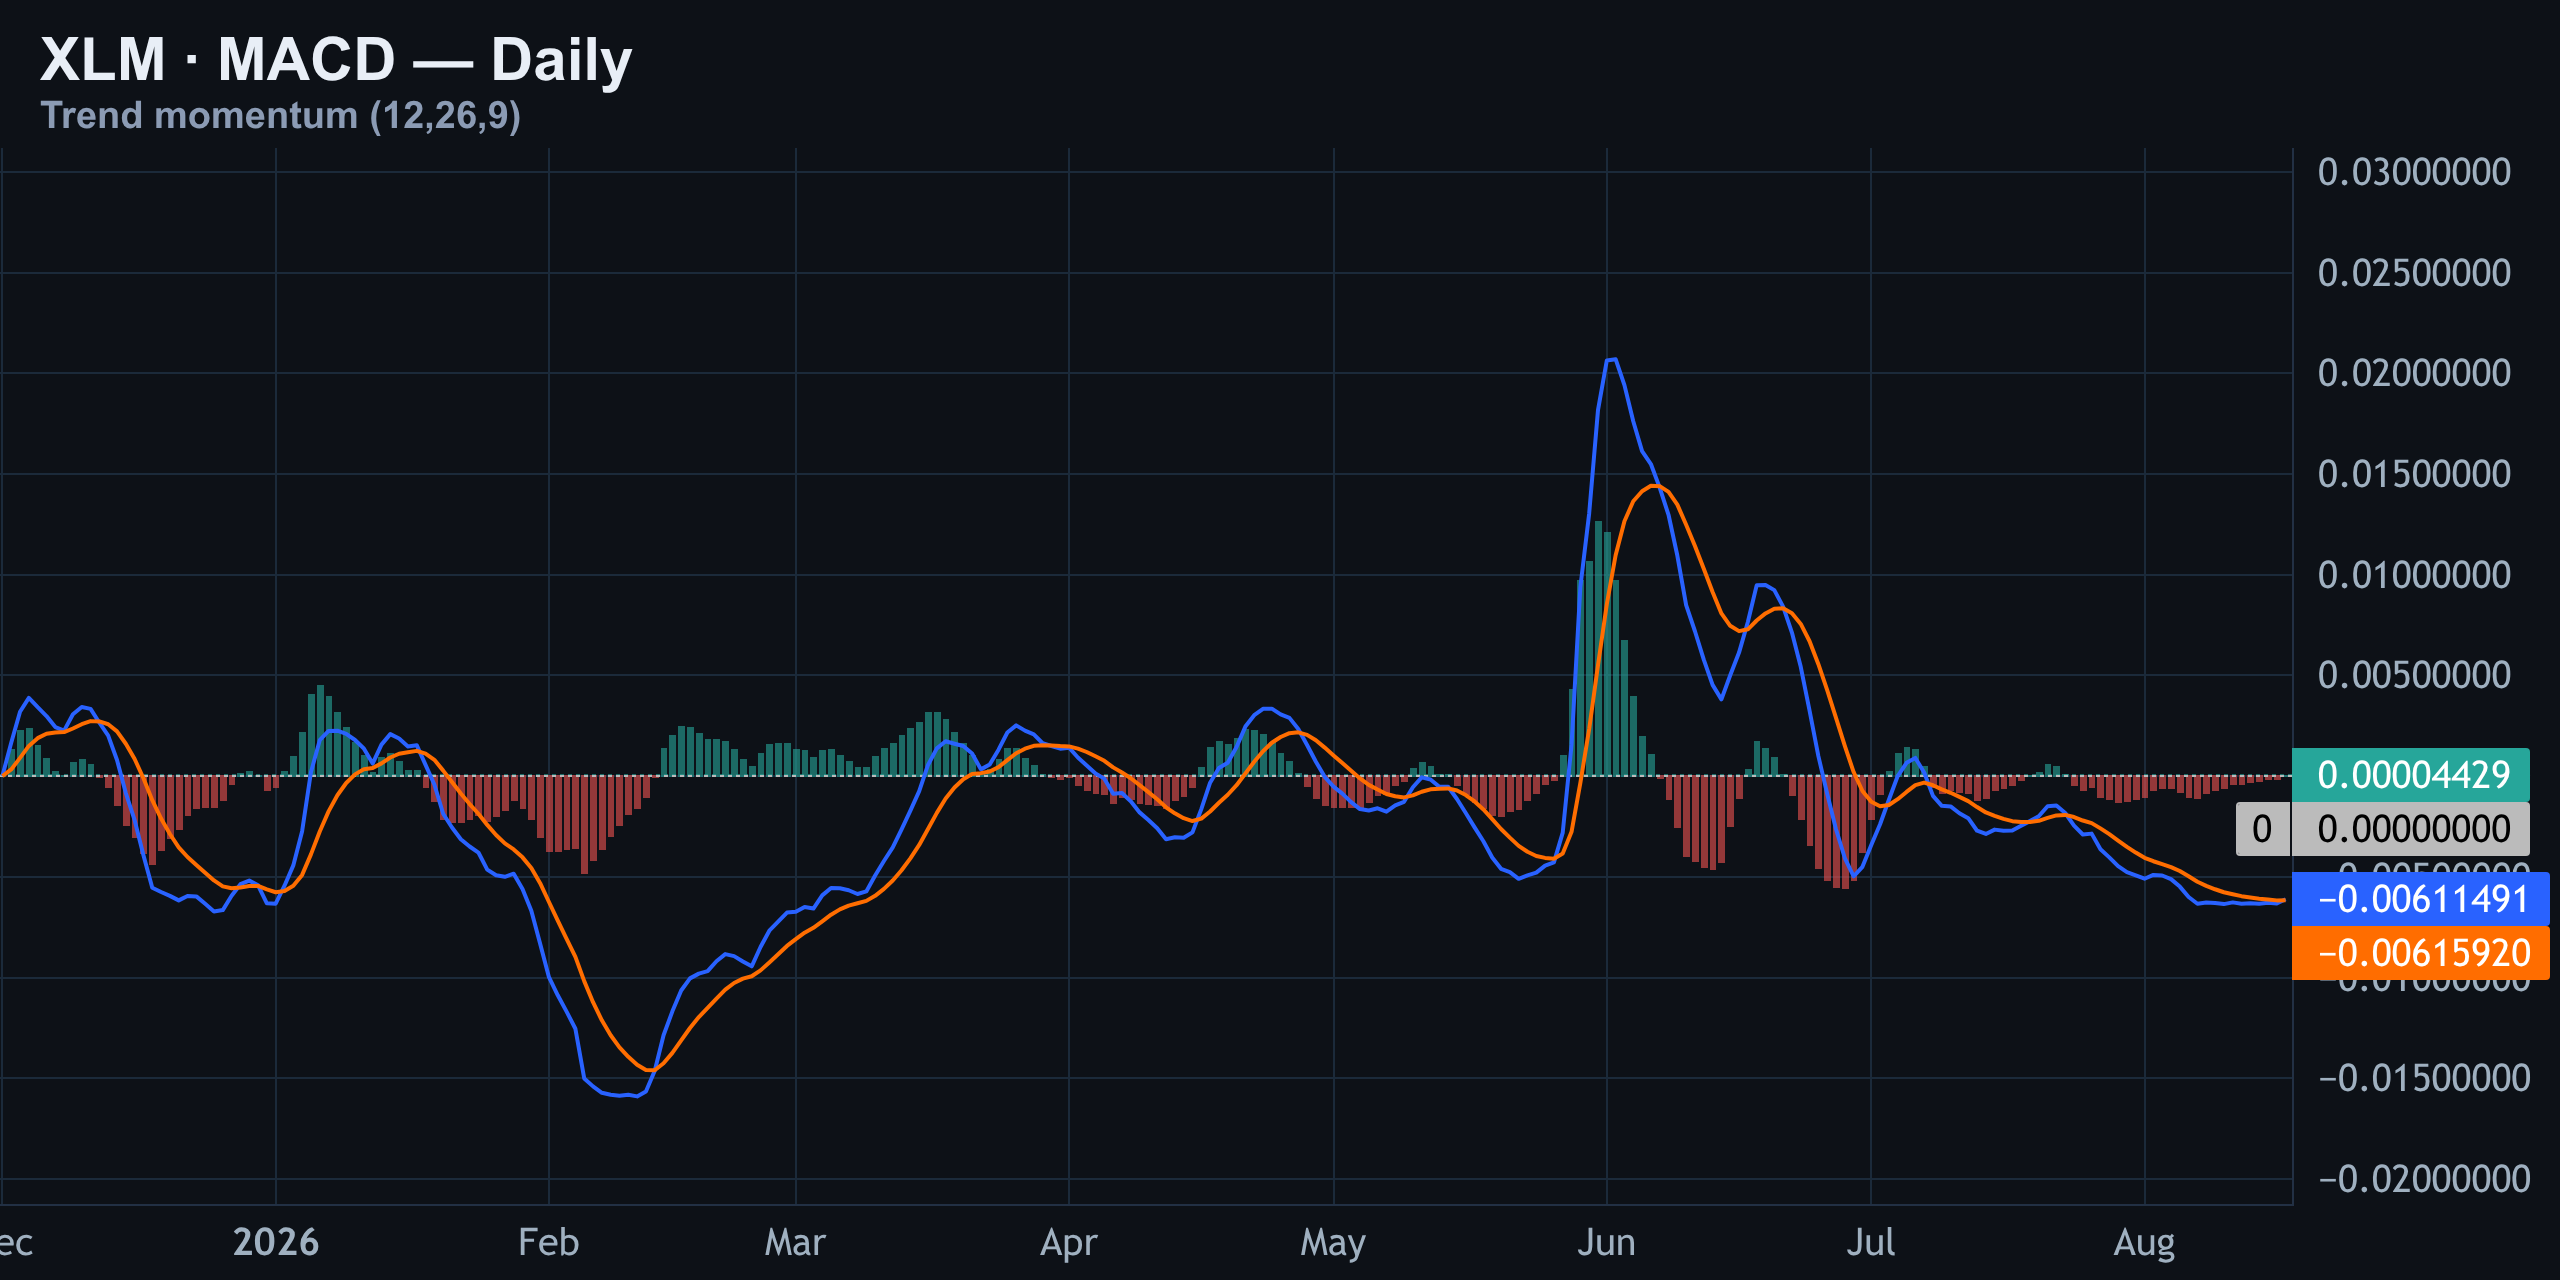
It's an early, fragile signal, not a confirmed trend change. Worth watching, not worth trusting yet. In plain terms: momentum just turned slightly bullish, but it's still a weak signal.
The Levels That Actually Matter Today
Spot is at $0.1582, sitting right under a heavy ask wall at $0.1595. The densest liquidation zone from the last two weeks sits at $0.1610 — that's the pool price keeps getting pulled toward. Below spot, smaller liquidation clusters sit near $0.1579 and $0.1564. Way down at $0.11 sits the single biggest bid wall on the book — the floor nobody's testing today.
| Level | Price | Significance |
|---|---|---|
| Resistance / Ask Wall | $0.1595 | Heavy overhead supply, capped every push today |
| Spot | $0.1582 | Current price, sitting on the range midline |
| Minor Liquidation Cluster | $0.1579 | Small stop pocket just below spot |
| Minor Liquidation Cluster | $0.1564 | Secondary stop pocket, near the 15-min floor |
| Densest Liquidation Pool (2wk) | $0.1610 | Magnet zone price keeps getting pulled toward |
| Major Bid Wall | $0.11 | Biggest floor on the book, untested today |
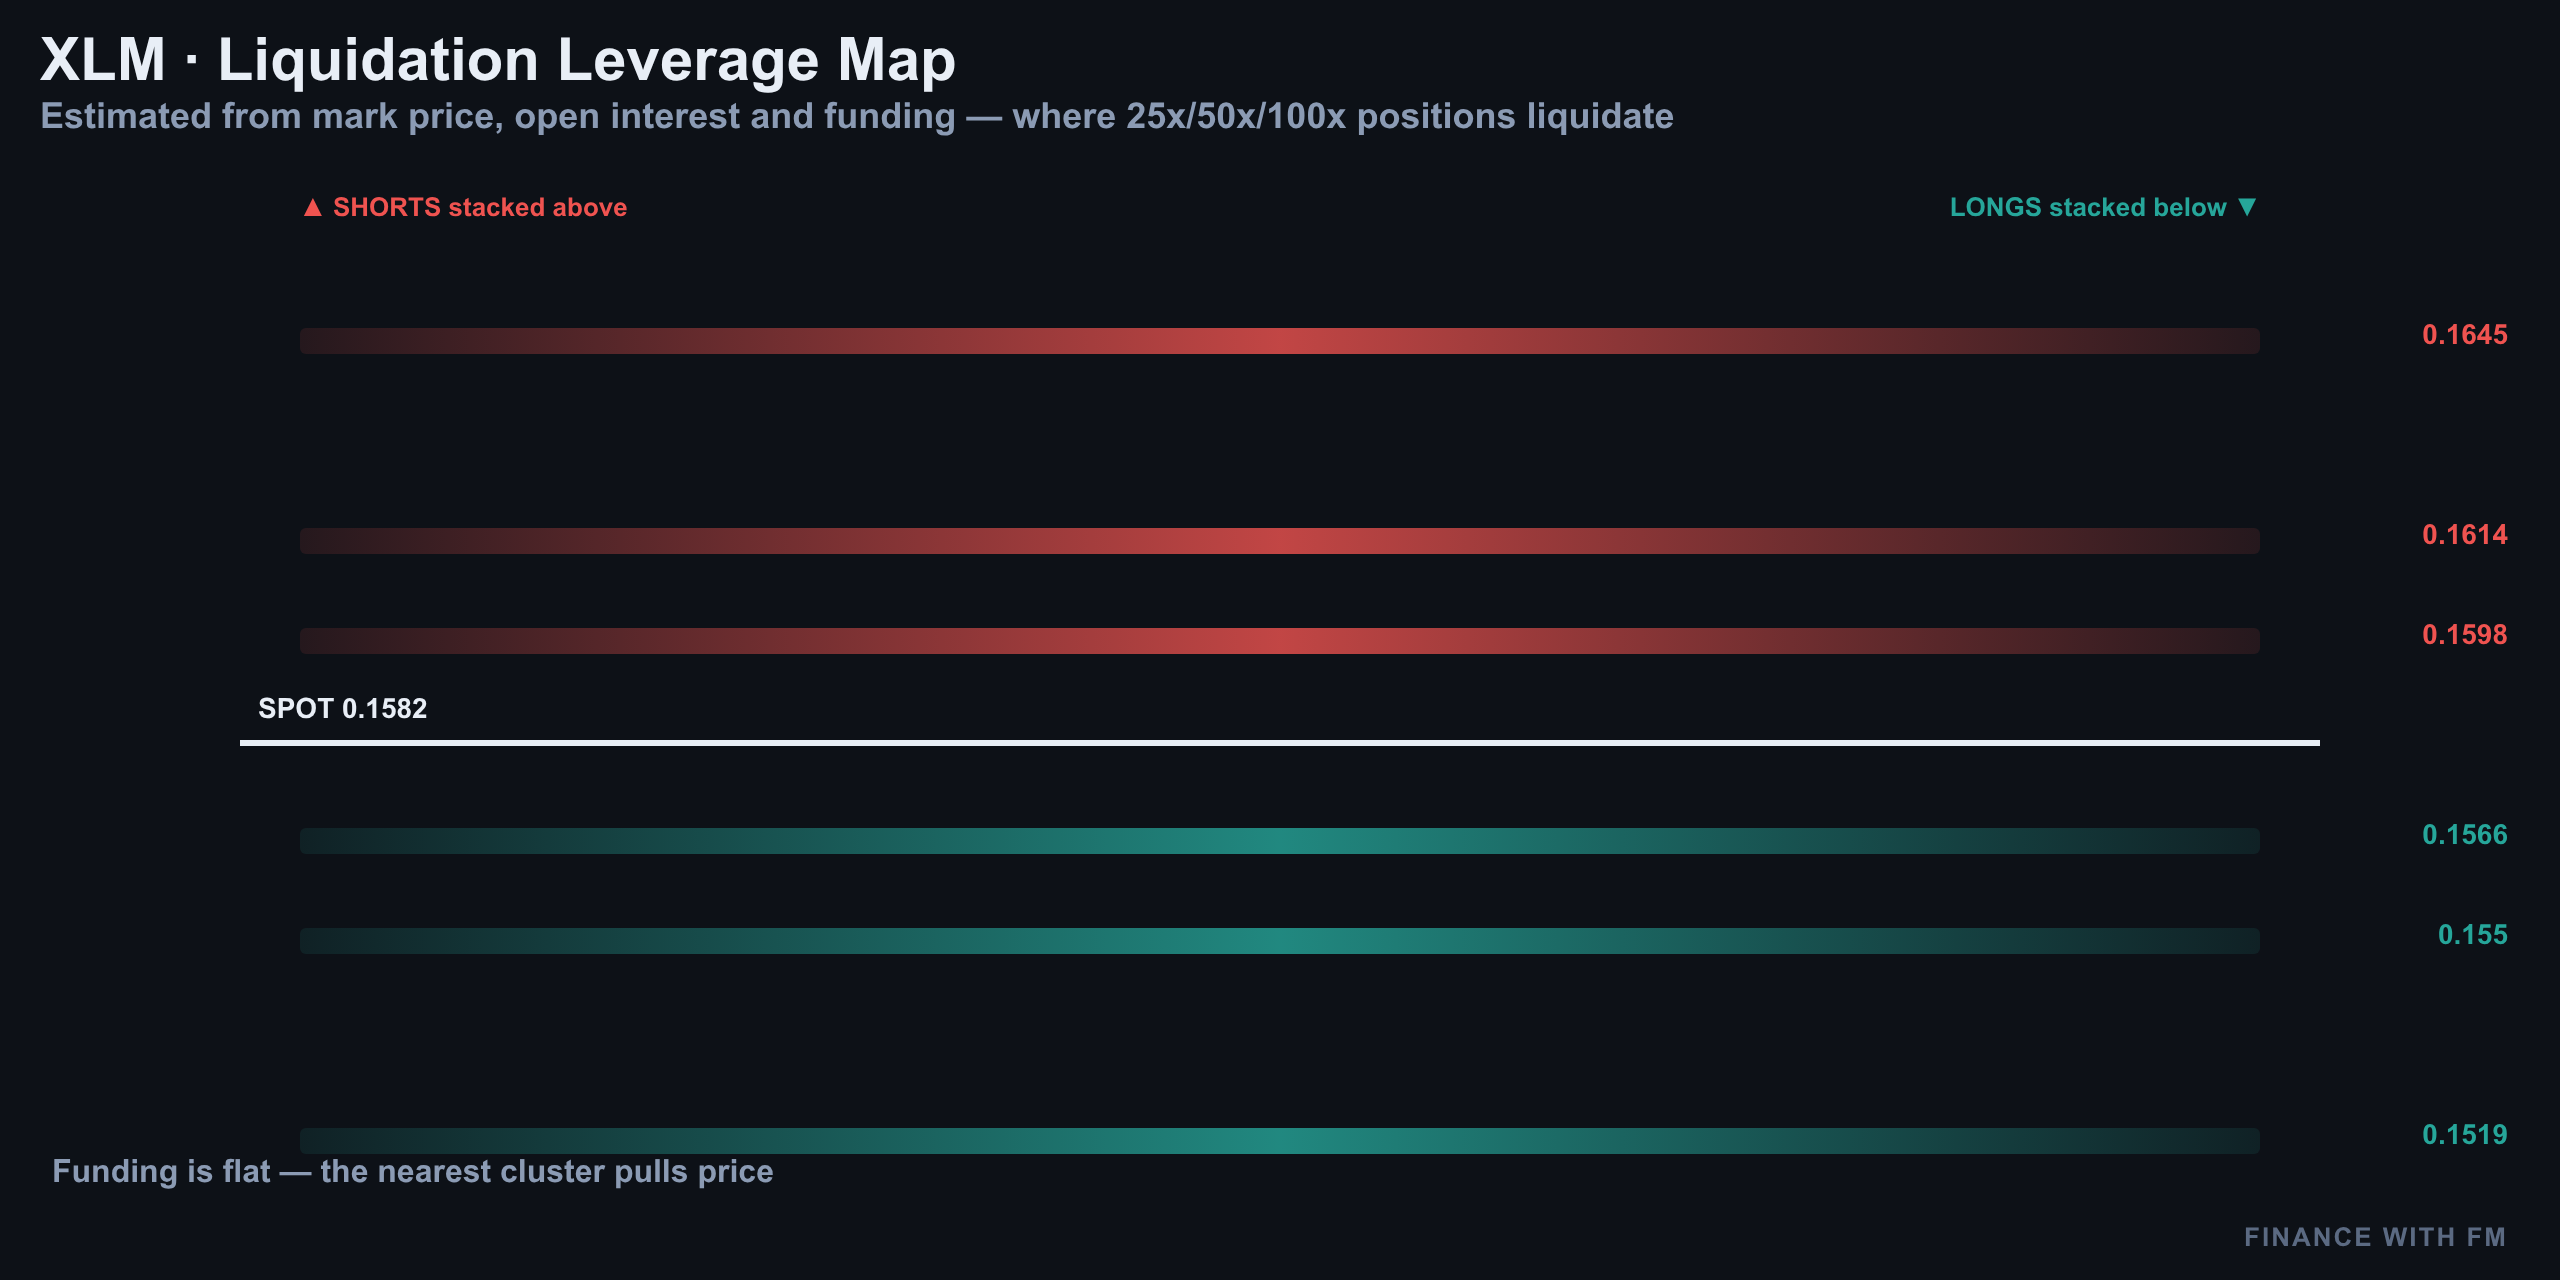
Positioning & Order Flow: Smart Money Long, Tape Selling
Funding is basically flat, near zero percent APR — no one's paying up for leverage in either direction. Open interest fell 4% over the past week, meaning leveraged positions are getting flushed out, not added. Retail is dead balanced at a 1.00 long-short ratio, but top traders lean net long at 1.35.
Here's the tell: taker flow is 67% sell-side — aggressive selling into the tape. Yet the order book still shows 59% bids, anchored by that huge wall at $0.11. Smart money is long; the tape is selling into it.
| Metric | Reading | Interpretation |
|---|---|---|
| Funding Rate | ~0% APR | No leverage skew, neutral cost to hold either side |
| Open Interest (7d) | -4% | Leveraged positions getting flushed, not added |
| Retail Long/Short Ratio | 1.00 | Perfectly balanced — no retail tilt |
| Top Trader Long/Short Ratio | 1.35 | Net long — smart money leaning bullish |
| Taker Flow (Buy/Sell) | 33% / 67% | Aggressive selling into the tape |
| Order Book Bid Share | 59% | Book still leans bullish despite selling |
| Coinbase vs Binance Premium | -0.071% | Discount — US-side selling pressure |
Retail and top traders are aligned in direction (both net-neutral-to-long), so positioning alone gives no edge to fade right now. The real divergence is between the order book (bullish-leaning) and the tape (bearish-leaning) — and between US exchanges and the rest of the world.
Coinbase Discount: The US-Side Tell
Coinbase is trading -0.071% versus Binance right now — a discount. That matters because a persistent positive premium is usually the fingerprint of US spot and ETF-style buying, while a discount means American holders are the ones hitting the bid on the sell side, not the buy side. It's a subtle signal, but combined with the 67% sell-side taker flow, it paints a picture of US-based selling pressure meeting a still-bullish global order book.
For context on the broader tape, Stellar's infrastructure narrative remains constructive — the network continues expanding institutional rails, including plans tied to US securities settlement tokenization and new Tier 1 validators like MoneyGram and Figure. That's a medium-term tailwind that doesn't show up in a 24-hour candle, but it's part of why top traders may be staying net long even as short-term flow sells.
Desk Snapshot & The Trade Setup
Pulling it together: momentum is neutral-to-fragile-bullish (RSI 34, MACD barely flipped positive), structure is still capped by resistance on both the 15-minute and 4-hour charts, and positioning is calm on the surface but aggressively sold underneath. That combination — quiet price, loud order flow — is exactly the setup that tends to snap hard once the $0.1595 ceiling breaks one way or the other.
| Signal | Reading |
|---|---|
| Spot Price | $0.1582 |
| 24h Change | +0.1% |
| RSI (14) | 34 — Neutral |
| MACD | Fragile bullish cross |
| 15-min Structure | Boxed between $0.1565–$0.1595 |
| 4-hour Structure | Testing top of descending channel |
| Key Resistance | $0.1595 |
| Liquidation Magnet | $0.1610 |
| Major Bid Wall | $0.11 |
The Setup — 1:2.5 (Not Advice)
| Parameter | Level |
|---|---|
| Entry (Short) | $0.1588 — into resistance rejection |
| Stop Loss | $0.1604 — above ask wall, invalidates the trap |
| Target | $0.1548 — back toward the 15-min floor / channel support |
| Risk:Reward | ~1:2.5 |
Not Financial Advice — What To Actually Watch
None of this is financial advice — it's a structured read of price, momentum, and order flow at a single point in time, meant to inform your own process, not replace it. Crypto markets are volatile and levels can invalidate in minutes.
- Watch for a clean 4-hour candle close above $0.1595 — that's the bias-flip level
- A rejection at $0.1595 keeps the descending channel and the short bias intact
- Falling open interest (-4% weekly) means less fuel for a violent move either way right now
- The Coinbase discount is worth tracking daily — a flip to premium would suggest US buyers stepping back in
- The $0.11 bid wall is far away and not relevant to today's trade, but it's the line in the sand for any deeper structural break
Check back tomorrow for the next Stellar Daily Pulse, where we'll see whether this resistance trap finally breaks — and whether yesterday's still-live short finally gets its resolution.
08/16/2026 — XLM Daily Pulse Aug 16: The Squeeze Below the Surface
XLM Daily Pulse Aug 16: The Squeeze Below the Surface
Where We Left It: Yesterday's Short Is Still Live
Before we get into today's setup, a quick scorecard. Yesterday's call was a short from $0.1605, targeting $0.1557, with a stop at $0.1623. That trade is still open — nothing's been triggered either way. Price has drifted down roughly 0.7% since then, from around $0.1591 to today's $0.158.
XLM is trading around $0.158 right now, down a little over half a percent on the day. The intraday structure is bearish: price got rejected off an ascending wedge on the 15-minute chart, and the 4-hour is still boxed under a falling channel. Momentum is soft rather than panicked, positioning is split between retail and smart money, and the heaviest recent liquidation zone sits just above spot.
Net-net: the lean today is short, with a hard invalidation if buyers reclaim the mid-$0.159s.
15-Minute Intraday: Rejected at the Wedge Top
Zoom into today's session and the story is clean. XLM built a rising wedge through the New York session, climbing from about $0.155 up toward almost $0.160. The top-side trendline held. Price spiked into it, printed a long upper wick, and immediately sold off — a classic wedge rejection, the kind of move that traps late longs who bought the breakout that never came.
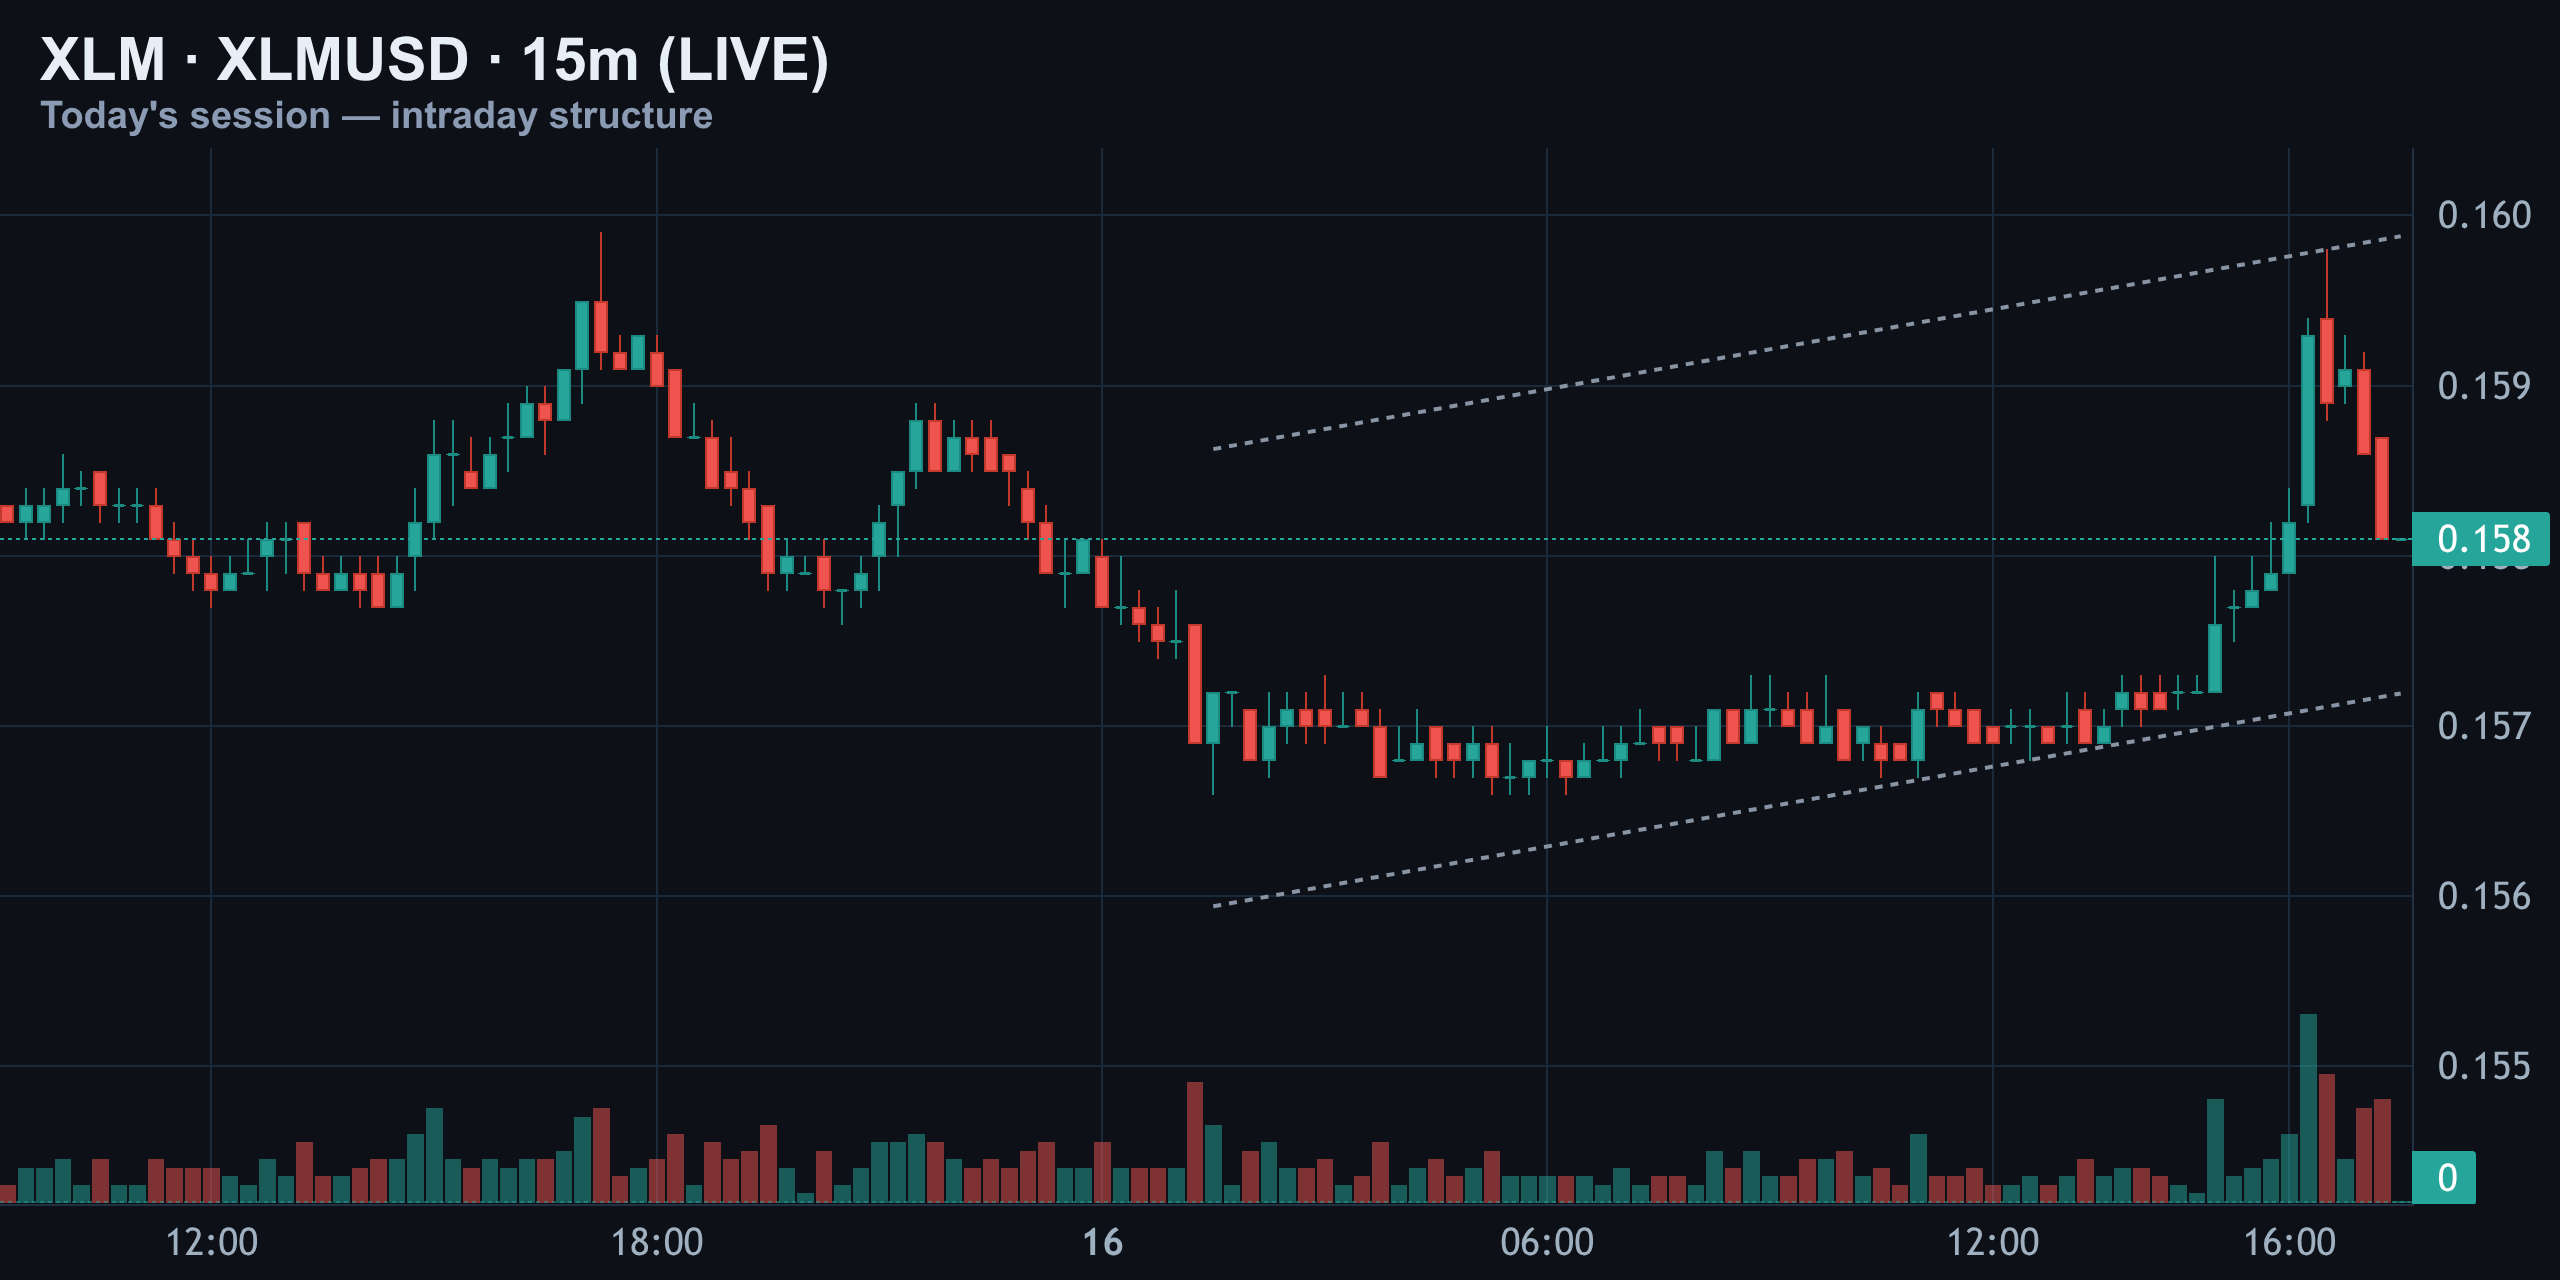
Right now price is unwinding back toward the $0.158 pivot. If wedge support breaks, the drop could accelerate fast. In plain terms: XLM tried to break higher, failed, and is now pulling back.
4-Hour Structure: Still Boxed Under the Falling Channel
Step back to the 4-hour chart and the bigger picture is a market still trapped. Since topping near $0.175 on August 2, XLM has carved a lower-high, lower-low channel all the way down. Every attempt to push through the $0.159–$0.161 zone has been sold.
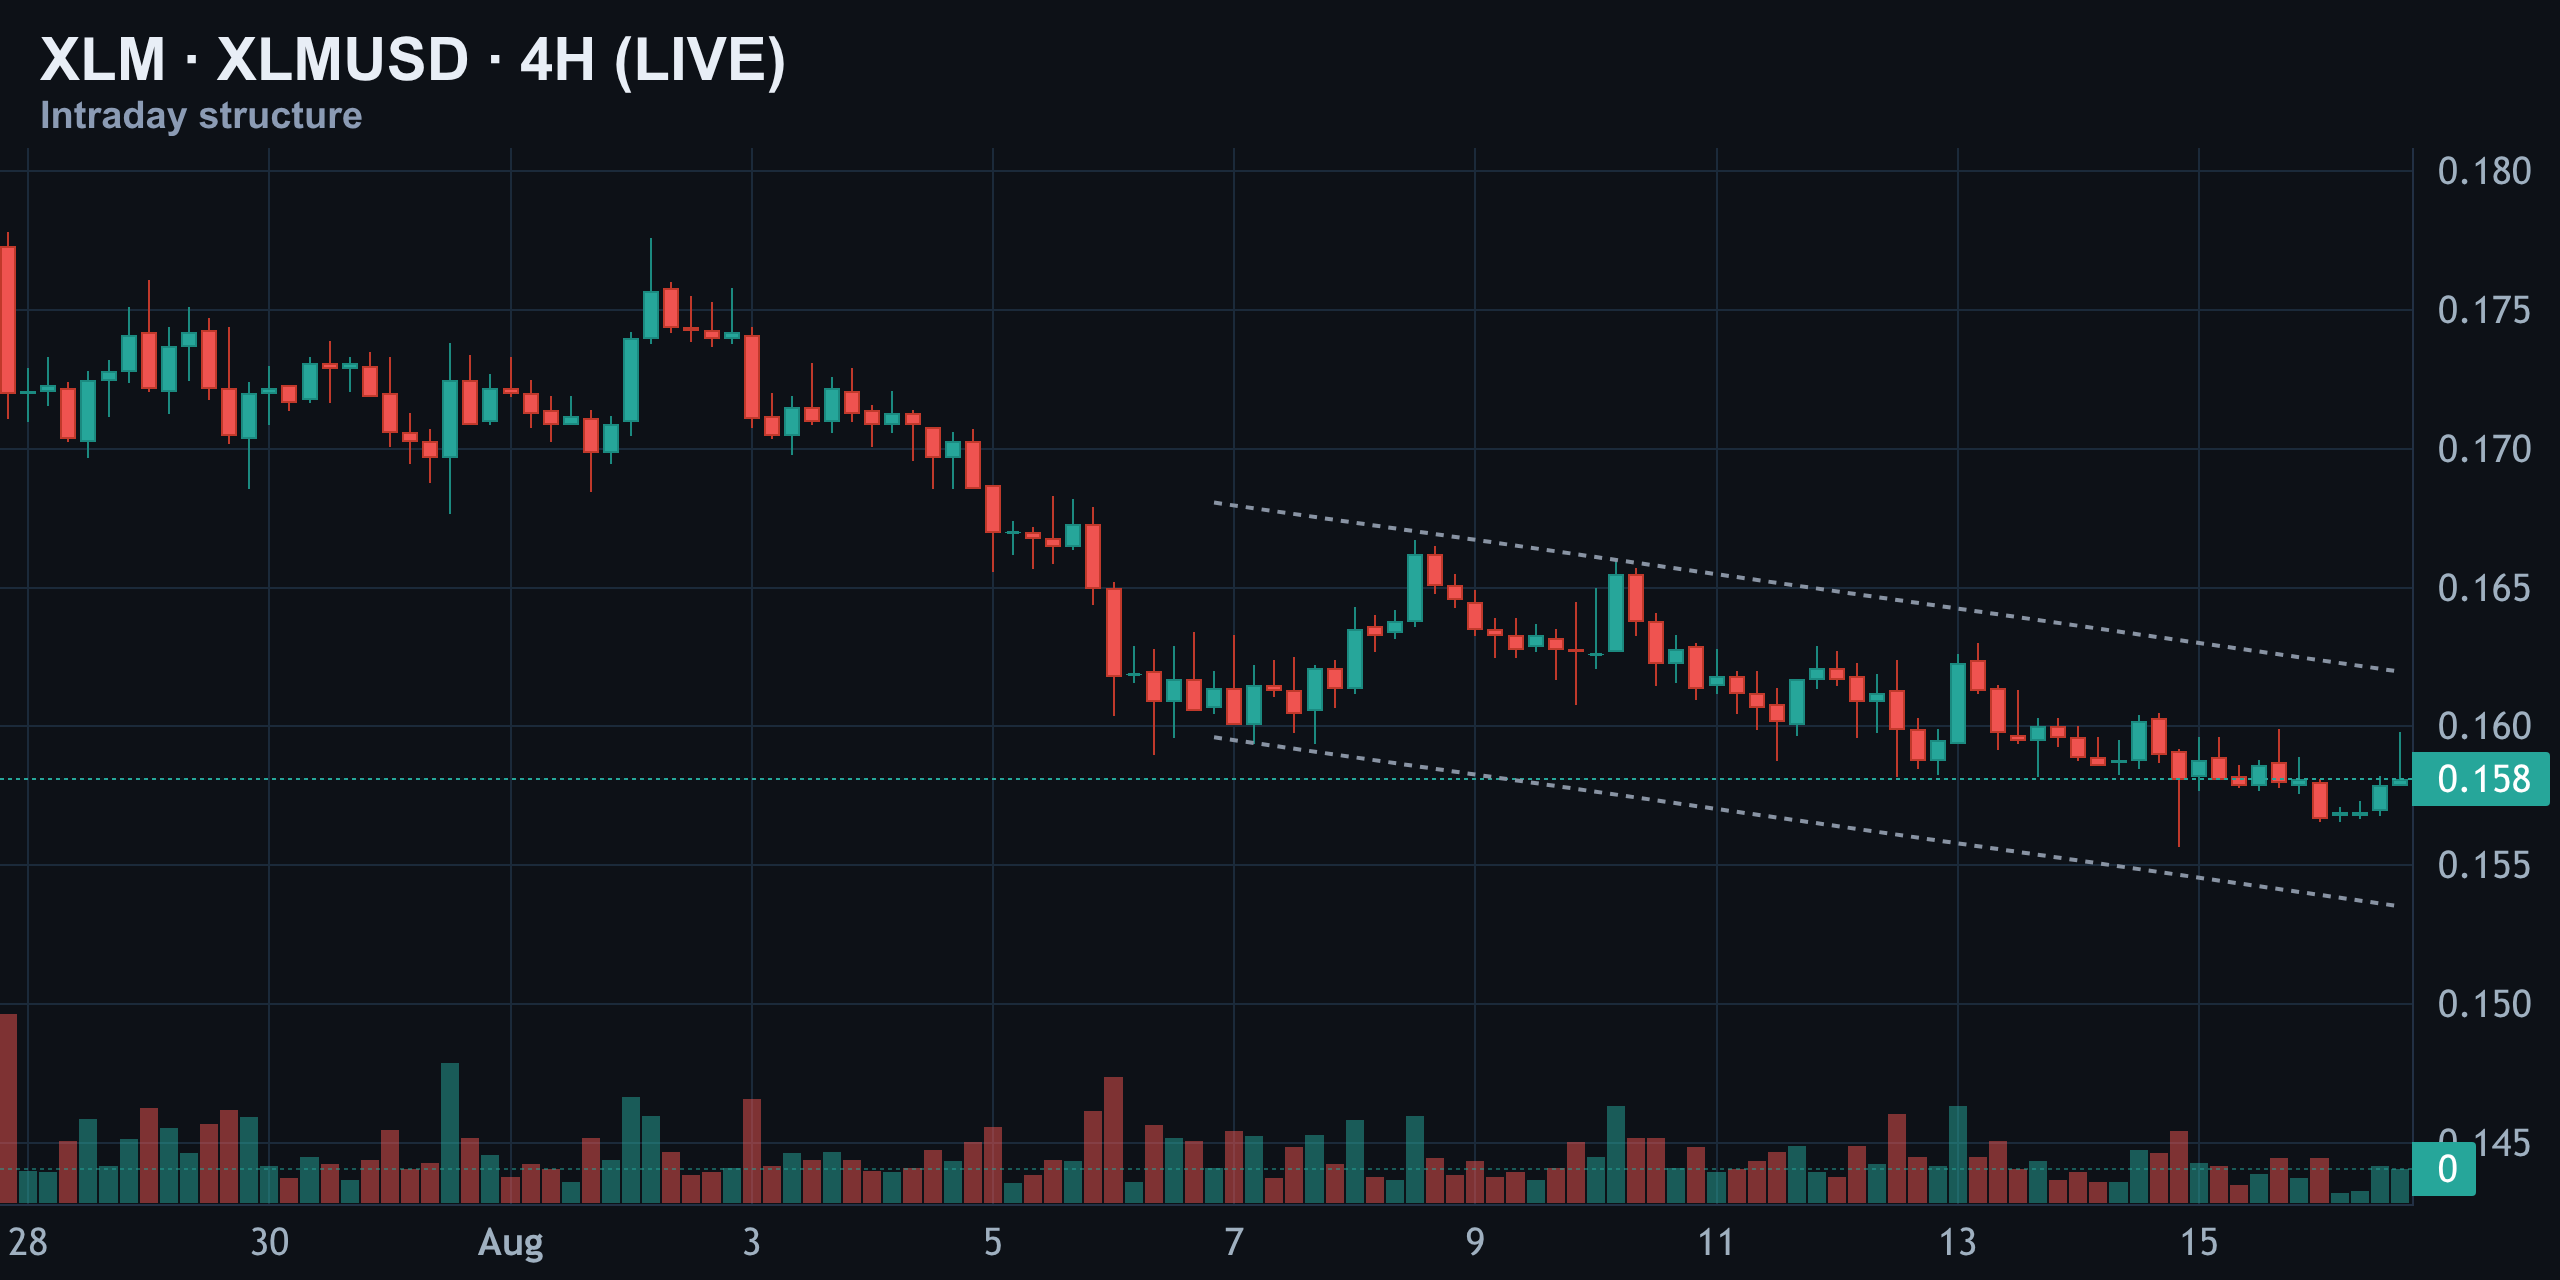
The recent bounce off channel support around $0.157 is encouraging, but until price closes back above that descending trendline, this remains a sell-the-rally structure, not a buy-the-dip one. In plain terms: XLM is still stuck in a downtrend on the bigger 4-hour timeframe.
Daily Chart: Trapped Between the Wall and the Floor
On the daily, XLM is still digesting the huge spike from late May that took it up near $0.30 before it collapsed. Since then it's been one long descending channel — lower highs stacking on lower lows. The $0.1395 level marks the range floor, and price is currently parked almost dead-center at $0.158.
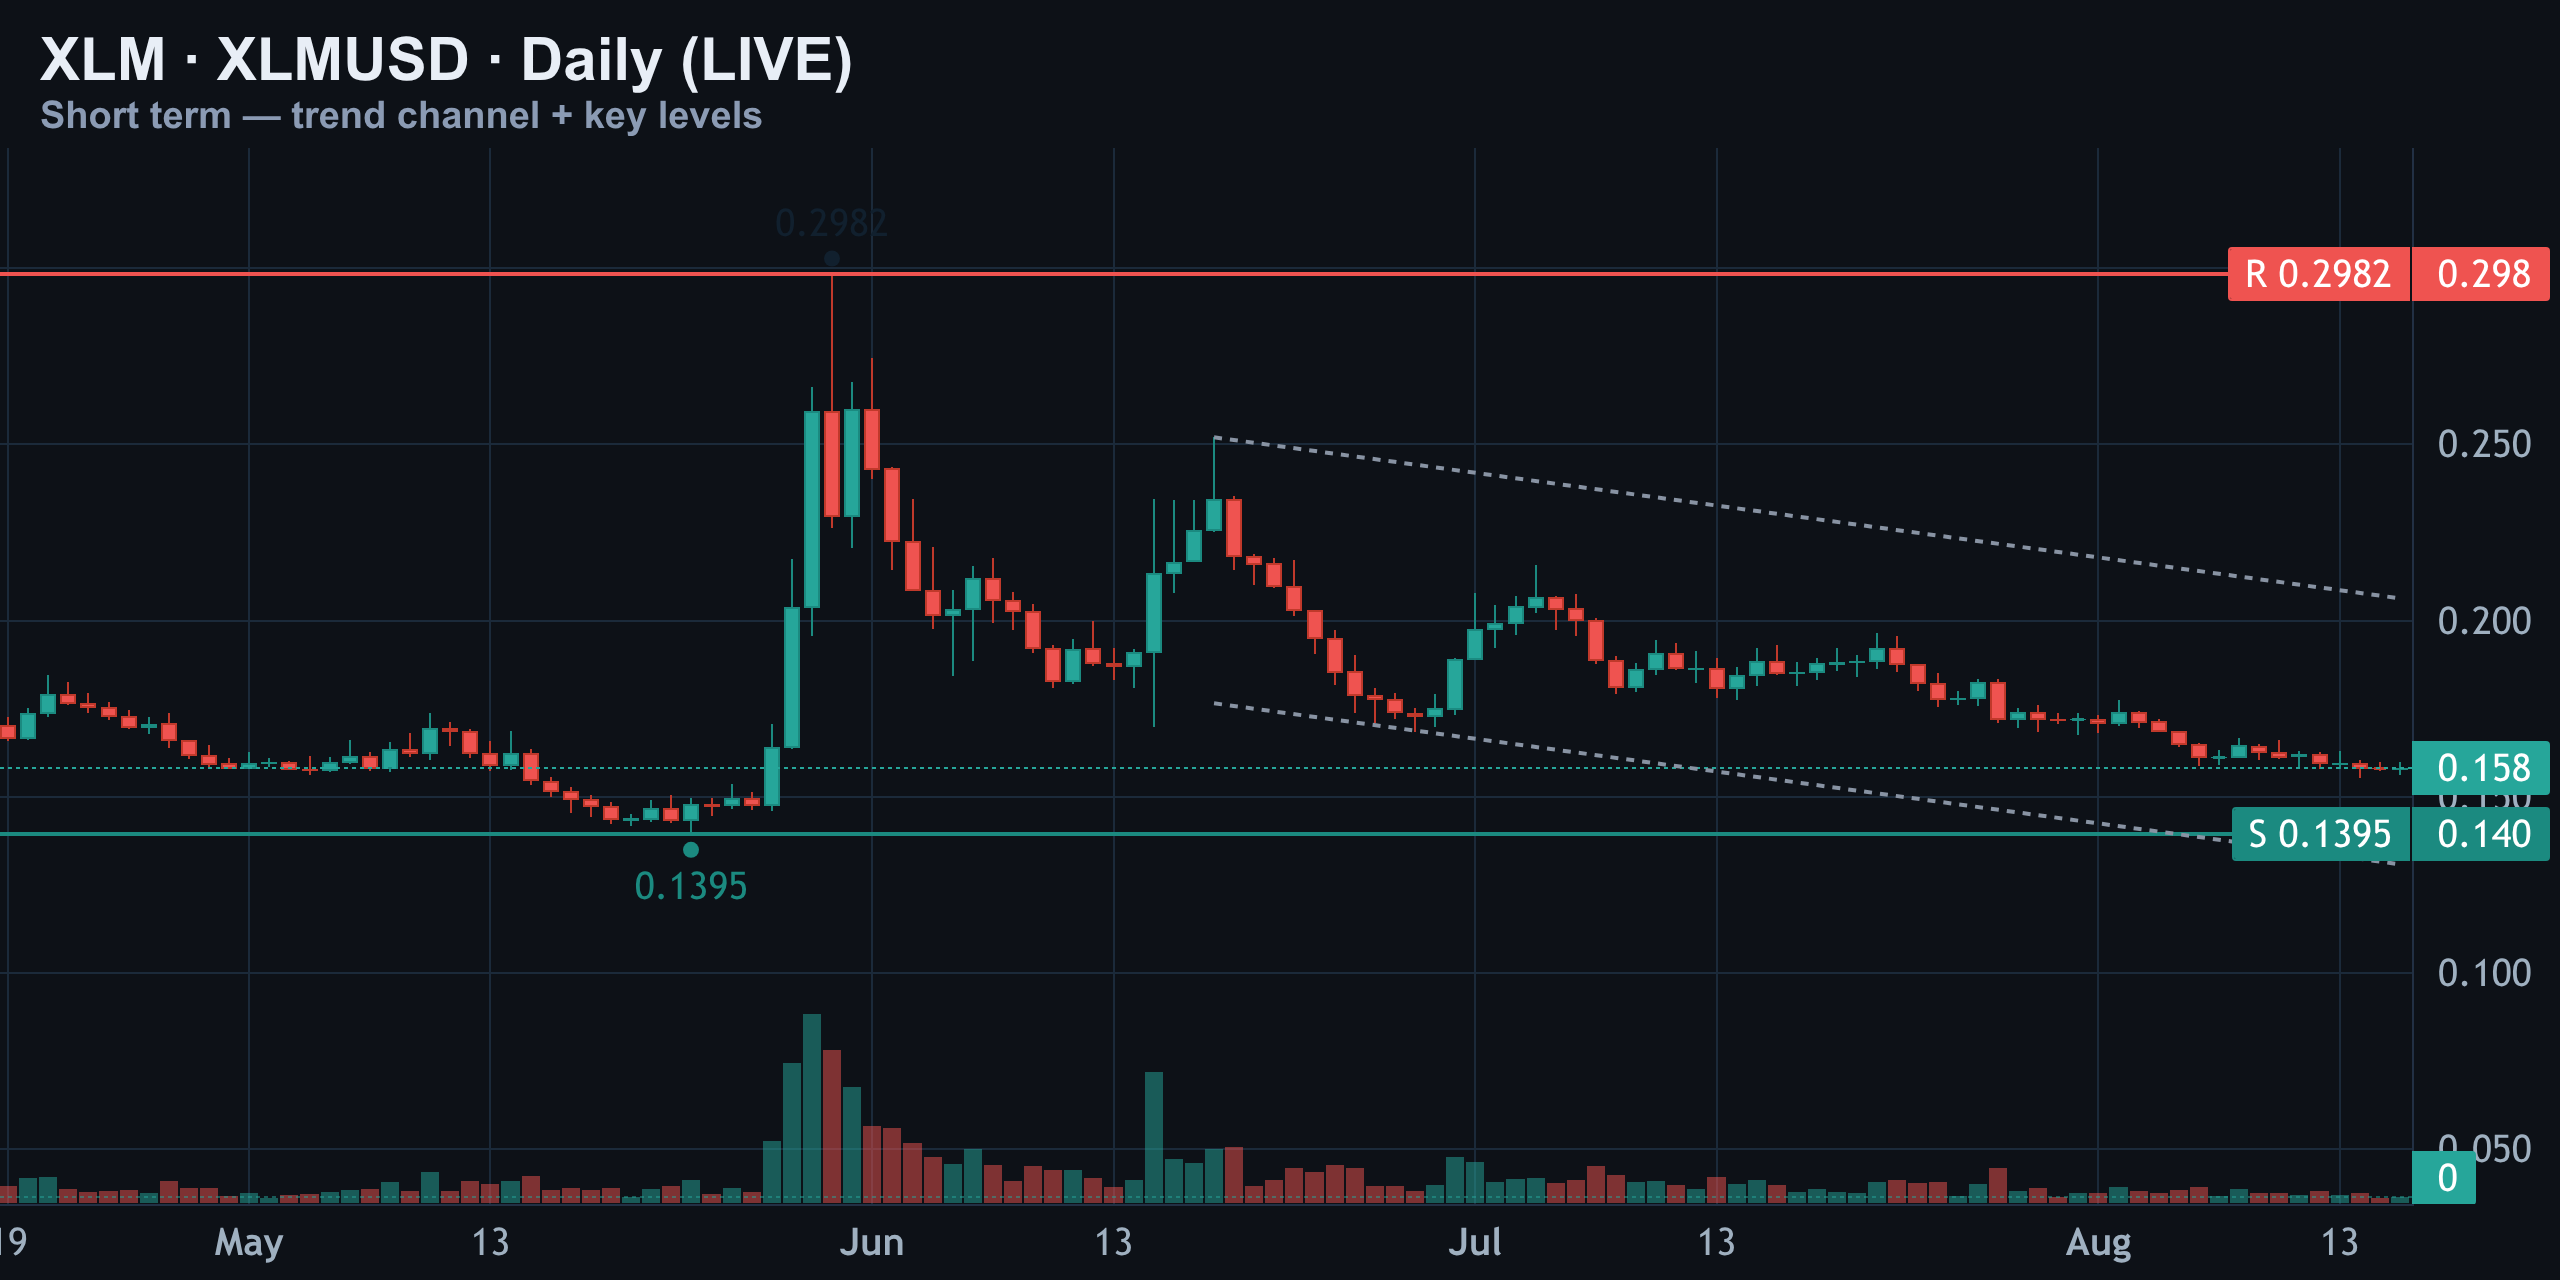
This is consolidation, not conviction. The market is waiting for a catalyst to pick a direction out of this channel. In plain terms: XLM has been slowly grinding lower inside a long-term downtrend.
Momentum Check: RSI and MACD Both Favor Sellers
Momentum backs up the cautious read. The 14-day RSI is sitting at 32 — neutral-to-weak, brushing against oversold but not confirming a bounce yet. Compare that to late May, when RSI spiked above 80 during the huge rally; since then it's been a steady grind lower with no real bullish divergence to lean on.
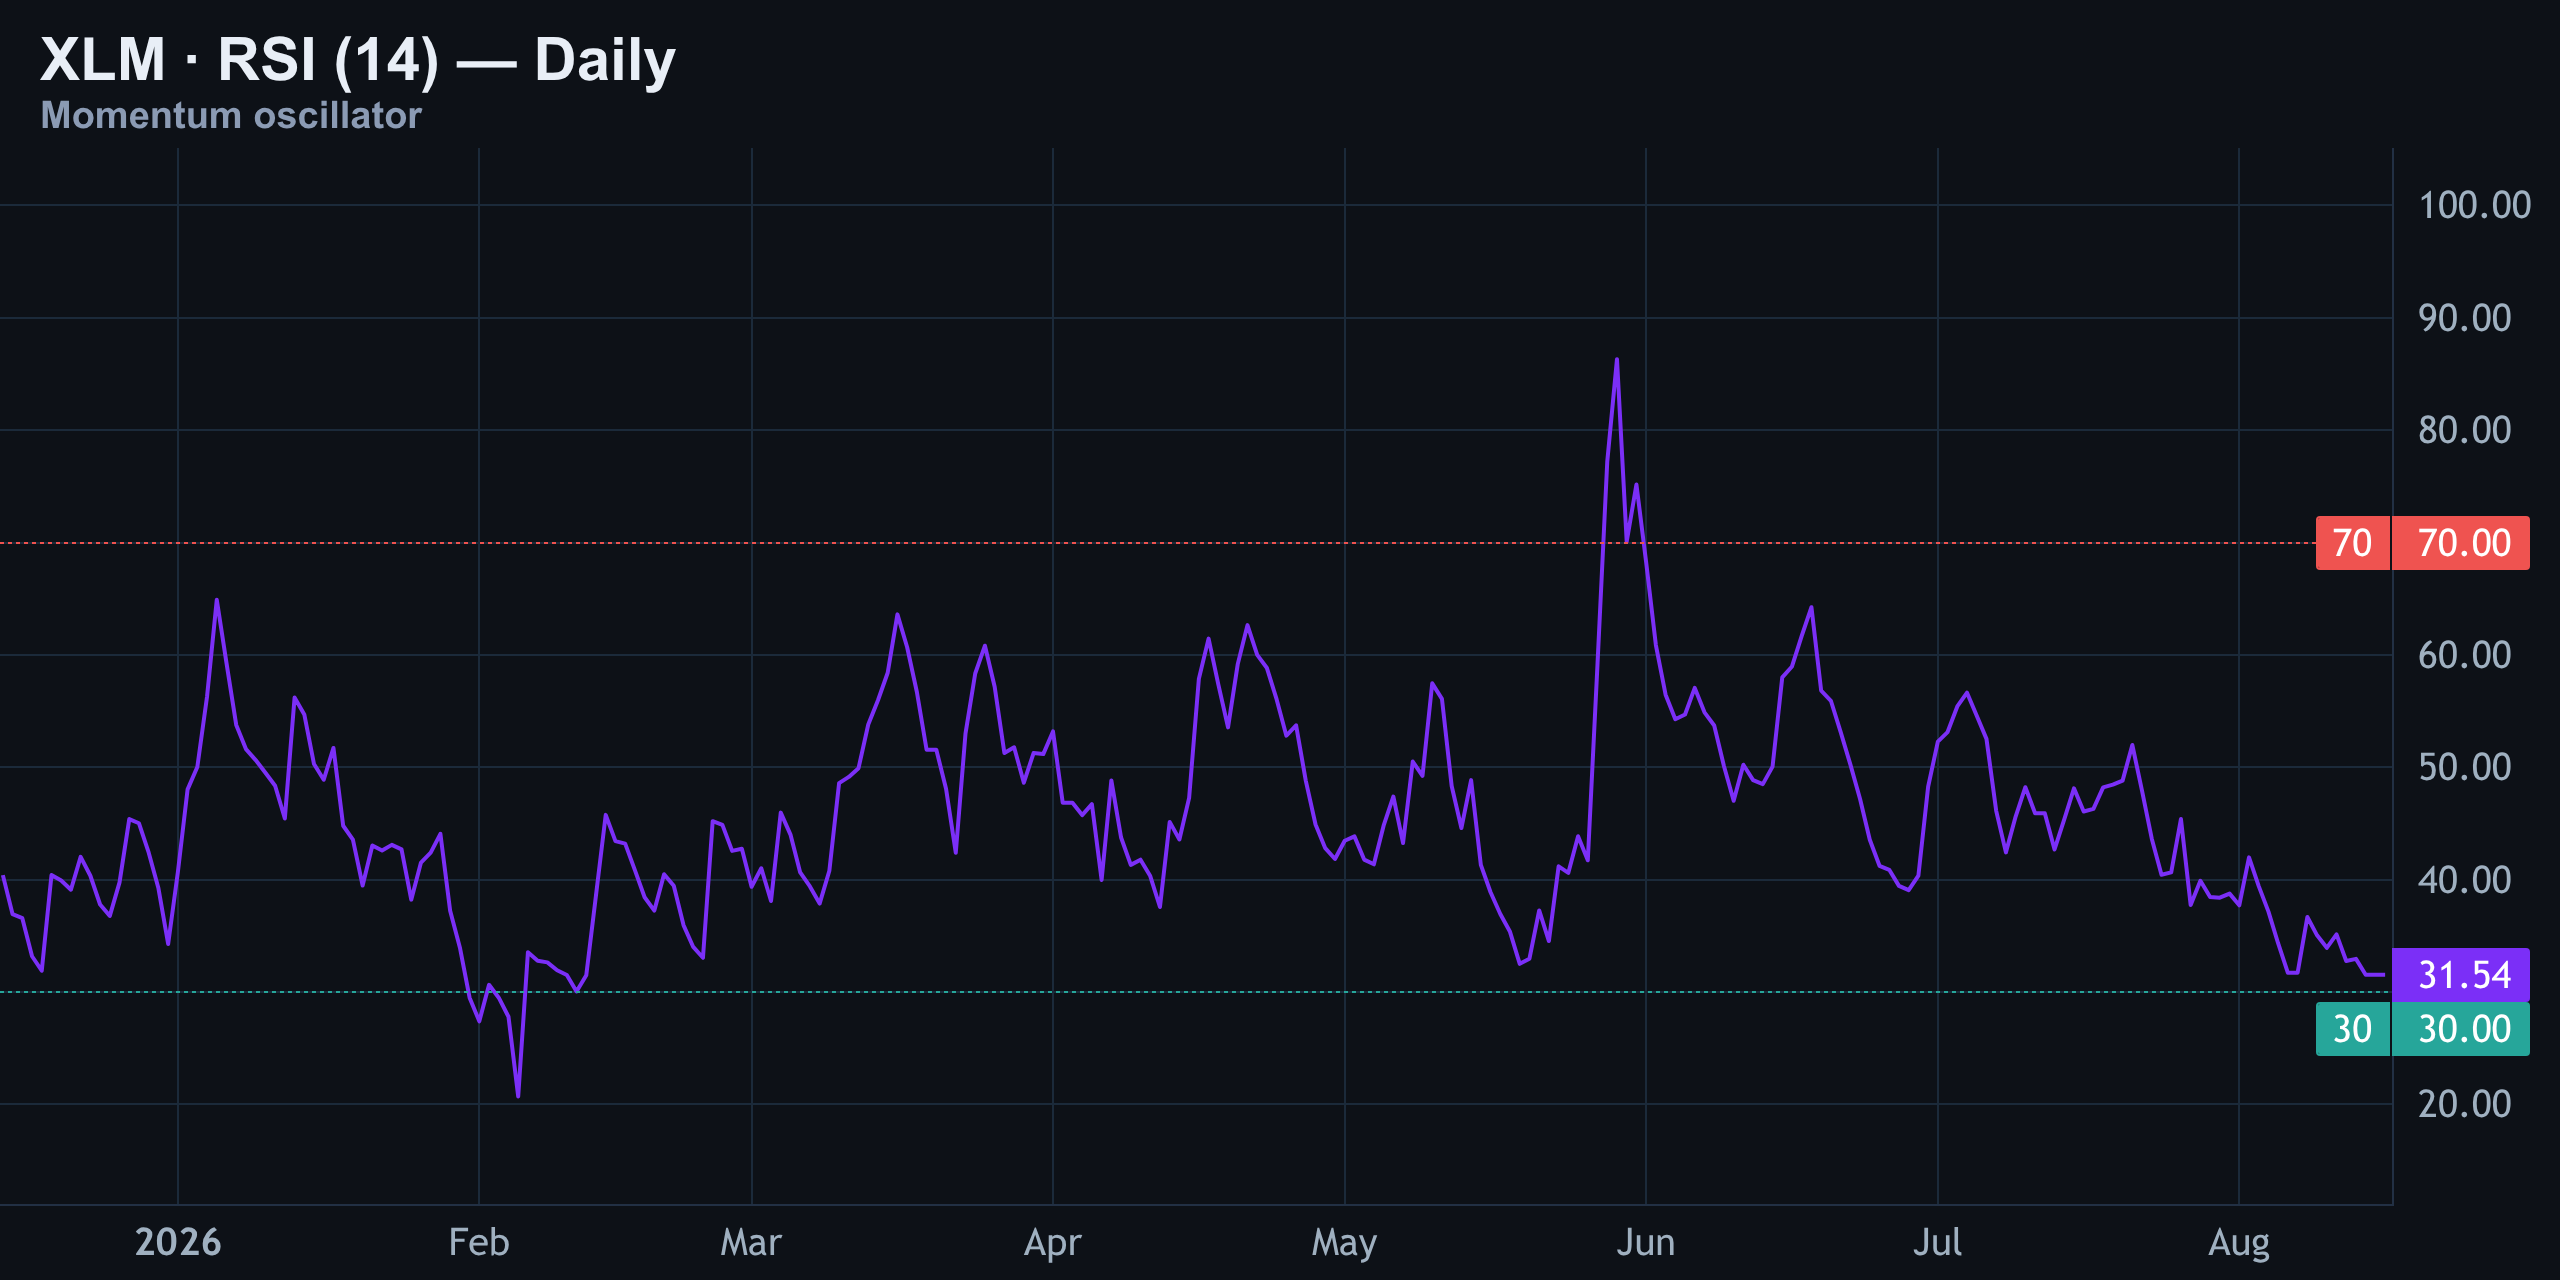
This tells you sellers still have control, even if they're not slamming the gas pedal.
The MACD confirms the same story. The MACD line is running below the signal line, both stuck in negative territory, with the histogram bars still red. That's downside momentum holding the wheel. There was a brief bullish pop in early June tied to that price spike, but it's long faded — since early July this indicator has been rolling over with lower highs.
Until MACD crosses back positive, momentum traders have no reason to fade the short bias.
Liquidation Heatmap and the Levels to Watch
Here's the trap sitting just above spot. The key resistance runs from $0.158 rolling into $0.1608, where the biggest ask wall sits — backed by a dense liquidation zone near $0.1613 that has already cleared out over $1.5 million in leverage. Below, there's a smaller cluster right under spot near $0.1579, and the real floor is the massive bid wall at $0.1489.
| Level | Price | Why It Matters |
|---|---|---|
| Major liquidation cluster (resistance) | $0.1613 | Over $1.5M in leveraged longs already flushed here |
| Ask wall / wedge top | $0.1600–$0.1608 | Where today's rejection printed |
| Bias invalidation | ~$0.1590–$0.1595 | A reclaim here flips the short lean |
| Current spot | $0.1580 | |
| Minor support cluster | $0.1579 | Sits just under current price |
| Range floor / major bid wall | $0.1489 | The real floor of the current channel |
| Deep structural floor | $0.1395 | Bottom of the multi-week daily range |
That's the range XLM is trading inside today — a squeeze between a wall that's already eaten real leverage and a floor that's absorbed every dip so far.
Positioning and Order Flow: Retail vs. Smart Money
Here's the tension underneath the price action. Funding is near neutral at just +9% annualized, but longs are the ones paying — a sign of crowded, complacent longs. Open interest has drained 3.6% over the week, which is leverage getting flushed out, not fresh conviction coming in.
| Metric | Reading | Interpretation |
|---|---|---|
| Retail positioning | Net short (0.94) | Crowd is leaning short |
| Top-trader positioning | Net long (1.29) | Smart money is leaning long — a genuine divergence |
| Funding rate | +9% APR (longs pay) | Crowded, complacent long base |
| Open interest (7-day) | -3.6% | Leverage unwinding, not building |
| Taker flow | 1.12 buy-skewed | Aggressive buying beneath the surface |
| Order book | 63% bids | Book is stacked toward the buy side |
| Coinbase vs. Binance spread | -0.079% | Coinbase discount — US-side selling |
Mixed signals, no doubt — buy-skewed taker flow and a bid-heavy order book alongside a bearish chart. But the combination of a crowded, funding-paying long base with top traders quietly positioned long is the story to track if this range finally breaks.
The Trade Setup: Entry, Stop, and the Level That Kills It
Putting it all together: intraday rejection, a 4-hour channel still capping price, soft-but-negative momentum, and a liquidation wall stacked just overhead. The lean is short, targeting a reward-to-risk near 1:2.5.
| Parameter | Level |
|---|---|
| Bias | Short |
| Entry zone | $0.1600 – $0.1608 |
| Stop-loss | $0.1623 |
| Target 1 | $0.1579 |
| Target 2 | $0.1557 |
| Bias invalidation | Reclaim/close above ~$0.1595 |
| Reward-to-risk | ~1:2.5 |
The trap in this setup is the liquidation wall itself. It's already absorbed over $1.5M in leverage near $0.1613, which means a sharp poke above the entry zone before reversing is entirely possible — that's exactly why the stop sits above the wall, not inside it.
Summary: XLM is squeezed between a resistance wall that's already claimed real leverage and a support floor that keeps absorbing dips. Retail is short, smart money is long, funding says longs are paying to stay in, and open interest is draining. Until price closes decisively outside the $0.149–$0.161 box, this stays a range to fade rather than a trend to chase.
Analysis and education, not investment advice. See our editorial policy.