Daily market analysis
BNB (BNB) technical analysis today
Last updated
BNB Elliott Wave: Broken Impulse Signals Reversal Risk
BNB's 'Impulse' Broke Two Rules — Here's What's Really Next
BNB is trading around $602–$604 as of today, sitting almost exactly on top of the level that decides whether the last few weeks of gains are the start of something bigger — or the final gasp of a correction (,,). On the surface, the rally off the May low near $556 looks like a textbook five-wave impulse into $620.55. Zoom into the actual wave structure, though, and it breaks two rules that Elliott Wave theory does not bend on: a wave two that retraced more than 100% of wave one, and a wave four that overlaps into wave one's price territory.
That's not a technicality. Two rule violations in the same structure means this isn't a clean impulsive uptrend — it's corrective. And if it's corrective, price should eventually give back a meaningful chunk of that move rather than break out to new highs. Right now, BNB is stalled at $601, the exact pivot that separates the bearish continuation case from the bullish 'correction is over' case.
BNB 4H — A Broken Impulse Rewrites the Bias
The automatic count on the 4-hour chart labels a one-through-five up from the ~$556 low, followed by wave A at $573.50 and wave B at $620.55. Measure the internal waves, though, and the structure fails Elliott's own rulebook twice over.
- Wave two retraced more than 100% of wave one — a hard violation. A real wave two can dip deep, but it can never fully erase wave one.
- Wave four drops back into wave one's price range — another overlap violation that a valid impulse cannot have.
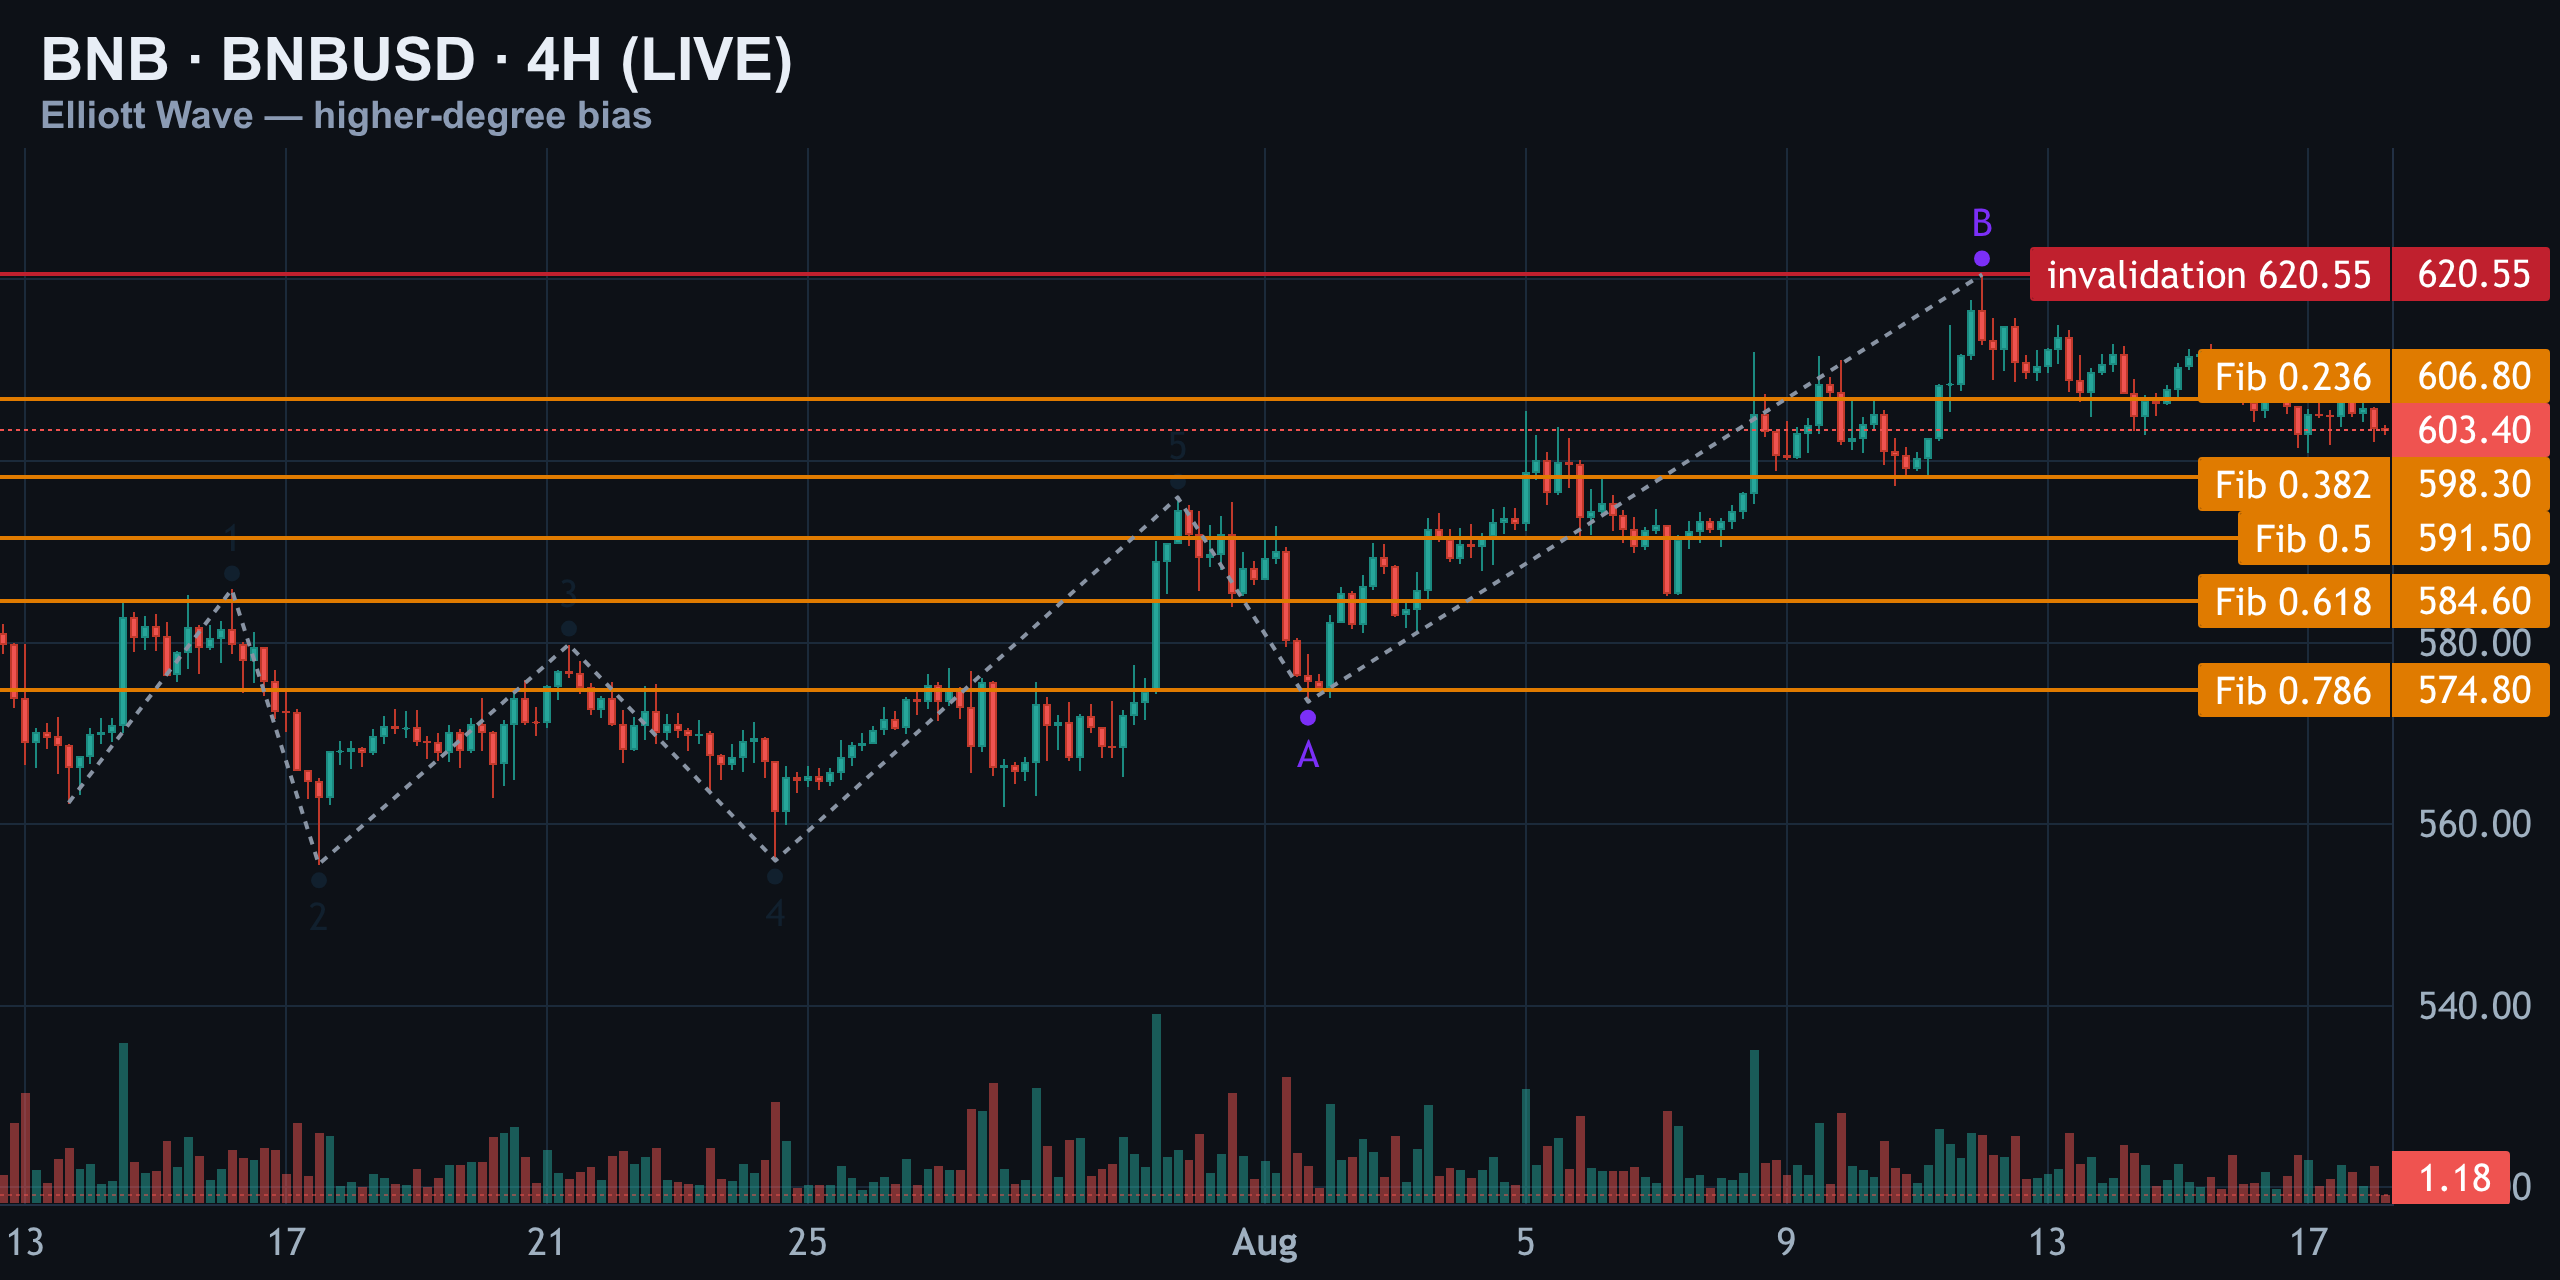
With both rules broken, the more likely read is that this entire move off the $555 low is a larger zigzag or double-zigzag correction — meaning the rally into $620.55 completed a wave B, not a fresh wave one of a new uptrend. That single reframe changes everything downstream: the stall happening right now near $603 would be the early stage of wave C, not a pause inside a healthy uptrend.
Using the $562 → $620.55 swing, the Fibonacci grid gives the zones where wave C should find support if this corrective read is correct:
| Fib Level | Price |
|---|---|
| 0.236 | $606.80 |
| 0.382 | $598.30 |
| 0.500 | $591.50 |
| 0.618 | $584.60 |
BNB 1H — Primary Count vs Two Alternates
Drop to the 1-hour chart and the same overlap problem shows up again: the rally from $585.30 into $611.55 has a wave four that overlaps wave one, disqualifying it as a clean impulse. The signal worth trading is what happened after — an A-B-C decline where wave A bottomed at $597.32, wave B spiked to $620.55 (1.63x wave A, deep into expanded-flat territory), and wave C printed at $601.01.
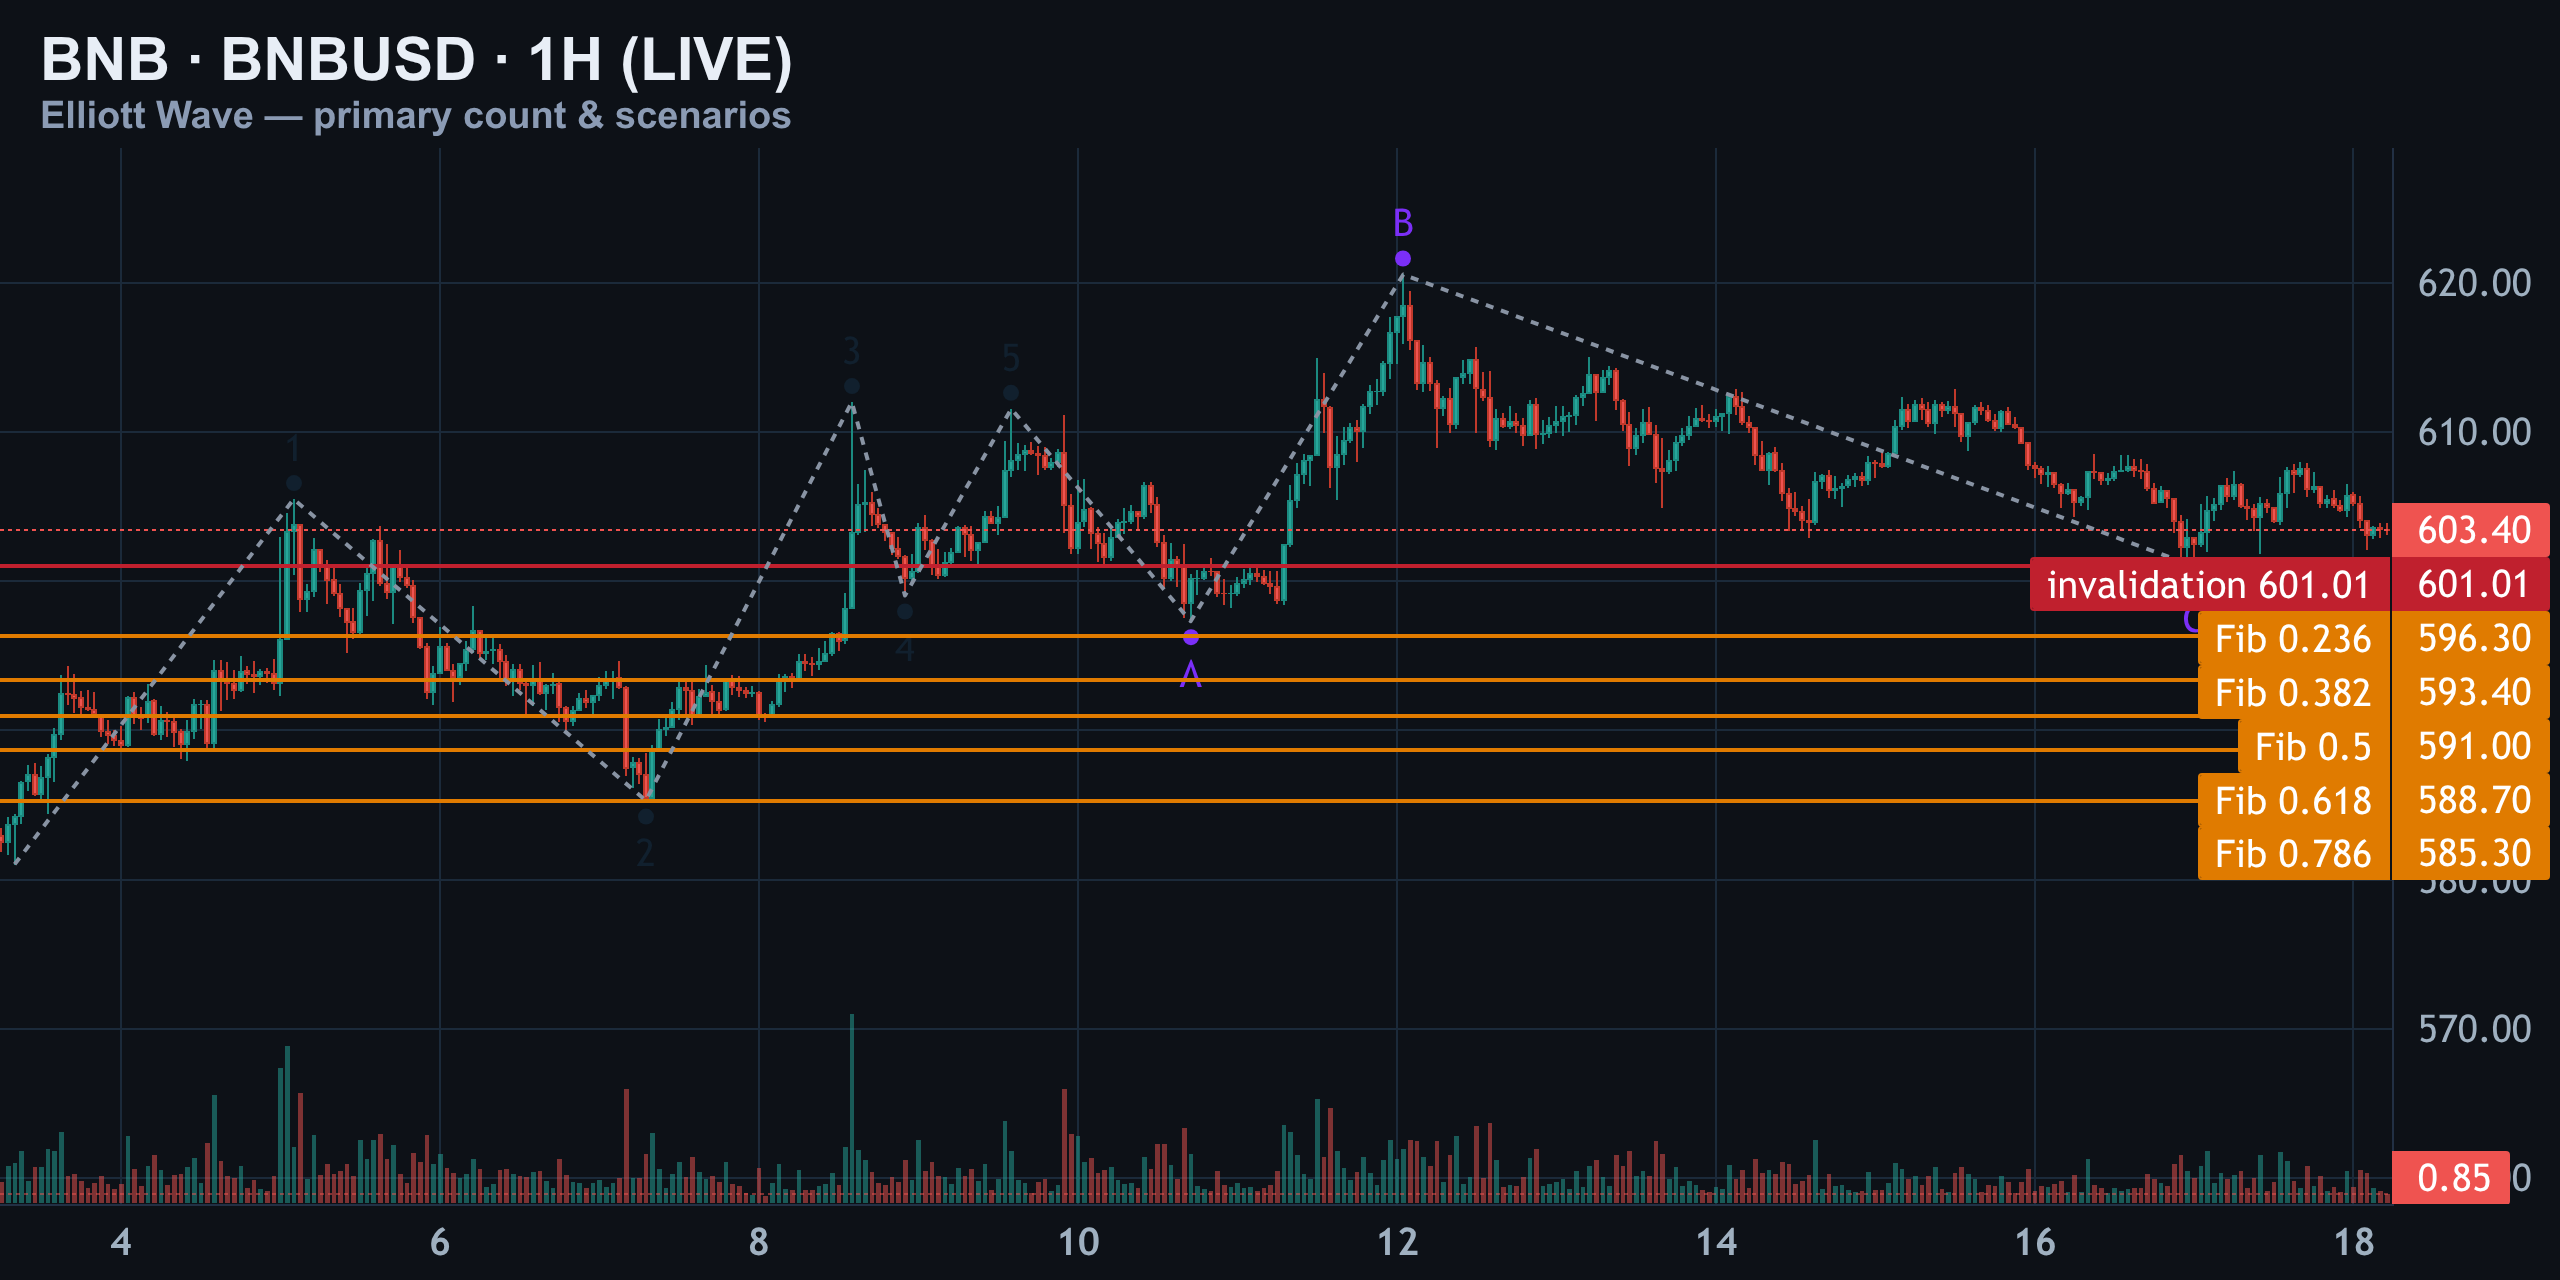
That gives three live scenarios stacked on top of one another, all converging on the same tiny decision zone between $601 and $607:
| Scenario | Trigger | Implication |
|---|---|---|
| Primary — correction complete | Holds above $601.01 | Wave C is done; grind higher resumes |
| Alternate 1 — bearish continuation | Close below $601.01 | Wave C extends into $598.30 → $591.50 → $588.70 |
| Alternate 2 — bullish breakout | Reclaim and hold above $606.80 | Correction already bottomed; retest of $620.55+ |
BNB 15M — The Trigger Zone
For timing, the 15-minute chart is where the fuse sits. The decline from $612.85 into $601.01 is labeled as a one-through-five, but wave three inside that sequence is the shortest of the three motive waves — another hard rule break, since wave three can never be the shortest in a genuine impulse. That means this decline is corrective too, most likely a diagonal or simple ABC rather than a true five-wave motive move.
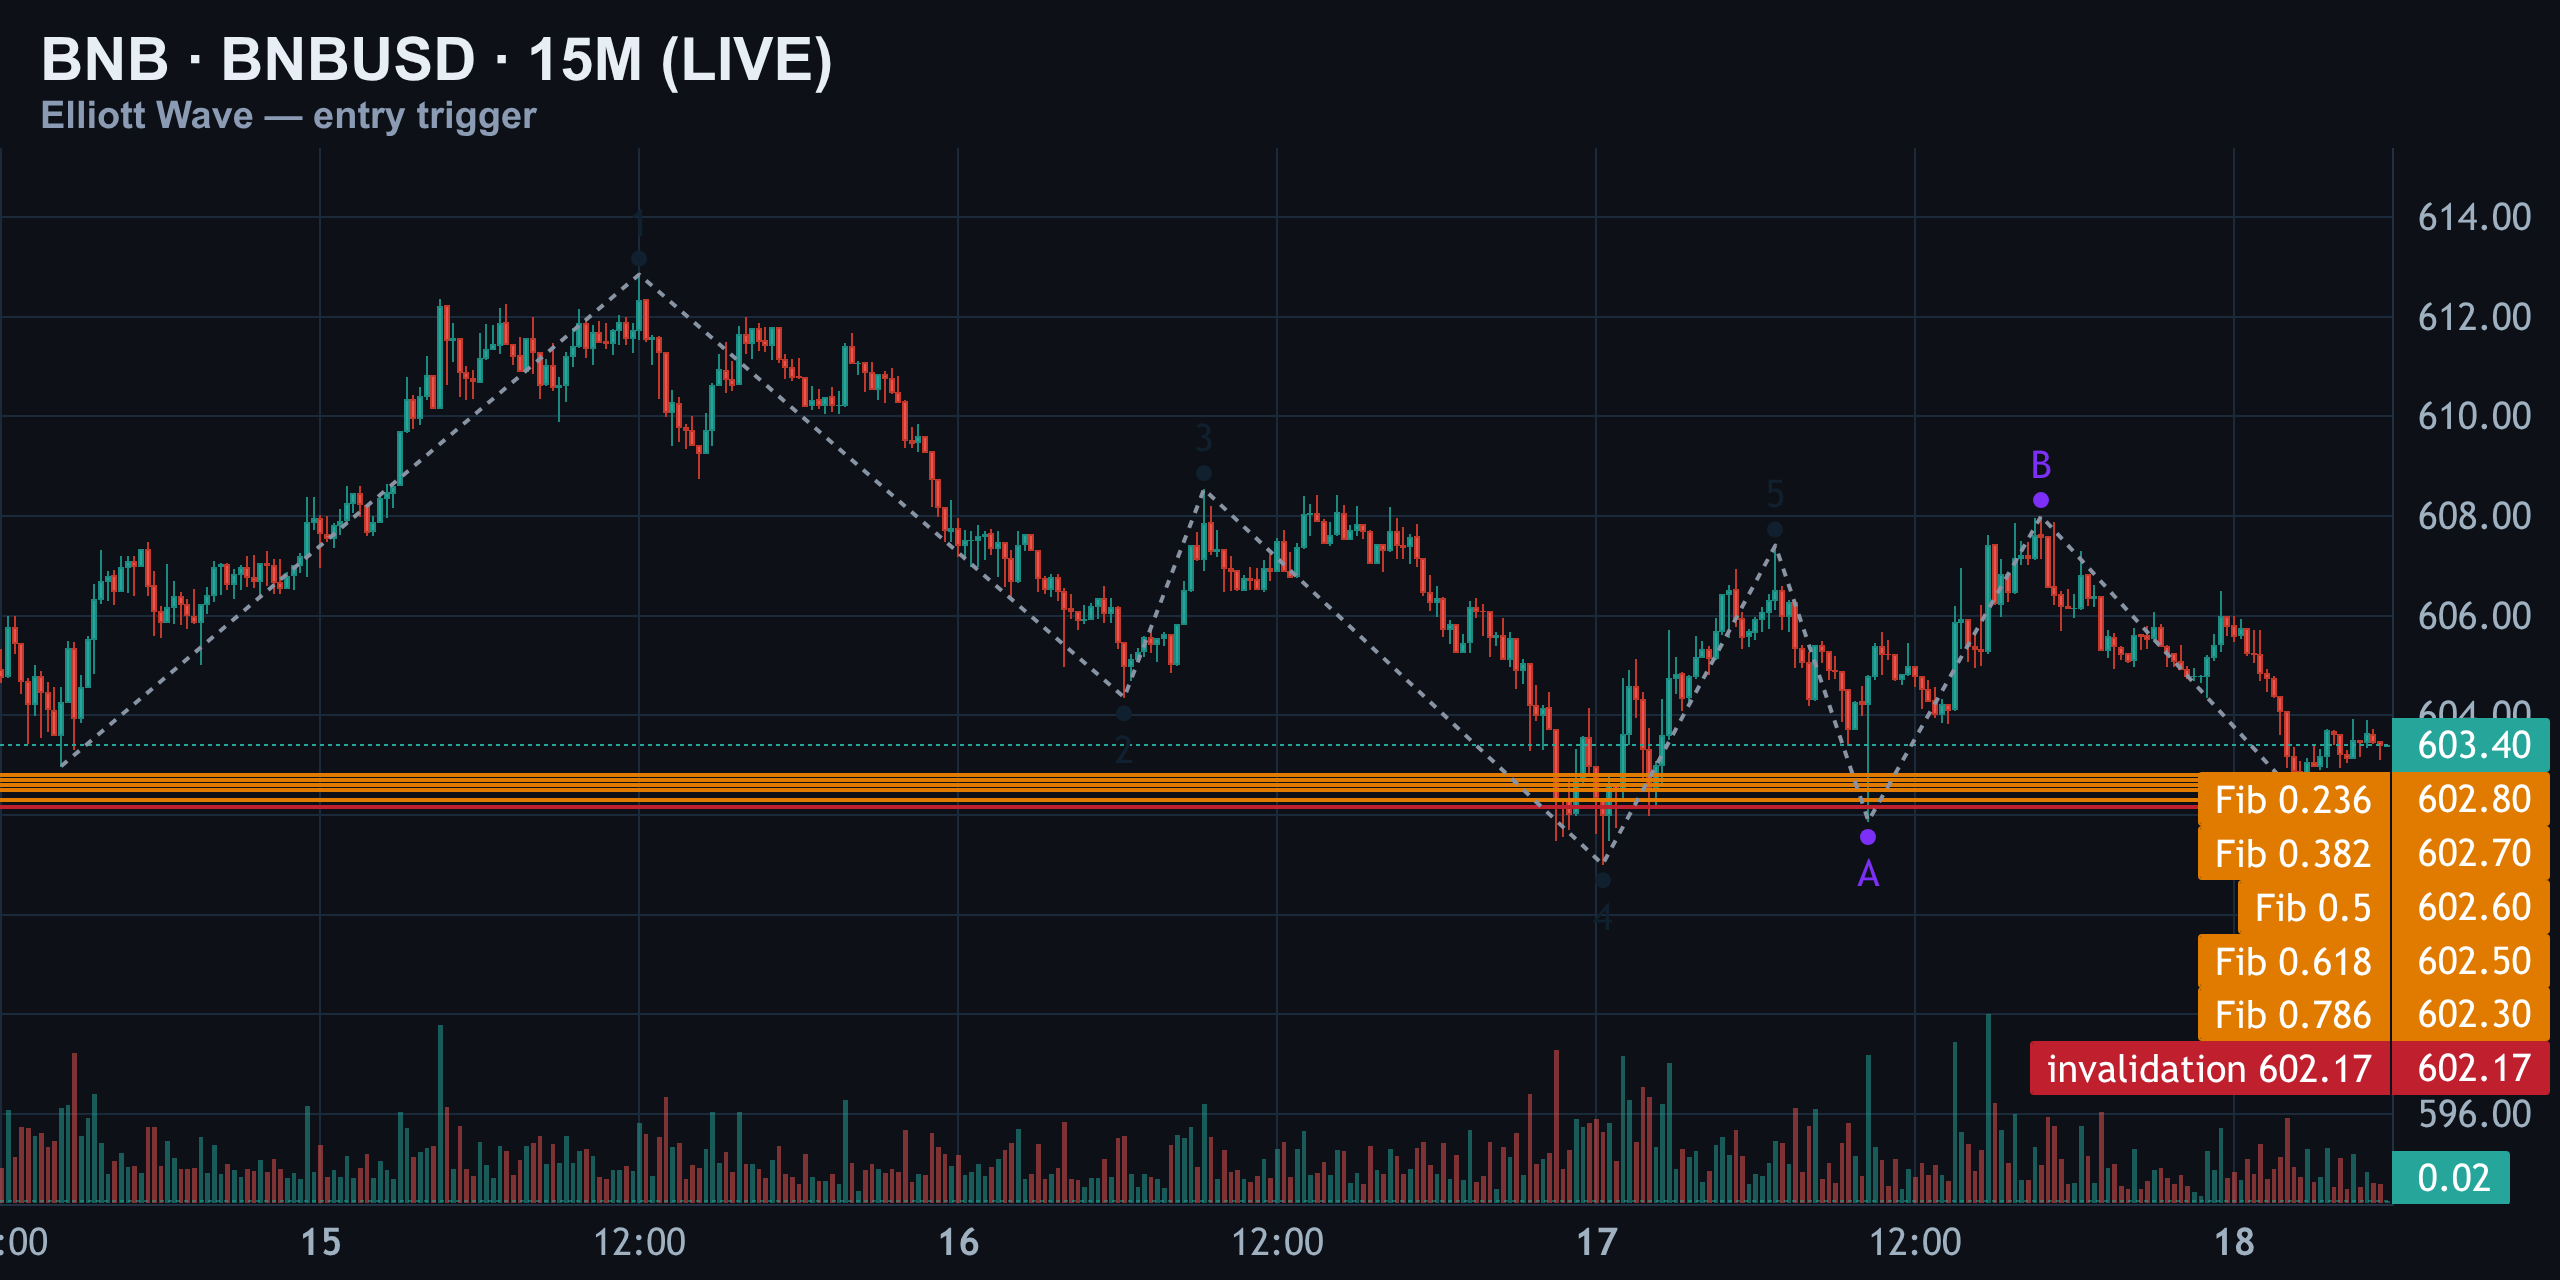
After that low, a small A-B-C bounce formed: wave A at $601.88, wave B at $608, and wave C printing at $602.17 — almost a perfect 1:1 measured move against wave A, a clean, symmetric correction. Price is currently sitting right on top of that $602.17 line, with the live candle around $603.40.
- A clean break and hold below $602.17 confirms the bearish continuation path and opens the fib targets from the 4H chart.
- A bounce that holds above $603, pushing through the recent micro highs, is the early tell that buyers are stepping in ahead of the bigger $606.80 confirmation level.
The Scenarios, Ranked
Putting the 4H, 1H, and 15M reads together, here's the highest-probability path down to the least likely, with confirmation triggers for each:
| Rank | Scenario | Confirmation | Targets / Invalidation |
|---|---|---|---|
| 1 — Most likely | Wave C extends lower (bearish continuation) | Close below $601.01, then below $602.17 (15M) | Targets: $598.30 → $591.50 → $584.60. Invalidated above $620.55 |
| 2 — Counter-case | Correction already finished at $601.01 | Hourly close above $606.80 (also the biggest ask wall) | Targets: retest $620.55 and beyond |
| 3 — Wildcard | Wave B was actually wave 1 of new uptrend | Sustained close above $620.55 with volume | Opens fresh highs above the current range |
Note how every single scenario references the same handful of numbers — $601, $602.17, $606.80, $620.55. That's not a coincidence; it's what happens when multiple timeframes are all resolving into the same decision point at once.
Positioning & Order Flow — The Edge
Wave counts tell you the *map*; positioning tells you who's likely to get squeezed on the way there. The biggest resting ask wall sits right at $607.44, essentially stacked on top of the 0.236 fib retracement at $606.80. That overlap is exactly why alternate-two bulls need volume, not just a wick, to clear it — absorbing that size on light volume would be a red flag for the breakout case, while clearing it decisively says buyers genuinely soaked up the supply.
Liquidation Clusters
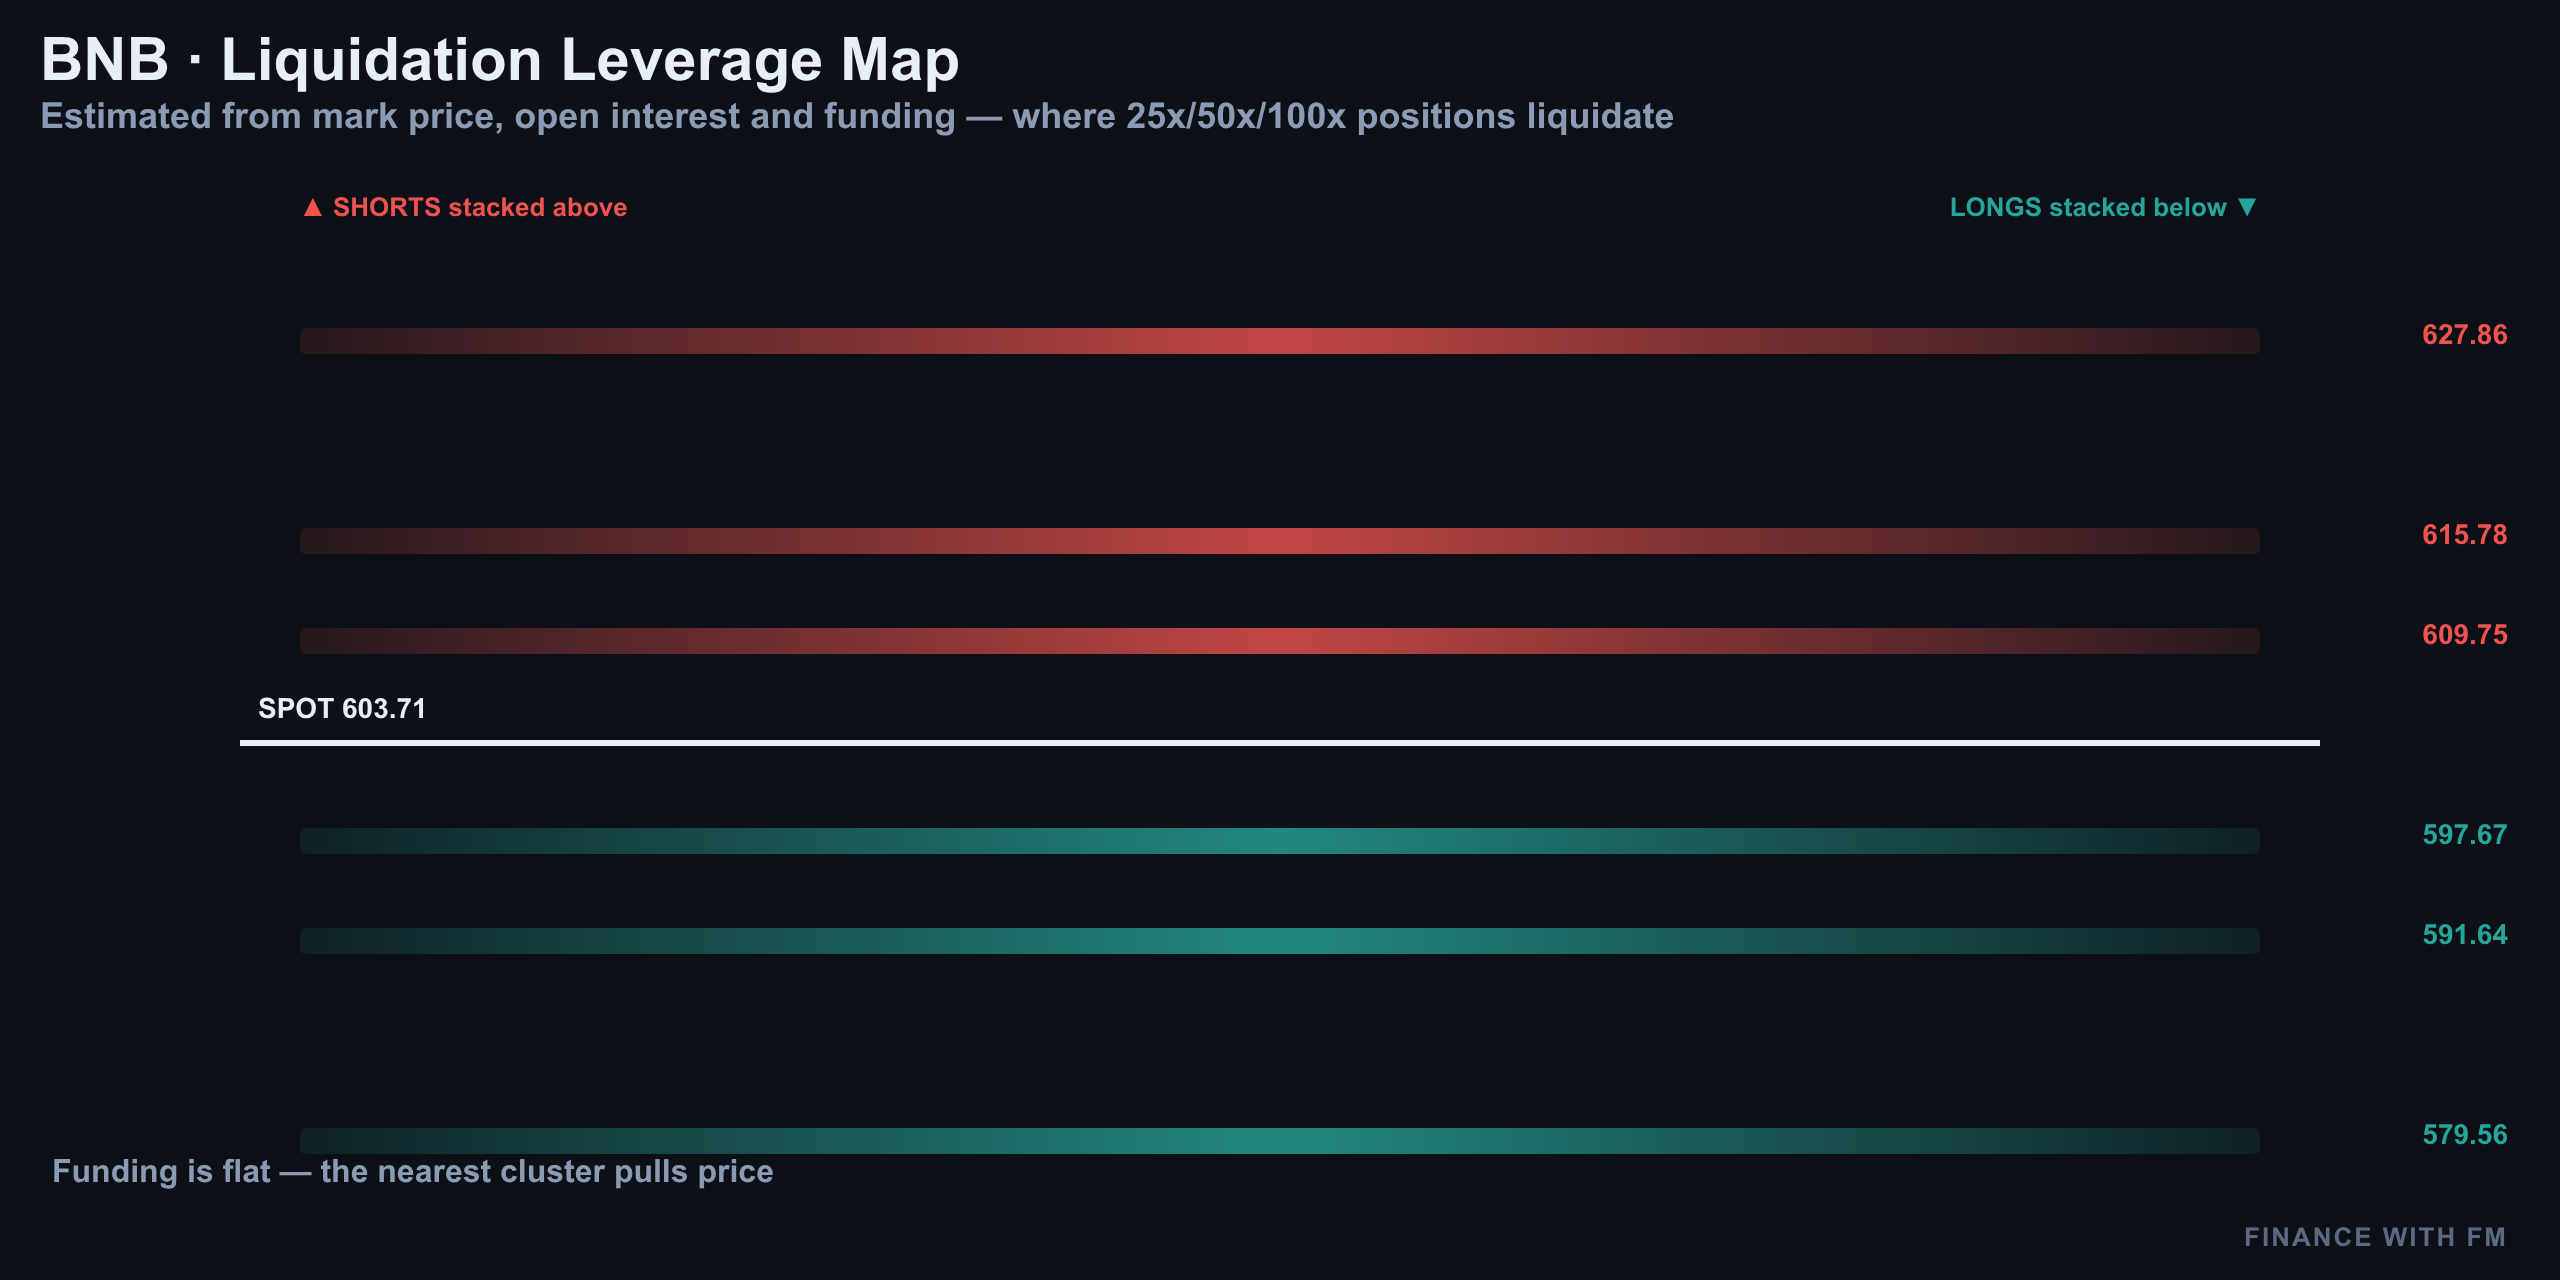
Liquidation heatmaps typically cluster leveraged longs just below round-number support and leveraged shorts just above recent swing highs. With BNB pinned between $601 and $607, both sides of the book have skin in the game at these exact levels — a break below $601 risks cascading long liquidations that could accelerate a move toward the $598.30 and $591.50 fib zones, while a break above $606.80–$607.44 risks squeezing shorts stacked under $620.55.
Structure vs. Positioning — Do They Agree?
Yes, largely. The wave count says $601–$607 is the pivot; order flow and the resting ask wall at $607.44 say the same thing independently. When structure and positioning point to the same price zone, that zone tends to produce the sharpest reaction — because it's not just a chart pattern, it's where real capital is sitting on both sides.
BNB's current spot price around $602–$604 puts it just inside the bearish side of that zone, which tilts the immediate edge toward the primary, more bearish count — but only marginally, and only until one of the trigger levels actually gives way ().
Levels to Watch
| Level | Price | What It Means |
|---|---|---|
| 15M invalidation | $602.17 | Break/hold below confirms bearish continuation |
| 1H primary invalidation | $601.01 | Line in the sand for the whole 1H count |
| 0.236 fib / ask wall | $606.80 – $607.44 | Bulls need a volume close above this to flip bias |
| 0.382 fib target | $598.30 | First downside target if C extends |
| 0.500 fib target | $591.50 | Second downside target |
| 0.618 fib target | $584.60 | Deepest target if selling accelerates |
| 4H hard invalidation | $620.55 | Close above this ends the bearish case entirely |
Setup Per the Count (Not Advice)
This is a structural walkthrough of what the wave count implies — not a trade recommendation. With that framing:
- Bearish continuation idea: confirmation on a close below $601.01 and then $602.17, with downside interest building near $598.30 and deeper near $591.50. Invalidated by a reclaim and close back above $620.55.
- Bullish reversal idea: confirmation on an hourly close above $606.80 that also clears the $607.44 ask wall on real volume, targeting a retest of $620.55 and potentially beyond.
- Either way, size and risk should reflect that this is a coin-flip zone right now — the count itself says conviction only builds once one of these levels actually breaks.
Where BNB Sits in Its Count — Summary
Strip away the noise and BNB's story right now is simple: what looked like a bullish five-wave impulse off the May low is, on closer inspection, a corrective structure that has broken two of Elliott Wave's non-negotiable rules — no wave two beyond 100% retracement, no wave four overlapping wave one. That reframing turns the June–August rally into a probable wave B, with the current stall at $601–$603 acting as the opening stage of wave C.
Every timeframe — 4H, 1H, and 15M — funnels into the same tight decision zone between $601 and $607, and order flow data (the $607.44 ask wall, liquidation clusters on both sides) independently agrees that this is the pressure point. BNB currently trades around $602–$604 across major venues (,,,), sitting just inside the bearish half of that zone.
Watch $601.01 and $602.17 on the downside, $606.80–$607.44 on the upside, and treat $620.55 as the level that changes the entire narrative from corrective to genuinely bullish. Until one of those breaks with conviction, this is a range to respect, not a breakout to chase.
More on BNB: elliott wave
Analysis and education, not investment advice. See our editorial policy.