Daily market analysis
Onyx (XCN) technical analysis today
Last updated
XCN Daily Pulse — September 01, 2026
XCN Daily Pulse: The Market Is Improving, But Not Reversing
Welcome to Finance With FM. This is the XCN Daily Pulse for September 01, 2026, covering the latest supplied market reference, chart structure, momentum indicators, liquidity zones and the trading plan for today into tomorrow.
XCN is trading near $0.0033824, down approximately 1.6% from yesterday’s supplied reference of $0.0034372. That decline is important for continuity, but it has not changed the central conclusion from the previous update. The prior call was to stand aside because there was no clean risk-to-reward setup. No target was hit and no stop was triggered. Price simply drifted lower inside the same broader range.
The current market presents a technical contradiction. Downside momentum is fading, as shown by the bullish divergence on the daily RSI, but the larger structure remains heavy. XCN is still trading between major moving averages, the four-hour chart remains inside a descending channel, and MACD continues to show bearish momentum.
In practical terms, sellers are losing some strength, but buyers have not yet demonstrated control. That distinction matters. A bullish divergence can warn that a sell-off is becoming exhausted, but it cannot by itself confirm a new uptrend.
15-Minute XCN Chart: Failed Push and Range Compression
The 15-minute chart shows the most immediate battle. XCN pushed toward the upper side of the session range and then reversed sharply near $0.003468. That rejection created another lower intraday high, keeping short-term sellers in control even though buyers defended the lower edge of the range.
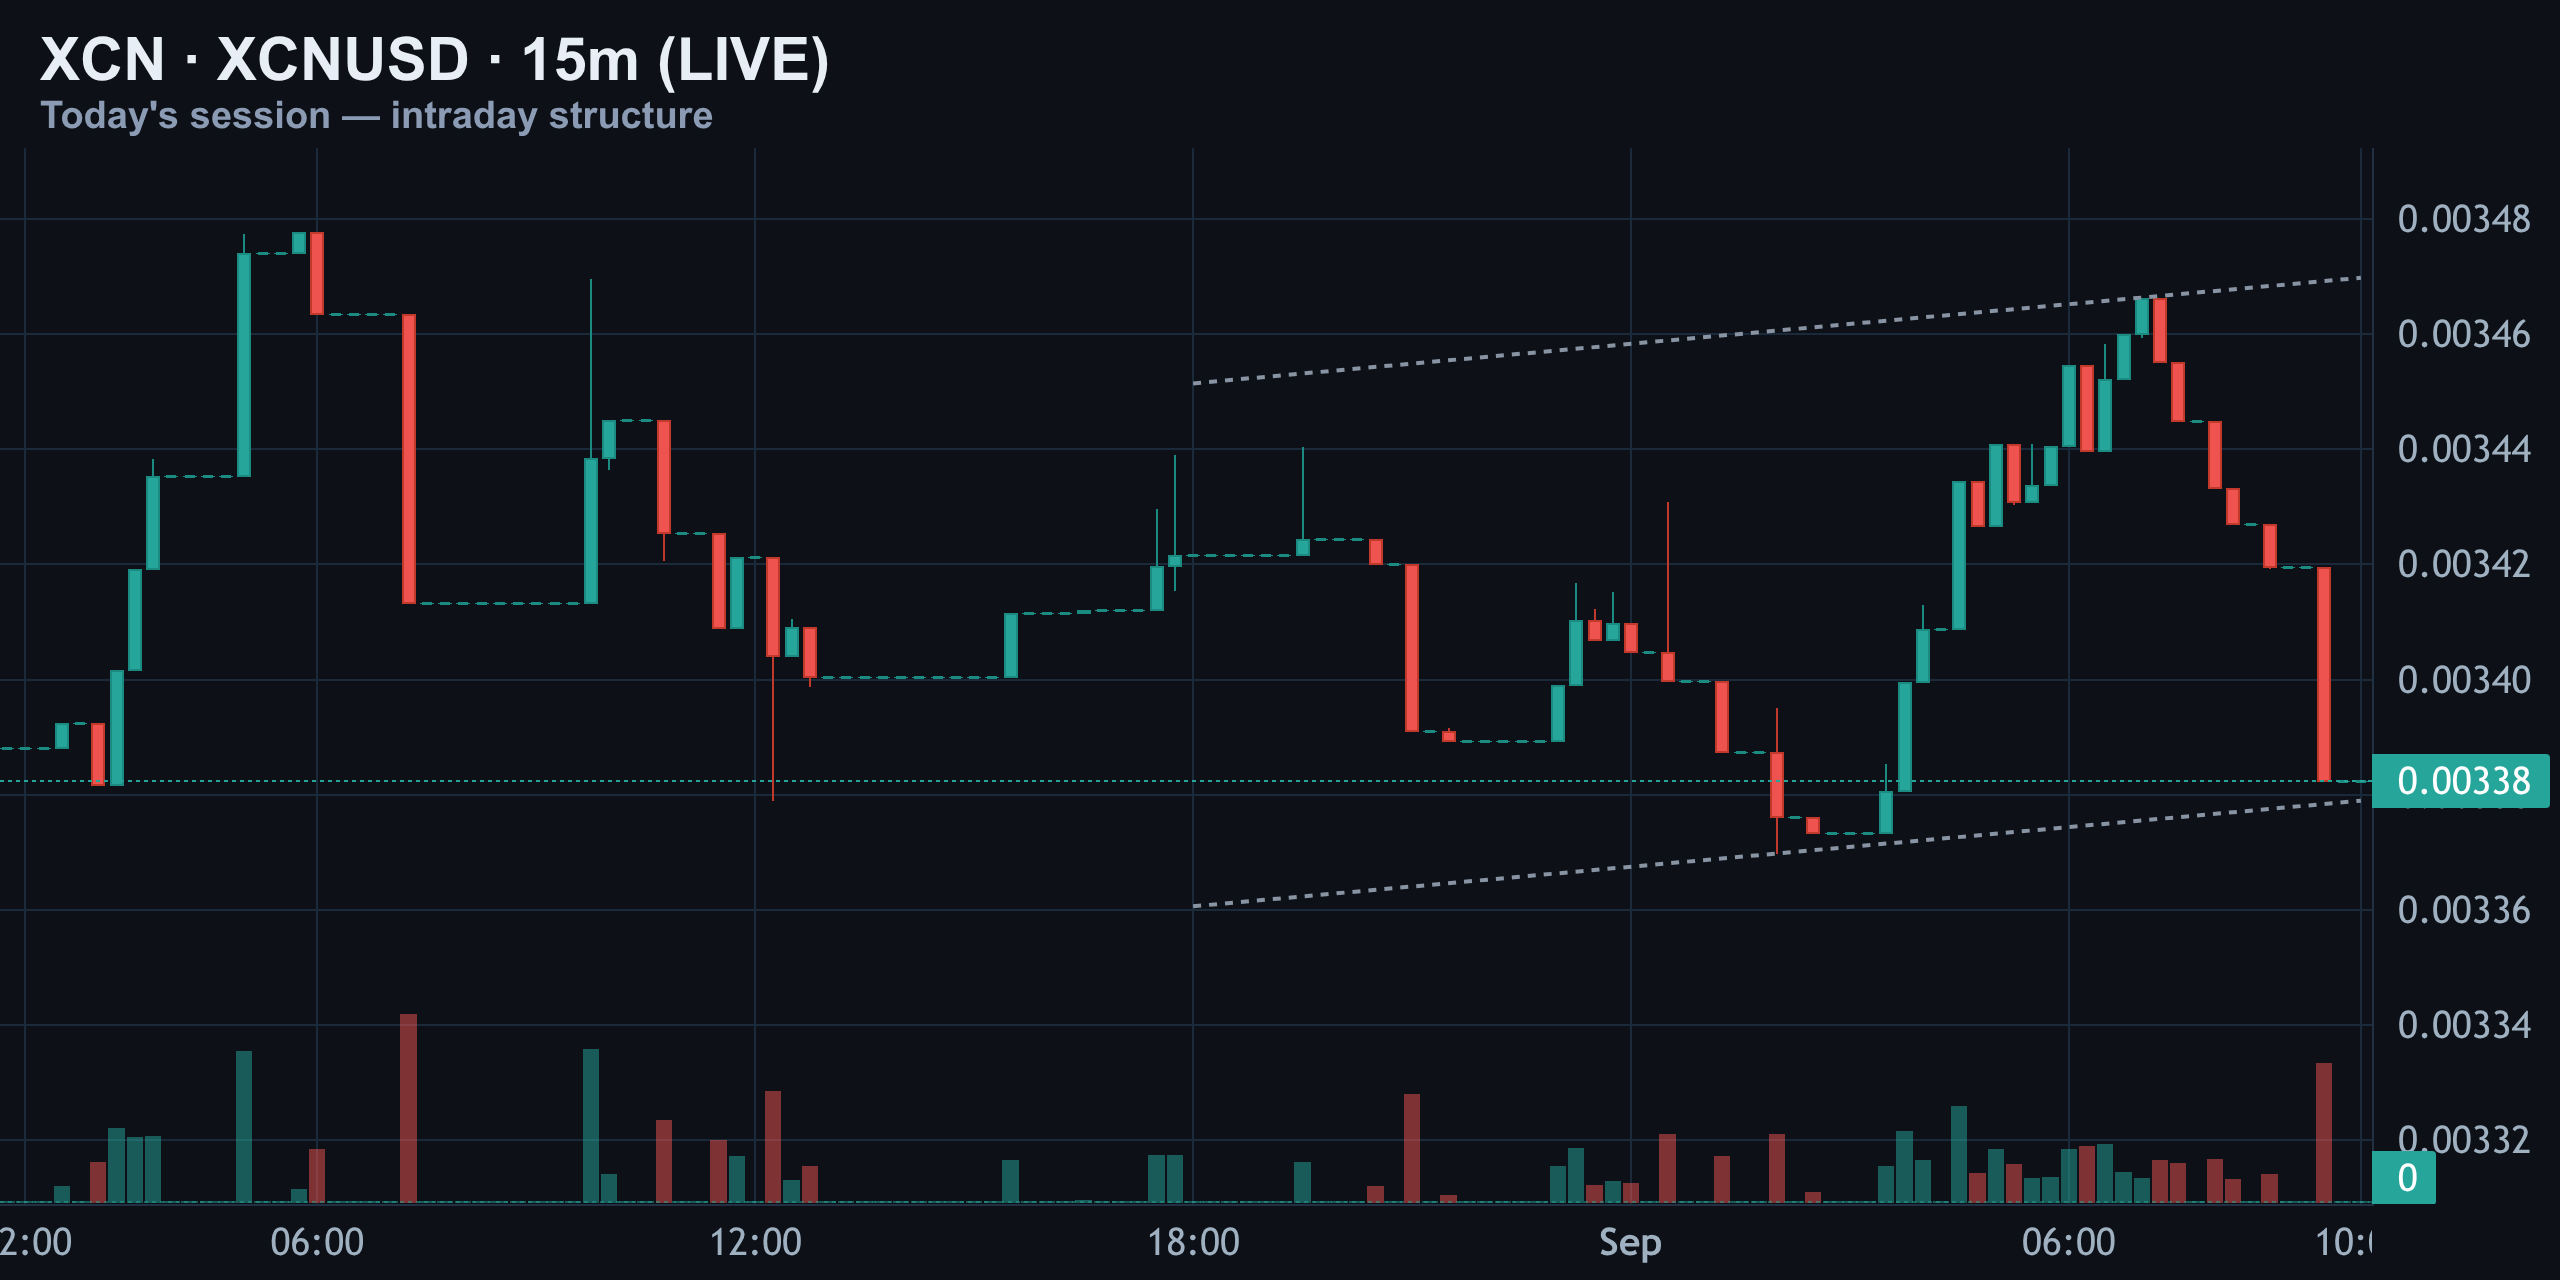
The chart is showing compression rather than confirmation. Price is narrowing into a range, and that often means a larger move may eventually follow. However, compression does not reveal direction on its own. It can resolve upward through a resistance reclaim, or downward after support gives way.
The first short-term confirmation level is $0.003517. A move above that level would reclaim a meaningful area of overhead structure and improve the possibility of a push toward the $0.003599 liquidity zone. Even then, a single wick would not be enough. Traders would want to see a close above the level, follow-through and preferably a successful retest.
If price continues to reject below $0.003517, the current lower-high sequence remains valid. That would leave XCN vulnerable to another test of nearby downside liquidity. The key message from the 15-minute chart is therefore simple: buyers defended the range, but they have not broken the range.
| Intraday reference | Price | What it means |
|---|---|---|
| Current supplied reference | $0.0033824 | Spot area inside the range |
| Recent rejection | $0.003468 | Short-term resistance and lower-high area |
| Key reclaim | $0.003517 | Level required to improve the bullish bias |
| Overhead liquidity | $0.003599 | Next important upside reaction zone |
Four-Hour Structure: XCN Remains Inside a Descending Channel
The four-hour structure provides the higher-timeframe context that prevents an overly bullish reading of the intraday compression. XCN remains contained inside a broad descending channel. The late-August rebound produced stabilization, but it has not yet developed into an impulsive breakout.
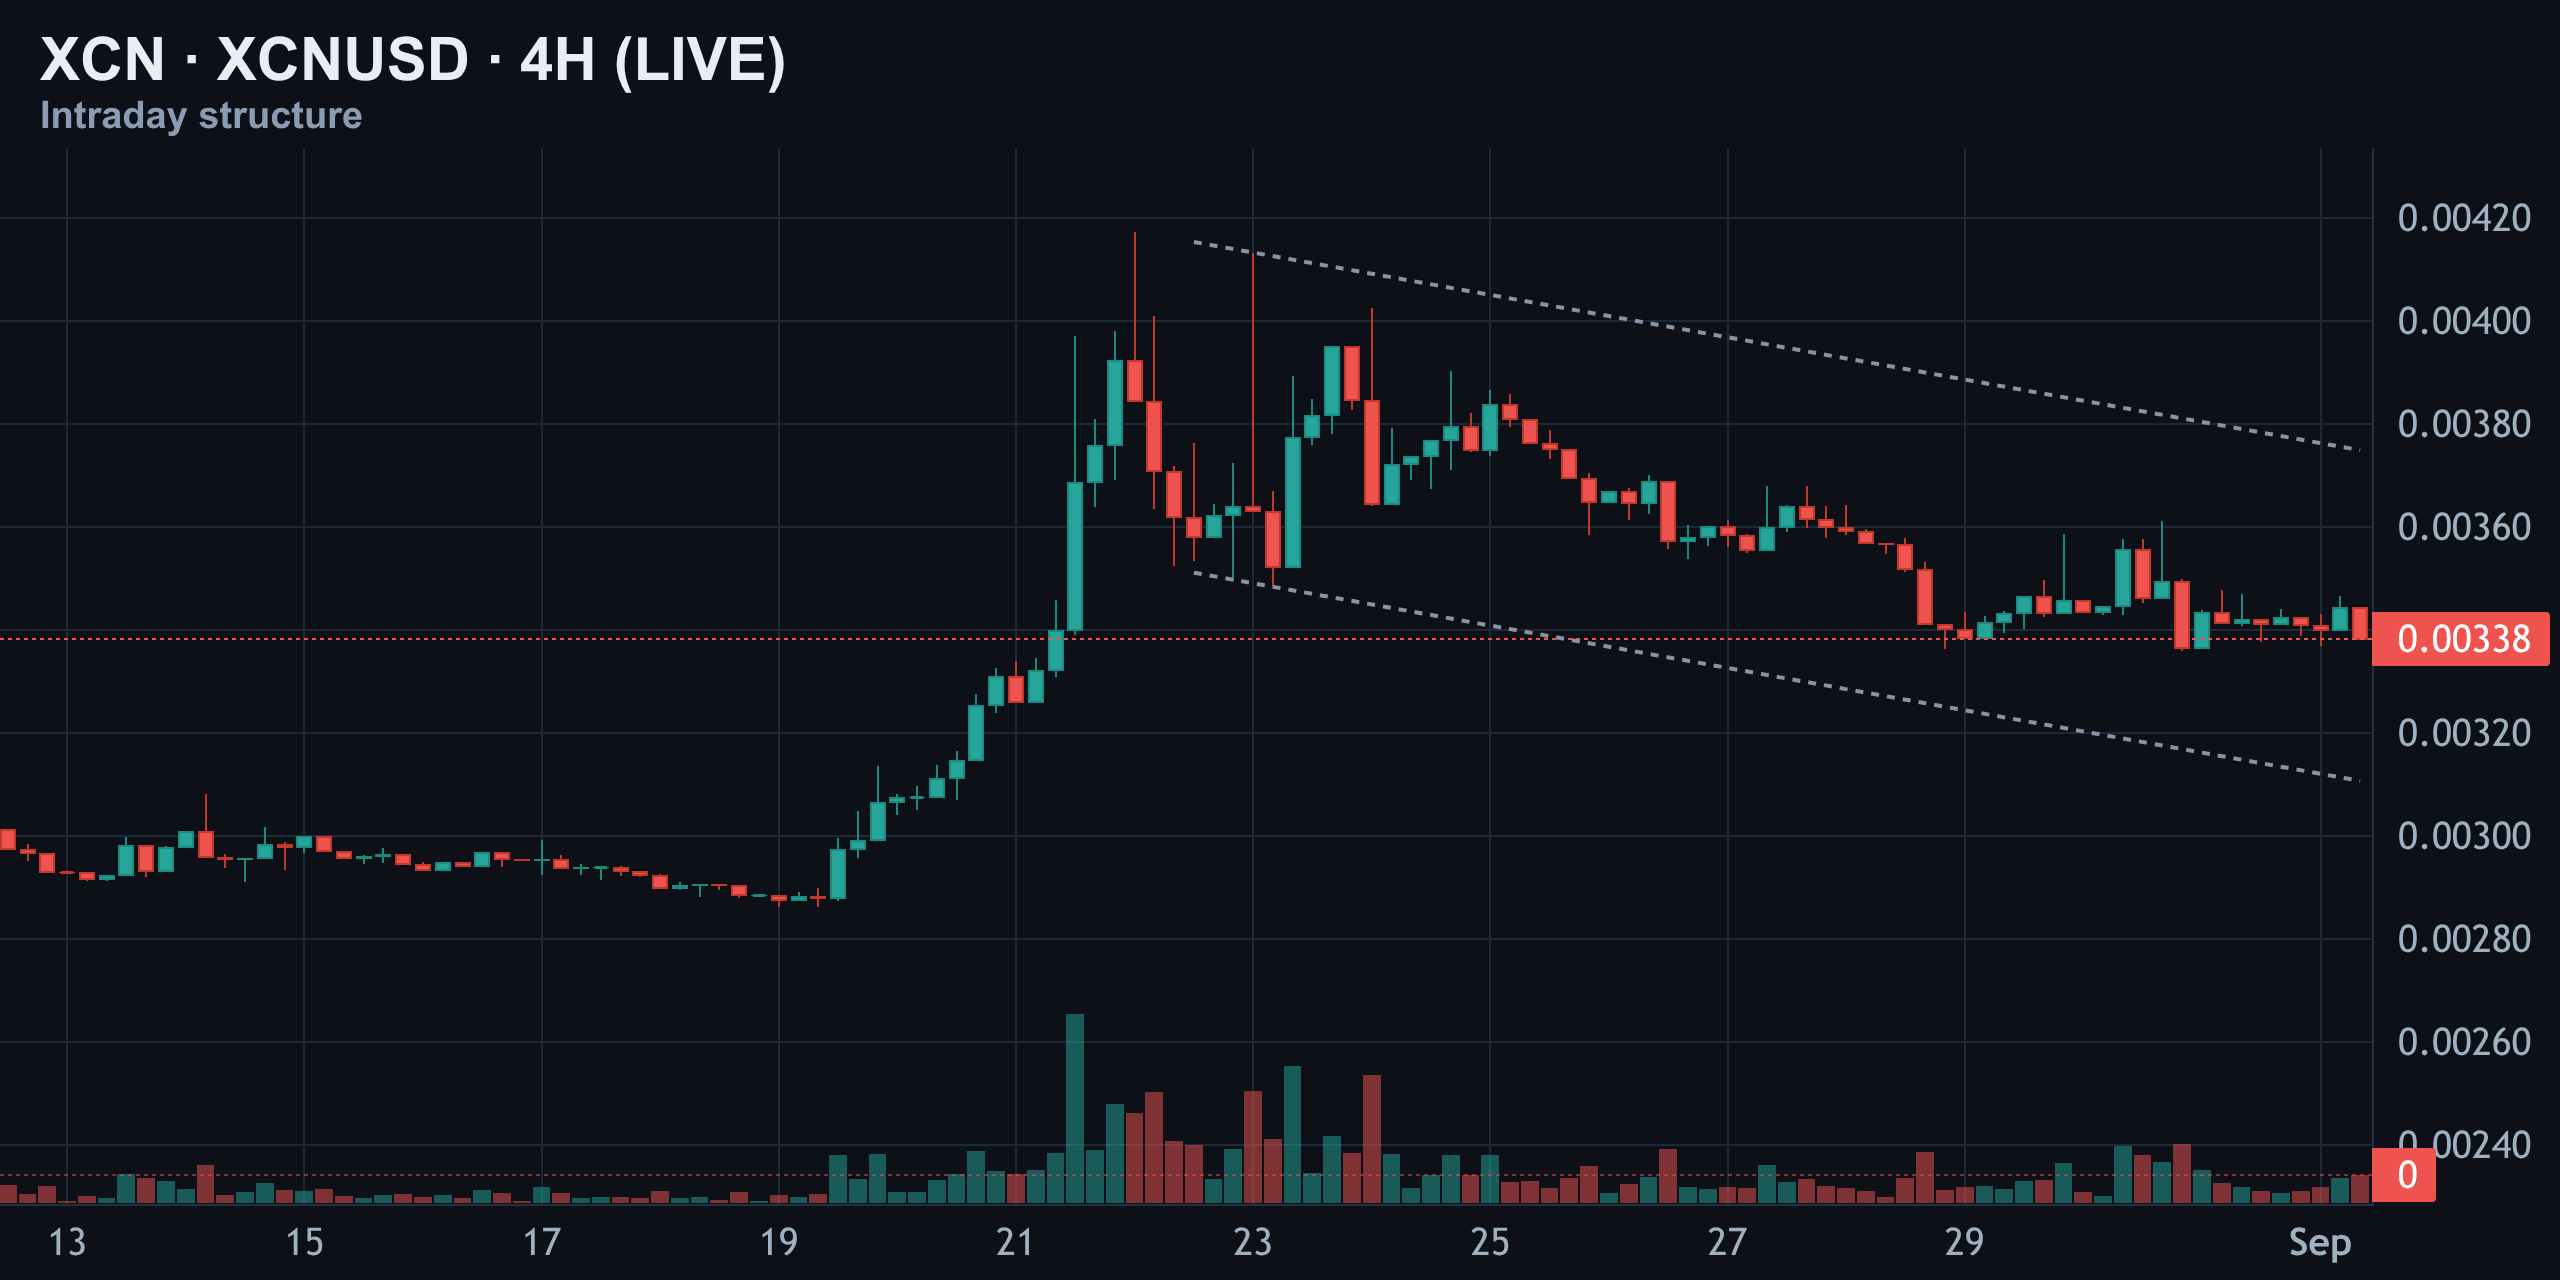
This distinction is important for anyone searching for an XCN price analysis based on more than the latest candle. A bounce from support can occur inside a downtrend. Until the channel’s overhead pressure is removed, rallies remain tests of supply rather than proof that the market has entered a sustained uptrend.
The first structural hurdle remains $0.003517. Above that, the $0.003599 area becomes the next significant test. The supplied feed identifies $0.003599 as the heaviest realised liquidation zone above spot. A move into that area could produce a reaction because it represents a level where leveraged positions have recently been cleared.
That does not mean $0.003599 is a guaranteed target. Realised liquidation data describes where leverage was flushed, not where price must travel next. It is best used as a map of historically active reaction areas. If XCN reaches it, traders should watch whether price accepts above the zone or rejects from it.
- A close and hold above $0.003517 would be the first meaningful improvement.
- A sustained move through $0.003599 would challenge the descending-channel interpretation.
- A rejection below the reclaim level would keep the four-hour trend corrective.
- A breakdown through nearby support would shift attention toward the deeper $0.002863 low.
Short-Term Daily Chart: Support Held, Trend Still Heavy
The short-term daily chart shows that demand did appear near the $0.002863 low. That reaction is meaningful because it proves buyers are willing to defend lower prices. However, the recovery has stalled below the descending trend channel, and the market has not reclaimed the resistance needed to change the broader short-term bias.
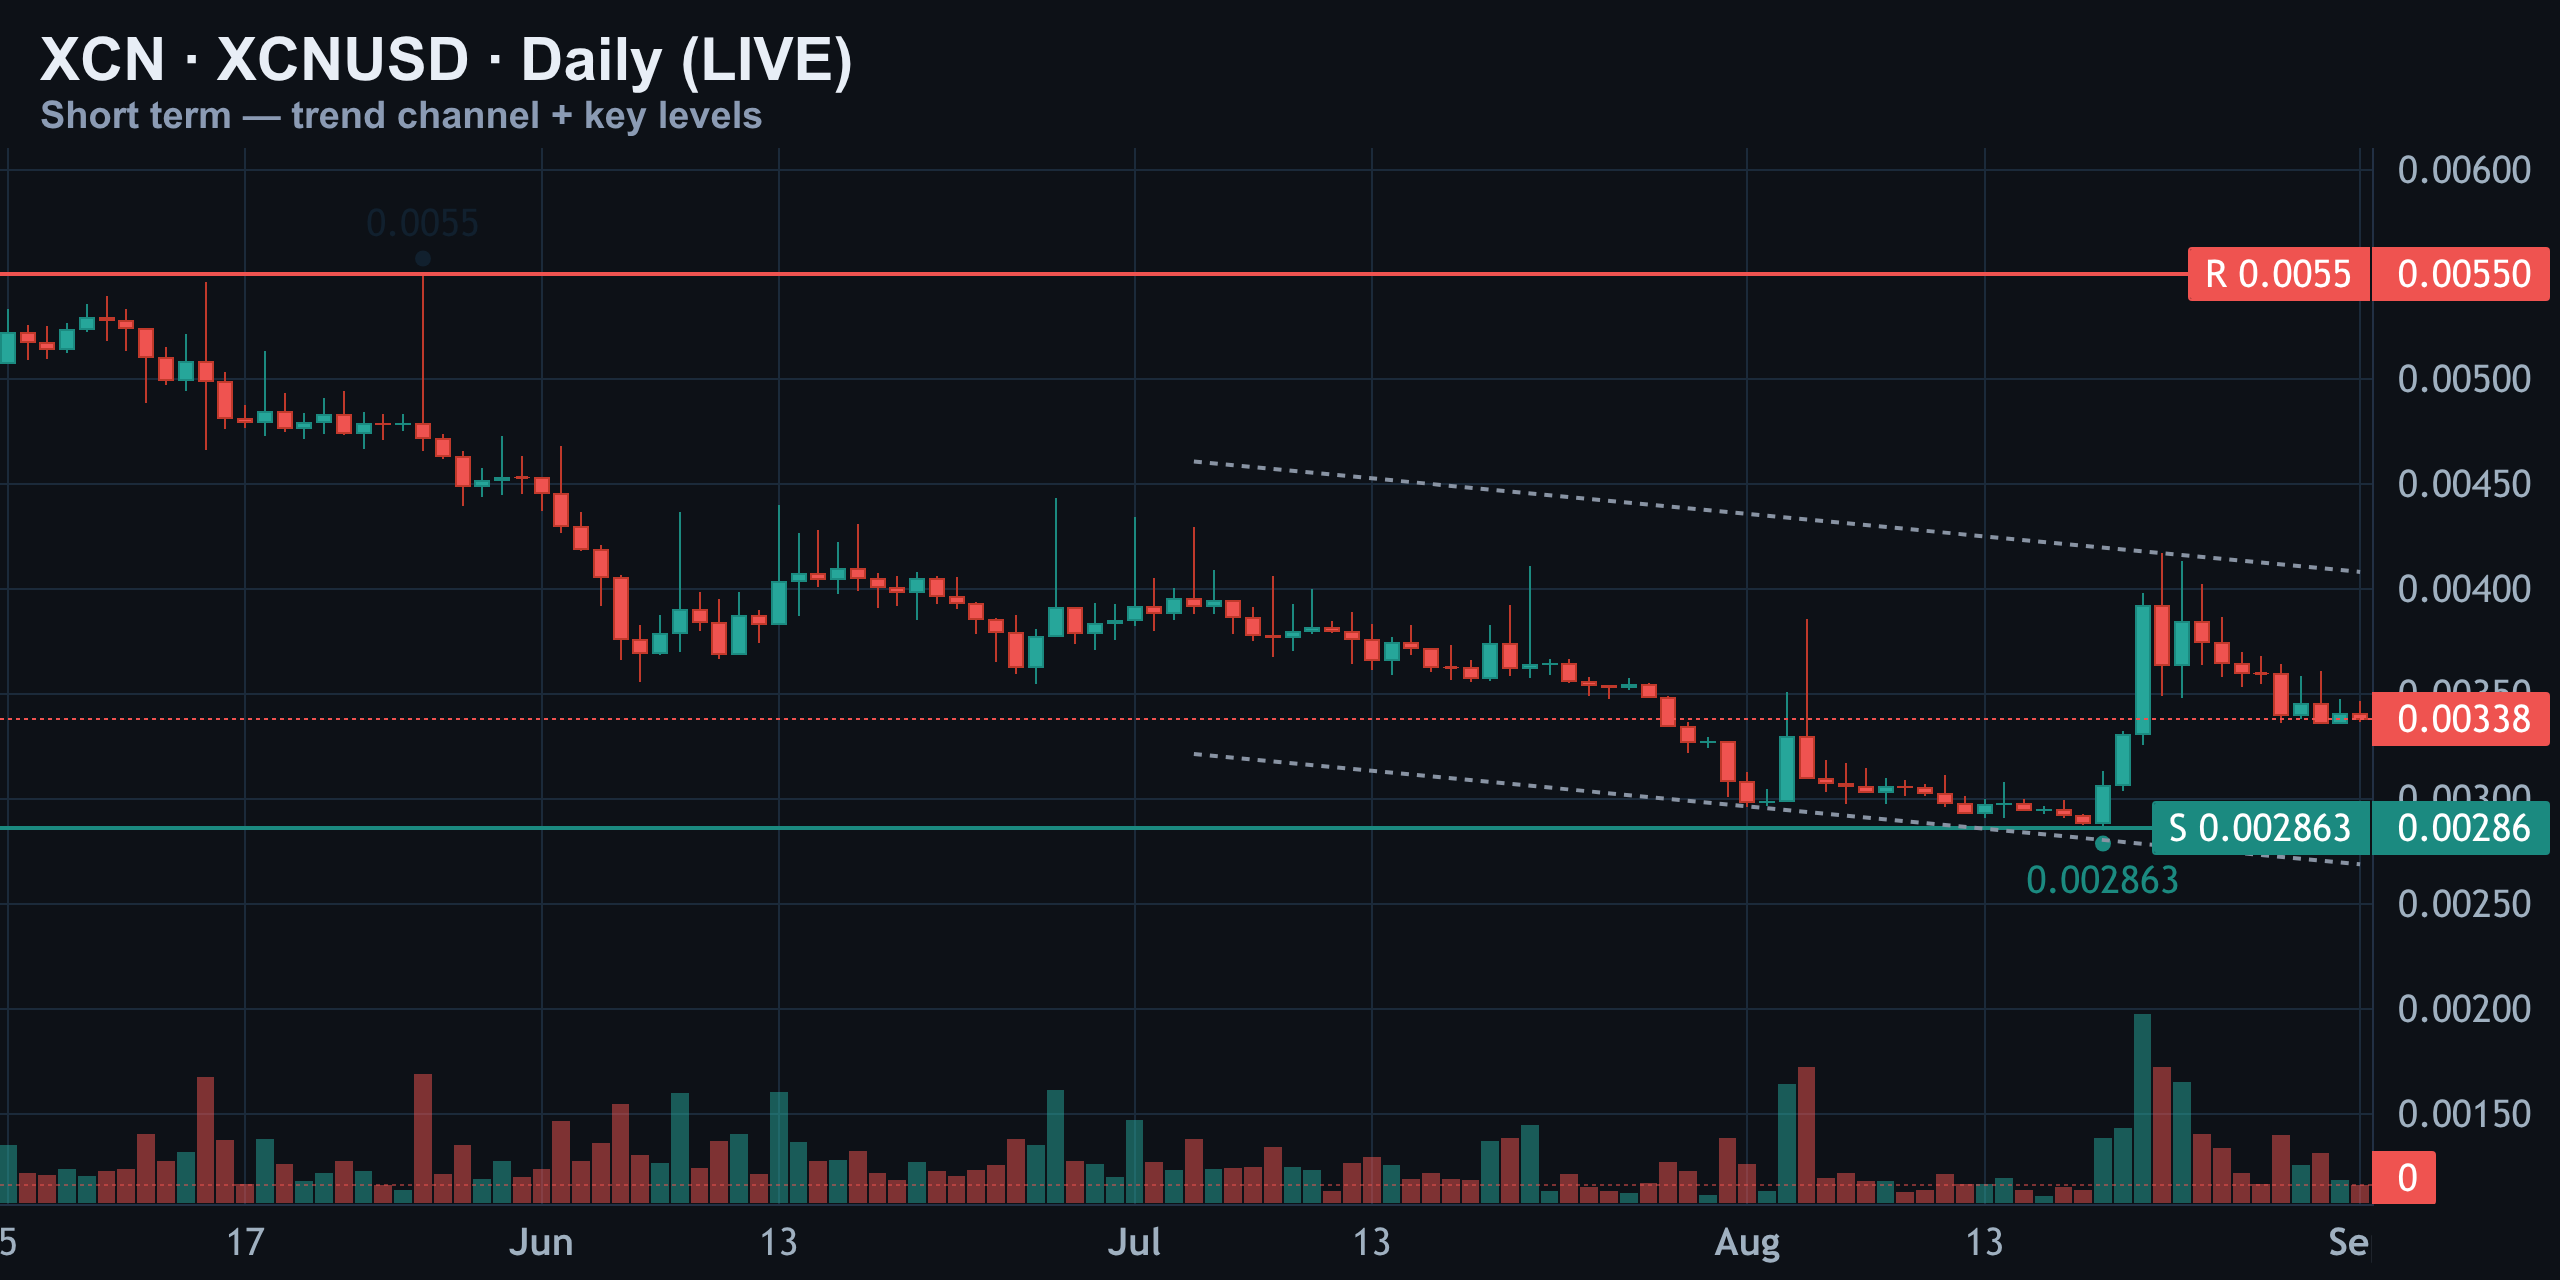
The daily structure therefore remains range-bound with a bearish lean. Buyers have a base to work from, but they need to convert that base into a higher high. Without a sustained move above $0.003517, the recent bounce remains a reaction from support rather than a confirmed reversal.
The practical outlook for today into tomorrow is balanced. Holding above nearby support keeps the possibility of another recovery attempt alive. A decisive loss of support, on the other hand, would weaken the bullish-divergence argument and expose the lower liquidity clusters.
| Daily structure | Price | Interpretation |
|---|---|---|
| Major reaction low | $0.002863 | Demand defended this area |
| Current reference | $0.0033824 | Mid-range price location |
| Structural reclaim | $0.003517 | Required to improve the trend |
| Major overhead zone | $0.003599 | Supply and realised liquidation area |
Momentum Conflict: RSI Divergence Versus Bearish MACD
Momentum indicators are delivering the most important contradiction in today’s XCN setup. Daily RSI is around 50, which is neutral, but it has developed a bullish divergence. Price moved from a prior low near $0.002912 to a lower low near $0.002863, while RSI improved from approximately 34 to 45.
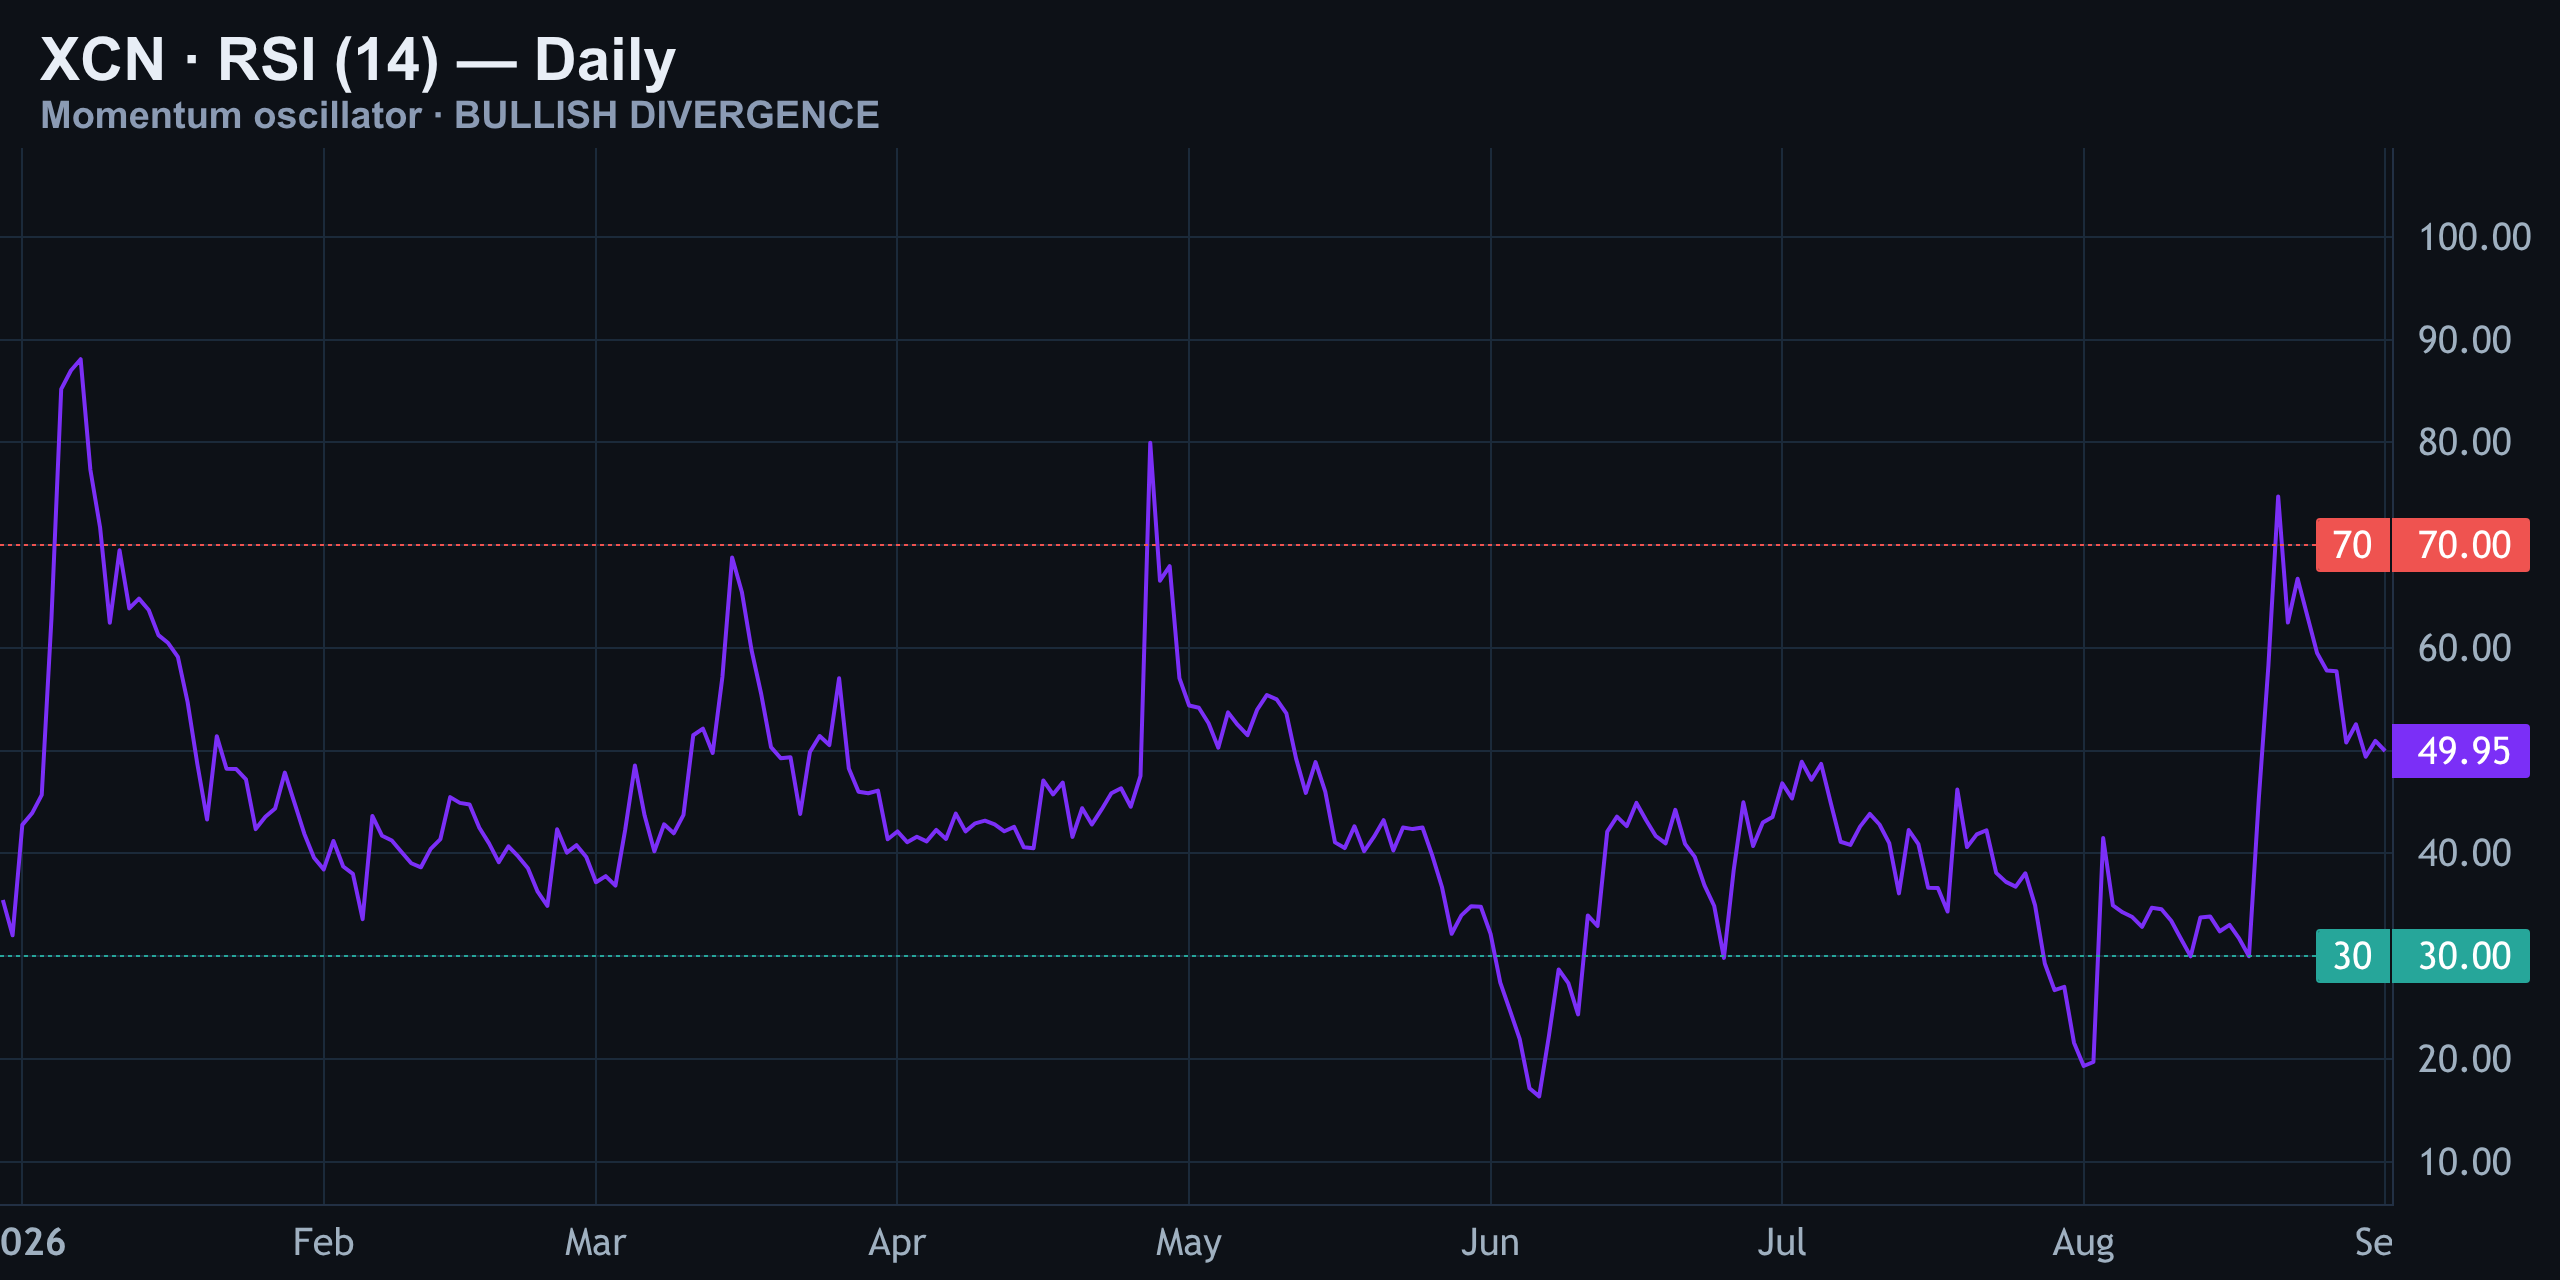
That divergence suggests that selling pressure is losing intensity. Sellers pushed price to a marginally lower low, but RSI did not confirm the same degree of weakness. This can precede a relief rally or a base-building phase.
However, divergence is an alert, not an entry signal. RSI has now returned to neutral, while price remains below the $0.003517 reclaim level. Without a structural break, the divergence should be treated as evidence that downside momentum is fading—not evidence that buyers already control the market.
MACD is less encouraging. The MACD line remains below its signal line, and the histogram is still negative. That confirms that the dominant momentum condition is bearish, even if the rate of decline may be slowing.
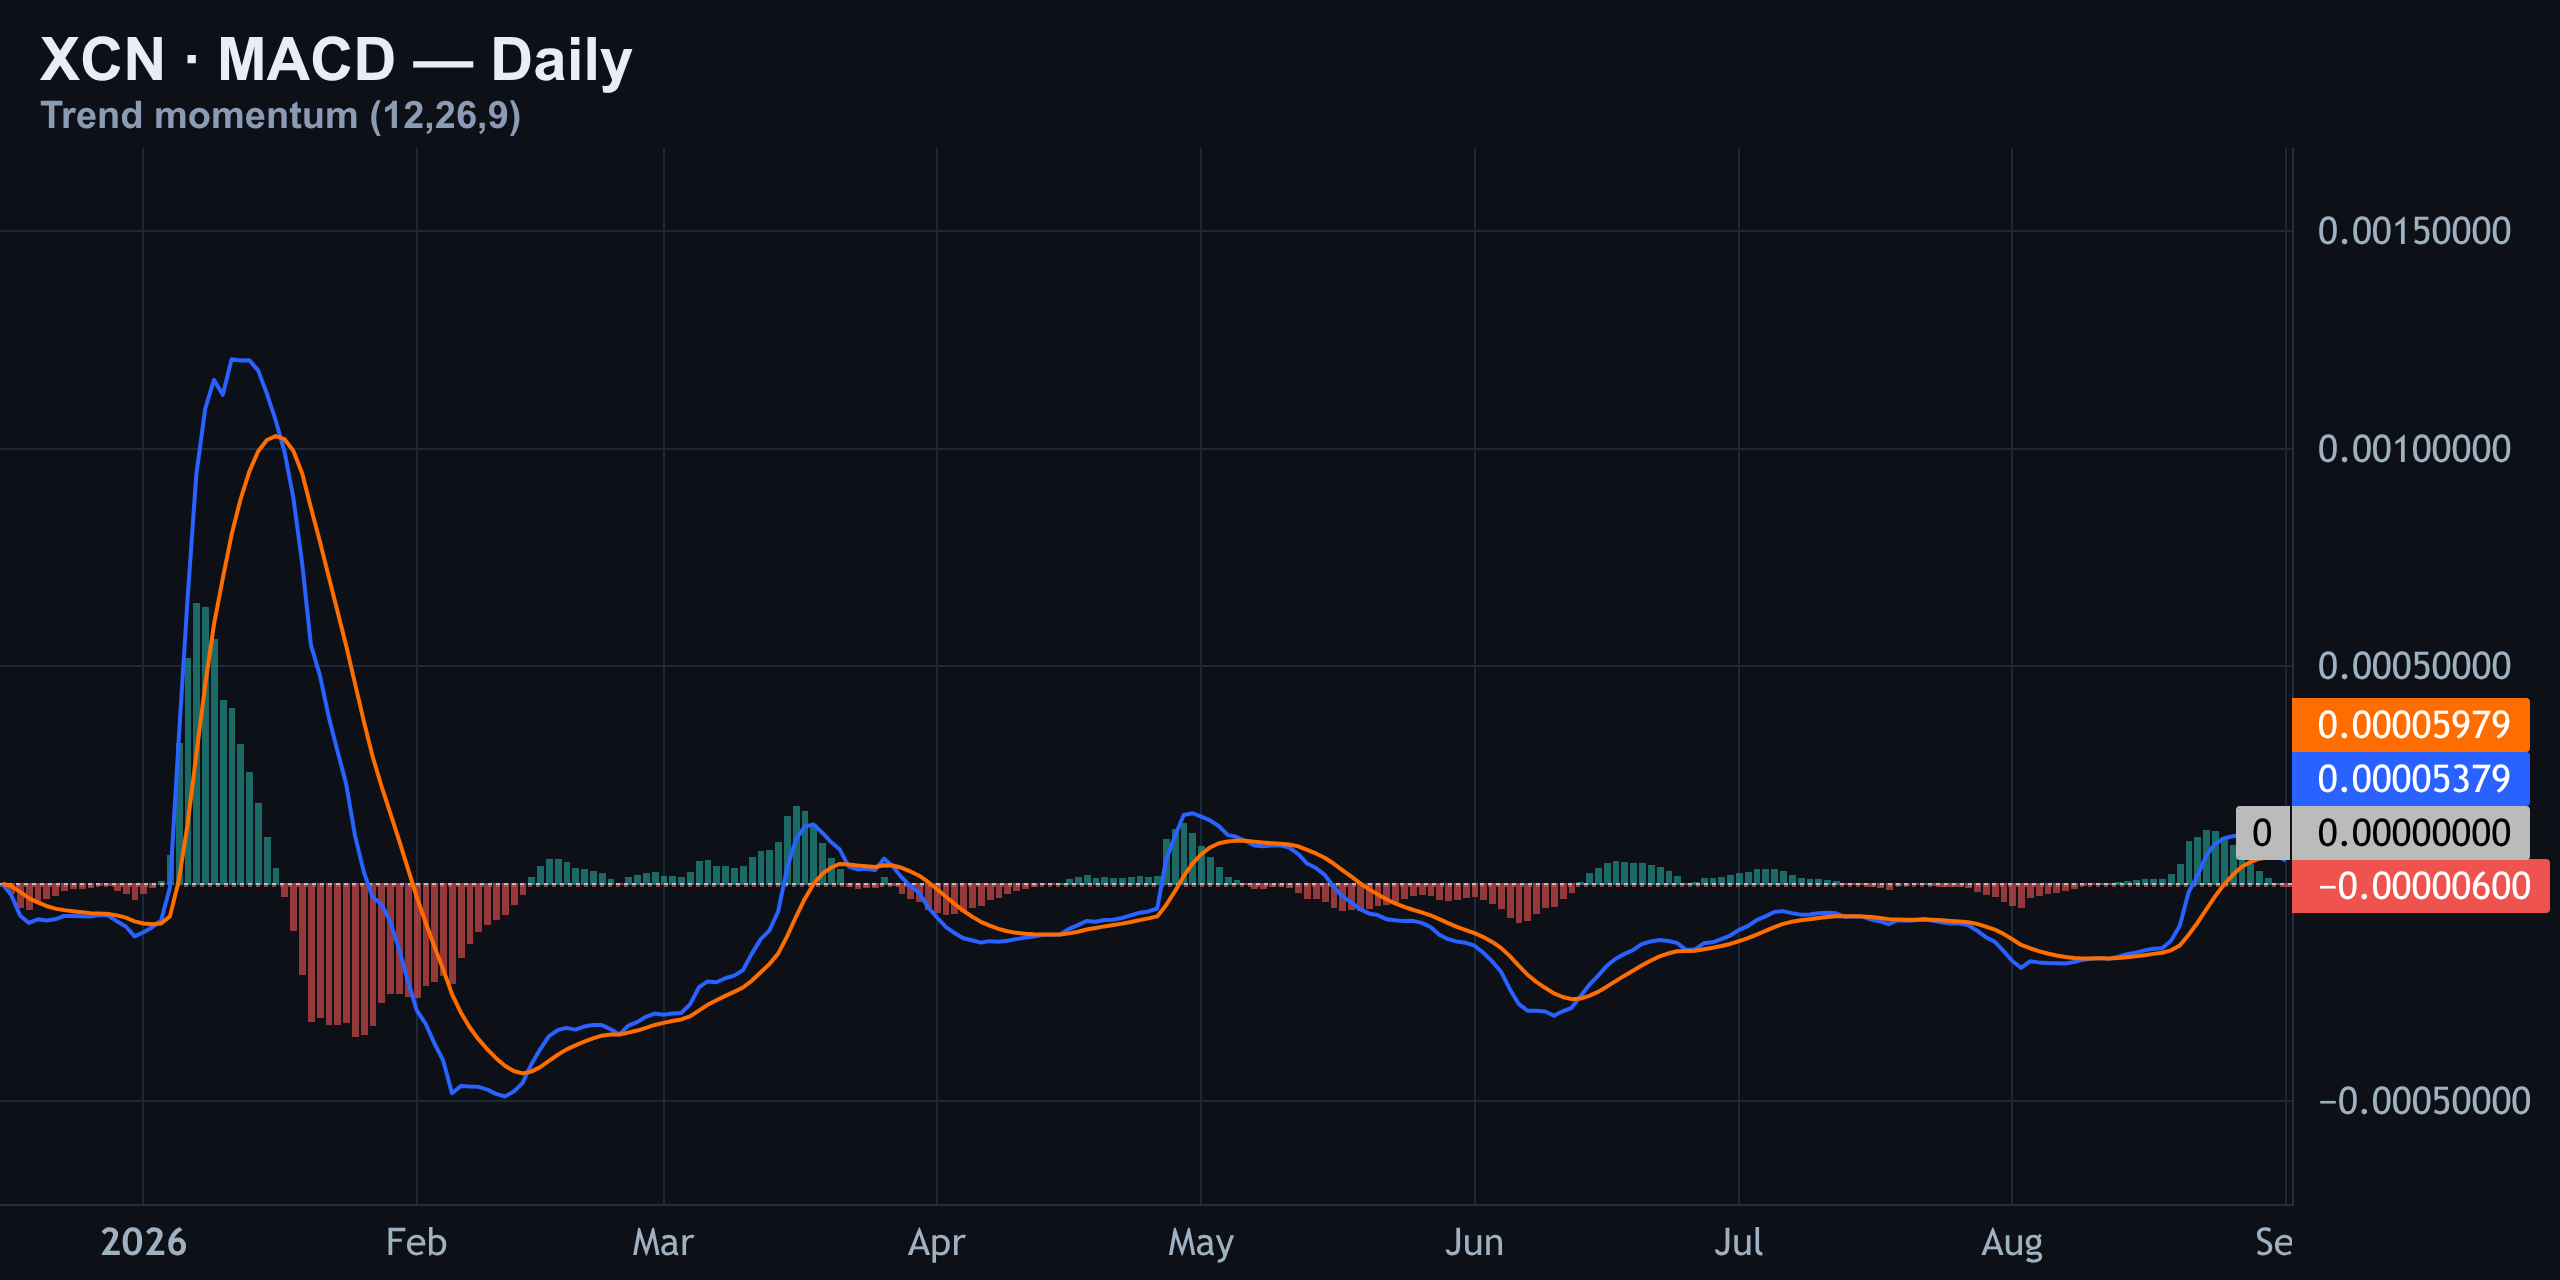
The best interpretation is a two-stage confirmation process. First, price needs to reclaim and hold above $0.003517. Second, MACD needs to improve through a bullish crossover and ideally move toward the zero line. Until both conditions begin to align, an upside move should be viewed as a resistance test.
| Indicator | Current signal | Trading implication |
|---|---|---|
| RSI (14) | Around 50, bullish divergence | Downside pressure is easing |
| MACD line | Below signal line | Bearish momentum remains active |
| MACD histogram | Negative | No full momentum confirmation yet |
| Price structure | Below $0.003517 | Reversal remains unconfirmed |
XCN Levels, Liquidity Zones and Today’s Trade Plan
The supplied derivatives feed shows liquidation activity on both sides of the current XCN price. That creates the possibility of a squeeze, but it also increases the risk of a false breakout. The key positioning figures, including a complete open-interest and funding breakdown, were not included in the supplied feed, so the liquidation zones should be treated as reaction areas rather than predictive targets.
| Zone | Price | Role in the setup |
|---|---|---|
| Upside liquidation zone | $0.003599 | Heaviest realised zone above spot |
| Higher upside zone | $0.003955 | Additional overhead liquidity |
| Nearby downside cluster | $0.003021 | Potential downside reaction area |
| Secondary downside area | $0.003077 | Nearby support and liquidity reference |
| Lower downside zone | $0.002977 | Potential flush and reaction area |
| Deeper downside cluster | $0.002888 | Lower liquidity zone near the daily low |
| Established daily low | $0.002863 | Important support and invalidation reference |
The densest single area above spot is $0.003599. If XCN first reclaims $0.003517, that zone becomes the logical place to assess whether buyers have genuine follow-through. A quick wick into it followed by rejection would preserve the range-bound thesis. Acceptance above it would be more constructive and could signal that the descending-channel structure is being challenged.
On the downside, the $0.003021 to $0.003077 area is the first region to monitor if the current range breaks lower. Below that, $0.002977 and $0.002888 become increasingly relevant, with $0.002863 standing out as the deeper daily support reference.
Why the professional position is still to wait
There is no clean 1:2.5 risk-to-reward trade available from the current location. Buying directly into resistance leaves limited upside before the $0.003517 and $0.003599 barriers. Shorting immediately into support creates the opposite problem: downside may be available, but the bullish RSI divergence and nearby liquidity could produce a sharp rebound.
- A bullish setup would require a confirmed reclaim of $0.003517, followed by evidence that the level holds as support.
- A more aggressive bullish confirmation would come from continuation through $0.003599 with improving MACD momentum.
- A bearish setup would require a decisive loss of nearby support, followed by failed retests from below.
- If neither side confirms, remaining flat is preferable to forcing a trade inside compression.
The main drivers to watch are a breakout or rejection at $0.003517, movement into the $0.003599 liquidation zone, changes in broader crypto risk appetite and any increase in derivatives activity. Because the supplied feed does not include complete positioning figures, traders should avoid assuming that a liquidity cluster guarantees a squeeze.
The September 01, 2026 summary is therefore neutral with a conditional bias. XCN has held support and downside momentum is fading, but the four-hour channel, daily structure and MACD remain bearish. A confirmed reclaim would wake the market up. Until then, the range is more likely to punish impatience than reward prediction.
Previous days
08/31/2026 — XCN Daily Pulse August 31, 2026: Neutral Bias
XCN Daily Pulse August 31, 2026: Neutral Bias
XCN Daily Pulse: Neutral Bias on August 31, 2026
Welcome to Finance With FM's XCN Daily Pulse August 31 2026, a practical market briefing for Onyxcoin traders and investors. XCN is trading near $0.0034372, slightly lower than yesterday, with momentum beginning to improve but price still caught in a difficult technical location.
The headline read is neutral. Daily RSI and MACD are becoming more constructive, while the four-hour chart remains inside a declining channel. Price is also positioned between the 50-day and 200-day moving averages, creating a compression zone rather than a clean trend. That combination can produce sharp moves in both directions, but it does not yet offer the asymmetry required for a high-quality trade.
| Metric | Current read | Trading implication |
|---|---|---|
| Spot price | $0.0034372 | Mid-range and below the key reclaim level |
| 15-minute chart | Rebound stalled | Buyers are present, but control is unconfirmed |
| 4-hour structure | Descending channel | Rallies remain vulnerable to supply |
| Daily RSI | 52; bullish divergence | Downside momentum is weakening |
| Daily MACD | Above signal; histogram positive | Momentum is improving |
| Trade stance | Neutral | Wait for confirmation rather than chase |
15-Minute XCN Price Action: Buyers Have Not Taken Control
The 15-minute chart shows XCN rebounding from the lower portion of its intraday channel before stalling near $0.0034372. The bounce matters because it shows demand is active, but a bounce alone is not a change of control. Price still needs to break the nearby decision level and hold above it.
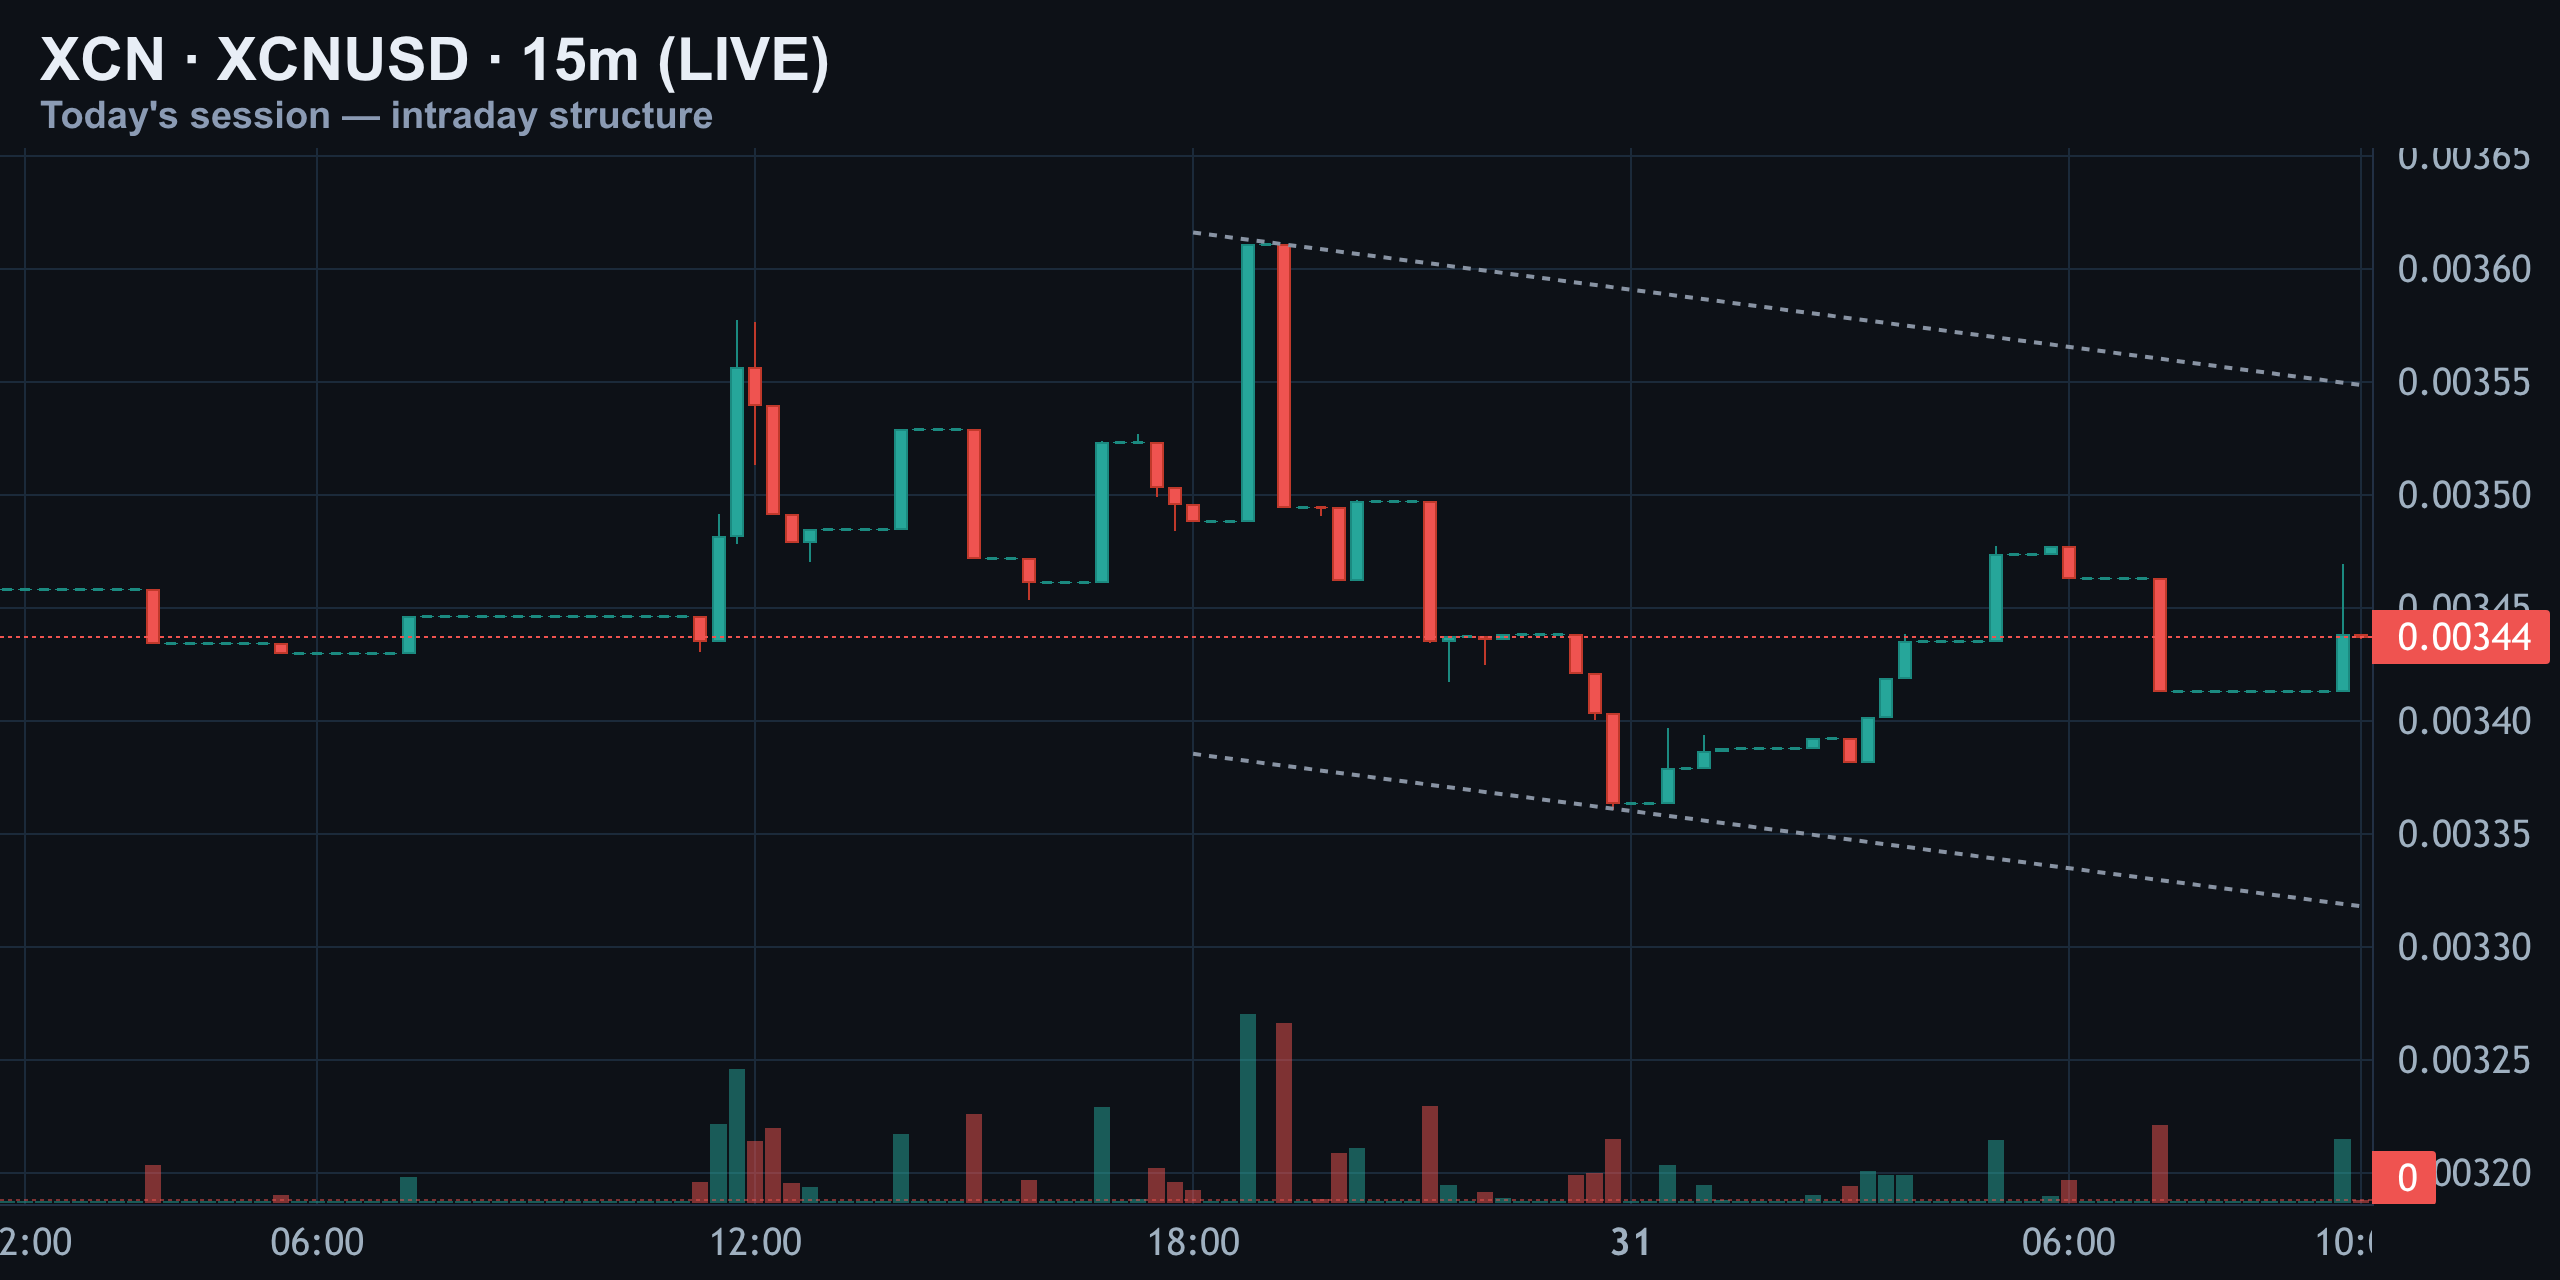
The most important intraday reference is $0.003517. A decisive move above that level, followed by acceptance rather than a brief wick, would improve the short-term structure. It would suggest that buyers are willing to defend higher prices and could open a path toward the liquidation pocket around $0.003599.
Conversely, rejection below $0.003517 keeps the market in balance. In that environment, short-term candles can become misleading: a push higher may simply collect short stops, while a dip lower may sweep long positions before price rotates back into the range. That is why chasing the first breakout candle is unattractive today.
- Bullish intraday confirmation: reclaim and hold above $0.003517.
- Bearish confirmation: loss of nearby support followed by acceptance below it.
- No-trade condition: price continues oscillating between those references without clear follow-through.
Four-Hour Structure: A Rebound Inside a Declining Channel
The four-hour chart is the clearest reason to remain patient. XCN is still trading inside a descending channel after its earlier impulse higher. Successive rallies have met supply, and the latest move has developed more as sideways compression than as a fresh uptrend.
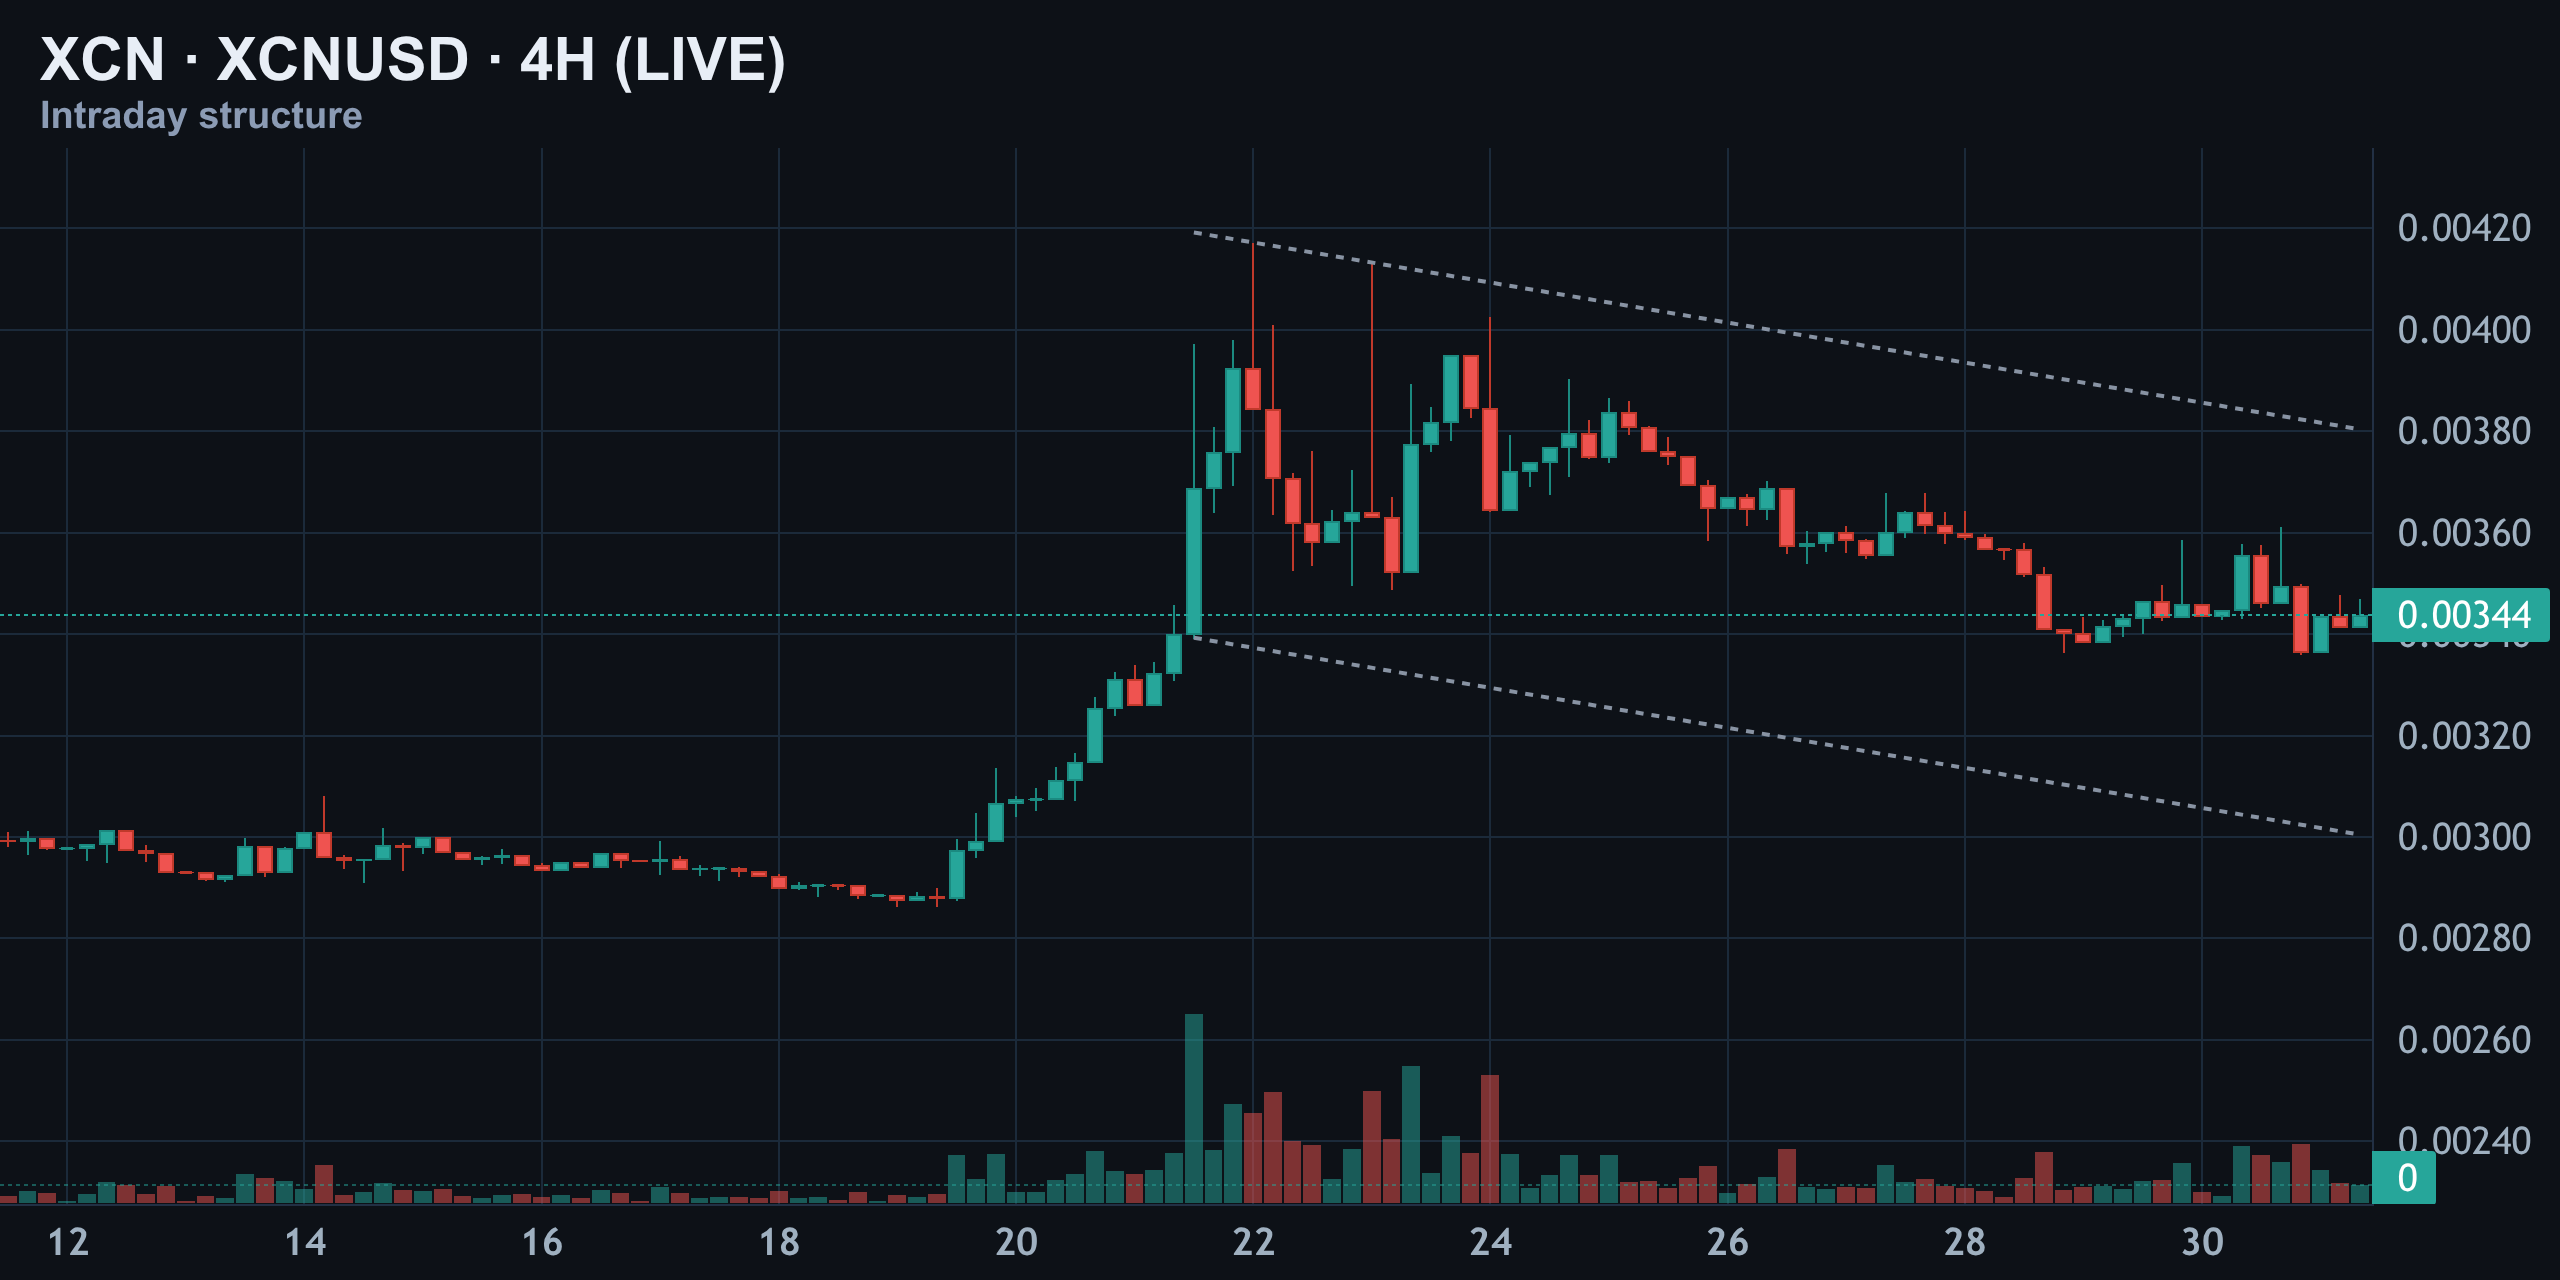
Price is currently boxed between the 50-day and 200-day moving averages. This is an important location because both averages can attract opposing flows: dip buyers may defend the lower boundary, while trend-following sellers may use the upper boundary to re-enter. Until price escapes and holds outside that area, the market can continue rotating in both directions.
A channel break should not be treated as confirmed on a single wick. The more reliable signal would be a four-hour close beyond the boundary, followed by a retest that holds. Without that sequence, the apparent breakout may simply be a liquidity sweep. The structure therefore remains neutral-to-cautious, despite the improving momentum readings.
Daily Trend, RSI and MACD: Momentum Is Improving, but Confirmation Is Missing
The short-term daily chart places the current bounce in a larger context. XCN declined from approximately $0.0055 toward the $0.002863 support area. Although price has recovered from that base, descending resistance remains overhead and the market has not yet produced a durable trend reversal.
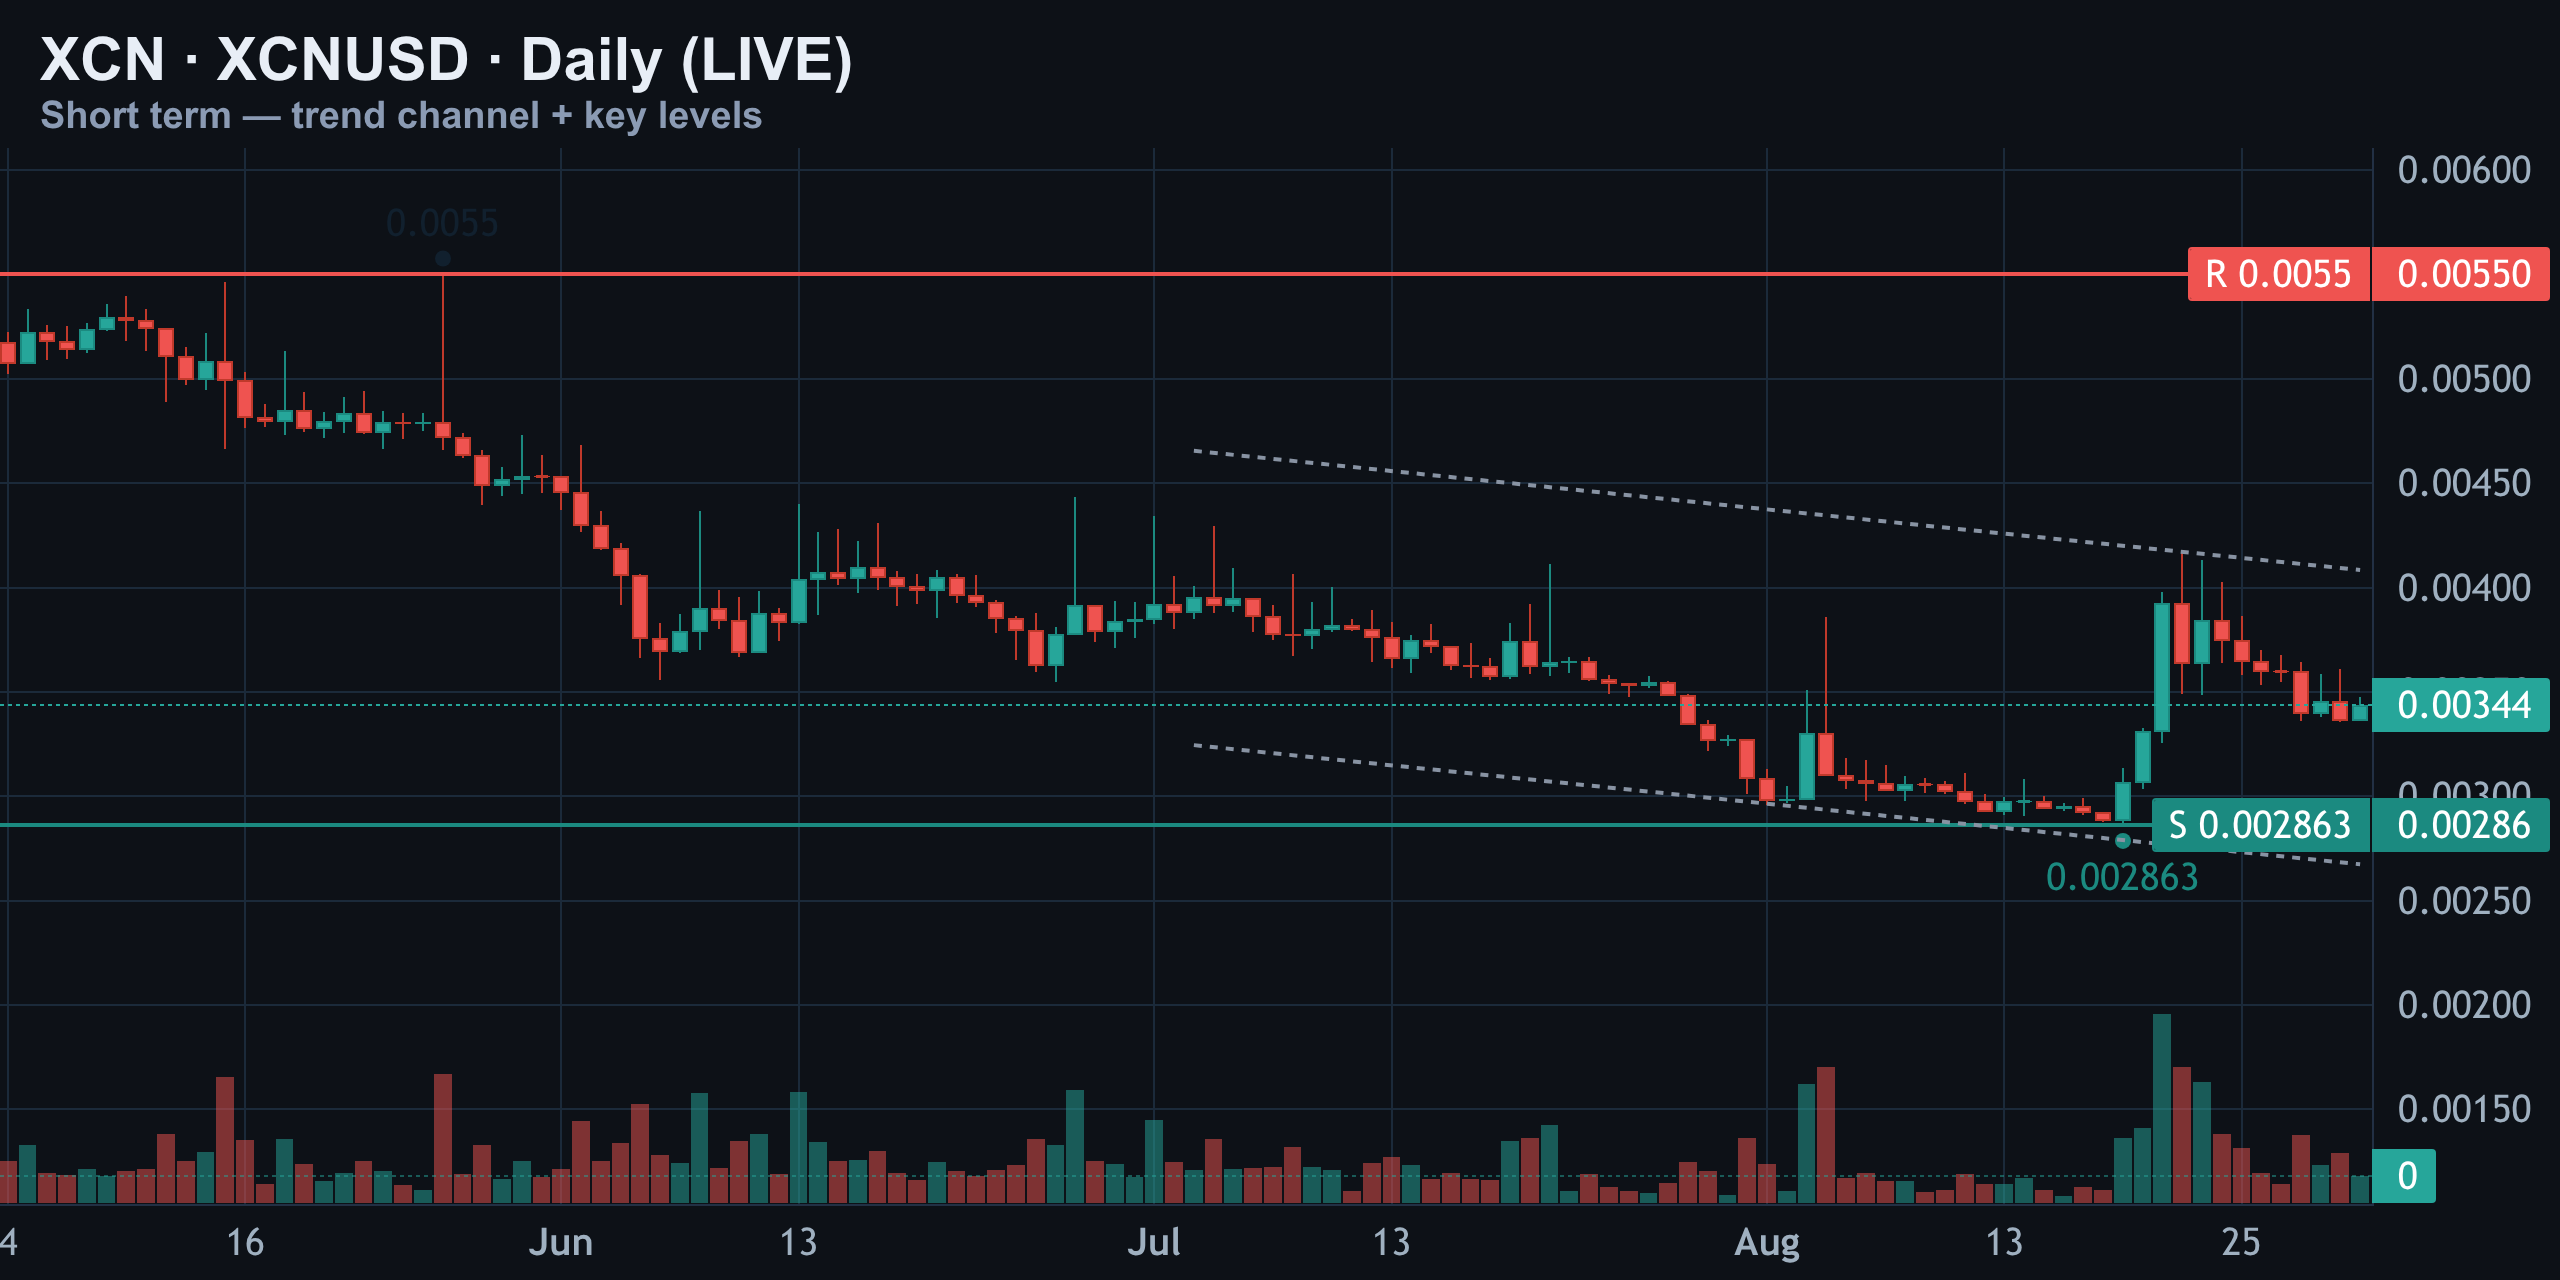
The daily chart is context rather than a precise intraday trigger. Buyers need continuation above the decision level, while sellers need a confirmed support breakdown. An isolated wick below support would not be enough to establish a bearish continuation trade.
Bullish RSI divergence
Daily RSI is near 52, which is neutral overall, but its internal structure is more encouraging. Price made a lower low, moving from approximately $0.002863 toward the $0.002912 comparison area, while RSI made a higher low, rising from about 34 to 45. That is bullish divergence: selling pressure is weakening even though price has not fully reversed.
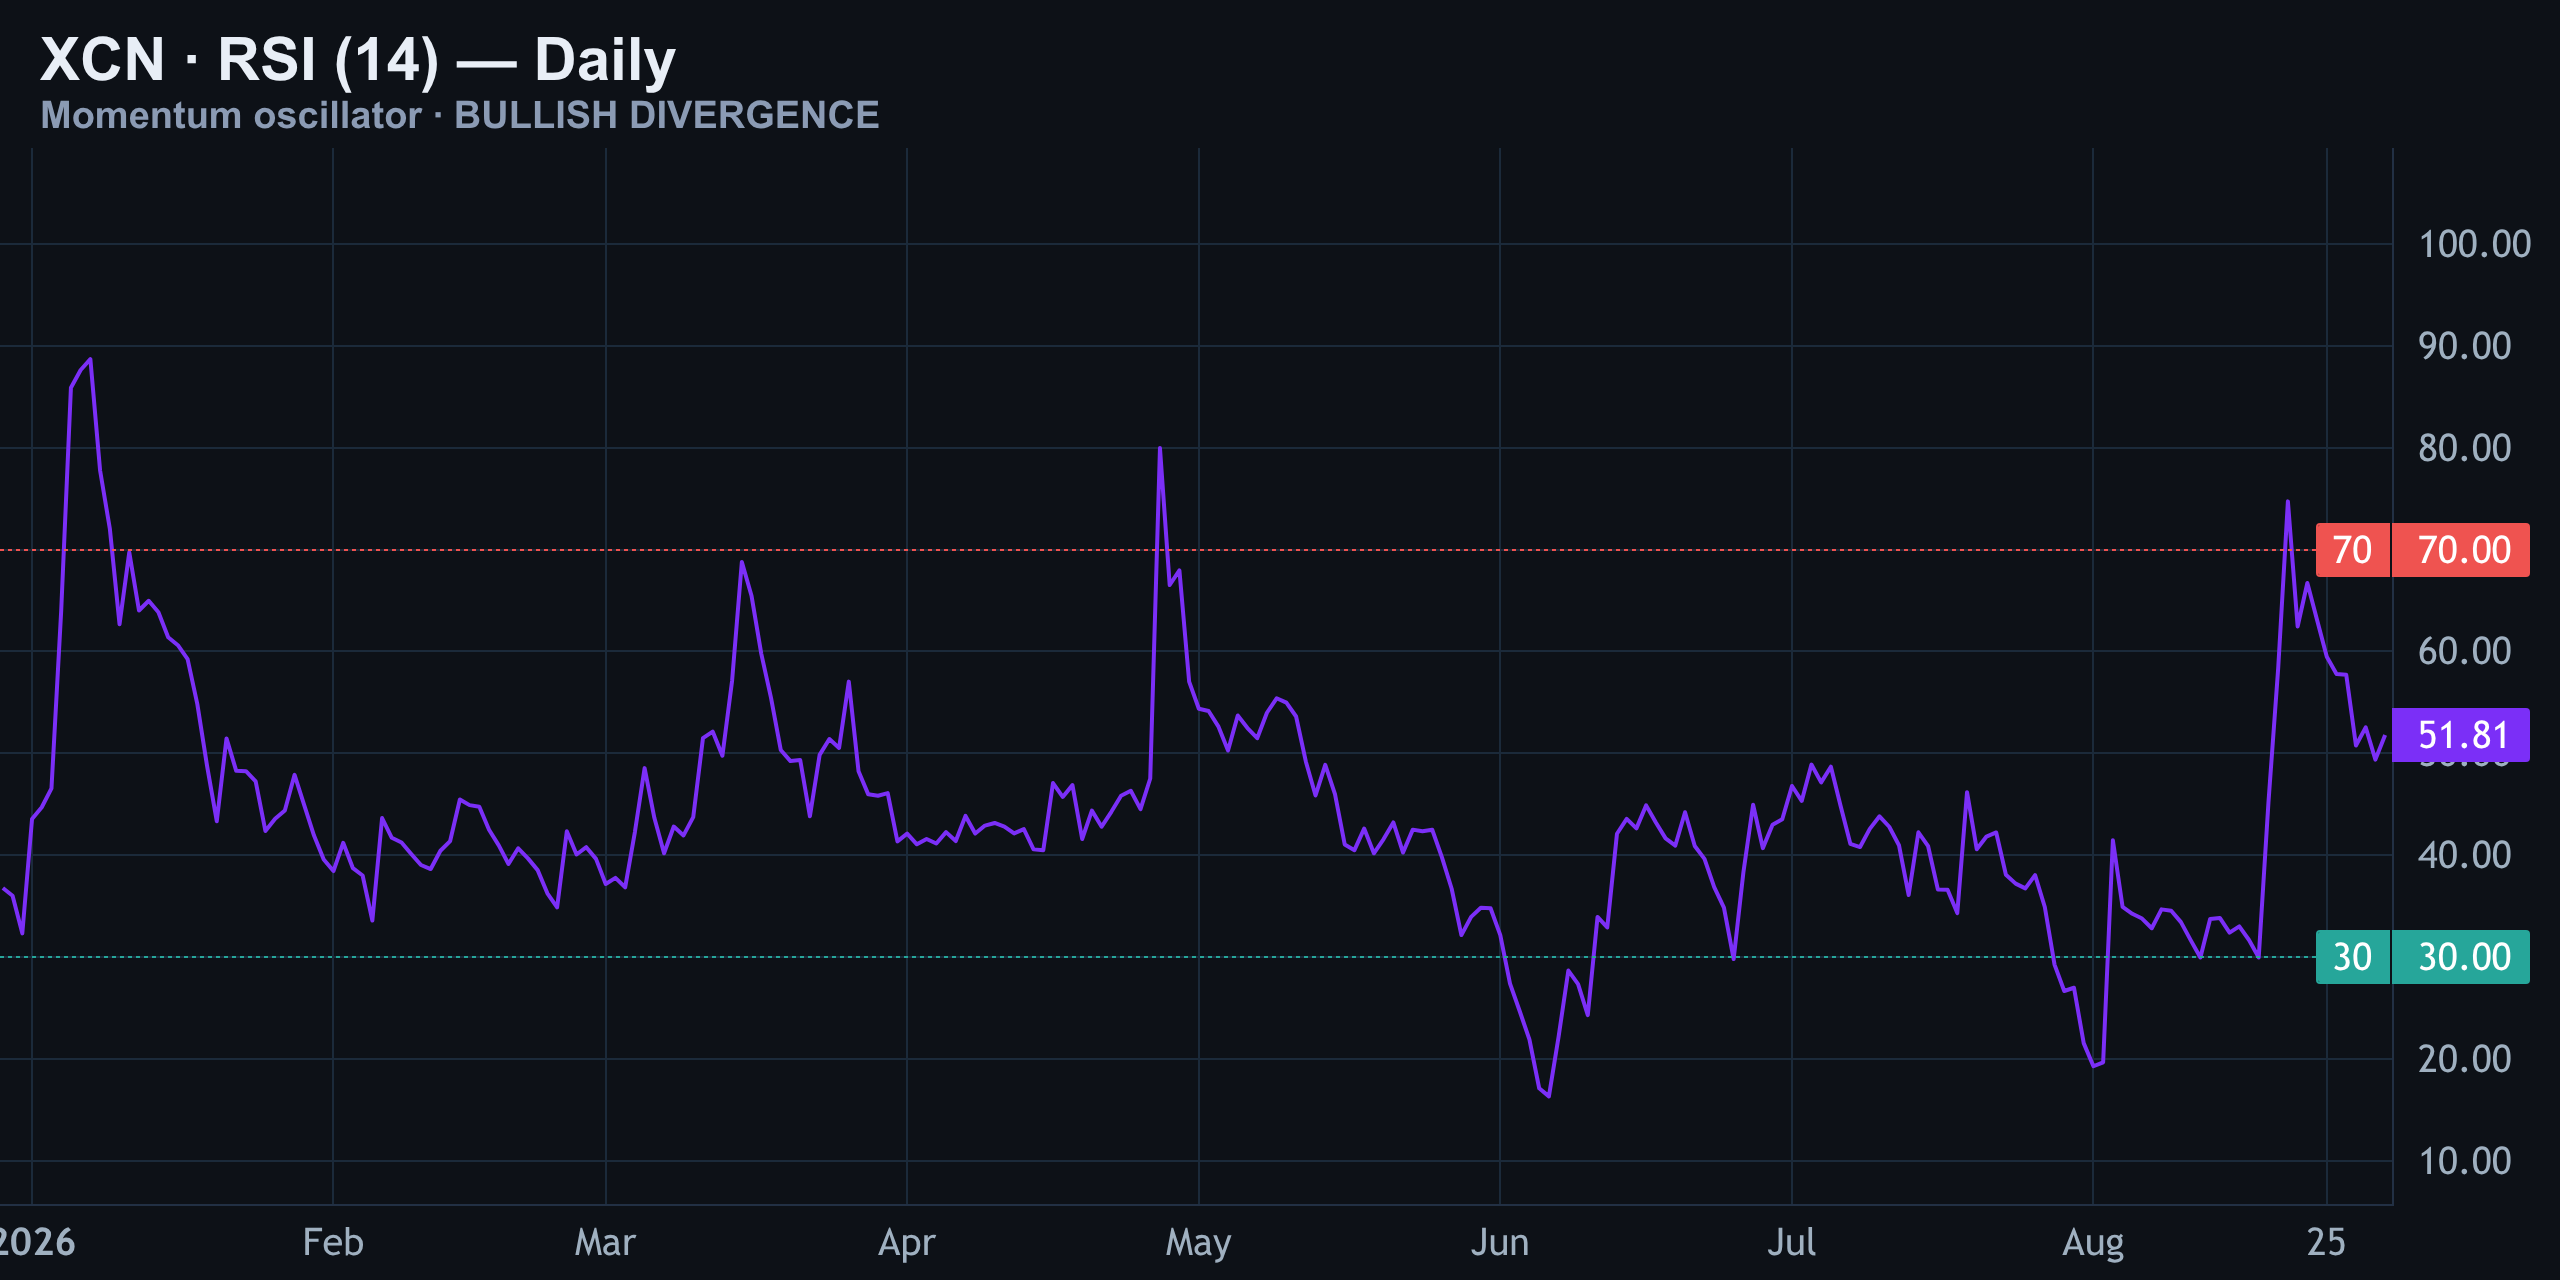
Divergence is an alert, not confirmation. It tells traders to watch for a reversal; it does not prove that one has begun. The required confirmation remains a sustained reclaim of resistance and a sequence of higher highs and higher lows.
Positive MACD, mixed structure
The daily MACD is above its signal line and the histogram is positive. This supports the idea that trend momentum is improving and aligns with the bullish RSI divergence.
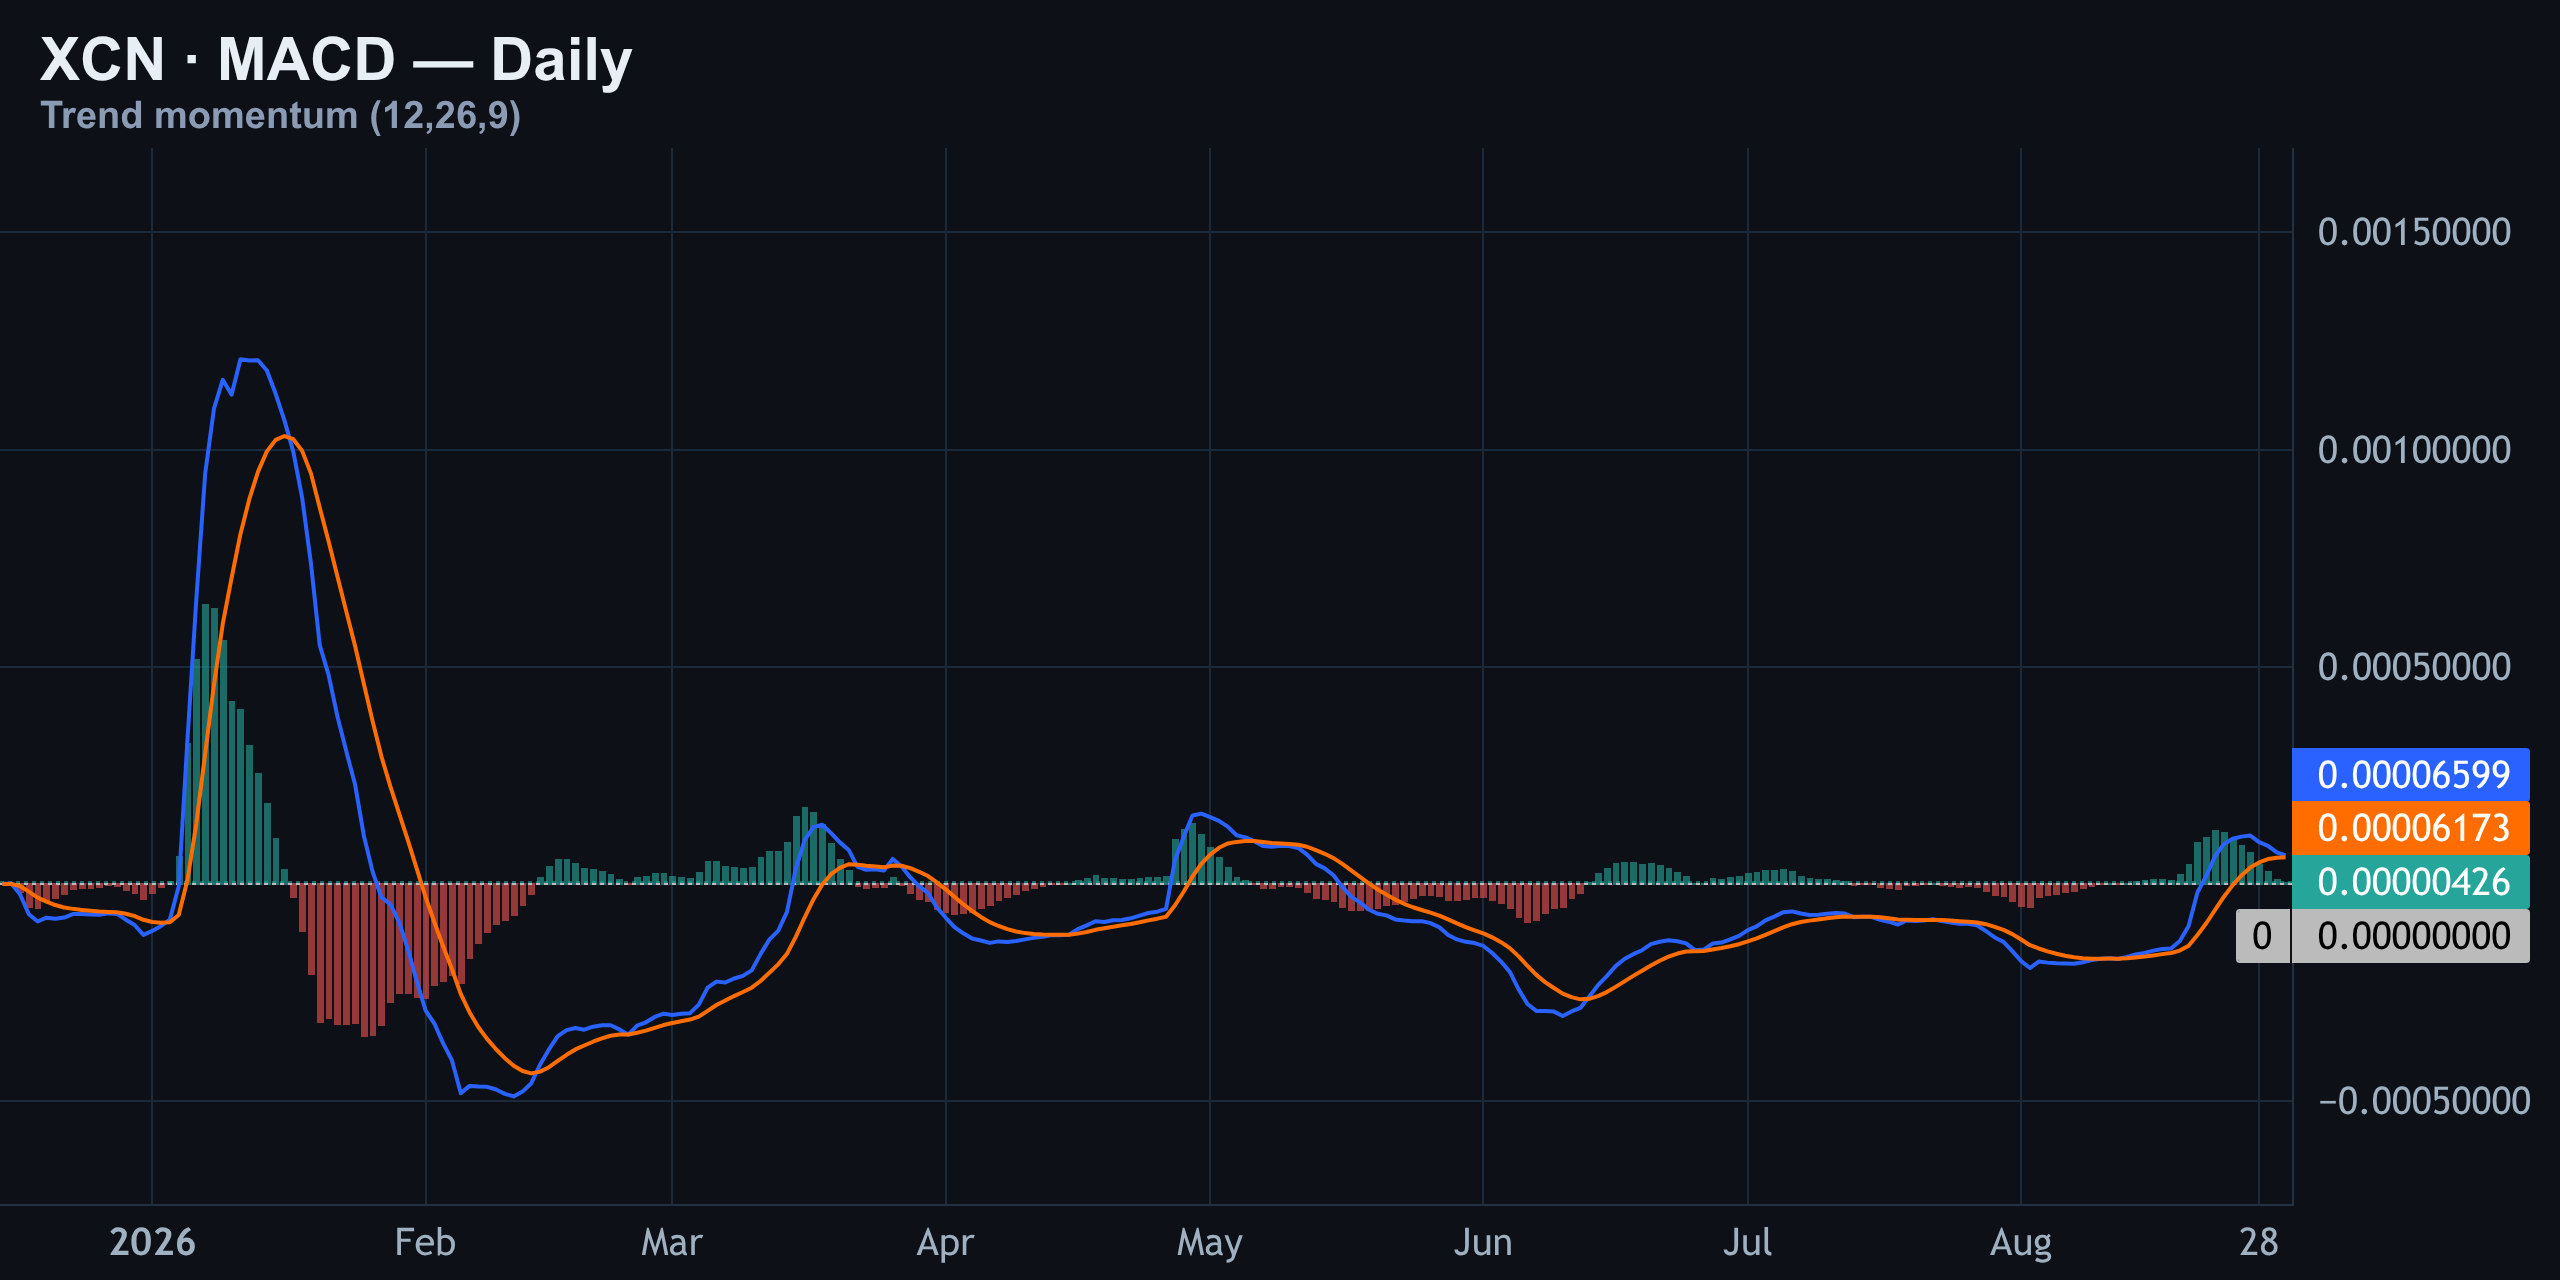
The conflict is between momentum and location. MACD can support a breakout, but it cannot create one while price remains trapped below descending resistance and between major moving averages. Traders should watch whether the histogram expands alongside a sustained reclaim, rather than fading while XCN remains range-bound.
XCN Support, Resistance and Liquidity Levels to Watch
The current reference price is approximately $0.0034372. Historical liquidation activity highlights a notable pocket above spot and several smaller clusters below it. These zones should be treated as areas where leverage has previously been cleared, not as guaranteed price targets.
| Zone | Price | What it means |
|---|---|---|
| Decision level | $0.003517 | Reclaim would improve the intraday bias |
| Upper liquidation pocket | $0.003599 | Potential short-stop and supply area |
| Upper secondary zone | $0.003955 | Higher resistance and liquidation history |
| Current spot | $0.0034372 | Market is below the decision level |
| Lower liquidity zone | $0.003021 | Possible downside sweep area |
| Lower liquidity zone | $0.002977 | Additional leveraged-position cluster |
| Lower liquidity zone | $0.002888 | Smaller historical flush area |
| Key historical support | $0.002863 | Important base for the broader bounce |
The densest single liquidation zone in the available map is around $0.003599. If XCN first reclaims $0.003517, that area may attract price because traders positioned against the move could be forced to cover. However, the same zone can also act as resistance if buyers fail to sustain the breakout.
Below spot, the $0.003021, $0.002977 and $0.002888 areas may draw a downside sweep. The most important structural level remains $0.002863. A brief wick into these areas would show volatility; acceptance below $0.002863 would be more significant and would weaken the rebound thesis.
For live market context, traders can compare spot activity with XCN market data on CoinGecko, chart structure on TradingView and derivatives positioning through CoinGlass. Liquidity maps can change quickly, particularly when open interest is incomplete or fragmented across venues.
Broader Crypto Drivers and Today's Trade Decision
The broader crypto tape is mixed. Bitcoin is reported to be holding near $78,000, while a weaker yen and rising rate-hike expectations are supporting the dollar. A firmer dollar and tighter-rate expectations can create a restrictive macro backdrop for risk assets, including altcoins such as XCN.
There is also sector-specific risk. A reported $75 million lending exploit at Tectonic, followed by a halt involving Cronos-related activity, is a reminder that protocol and venue risk can quickly affect sentiment across connected crypto ecosystems. The event does not automatically determine XCN's chart direction, but it can reduce risk appetite and increase volatility.
The derivatives picture is incomplete, so liquidation levels should not be mistaken for a full positioning analysis. Funding, open interest, basis and exchange-specific flows would add useful context. Without that confirmation, the responsible approach is to give greater weight to confirmed price acceptance than to a single indicator or liquidation cluster.
No clean 1:2.5 trade today
At the current price, a long position would be entering below the $0.003517 decision level, where confirmation is still missing. A short position would be selling into improving RSI and MACD momentum, with several downside liquidity pockets that could trigger a reversal. Neither side offers a clean 1:2.5 risk-to-reward profile without relying on a speculative stop or an unconfirmed breakout.
| Scenario | Confirmation | Desk response |
|---|---|---|
| Bullish | Reclaim and hold above $0.003517 | Watch $0.003599, then $0.003955 |
| Bearish | Acceptance below nearby support | Monitor $0.003021 to $0.002888 |
| Structural failure | Sustained break below $0.002863 | Rebound thesis is materially weakened |
| Range-bound | Price remains between key levels | Stand aside and avoid chasing |
The bias flips constructive above $0.003517 if the reclaim holds. It turns more defensive below nearby support, particularly if price accepts beneath $0.002863. Until one of those conditions appears, the market is best treated as a balance zone rather than a trend trade.
XCN Daily Pulse Summary
XCN is showing an encouraging internal momentum setup: daily RSI has formed bullish divergence, MACD is positive, and price has bounced from an important historical base. Those signals deserve attention, but they are not yet strong enough to override the four-hour descending channel and the unresolved moving-average compression.
The most important level for August 31 into September 1 is $0.003517. A clean reclaim would improve the short-term outlook and place $0.003599 in focus. Failure to reclaim it keeps the range intact, while a deeper breakdown would expose the lower liquidity zones and potentially the $0.002863 support base.
For now, Finance With FM maintains a neutral stance. Wait for price to prove direction, define risk around confirmed structure and avoid letting a positive indicator reading become an excuse to force a trade.
08/30/2026 — XCN Daily Pulse — August 30, 2026
XCN Daily Pulse — August 30, 2026
XCN Daily Pulse: Neutral Bias as Momentum Improves
XCN has a contradiction at the centre of today’s chart. Momentum is improving, but price is still caught between major moving averages and beneath important resistance. The daily RSI is neutral while carrying a bullish divergence, and the MACD has moved above its signal line. However, the intraday chart continues to reject higher prices. In other words, the indicators are beginning to lean constructive, but the market structure has not confirmed a trend reversal.
Since the August 29 update, XCN has risen approximately 1.5%, moving from around $0.0033958 to approximately $0.0034465. That gain is notable, but it has not changed the trading classification. The previous call was to stand aside while price remained range-bound between the 50-day and 200-day moving averages. No target was reached, no stop was triggered and no trade remained open.
| Metric | Current read |
|---|---|
| Reference price | $0.0034465 |
| Change since August 29 | Approximately +1.5% |
| Primary stance | Neutral, not bearish |
| Daily RSI (14) | 52, neutral |
| Daily MACD | Above signal; positive histogram |
| Trade status | No qualified setup |
The neutral stance is therefore not a bearish call. XCN is holding after a recent rebound, downside momentum has weakened and buyers are showing signs of returning. But price still needs to reclaim resistance and hold above it. Until that happens, the most reliable description is a market attempting to turn inside a range.
15-Minute XCN Chart: Compression After Rejection
The 15-minute chart shows why chasing the latest move higher is risky. XCN compressed around $0.0034465 after a sharp intraday spike briefly tested the $0.00357 area. Sellers rejected that push and forced price back into the channel. The result is a familiar two-sided pattern: rallies are being sold, while dips are finding short-term bids.
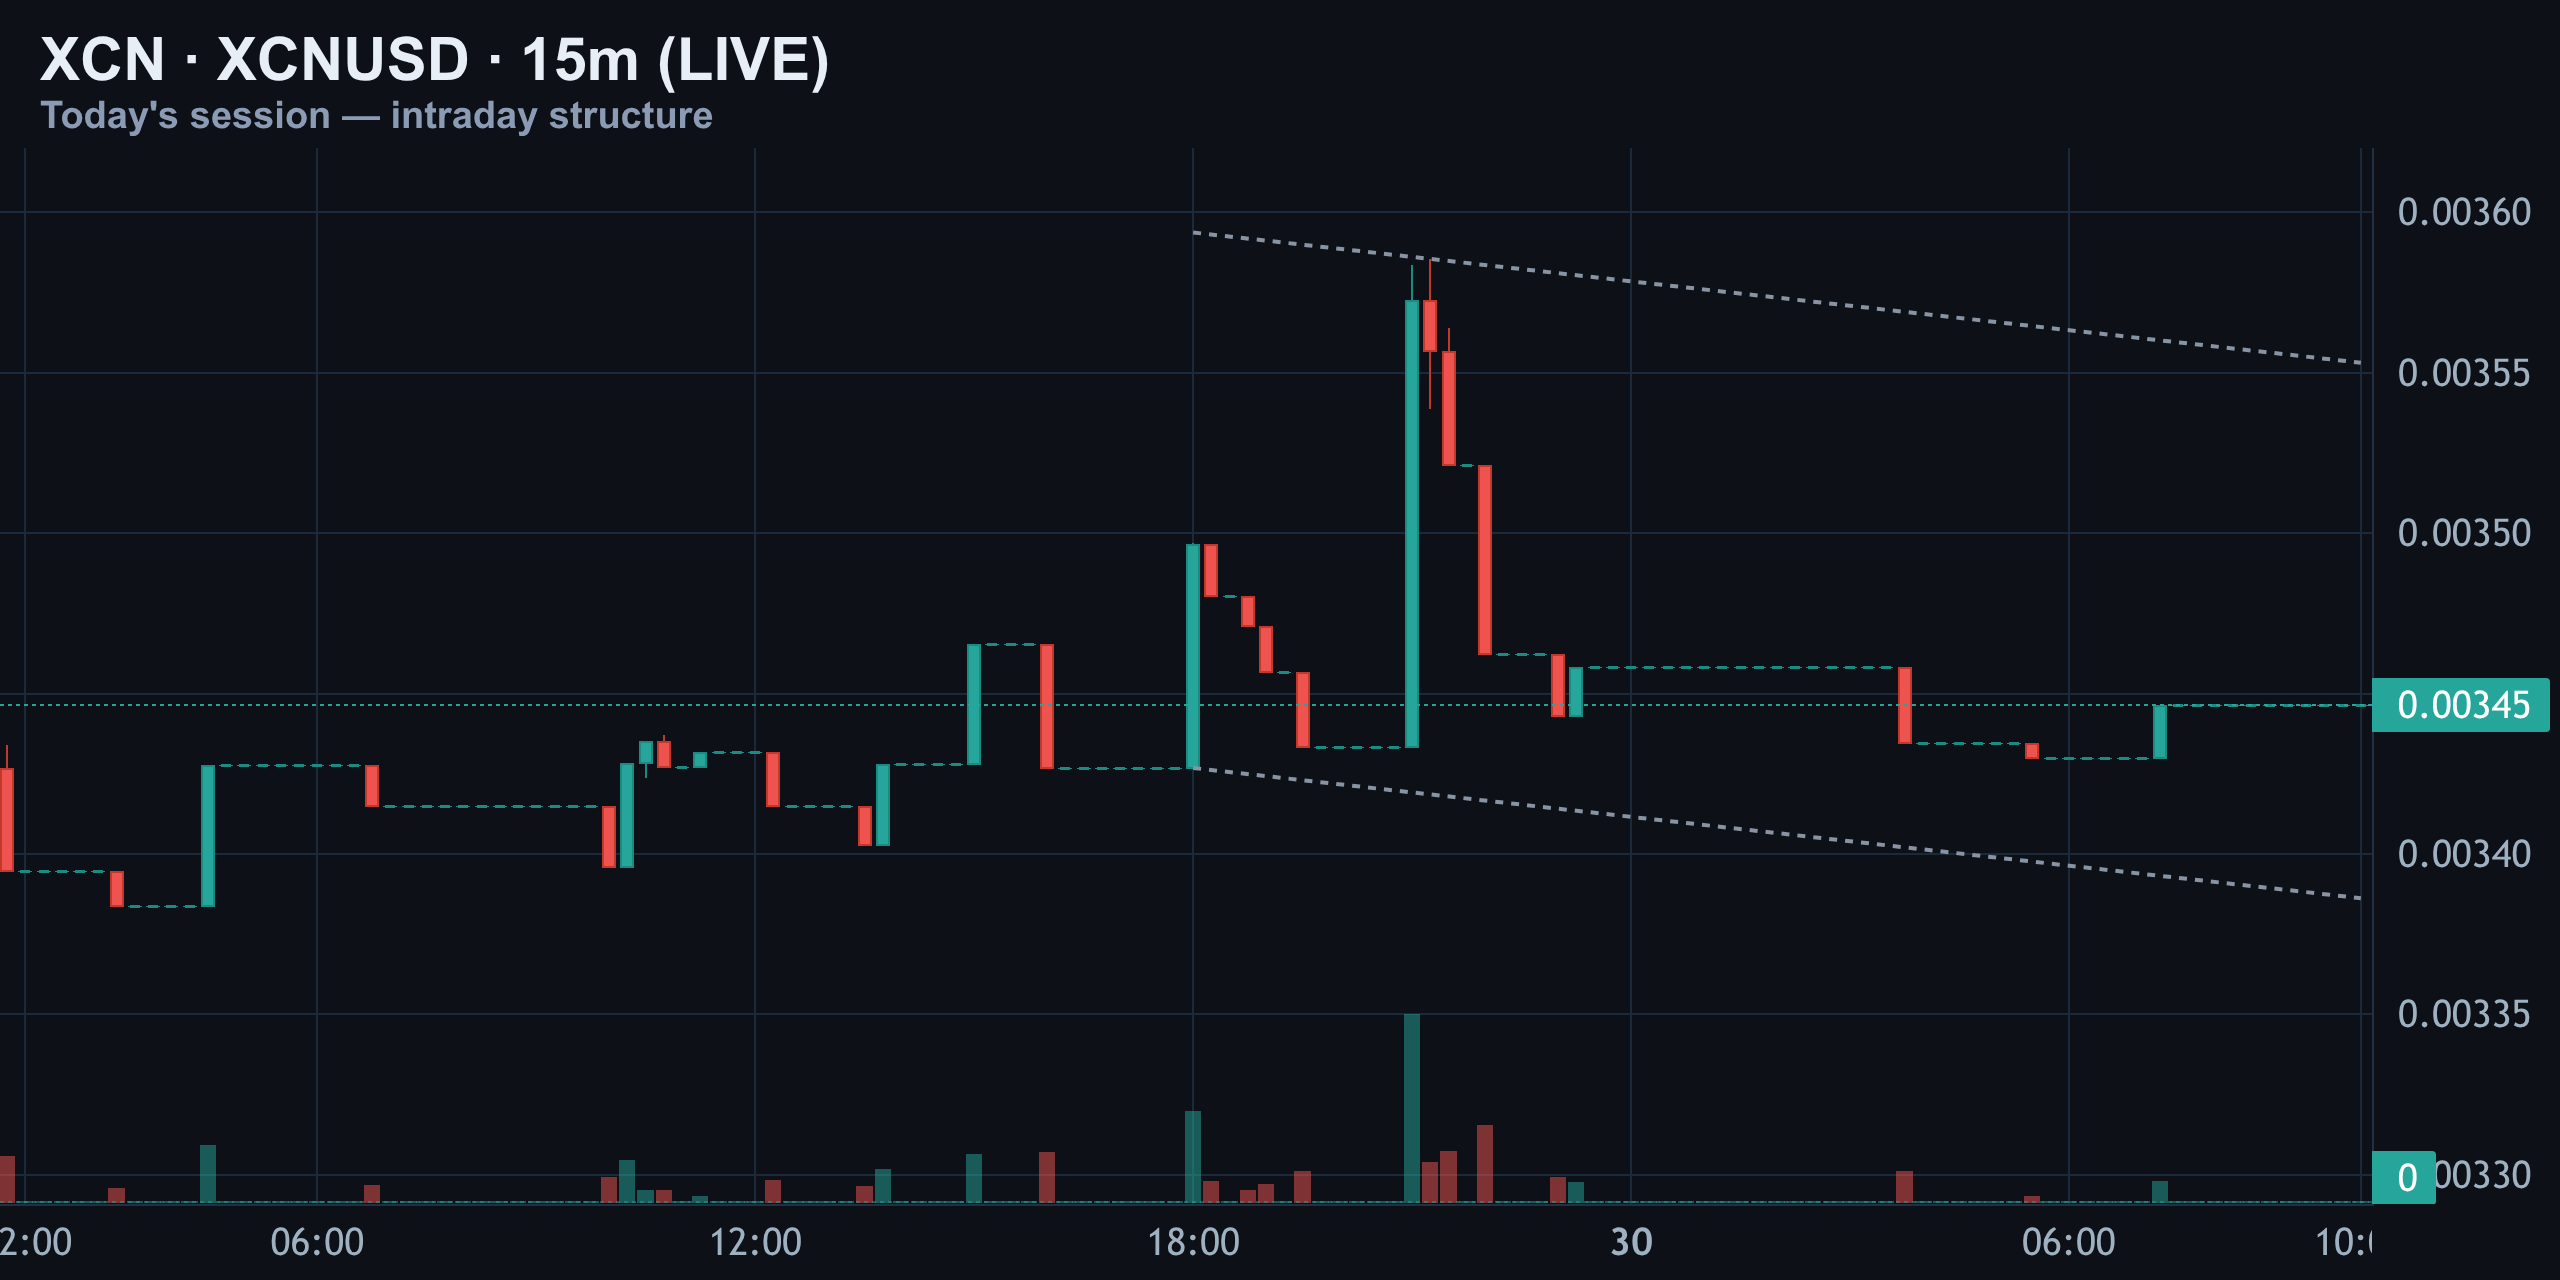
The descending channel boundaries remain important. A move toward the upper boundary is not automatically bullish if sellers continue to absorb those attempts. Likewise, a dip toward the lower boundary is not automatically bearish while buyers continue to defend it. This is balanced order flow rather than a clean directional breakout.
For the intraday structure to improve, XCN needs to reclaim the channel ceiling and hold that reclaim through a retest. A quick wick above resistance would be less meaningful than a sustained close followed by successful support. Until that sequence appears, the chart is better described as rotation inside a range than an established reversal.
- A sustained break above the intraday ceiling would improve the short-term bias.
- A rejection near the current range keeps fade-the-extreme behaviour in play.
- A loss of nearby support would put the recent rebound under pressure.
- Compression alone is not a trade signal; the resolution and retest matter.
4-Hour Structure: Rebound, Not Confirmation
The 4-hour chart provides the larger context. XCN rebounded from approximately $0.002863, but the recovery has not broken the descending sequence of lower highs. Price is now near $0.0034465 and remains below the prior reaction area around $0.0036. That leaves the market in a transition zone: the bounce is real, but the larger decline has not yet been invalidated.
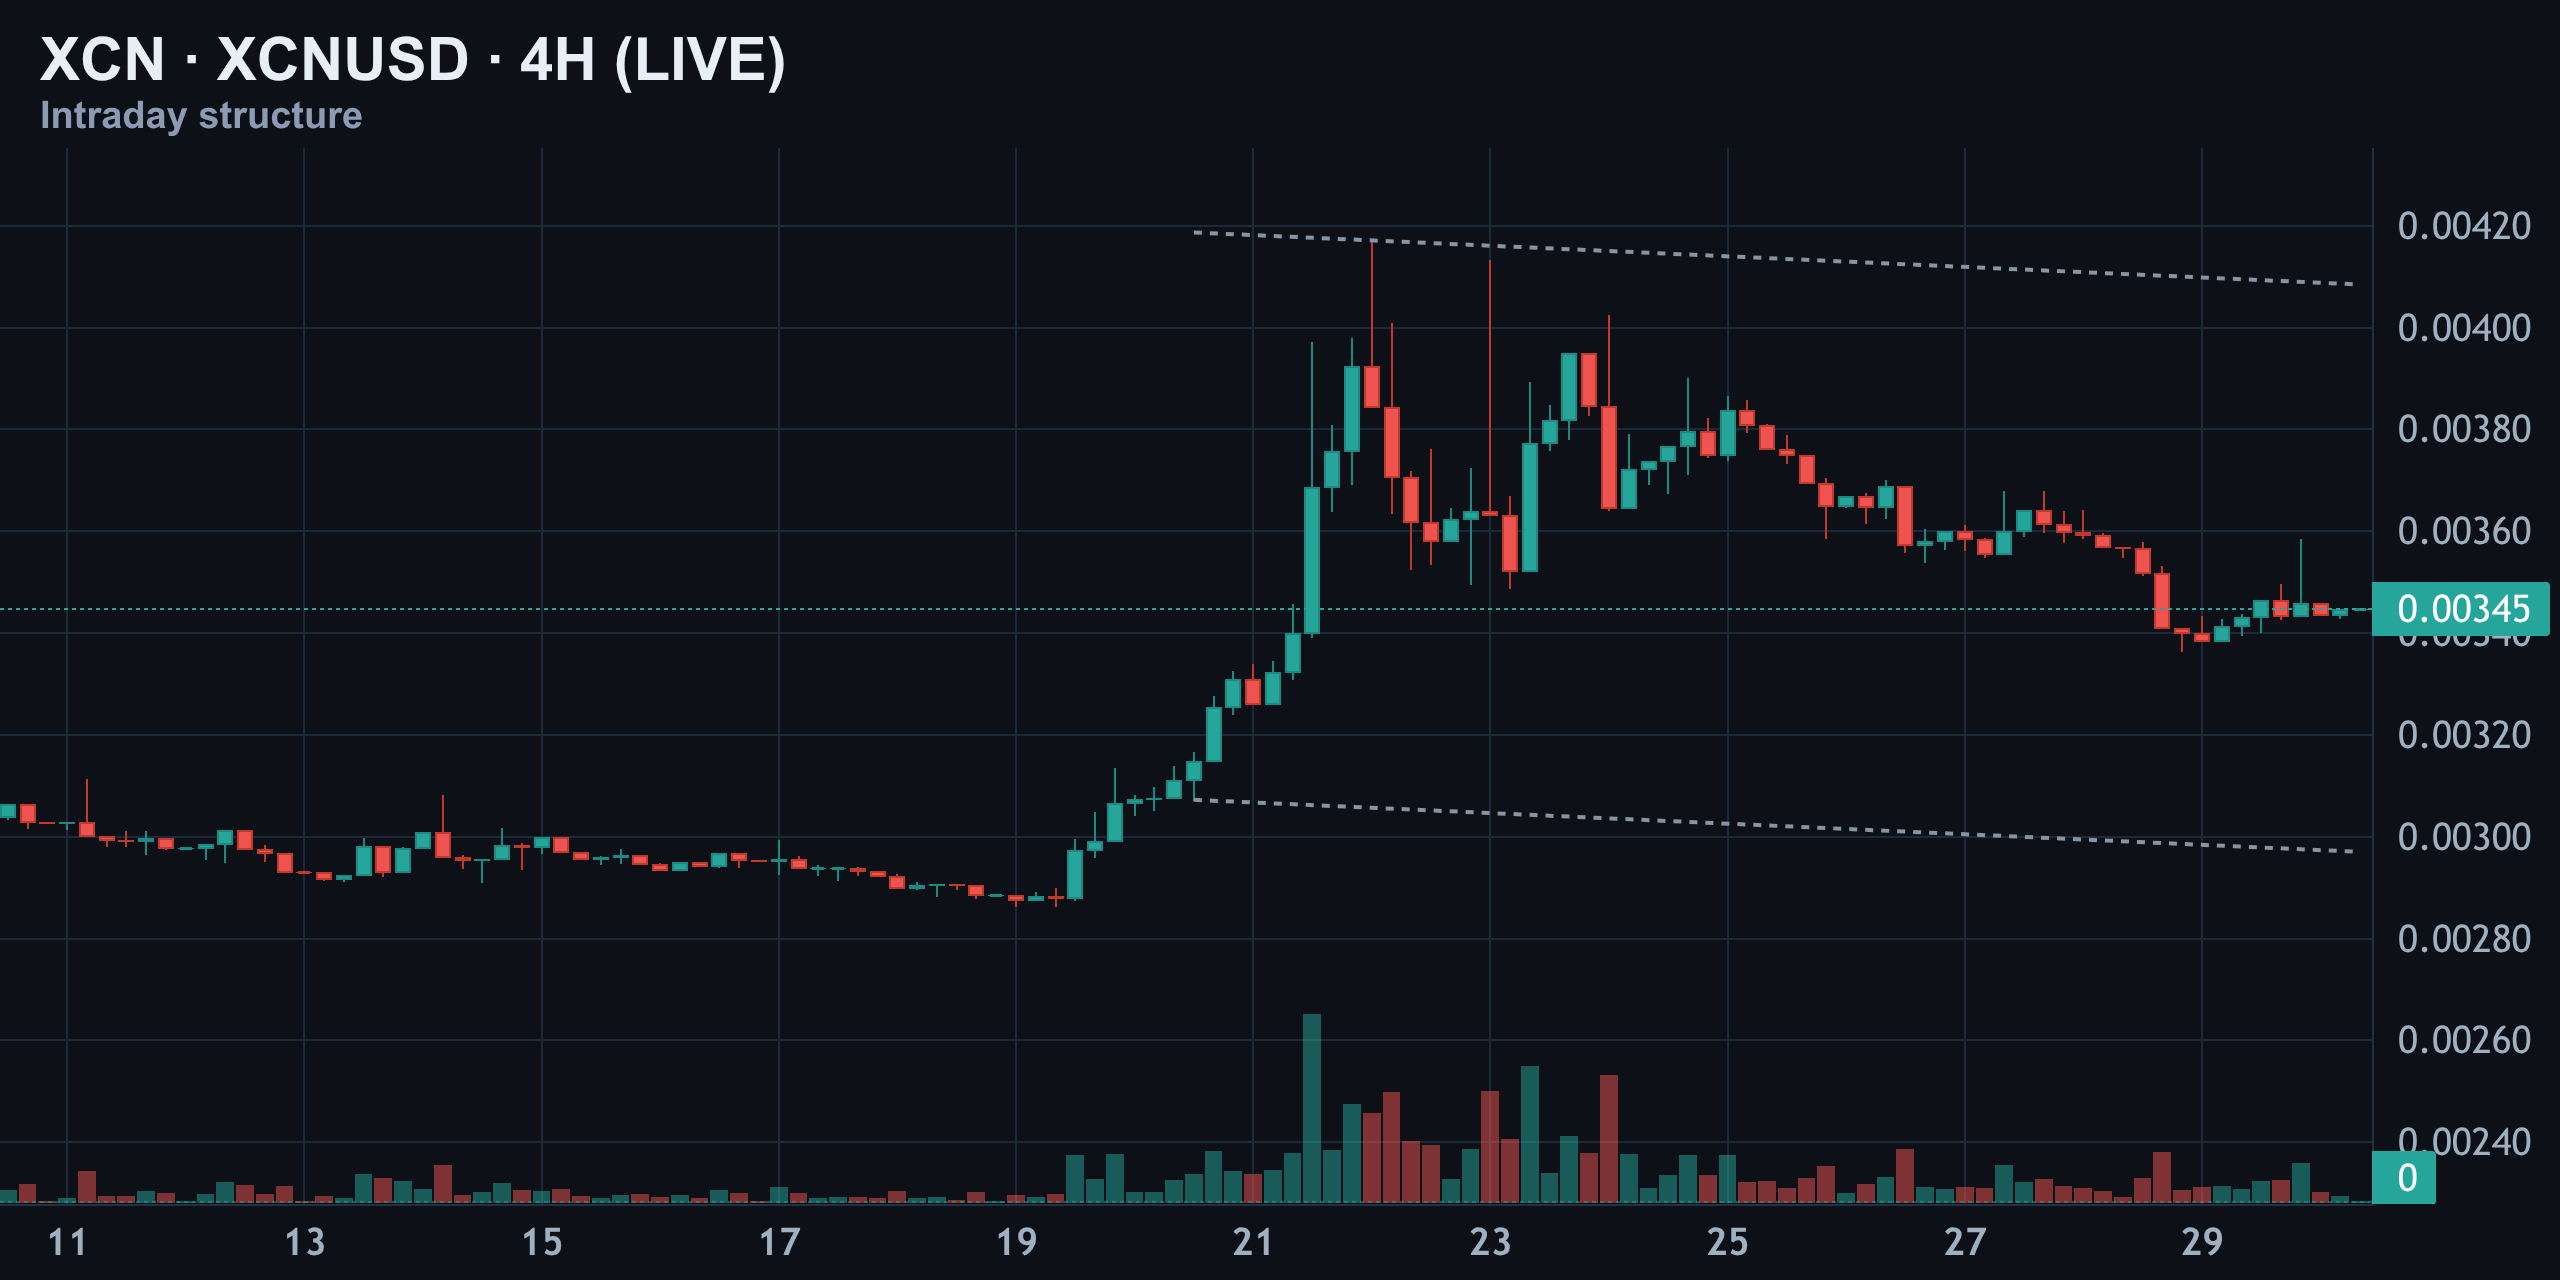
This is the key difference between a rebound and a confirmed trend change. A rebound can develop because short sellers take profit, buyers defend a prior low or momentum indicators begin to recover. A confirmed reversal requires price to reclaim a meaningful swing level and demonstrate that former resistance has become support.
At present, both sides can still make a reasonable case for fading the extremes. Sellers can point to the unbroken lower-high sequence and resistance near the mid-$0.003 range. Buyers can point to the defended low, the RSI divergence and the positive MACD. That conflict is precisely why the risk-reward profile is not attractive enough for a fresh position.
Daily Channel: Support Held, but Resistance Still Controls
The short-term daily chart shows XCN trading within a broad descending channel. Price recently defended the $0.002863 support area, producing a strong rebound from the lower portion of the structure. That defence is constructive, but XCN remains below the channel’s upper boundary and well below the larger $0.0055 resistance marker.
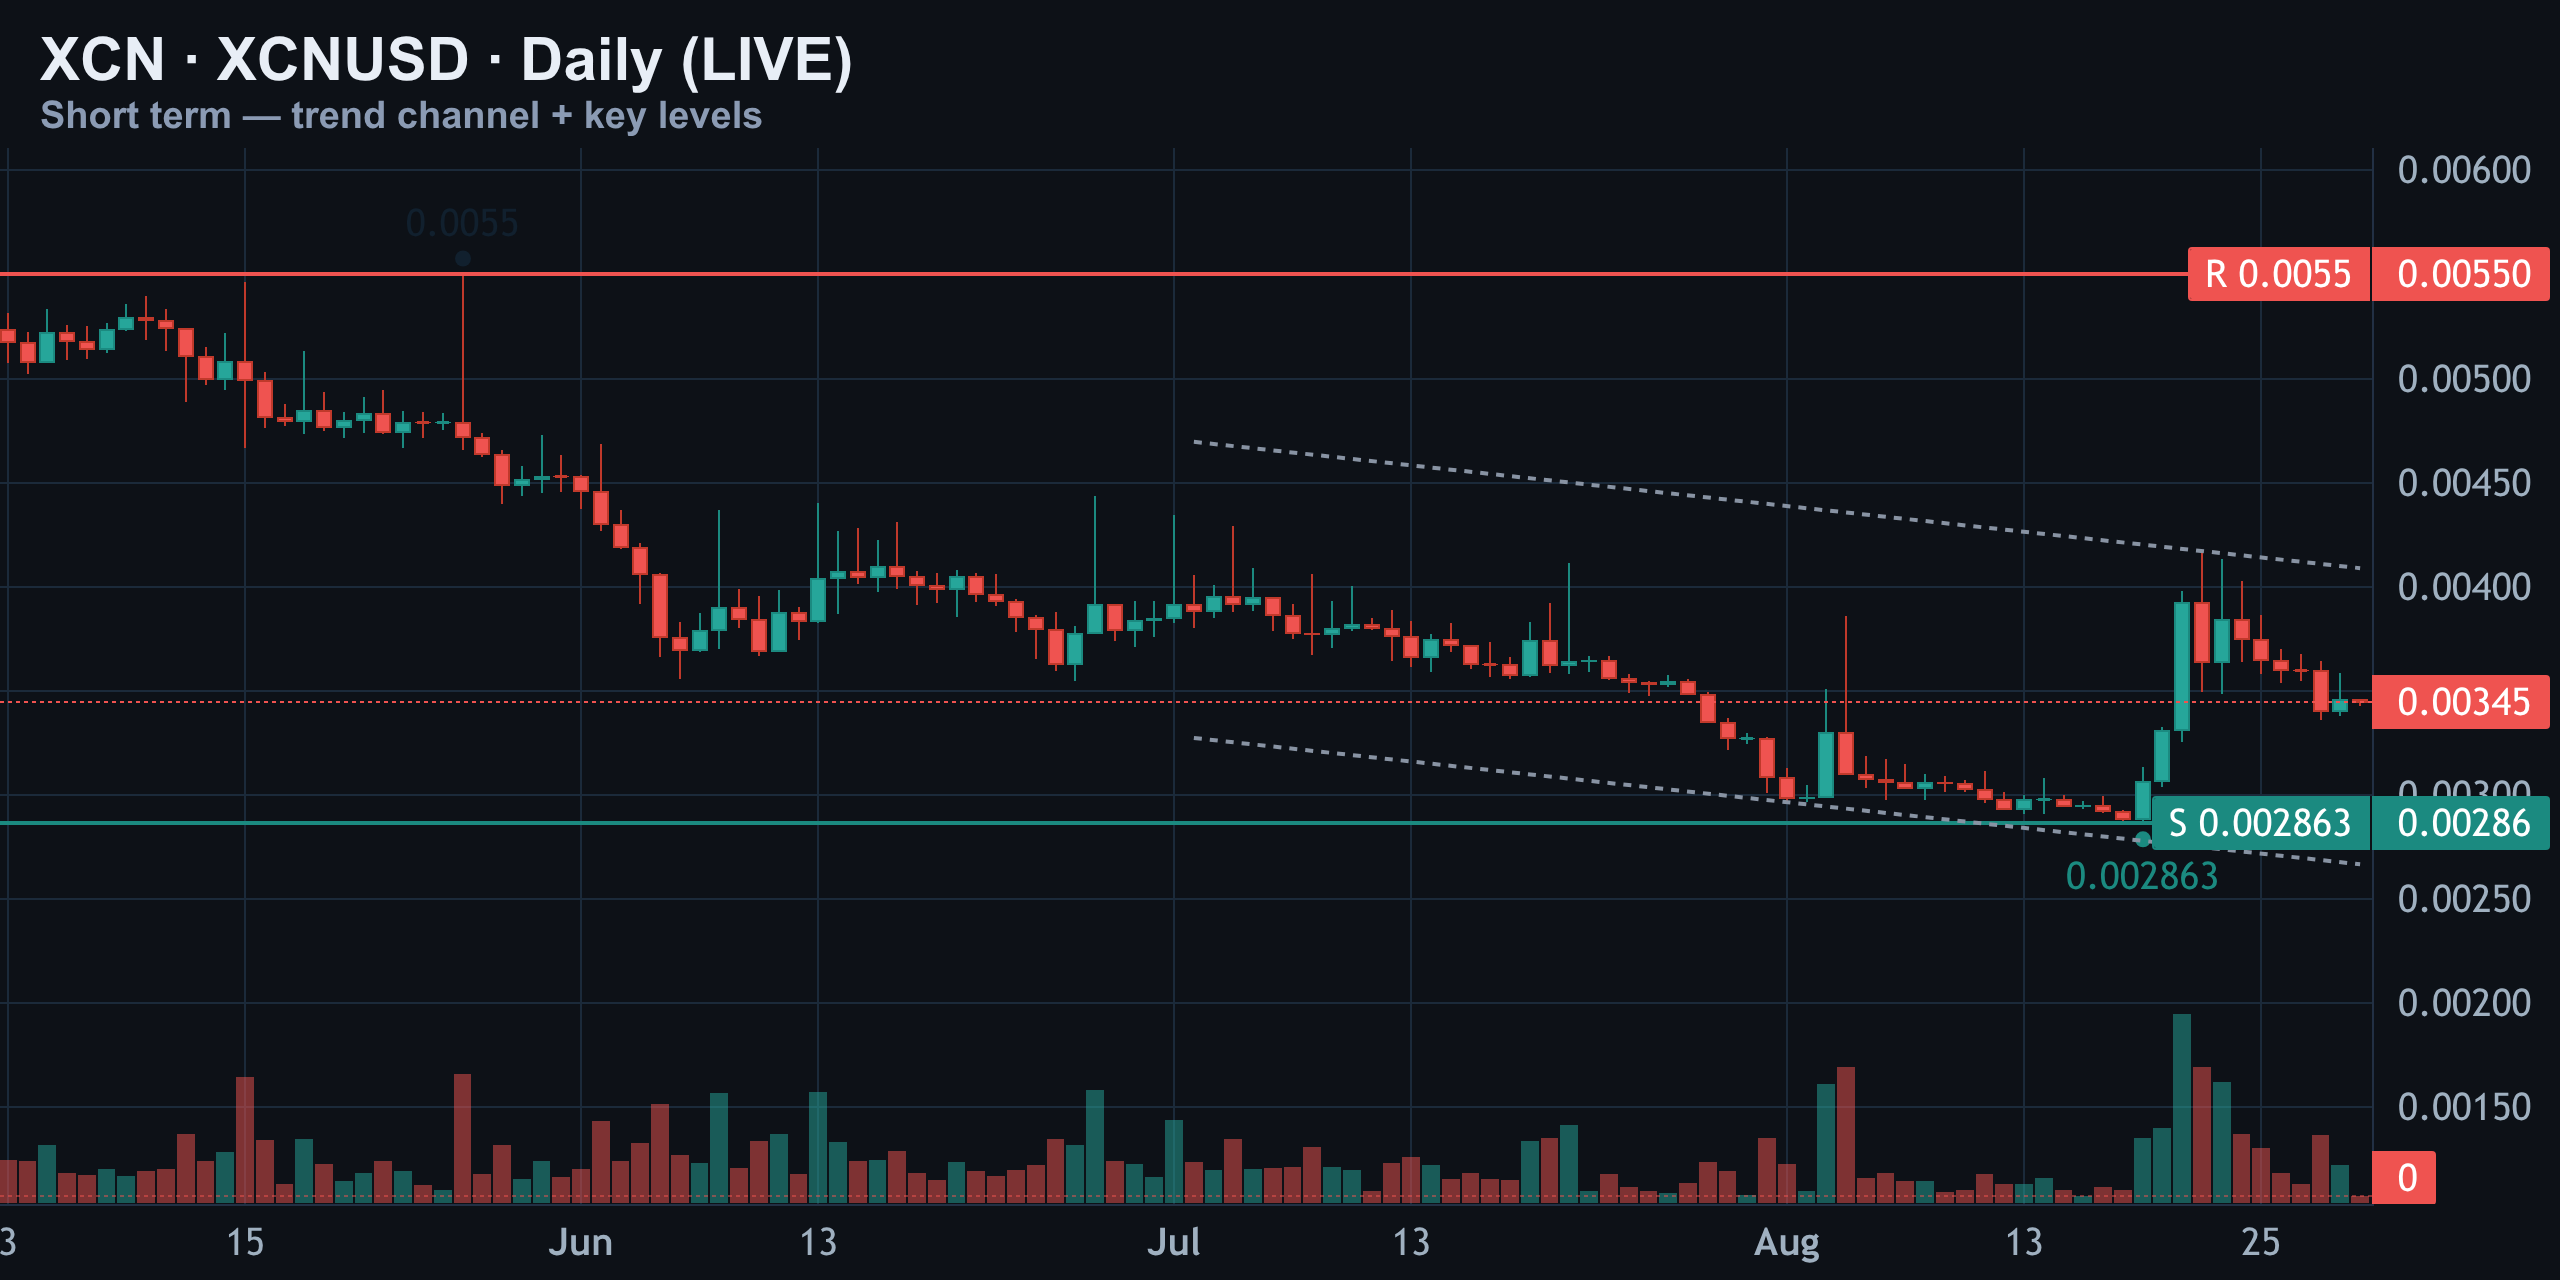
Location matters more than excitement here. XCN is no longer pressing the lows, which reduces immediate downside pressure, but it is also not trading in open trend continuation. A move through nearby resistance would improve the structure and could attract momentum buyers. Failure near the current range would leave the descending channel as the dominant framework.
The market therefore has two jobs before the bias can turn decisively bullish. First, it must move through the bias-flip area. Second, it must show acceptance above that zone rather than producing another brief wick and reversal. Without that confirmation, the channel floor defence is evidence of stabilisation, not proof of a completed bottom.
RSI and MACD: Constructive Signals Without a Breakout
The daily RSI is reading 52, which is neutral. The more important feature is the bullish divergence beneath that reading. XCN made a lower low near $0.002863 compared with a prior comparison low near $0.002912, while RSI made a higher low, improving from approximately 34 to 45. Price weakened, but the momentum behind that weakness faded.
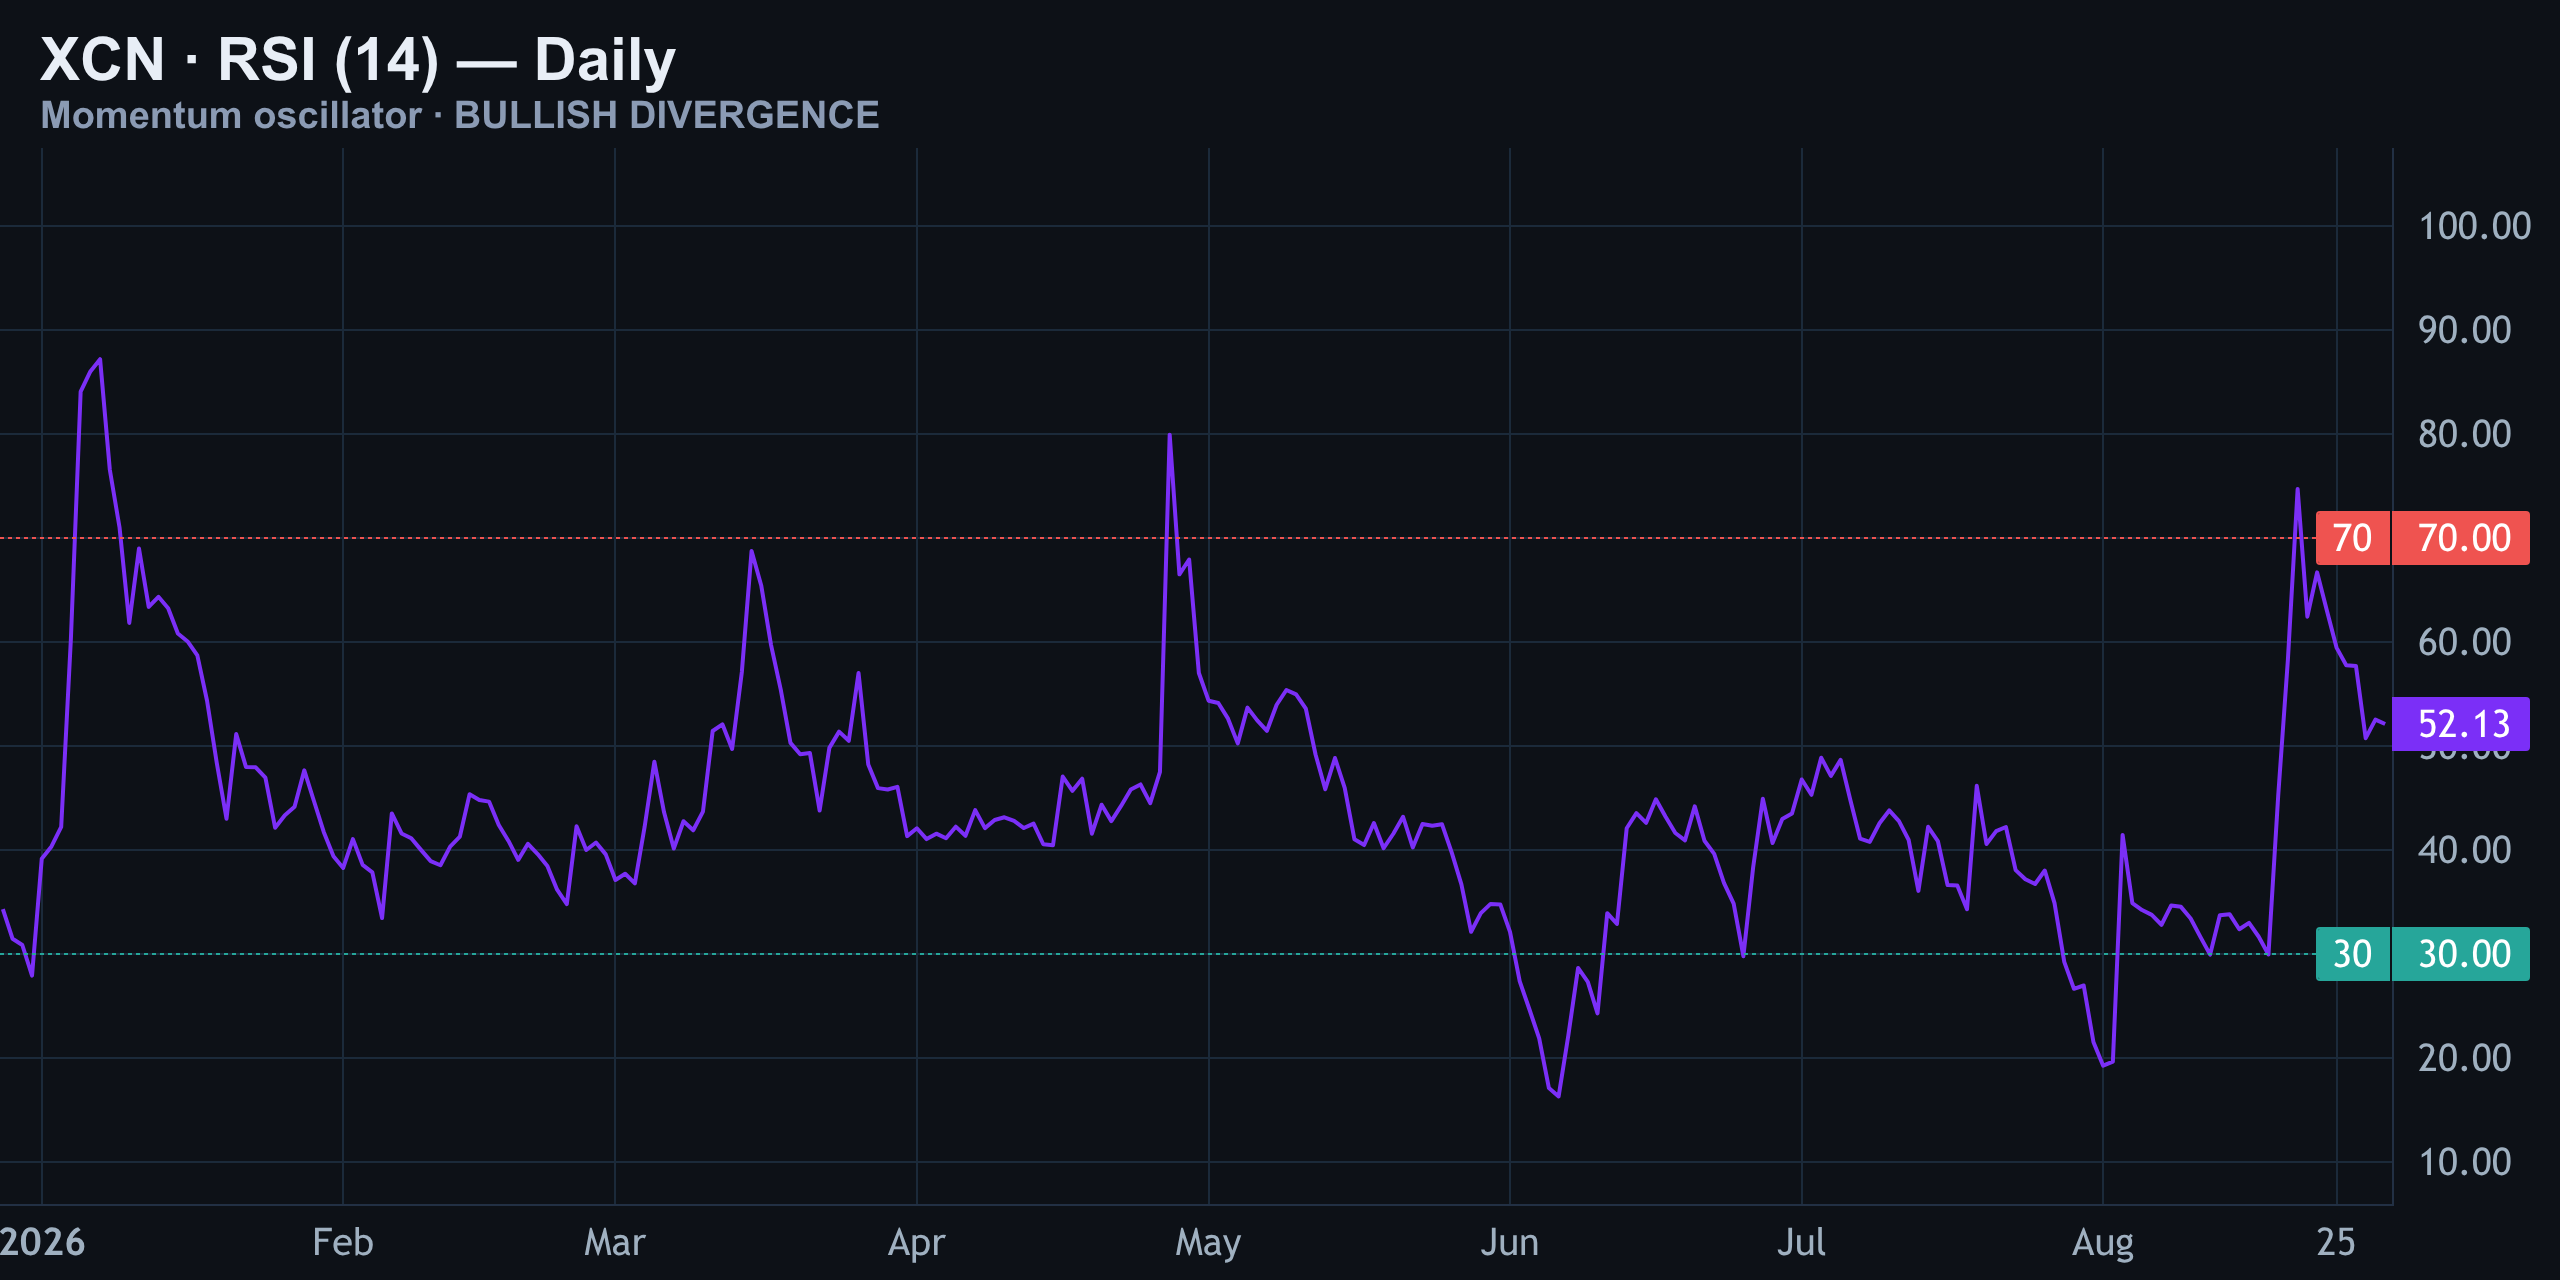
This is a classic bottoming tell, but it is not a timing signal by itself. Bullish divergence can remain unresolved for an extended period, particularly when price is still below major resistance. For the signal to become more actionable, RSI should hold above neutral while price reclaims and defends the relevant resistance zones.
The MACD offers a second constructive clue. It is above its signal line and the histogram is positive, confirming that short-term trend momentum is improving. That aligns with the RSI divergence and suggests selling pressure is easing.
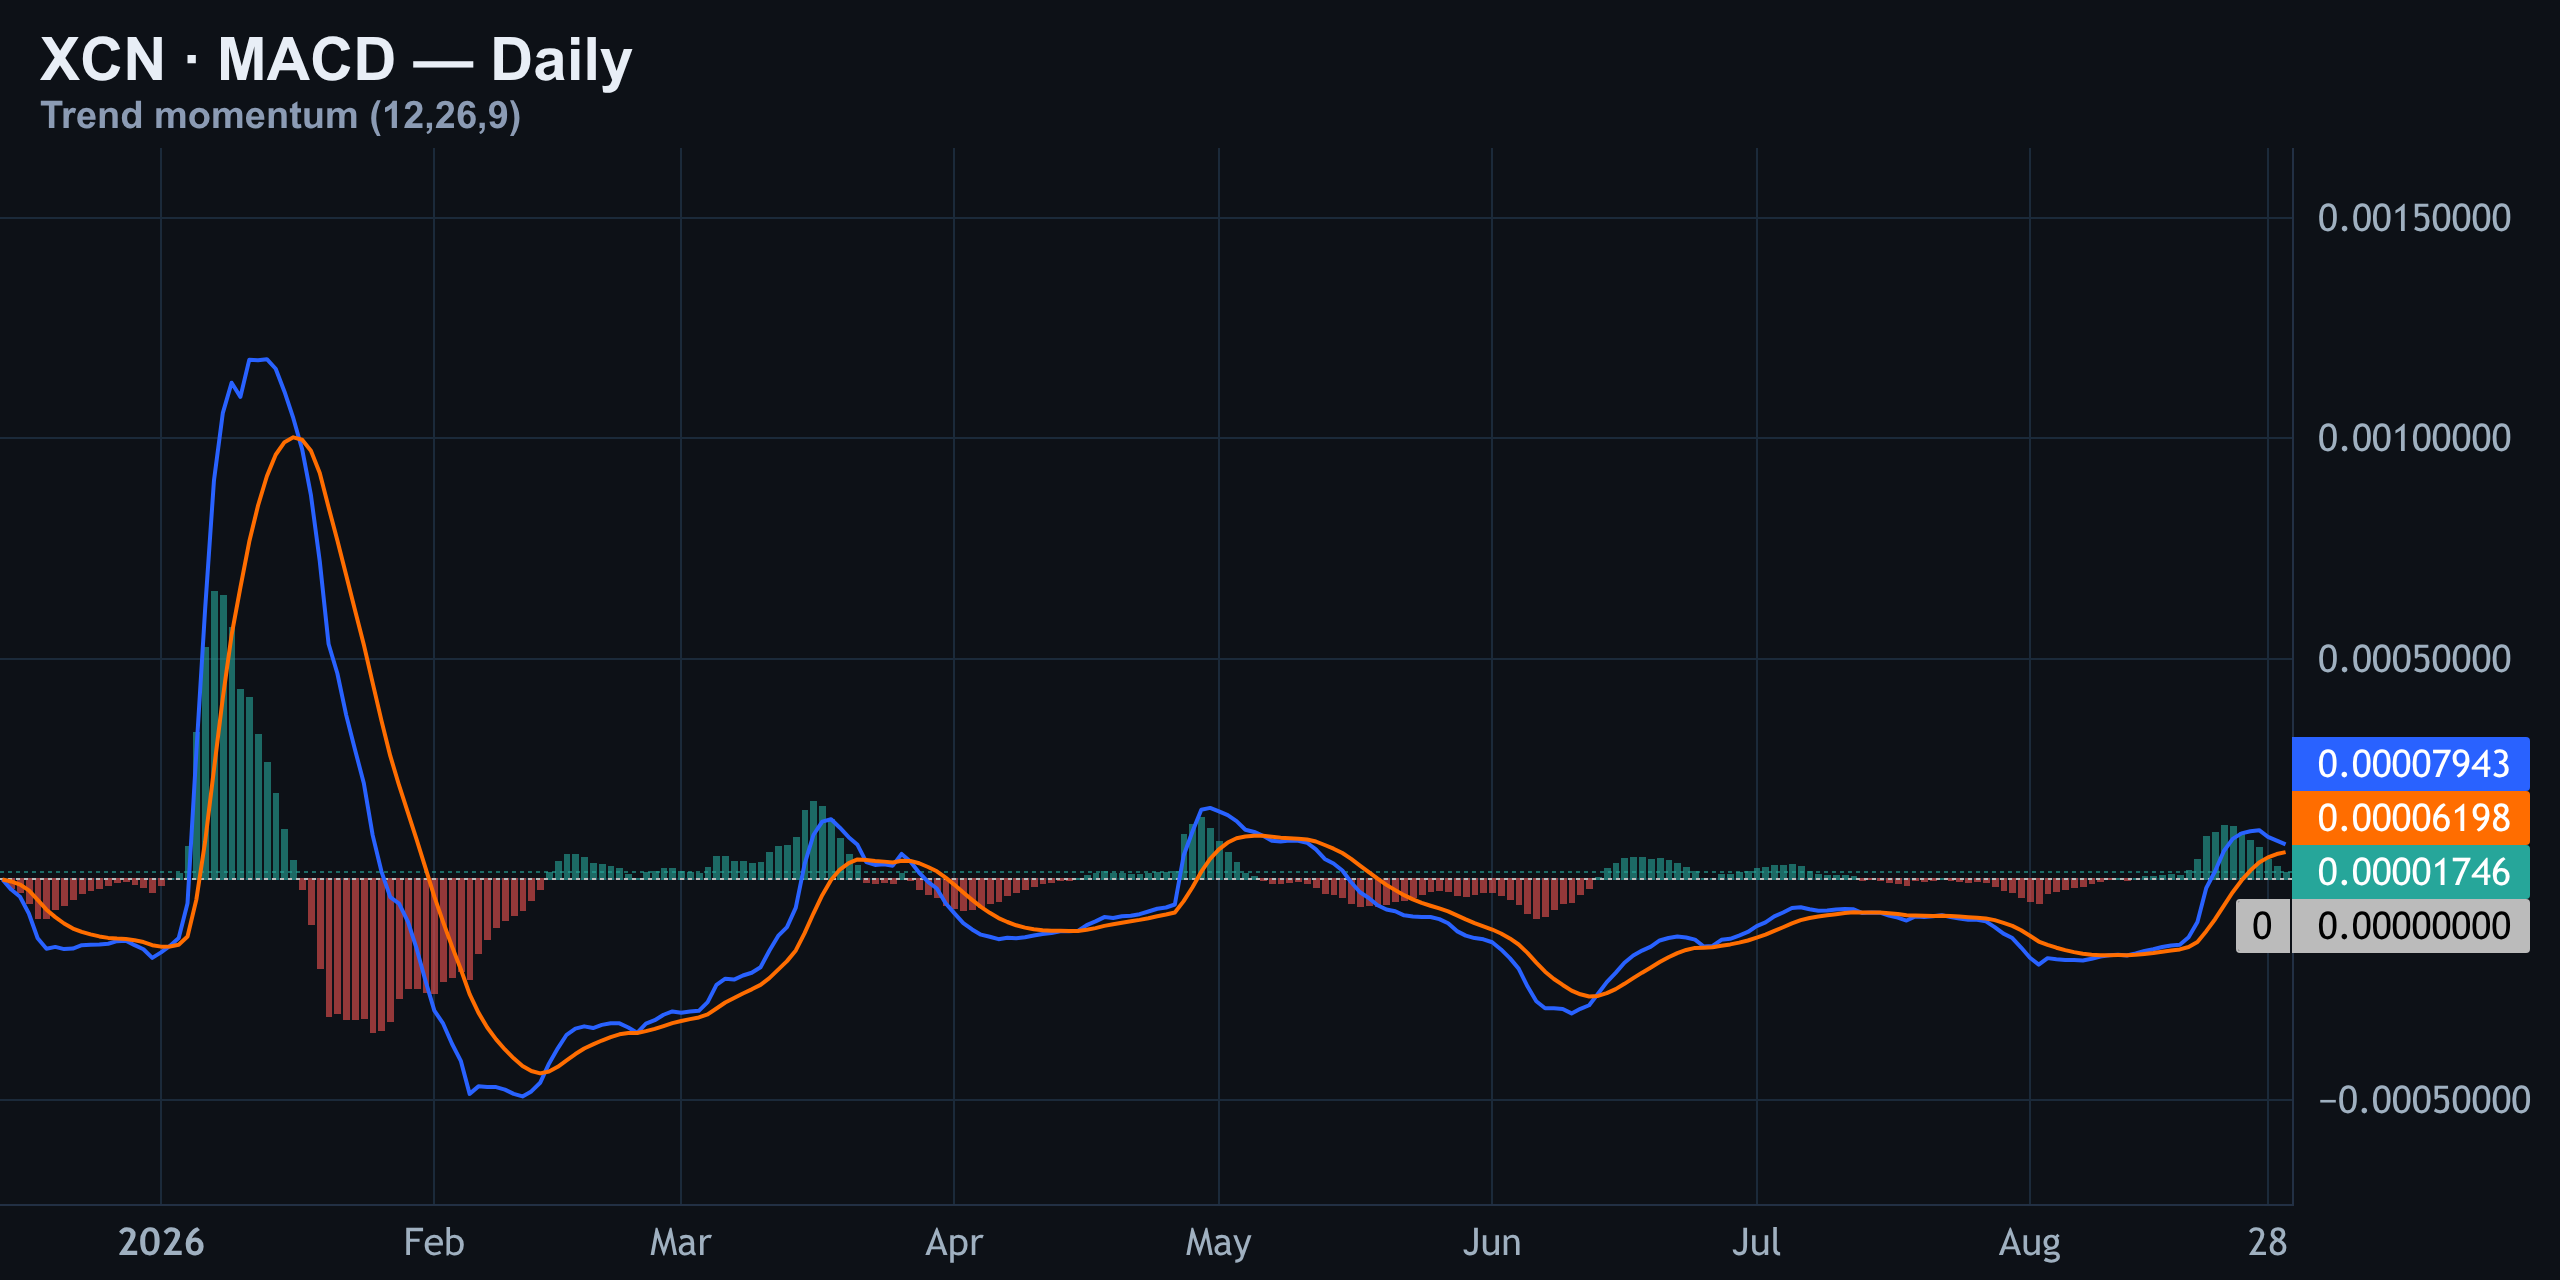
The limitation is that MACD can turn positive inside a sideways range. It shows that momentum has improved; it does not prove that buyers control the complete trend. The central message from both indicators is therefore consistent: conditions are becoming less bearish, but price still needs to do the final work.
XCN Levels and Liquidity Zones to Watch
With spot near $0.0034465, the most important technical level is the $0.003517 bias-flip area. A sustained move above it would shift the immediate read from neutral toward cautiously bullish. The next overhead liquidity zone sits near $0.003599, followed by resistance around $0.003955.
| Zone | Price | Why it matters |
|---|---|---|
| Current reference | $0.0034465 | Spot area and range midpoint |
| Bias flip | $0.003517 | Reclaim could improve short-term direction |
| Upper liquidation zone | $0.003599 | Densest single zone above spot |
| Higher resistance | $0.003955 | Next upside reaction area |
| Lower support | $0.003021 | Important downside reference |
| Lower support | $0.002977 | Liquidity below spot |
| Recent comparison low | $0.002912 | Prior RSI-divergence reference |
| Major recent low | $0.002863 | Recent channel-floor defence |
| Larger resistance | $0.005500 | Upper daily-channel reference |
The liquidation history adds an important layer to this map. Above spot, the strongest marked flush zone is $0.003599, associated with approximately $3,000 in liquidation history. The $0.003955 area carries approximately $1,000. Below spot, the $0.002977 and $0.003021 zones each carry approximately $2,000, while the $0.002888 zone is marked with no material liquidation amount in the current read.
| Liquidity area | Approximate liquidation history |
|---|---|
| $0.003599 | $3,000 |
| $0.003955 | $1,000 |
| $0.002977 | $2,000 |
| $0.003021 | $2,000 |
| $0.002888 | $0 |
These zones should be treated as areas of potential volatility, not guaranteed targets. A move into a liquidation pocket can accelerate briefly and then reverse if the underlying structure remains weak. The most likely trap around spot is a push above $0.003517 that reaches the $0.003599 liquidity area without producing a sustained breakout.
Desk Call: No Clean 1:2.5 Trade Today
There is no qualified trade plan today because the chart does not offer a clean 1:2.5 risk-to-reward profile. Buying directly into the current range would place the entry close to overhead resistance and liquidation liquidity. Shorting immediately would mean selling after a rebound while RSI divergence and positive MACD warn that downside momentum is weakening.
A disciplined trader needs more than a directional opinion. The entry must be located far enough from invalidation, the stop must sit beyond meaningful structure and the target must leave room for the expected volatility. XCN currently offers neither a clean breakout entry nor a clean rejection entry. The market is too compressed for a high-quality decision and too conflicted for aggressive positioning.
- Bullish confirmation would require a sustained reclaim above $0.003517, followed by acceptance above nearby resistance.
- Bearish confirmation would require a loss of the lower support cluster and renewed failure of the rebound structure.
- A wick through either side of the range is not enough; wait for confirmation and, ideally, a retest.
- If neither condition appears, standing aside is the correct position.
The level that can wake up the market is $0.003517. Above it, attention shifts to $0.003599 and then $0.003955. Below spot, the $0.003021 to $0.002977 area becomes increasingly important, with the recent floor near $0.002863 acting as the major structural reference. Until one of those paths activates with confirmation, the best risk management decision is patience.
XCN Outlook Summary for August 30, 2026
XCN is attempting to stabilise after defending the lower part of its daily channel. The bullish RSI divergence and positive MACD show that selling pressure has eased, while the rebound from approximately $0.002863 confirms that buyers are willing to defend lower prices. Those are meaningful improvements.
But the larger structure remains unfinished. The 4-hour chart still shows lower highs, the 15-minute chart is compressing after rejection and price remains below the key bias-flip level. Momentum is trying to turn; structure has not confirmed it. That distinction keeps the current stance neutral rather than bullish.
For now, the plan is simple: watch the reaction around $0.003517, monitor the liquidity near $0.003599 and respect the support cluster below spot. A confirmed reclaim can improve the setup. A breakdown through support can restore the bearish channel narrative. Until either event occurs, Finance With FM is standing aside.
More on Onyx: elliott wave
Analysis and education, not investment advice. See our editorial policy.