Daily market analysis
Onyx (XCN) elliott wave
Last updated
XCN Breaks $0.002897: Fresh Leg Down or Final Flush?
Invalidation Broken, Bias Turns Bearish
Yesterday we drew exactly one line in the sand for XCN: $0.002897. Overnight, price sliced right through it. As of writing, XCN trades in the $0.00287–$0.00288 zone, down roughly 1–1.5% on the day, with CoinMarketCap pegging it near $0.002876 and CoinGecko showing $0.00287. Kraken's feed has it slightly higher around $0.0029, which tells you this is a market chopping right on top of a decision zone, not one making a clean directional statement — yet.
That break matters because it kills the bullish expanded-flat-reversal case we had sitting at roughly 50% confidence yesterday. Price fell about 0.9% from roughly $0.0029060 down to $0.0028804, and in doing so it carved a fresh low below the old invalidation instead of tapping any of yesterday's upside targets.
So the question on the table: is this the final flush before a bottom, or the opening move of a fresh leg down? Let's walk it timeframe by timeframe.
4H — The Higher-Degree Bias
Zoom out to the four-hour chart and the skeleton looks like this: a high near $0.0041120, a swing low at $0.0029650, a bounce to $0.003860, and then a slide down to $0.0028630. Label it 1-2-3-4-5-A-B-C and the auto-count on most platforms wants to call this a clean impulse into wave three. The math says otherwise.
- Wave two retraced 93% of wave one — an unusually deep, weak-structure two for a genuine impulse.
- Wave four dropped all the way back into wave one's price territory — a hard rule violation for any valid impulse.
- The B-leg ran 1.75x the A-leg, and the C-leg stretched to 2.13x the A-leg — any B-wave beyond roughly 1.2x A pushes the structure into expanded-flat or irregular territory.
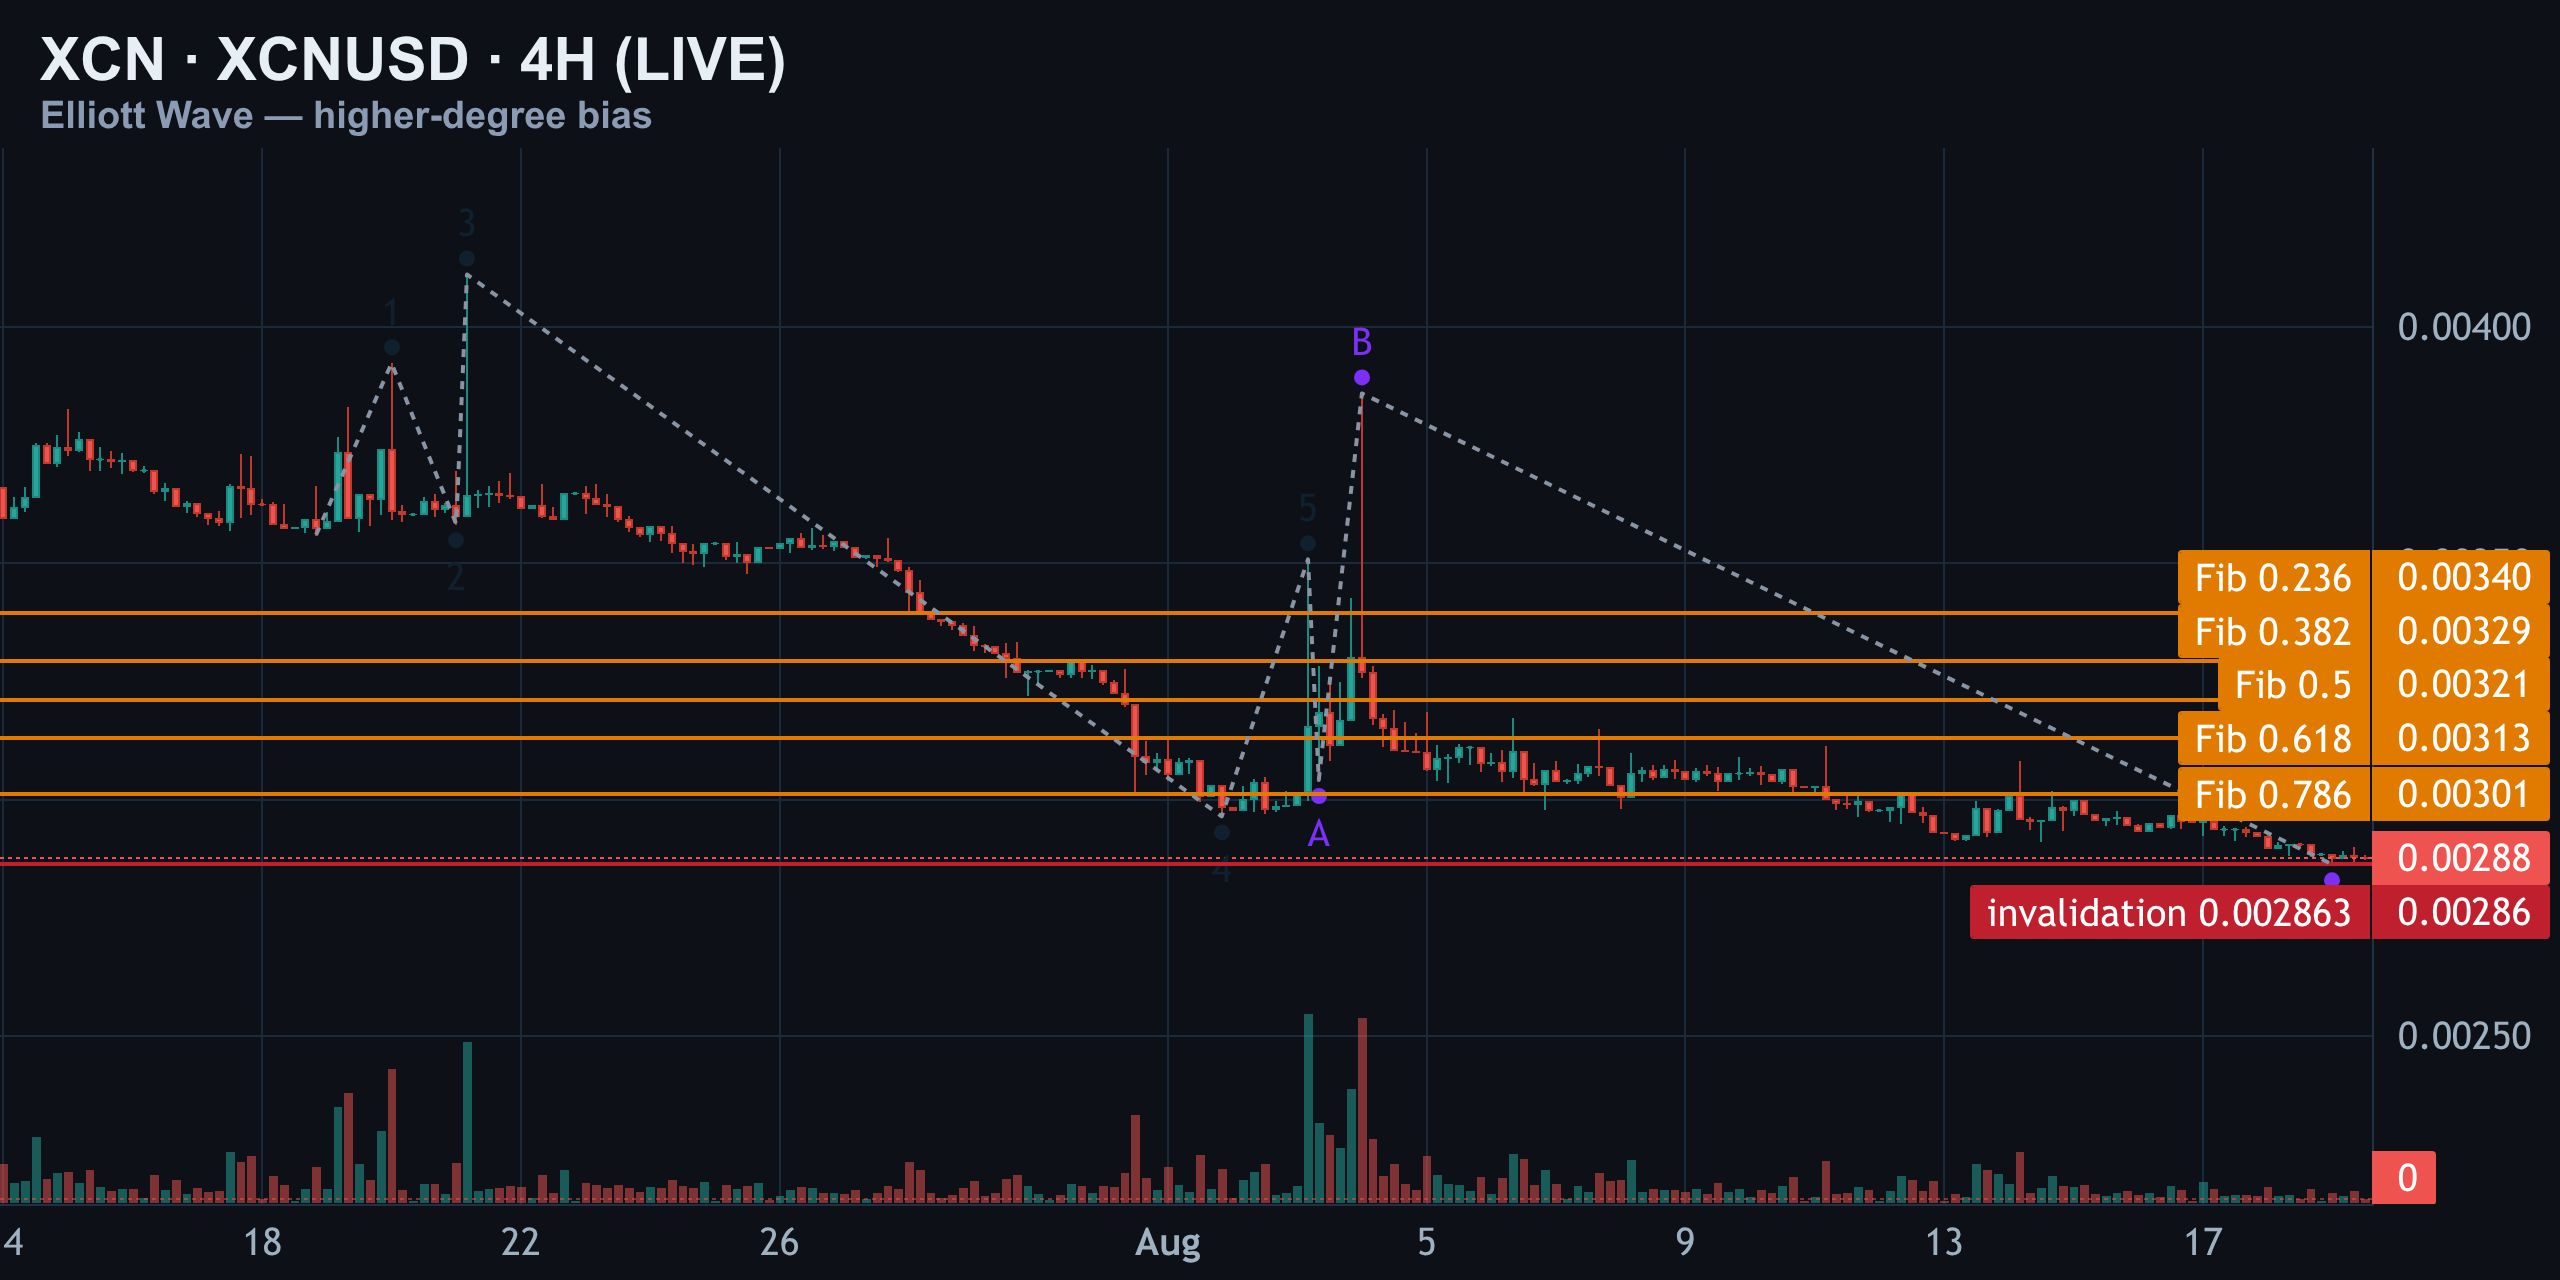
Put together, this isn't five clean waves down — it's a corrective sequence, most likely part of a larger flat or a WXY combination. That reframes the entire move: the big trend lower looks corrective, not impulsive, which is actually the more constructive read for bulls once the floor holds.
| Fib Level | Price |
|---|---|
| 0.786 | $0.003010 |
| 0.618 | $0.003130 |
| 0.500 | $0.003215 |
| 0.382 | $0.003290 |
That grid, built off the $0.0028630 low up to the $0.003560 swing high, gives us the bounce targets if this turns. None of it matters, though, until price proves it wants to hold above the floor.
1H — Primary Count vs the Alternates
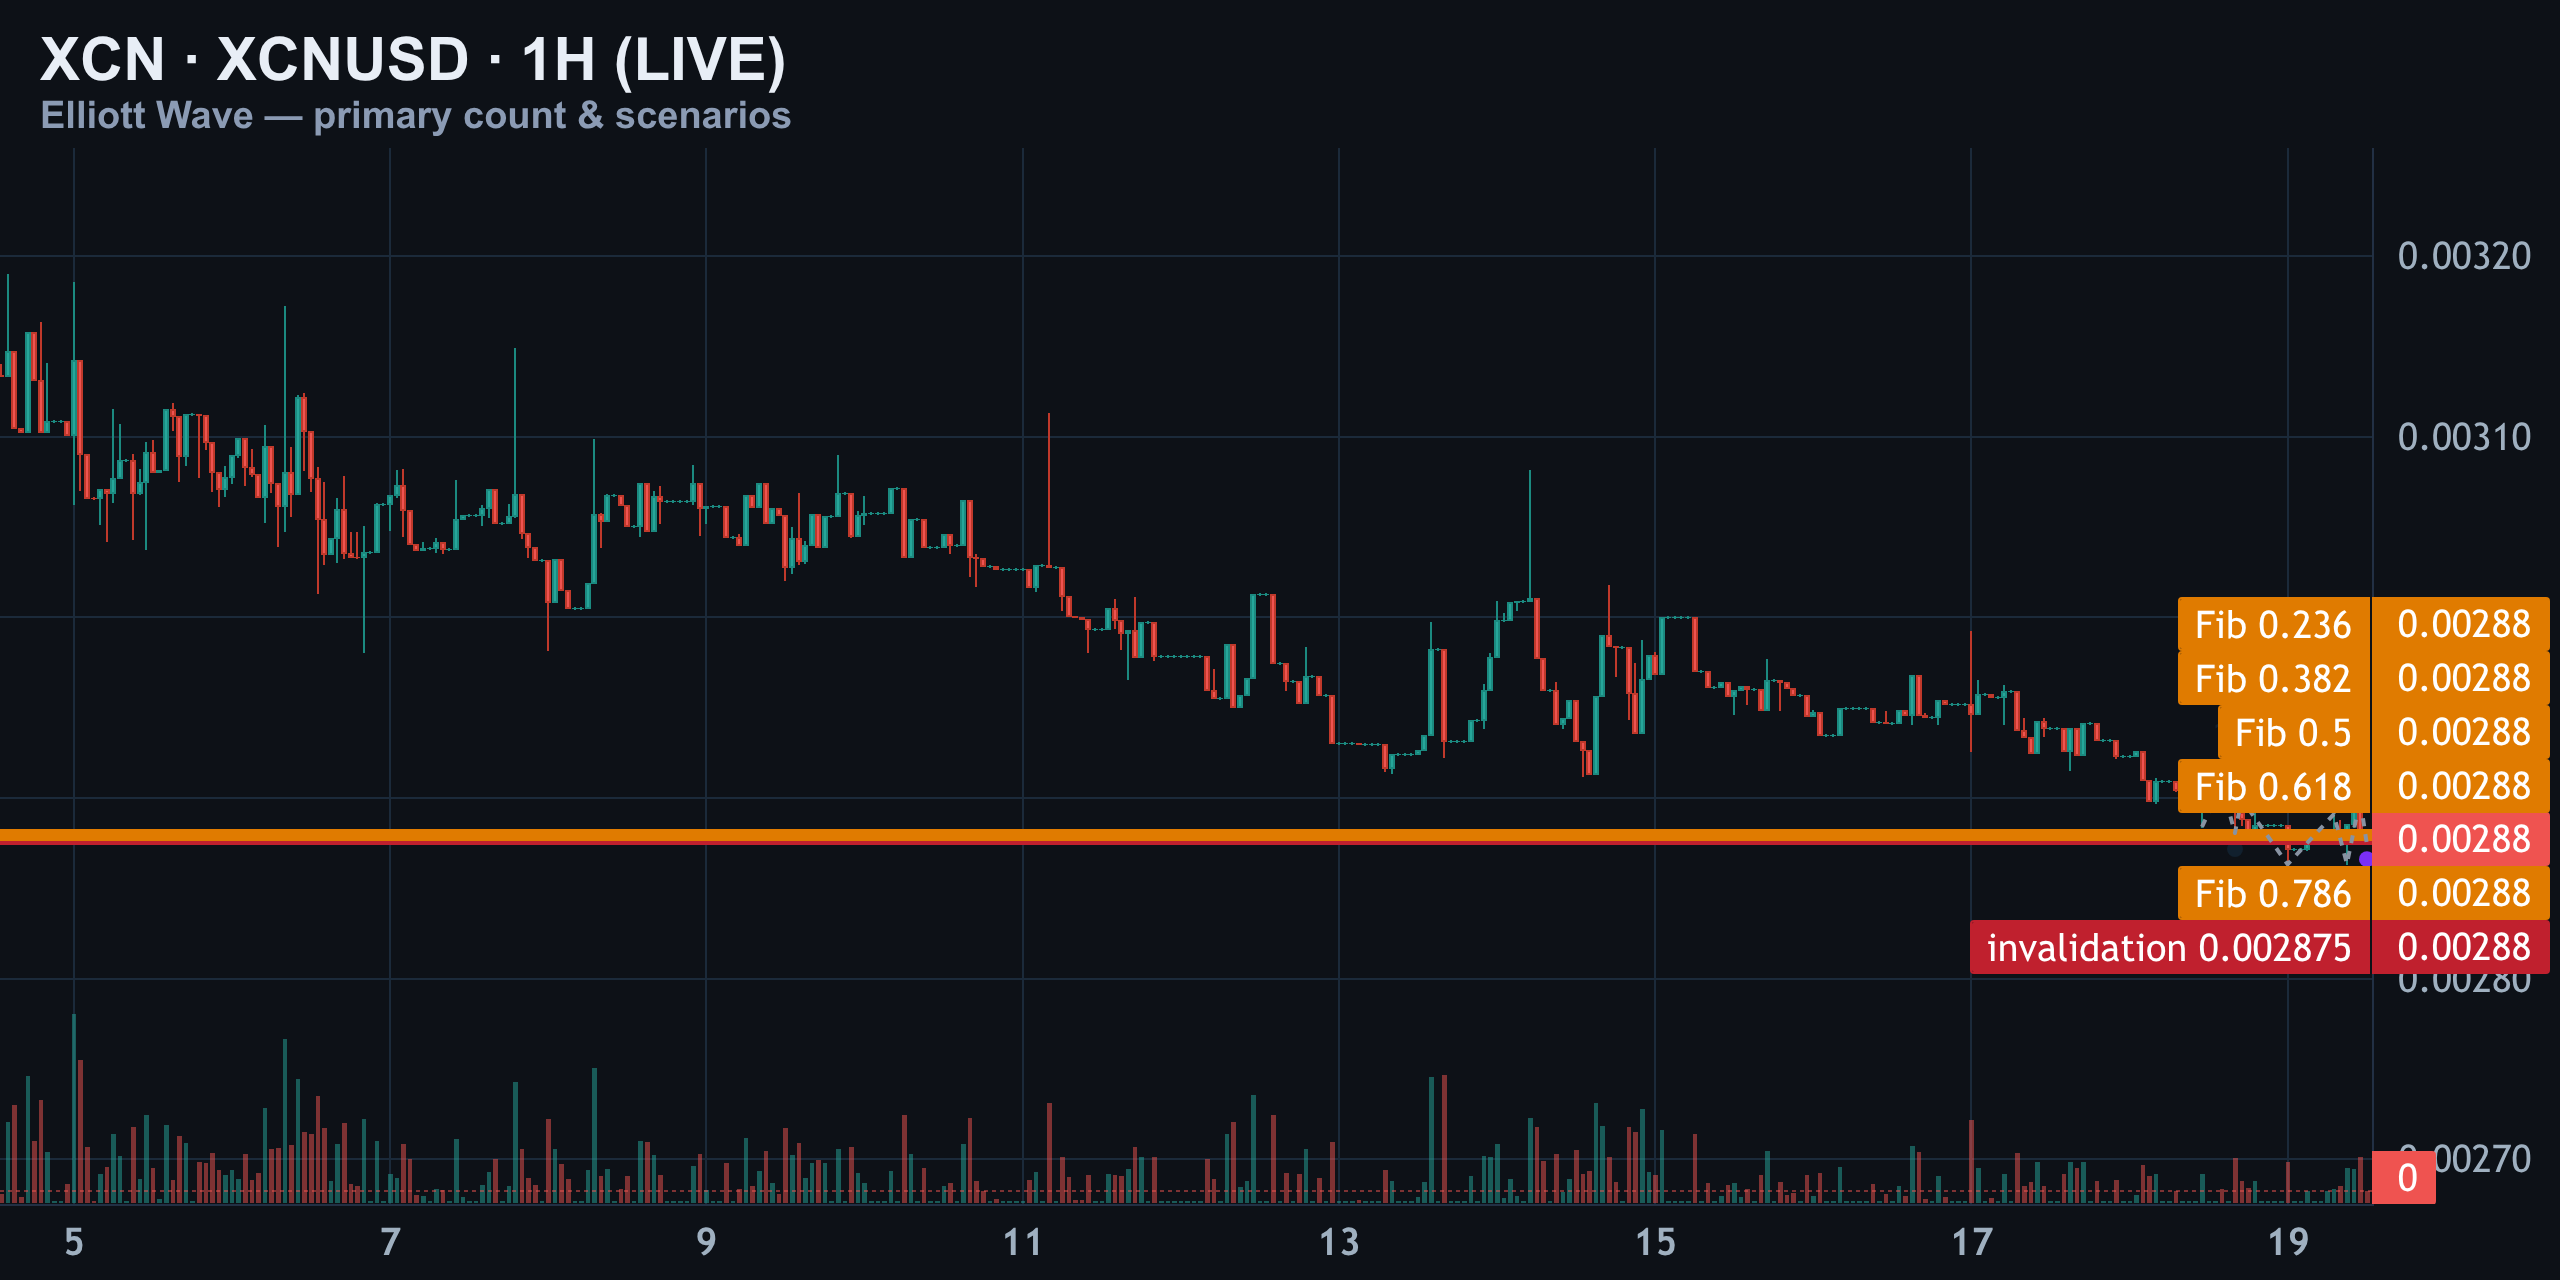
On the one-hour chart, the auto-labels hand us wave one at $0.0029070, wave two at $0.0028810, wave three at $0.0028990, wave four at $0.0028630, and wave five at $0.0028910.
| Wave | Price |
|---|---|
| 1 | $0.0029070 |
| 2 | $0.0028810 |
| 3 | $0.0028990 |
| 4 | $0.0028630 |
| 5 | $0.0028910 |
Two problems immediately disqualify this as a real impulse: wave two retraced more than 100% of wave one, and wave three is the shortest leg rather than the longest — both hard Elliott Wave violations. So what we're actually looking at is a corrective slide, most likely wave C of the bigger four-hour flat, grinding toward that $0.002863 floor.
Alternate #1 — Expanded Flat Already Complete
If price reclaims and holds above $0.0028990 — the old B-wave pivot — the corrective count relabels as a completed expanded flat right here, and the bounce targets from the four-hour Fib grid, up toward $0.003010 and beyond, come back into play.
Alternate #2 — Ending Diagonal
Because wave four keeps overlapping wave one across every degree we've checked, there's a real chance the whole structure is a diagonal grinding out its final leg. The tell here is behavioral, not just structural: watch for a sharp spike below $0.002863 that snaps back hard within the same candle. That kind of rejection wick is the fingerprint of a diagonal's terminal thrust, not a fresh trend leg.
| Scenario | Trigger | Bias |
|---|---|---|
| Primary — Corrective C | Grinds down toward $0.002863 | Bearish, more downside first |
| Alt 1 — Flat complete | Reclaim & hold above $0.0028990 | Bullish reversal |
| Alt 2 — Ending diagonal | Fast spike below $0.002863, snap-back same candle | Bullish, sharp V-reversal |
15M — Timing the Entry
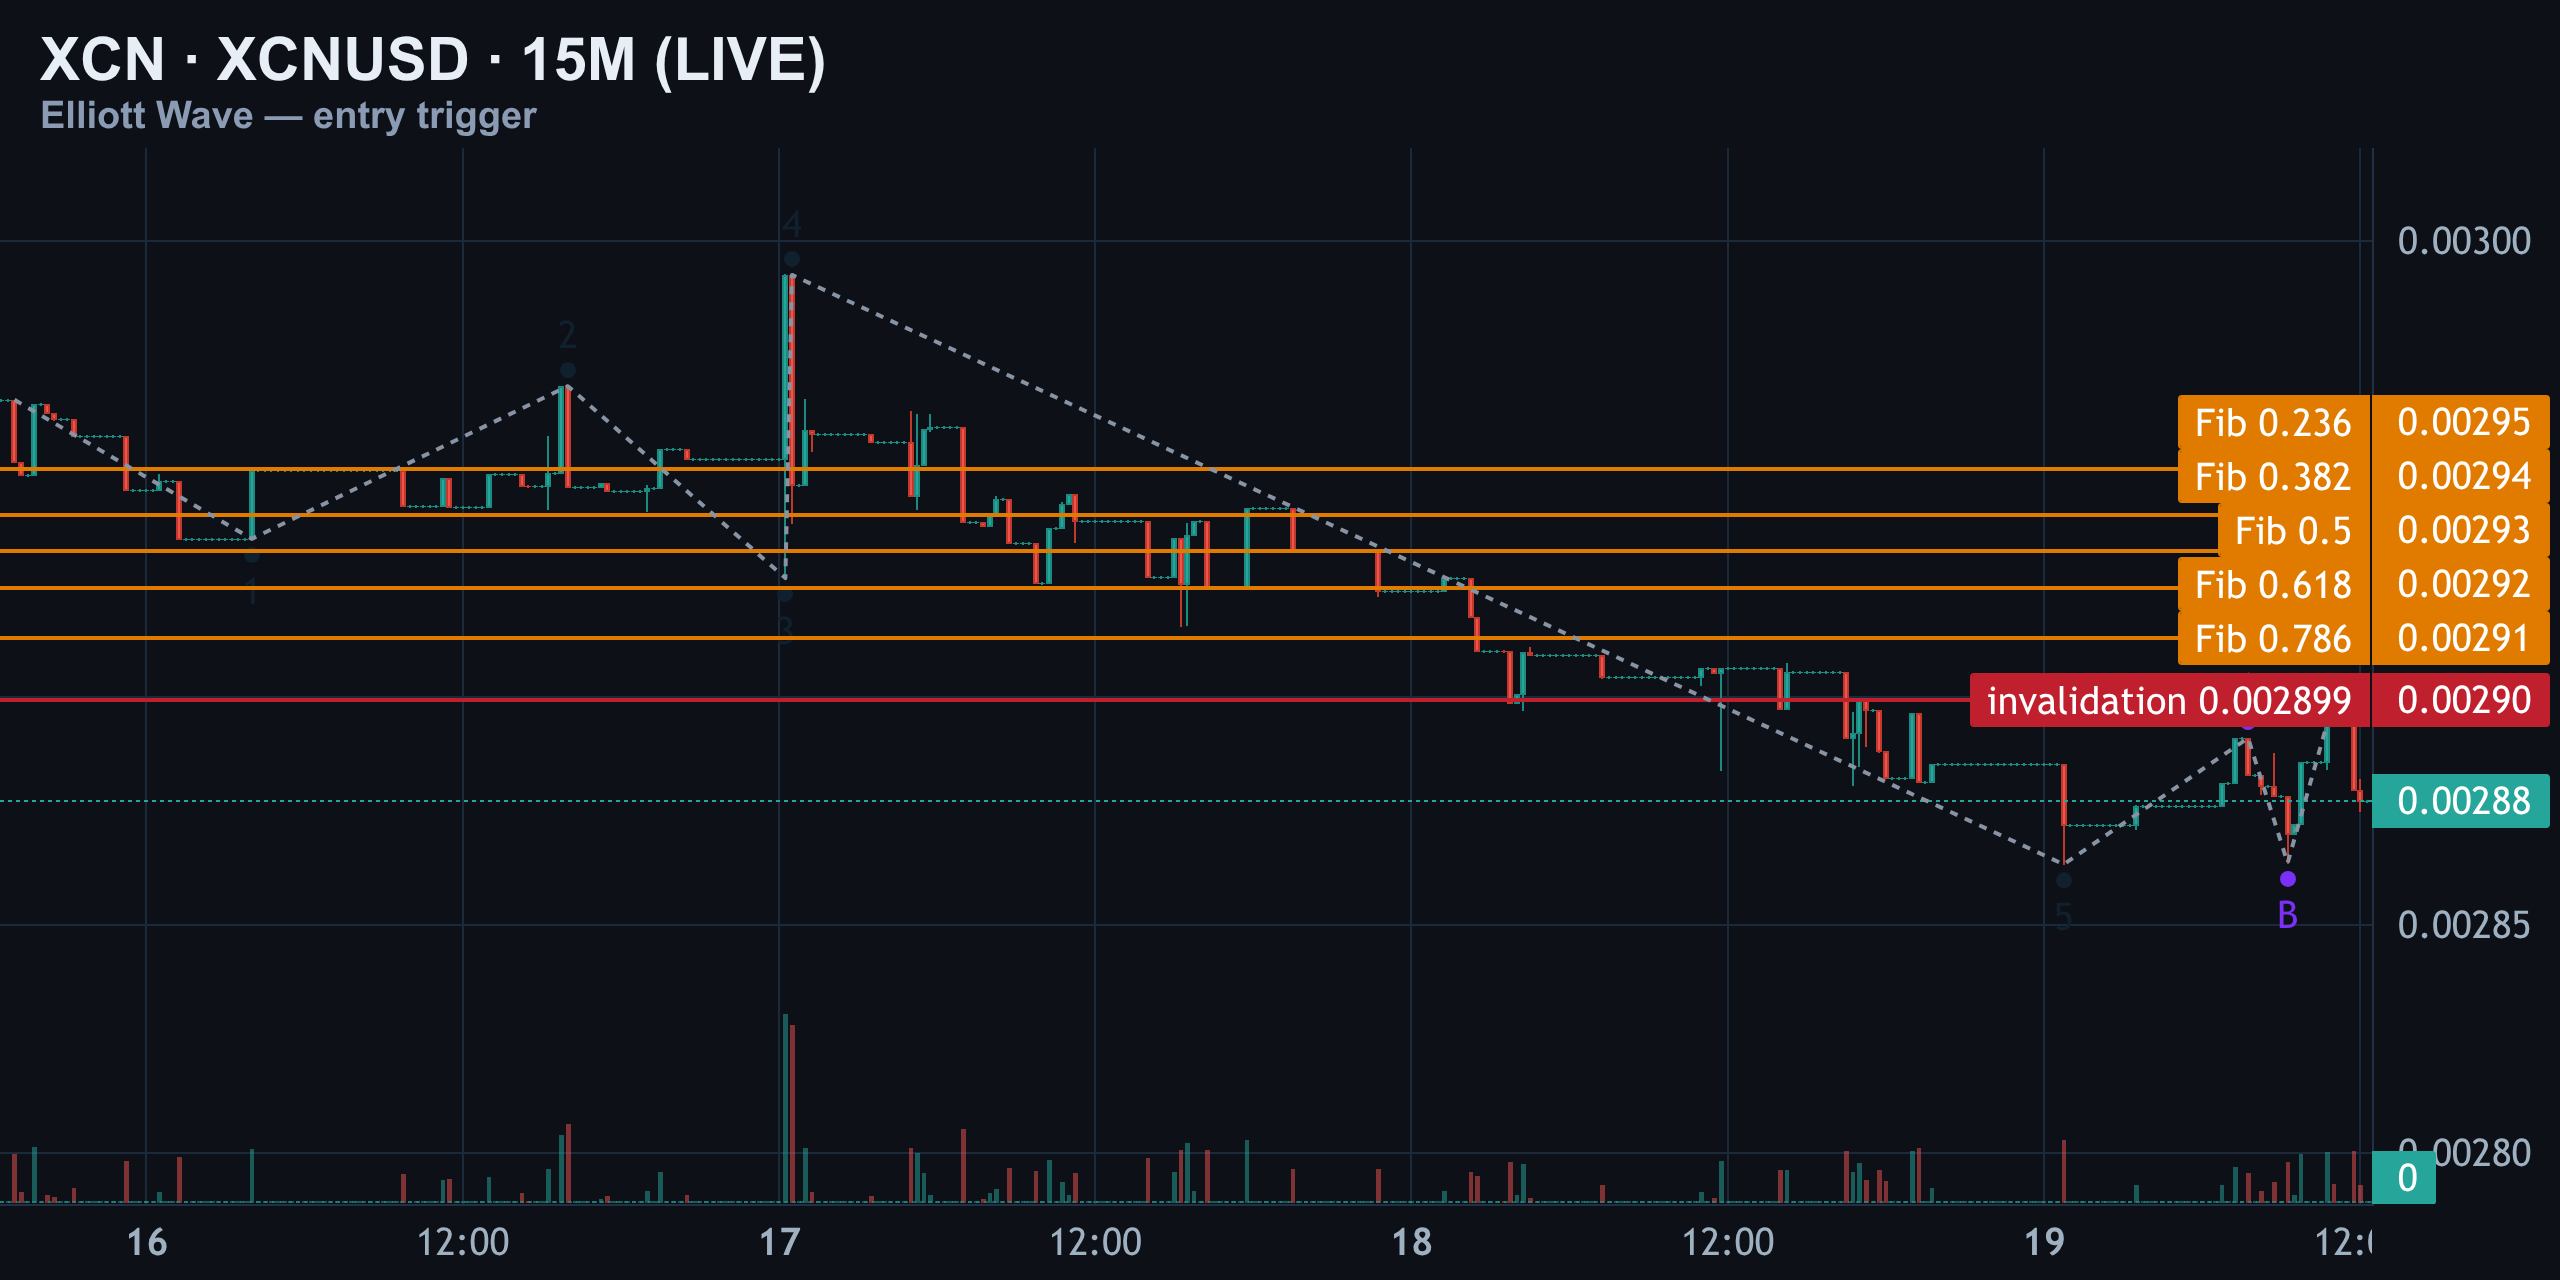
This is the chart for execution, not conviction. The fifteen-minute pivots run wave one at $0.0029350, wave two at $0.0029680, wave three at $0.0029260, wave four at $0.0029930, and wave five down at $0.0028630 — followed by an A-B-C bounce into $0.0028990.
| Pivot | Price |
|---|---|
| Wave 1 | $0.0029350 |
| Wave 2 | $0.0029680 |
| Wave 3 | $0.0029260 |
| Wave 4 | $0.0029930 |
| Wave 5 | $0.0028630 |
| A-B-C bounce | $0.0028990 |
Same story as the bigger timeframes: wave two retraced over 100% of wave one, and wave four overlaps wave one's range, so this isn't a valid impulse either — it's corrective chop inside a downtrend.
| Fib Level | Price |
|---|---|
| 0.618 | $0.002920 |
| 0.786 | $0.002910 |
That grid is built off the $0.0028990 to $0.0029650 swing, and the pocket between $0.002910 and $0.002930 is where sellers have shown up before — it's the zone to watch for a rejection wick if you're timing a short entry.
The Scenarios, Ranked
Stripping out the jargon, here's the decision tree in plain English, ranked by how the structure currently leans.
| Rank | Scenario | What Confirms It | What It Means |
|---|---|---|---|
| 1 | Corrective wave C continues lower | Price grinds down toward $0.002863 without a sharp reversal | More downside pressure before any real bottom |
| 2 | Ending diagonal terminal thrust | Fast wick below $0.002863 with an immediate snap-back | Sharp, tradeable bounce off a marginal new low |
| 3 | Expanded flat already complete | Reclaim and hold above $0.0028990–$0.00290 | Bounce targets toward $0.003010–$0.003290 open up |
Notice none of these scenarios require price to fall apart into a fresh downtrend impulse — the structure itself argues this is corrective at the largest degree we can see. That's the quiet bullish undertone beneath an otherwise bearish-looking chart.
Structure vs Positioning — Do They Agree?
Price action and market data are telling a consistent, if unglamorous, story right now. Trading volume sits in the $1.7–$3 million range over the past 24 hours depending on the venue tracked, which is thin enough that a single wave of coordinated selling or buying can swing the pair a full percent or more inside an hour — exactly the kind of noisy chop the 1H and 15M charts are showing.
Coinbase's feed shows XCN around $0.002873, sandwiched almost exactly between the CoinMarketCap and Kraken reads — a market genuinely undecided at this level, not one with a clear directional consensus. That lines up with the wave count: we're sitting inside a corrective structure where the next real signal is a break, not a drift.
In short, on-chart structure and real-time pricing agree on one thing — this is a decision zone, not a trend. The next candle to close decisively above $0.00290 or below $0.002863 is the one that actually matters.
Levels to Watch
Everything above compresses into a short list. Bookmark it.
| Level | Price | Why It Matters |
|---|---|---|
| Hard floor | $0.002863 | Below this, the corrective count breaks and a fresh bearish impulse becomes the live primary |
| 15M invalidation | $0.0028990 | First crack in the bearish case if reclaimed and held |
| 1H reclaim trigger | ≈ $0.00290 | Flips bias bullish; reopens the flat-complete alternate |
| Sell pocket (short entry zone) | $0.002910–$0.002930 | Where sellers have repeatedly capped bounces on the 15M |
| First bounce target | $0.003010 | 0.786 retracement off the $0.0028630 low |
| Second bounce target | $0.003130 | 0.618 retracement |
| Stretch bounce target | $0.003290 | 0.382 retracement |
Setup Per the Count (Not Advice)
This is a structural map, not a trade recommendation — always size for the invalidation, not the target.
- Primary bias: lean short on rallies into the $0.002910–$0.002930 pocket, with a stop on a confirmed reclaim above $0.0028990.
- Watch for a fast wick below $0.002863 that snaps back within the same candle — that's the diagonal alternate firing, and it argues for covering shorts fast rather than chasing new lows.
- A daily close above $0.00290 is the cleanest bullish confirmation; it reopens the $0.003010–$0.003290 target zone.
- A break and close below $0.002863 without a snap-back invalidates the corrective read entirely and opens room for a fresh impulsive leg lower.
Where Every Coin Sits in Its Count
XCN isn't trading in a vacuum. Its current chop near $0.00287–$0.00290 sits well below its 2024–2025 highs and reflects the same low-liquidity grind that's hitting a wide swath of mid-cap alts this cycle. What separates XCN right now is the clean, three-timeframe agreement on structure: 4H, 1H and 15M all independently fail impulse rules at the same points (deep wave twos, overlapping wave fours), which is a stronger signal than any single chart taken alone.
For traders tracking XCN alongside other majors and alts, the takeaway is simple: this is a market waiting on one number. Until $0.002863 breaks decisively or $0.00290 reclaims and holds, every bounce and every dip inside that range is noise, not signal.
Summary
XCN broke yesterday's line at $0.002897 overnight, invalidating the bullish flat-reversal case and promoting the Y-leg-extension-lower alternate into today's primary. But the deeper structural read — deep wave twos, overlapping wave fours, oversized B and C legs — argues the entire decline off the $0.0041120 high is corrective, not impulsive. That keeps the door open for a bottom, just not yet.
The one number that decides it all: $0.002863. Hold it, and the bounce targets at $0.003010, $0.003130 and $0.003290 come into play. Lose it without a sharp snap-back, and XCN opens the door to a fresh leg lower at this degree.
Previous days
08/18/2026 — XCN Price: 0.002897 Is the Line — Flat Reversal or Y-Wave?
XCN Price: 0.002897 Is the Line — Flat Reversal or Y-Wave?
The Floor Broke — Now What?
Yesterday's invalidation on XCN sat at 0.002912. It didn't hold. Price sliced through it and printed a fresh low near 0.0029063, pulling the pair down roughly 0.6% on the session. As of this writing, XCN trades around $0.0029, with 24-hour volume near $2.7 million — thin enough that a single wave of selling can move the tape (CoinGecko).
That's an honest miss on the exact number, but it doesn't kill the corrective thesis — it refines it. The hard line has simply moved down to 0.002897, and every timeframe we track — the 4H, 1H and 15M — now agrees this is the level that decides everything. Hold it, and this is very likely the final leg of an expanded flat setting up for a reversal. Lose it on a clean close, and we're watching a Y-wave extend with no fib floor visible below.
XCN 4H — Higher-Degree Bias: Impulse Rules Broken
Zoom out to the 4-hour chart and the skeleton of this move reads: a high near 0.0041120, down to a low around 0.0029650, back up to a high near 0.0038600, and now a low at 0.0028970. Walking the auto pivots through a textbook five-wave lens immediately runs into trouble.
| Wave | Price | Note |
|---|---|---|
| Wave 1 high | 0.0039240 | Initial rally leg |
| Wave 2 low | 0.0035830 | 94% retrace — red flag |
| Wave 3 high | 0.0041120 | Extension |
| Wave 4 low | 0.0029650 | Overlaps Wave 1 — rule violation |
| A-wave low | 0.0030420 | Corrective leg down |
| B-wave high | 0.0038600 | 1.75x the A-wave |
| C-wave low | 0.0028970 | 2x+ the A-wave |
Two things disqualify a clean impulsive read here. First, wave two retraced 94% of wave one — a brutal, almost-full retrace that's already suspicious for a standard impulse. Second, and more decisive, wave four traded straight through wave-one territory. Under strict Elliott rules, a fourth wave can never overlap the first wave's price zone in a standard impulse. That overlap tells us this five-wave-looking rally off the June lows is more likely a leading diagonal, or simply internal noise inside a larger corrective structure.
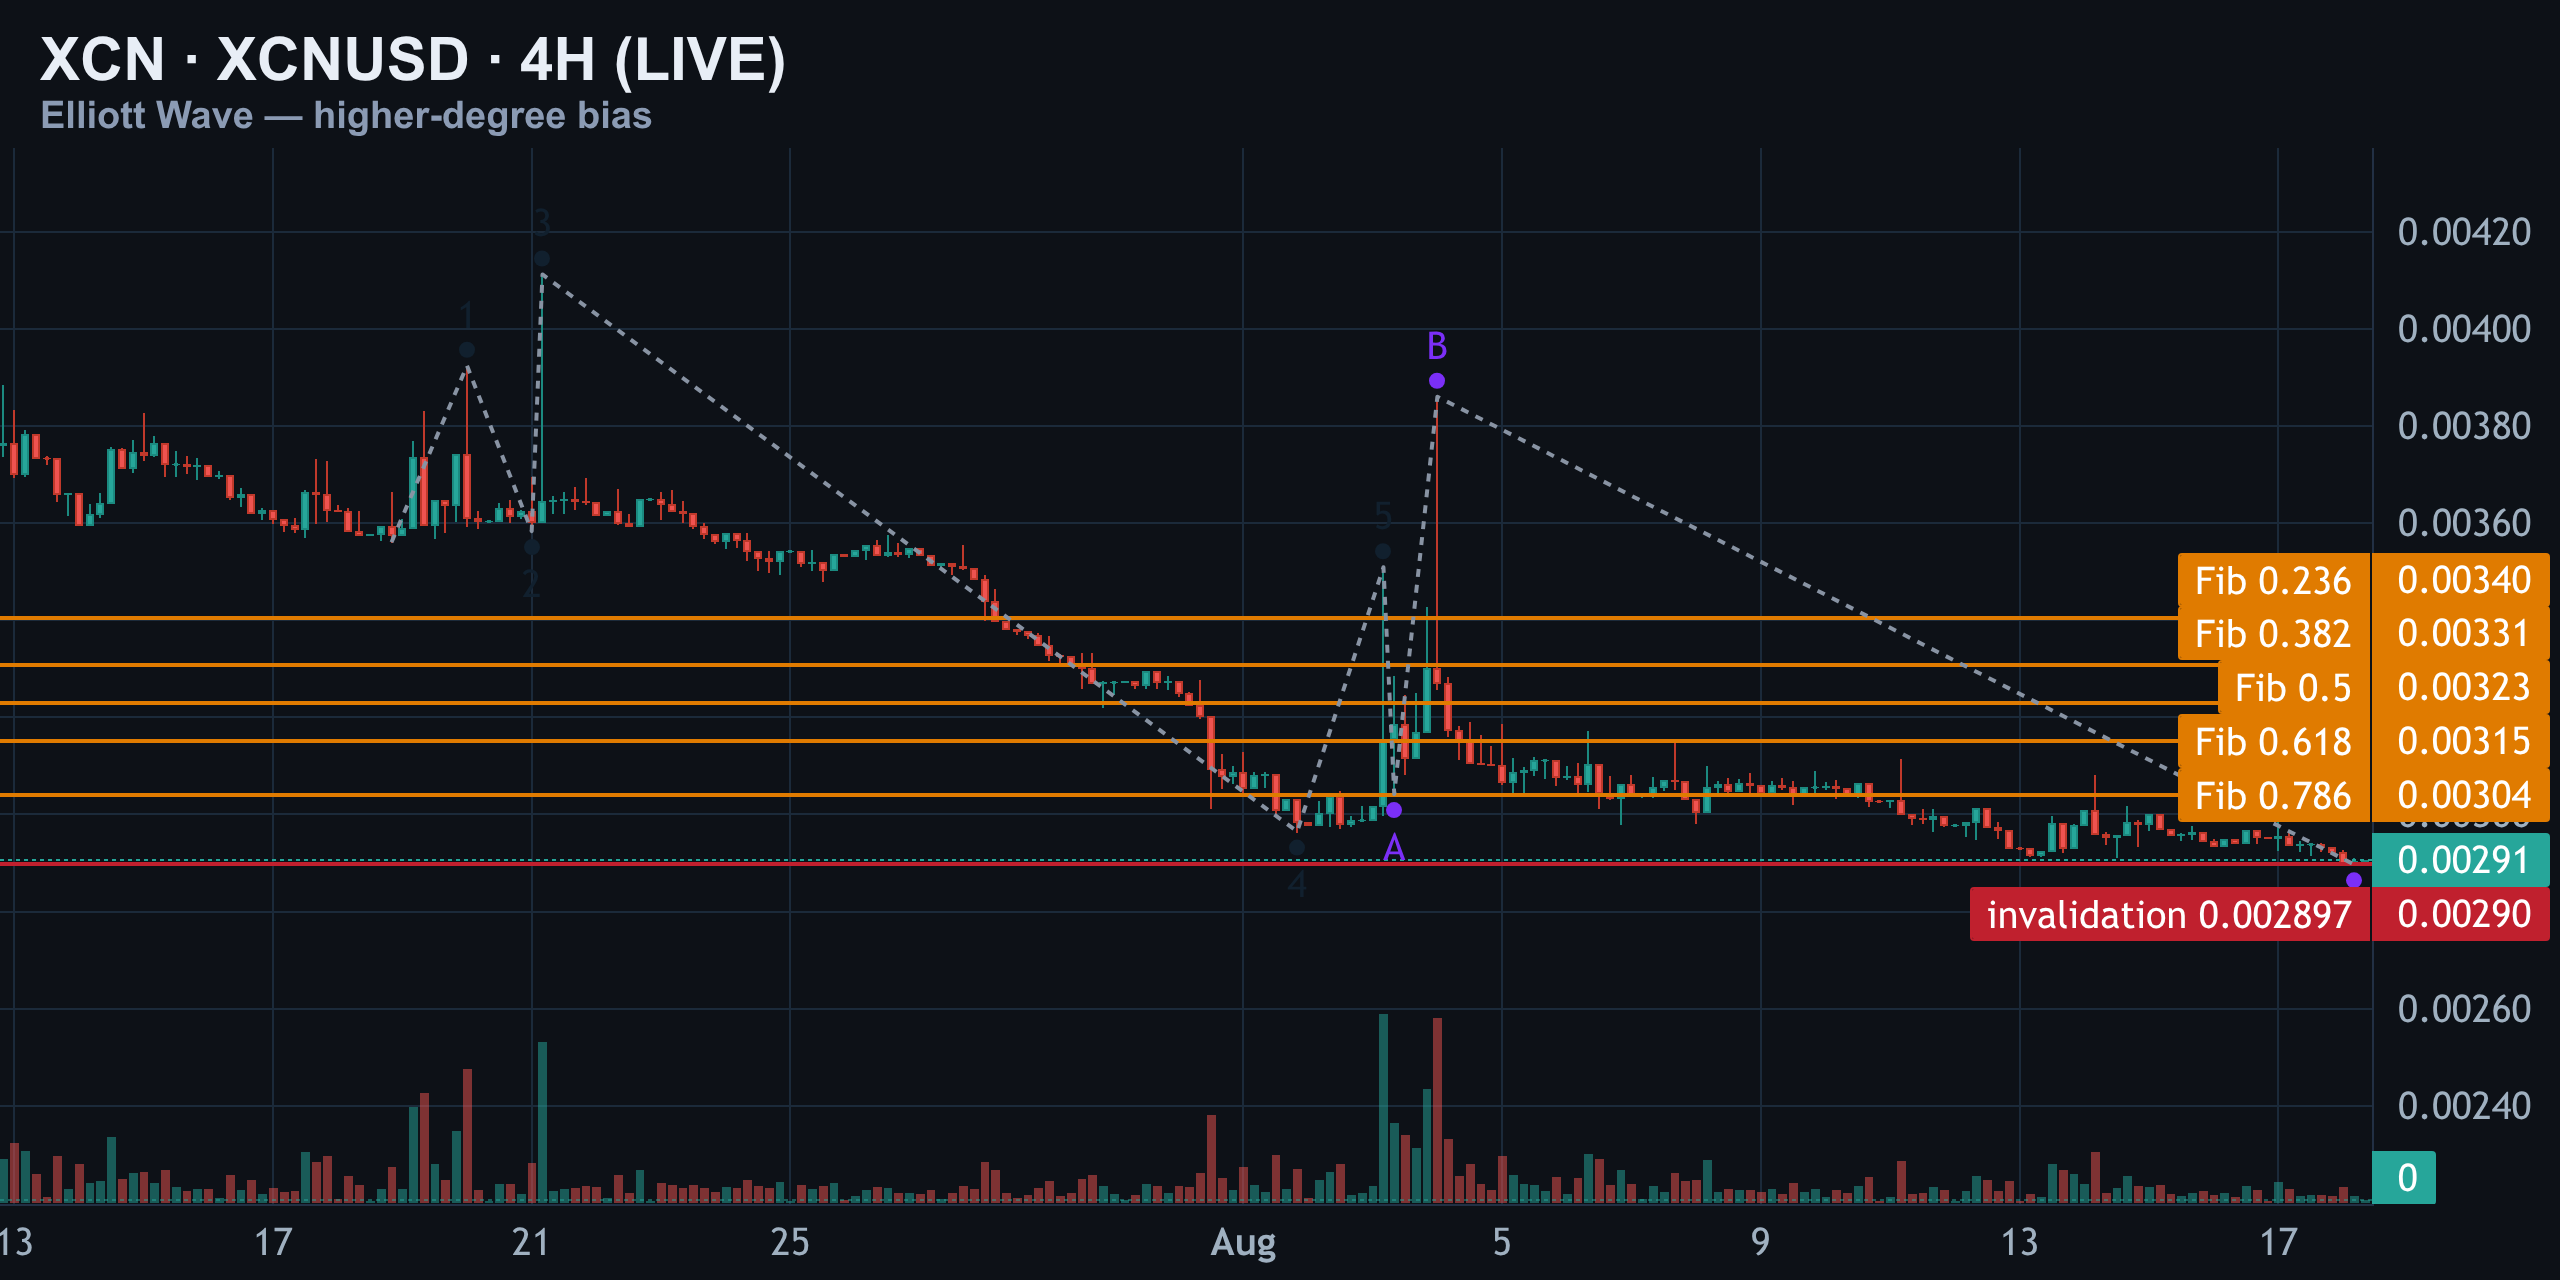
The A-B-C count fits far better. The B-wave bounce to 0.0038600 ran 1.75 times the A-wave — well past the 1.618 ceiling you'd expect in a normal zigzag. That's the signature of an expanded flat. The C-wave then dropped to 0.0028970, over two times the A-wave's length. The relevant fib swing runs from 0.0028970 up to 0.0035600, and that low is the hard invalidation for the entire higher-degree count.
XCN 1H — Primary Count vs Two Alternates
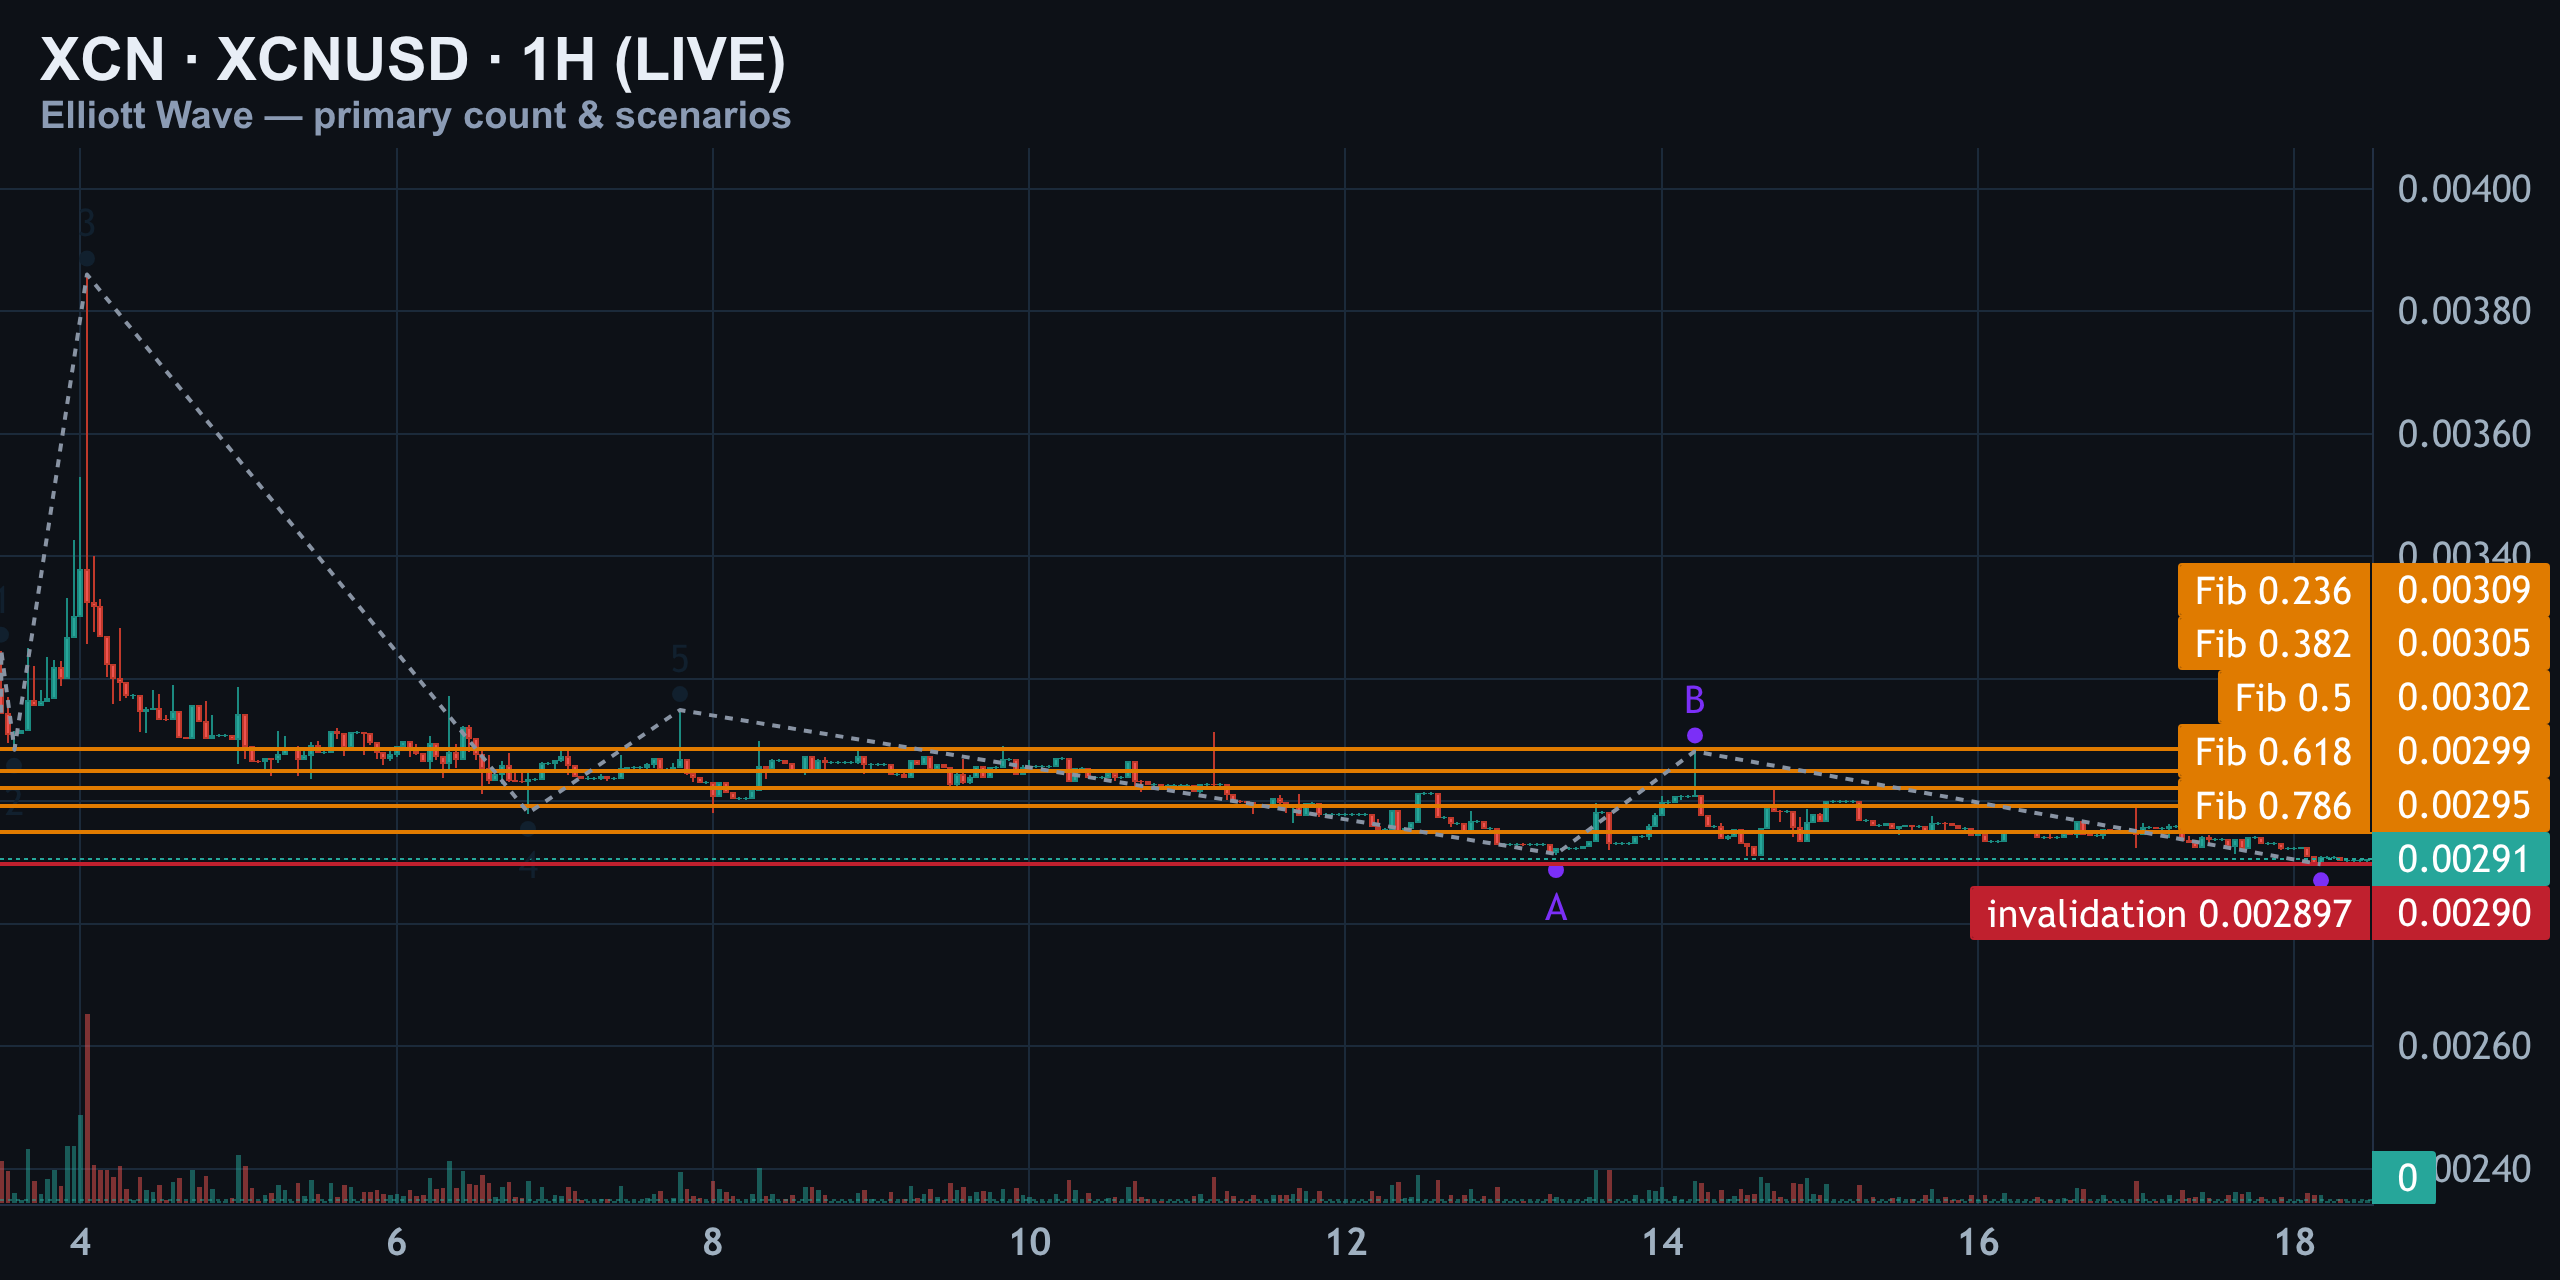
On the 1-hour, the impulse count falls apart even faster. Wave one topped at 0.0032460, then wave two crashed to 0.0030840 — a 160% retrace of wave one. Elliott's second rule states wave two can never fully retrace wave one. This label is dead the moment that number prints.
| Wave | Price | Issue |
|---|---|---|
| Wave 1 | 0.0032460 | Standard rally |
| Wave 2 | 0.0030840 | 160% retrace — rule violated |
| Wave 3 | 0.0038600 | 7.65x wave one — disproportionate |
| Wave 4 | 0.0029810 | Overlaps wave one again |
Wave three then spiked to 0.0038600 — 7.65 times the length of wave one, wildly disproportionate for a genuine third wave. Wave four dove to 0.0029810, landing right back in wave-one's price zone, another overlap violation. That's the impulse count wiped clean; this move is corrective.
The primary scenario treats the entire 1-hour move as the C-leg (or Y-leg) of a larger flat. Under that read: the A-wave bottoms at 0.0029140, the B-wave bounces to 0.0030820 — only 0.71 times A, a notably shallow retrace — and the C-wave completes at 0.0028970. A shallow B-wave is actually a healthy tell for a flat nearing its end, not extending further.
| Scenario | Read | Implication |
|---|---|---|
| Primary | Flat completes at 0.002897 | Shallow B-wave signals exhaustion; reversal setup |
| Alternate 1 | 0.002897 breaks on a close | Y-wave extends; no clear fib floor below |
| Alternate 2 | Sideways chop, .618–.786 band | Grind before real resolution, no immediate trend |
The 1-hour confirms the broader move is corrective in nature. The open question isn't structure — it's whether the bottom is already sitting on the tape.
XCN 15M — Entry Trigger Zone
The 15-minute chart is the timing tool, and it's even messier than the higher timeframes — which is exactly what you'd expect at the tail end of a correction. Wave one topped at 0.0030000, wave two dipped to 0.0029470, and wave three only reached 0.0029770 — smaller than wave one, which breaks the rule that wave three can never be the shortest wave in an impulse.
| Wave | Price | Note |
|---|---|---|
| Wave 1 | 0.0030000 | |
| Wave 2 | 0.0029470 | |
| Wave 3 | 0.0029770 | Shorter than Wave 1 — rule violated |
| Wave 4 | 0.0029350 | Overlaps Wave 1 again |
| Wave 5 | 0.0029680 | Undersized finish |
Wave four then dipped to 0.0029350, overlapping wave one once more, and wave five limped to 0.0029680. The whole structure is undersized and choppy — not an impulse, just noise inside the larger corrective leg.
The local A-B-C tells the sharper story: A-wave to 0.0029260, B-wave to 0.0029930 (1.58x A), and C-wave down to 0.0028970 — 2.27 times the A-wave. That's a deep, tired final leg, the kind of overextended C-wave you often see right before a reversal attempt.
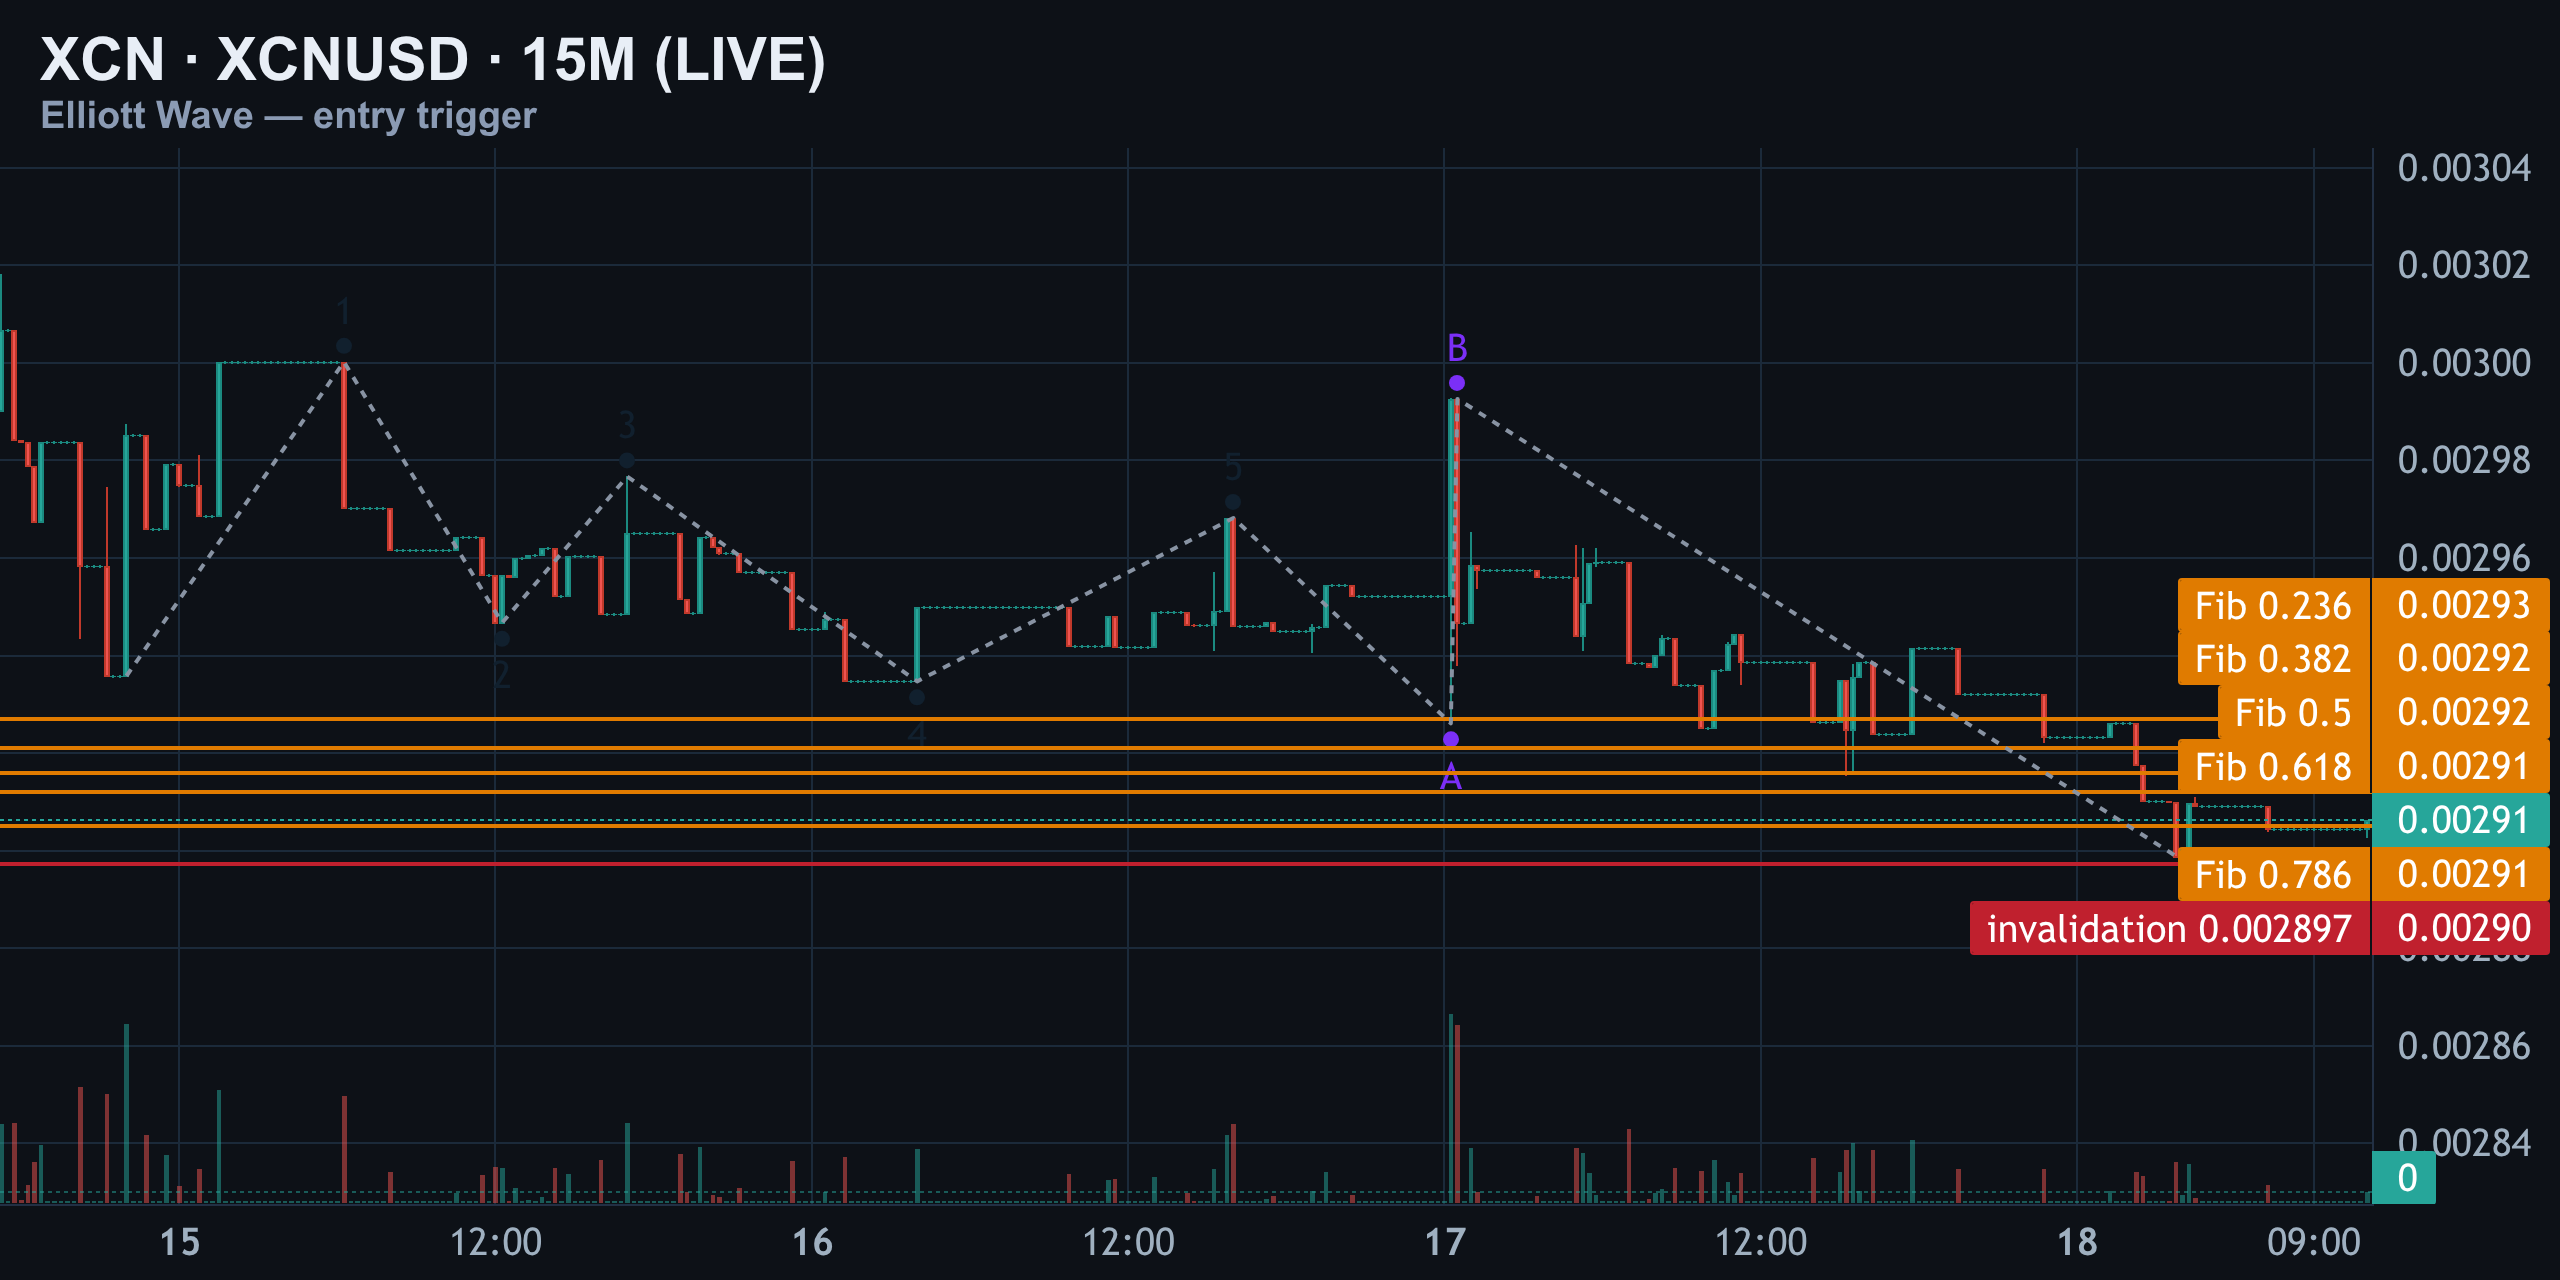
The trigger, plainly: watch for a bounce that reclaims and holds roughly 0.00292–0.00293 (the .236 through .5 fib retracement pocket). That reclaim is the timing signal for anyone positioning around the reversal thesis.
The Scenarios, Ranked
| Rank | Scenario | Trigger | Probability |
|---|---|---|---|
| 1 | Flat completes at 0.002897, reversal begins | Reclaim & hold 0.00292–0.00293 | ~55% (down from prior read as floor shifted) |
| 2 | Y-wave extends, new low with no floor | Clean close below 0.002897 | ~35% (up from 30%) |
| 3 | Sideways chop, .618–.786 band | Neither level breaks decisively | Remainder |
Notice the shift from the prior update: the alternate Y-wave scenario has climbed from 30% to 35% probability as the market has repeatedly failed to hold intermediate floors. The primary count survives, but it's leaning on a lower, tighter level than before — and it's earned less benefit of the doubt with each broken support.
Structure vs Positioning — Do They Agree?
Structurally, all three timeframes point the same direction: this entire move down from the 4H highs near 0.0041 is corrective, not the start of a fresh impulsive downtrend. Every attempt to label it as a clean five-wave decline runs into an Elliott rule violation — a wave two that over-retraces, a wave three that's the shortest wave, a wave four that overlaps wave one. Corrective structures resolve; impulsive ones extend. The weight of evidence favors resolution.
On the market side, XCN's recent context adds some texture. Onyxcoin opened 2026 with an explosive run — surging roughly 119% in the first week of the year on network catalysts — before cooling into the current corrective phase (Yahoo Finance). More recently, the Onyx Layer 1 has been shipping infrastructure — Onyx Mesh went live July 1, and a Layer 1 explorer followed July 6 — the kind of steady development flow that doesn't typically accompany a token in true trend collapse (CoinMarketCap).
Longer-range forecasters are notably more bullish than the current chart, with some models projecting an average 2026 price well above $0.007 — a reminder that near-term structure and long-horizon narrative don't have to agree, and traders should weight the chart, not the forecast, for anything inside a week's timeframe (Changelly).
Volume remains thin — around $2.7 million in 24-hour turnover — which means moves through key levels can happen fast and with less conviction behind them than the price action alone might suggest (CoinGecko). That's a caution flag either way: a break of 0.002897 could be a genuine trend shift, or it could be a thin-liquidity flush that reverses just as quickly.
Levels to Watch
| Level | Price | Significance |
|---|---|---|
| Hard invalidation | 0.002897 | Break = Y-wave extension, no floor visible |
| Entry trigger zone (low) | 0.002920 | .236 fib retracement — reclaim needed |
| Entry trigger zone (high) | 0.002930 | .5 fib retracement — hold needed |
| B-wave resistance (1H) | 0.003082 | Prior bounce high, first resistance on reversal |
| 4H B-wave high | 0.003860 | Major resistance if reversal extends |
| Chop band (.618) | ~0.003050 | Alternate 2 lower bound |
| Chop band (.786) | ~0.003250 | Alternate 2 upper bound |
These levels aren't arbitrary — they're the fib and pivot math behind every count on this chart. The tighter the price hugs 0.002897 without a decisive close through it, the more the odds tilt toward the reversal thesis simply by virtue of the level surviving repeated tests.
Setup Per the Count (Not Advice)
For anyone tracking this as a potential reversal setup rather than a directional bet, the sequencing per the count looks like this: wait for a bounce off, or a hold above, the 0.00292–0.00293 pocket, treat that reclaim as the timing trigger, and use a close below 0.002897 as the invalidation that scraps the whole idea. No reclaim, no trigger — the correct posture is cash and watch, not guessing.
- Primary bias: expanded flat completing near 0.002897, reversal attempt to follow
- Trigger: reclaim and hold of the 0.00292–0.00293 fib pocket
- Invalidation: clean close below 0.002897
- If invalidated: Y-wave extension likely, no clear downside fib floor yet defined
- Watch volume — thin turnover means this level can break or hold on light conviction
Bottom Line
XCN's story right now is genuinely simple even if the wave-counting underneath it isn't: three timeframes, three broken impulse attempts, and one converging level. 0.002897 is where the expanded flat either completes and hands the market a reversal setup, or fails and opens the door to a Y-wave with no fib floor in sight. Given XCN's thin daily volume near $2.7 million, don't expect a slow, orderly resolution — this level could go either way fast (CoinGecko).
Layer in the fundamental backdrop — steady Onyx Layer 1 development through mid-2026 and a token that already proved it can move violently off catalysts earlier in the year — and the setup becomes one worth watching closely rather than trading blind (CoinMarketCap, Yahoo Finance). Keep 0.002897 on the screen. That's the line — everything else is downstream of what happens there.
08/17/2026 — XCN Price: Did the 0.002912 Floor Hold or Fake Out?
XCN Price: Did the 0.002912 Floor Hold or Fake Out?
Where XCN Stands Right Now
Yesterday we drew a line in the sand at 0.002912 and said that if it held, the correction was probably finished. It held — barely. XCN is currently trading around $0.002935, with a market cap near $115 million and 24-hour volume of roughly $1.99 million, per CoinGecko. That's a market still finding its footing rather than one running away in either direction.
Since yesterday's call, price slipped about 0.7%, sliding from 0.0029445 down to 0.002924 before stabilizing. The invalidation level never traded through. None of yesterday's three upside targets — 0.00298, 0.00301, or 0.00306 — have been hit yet, because the trigger that unlocks them hasn't been reclaimed.
| Metric | Yesterday | Today |
|---|---|---|
| Price | $0.0029445 | $0.002924 – $0.002935 |
| Key floor (invalidation) | 0.002912 | 0.002912 (held) |
| Primary count confidence | 50% | 55% |
| Alternate count confidence | 32% | 30% |
4H — The Bigger Picture Is Corrective, Not Impulsive
Zoom out to the four-hour chart and here's the honest read: this is not a fresh impulsive wave five. Wave one topped near 0.0039240, wave three ran to 0.0041120, and wave four dropped all the way to 0.0029650 — deep enough to overlap wave one's territory. On a textbook impulse, that's disqualifying.
But it isn't disqualifying if what we're actually looking at is a diagonal, or more likely, the terminal motive wave inside a larger correction. Step back further to the higher-degree skeleton: a high at 0.0041120, a low at 0.0029650, a sharp rally to 0.0038600 for the B-wave, then a final flush to 0.0029120.
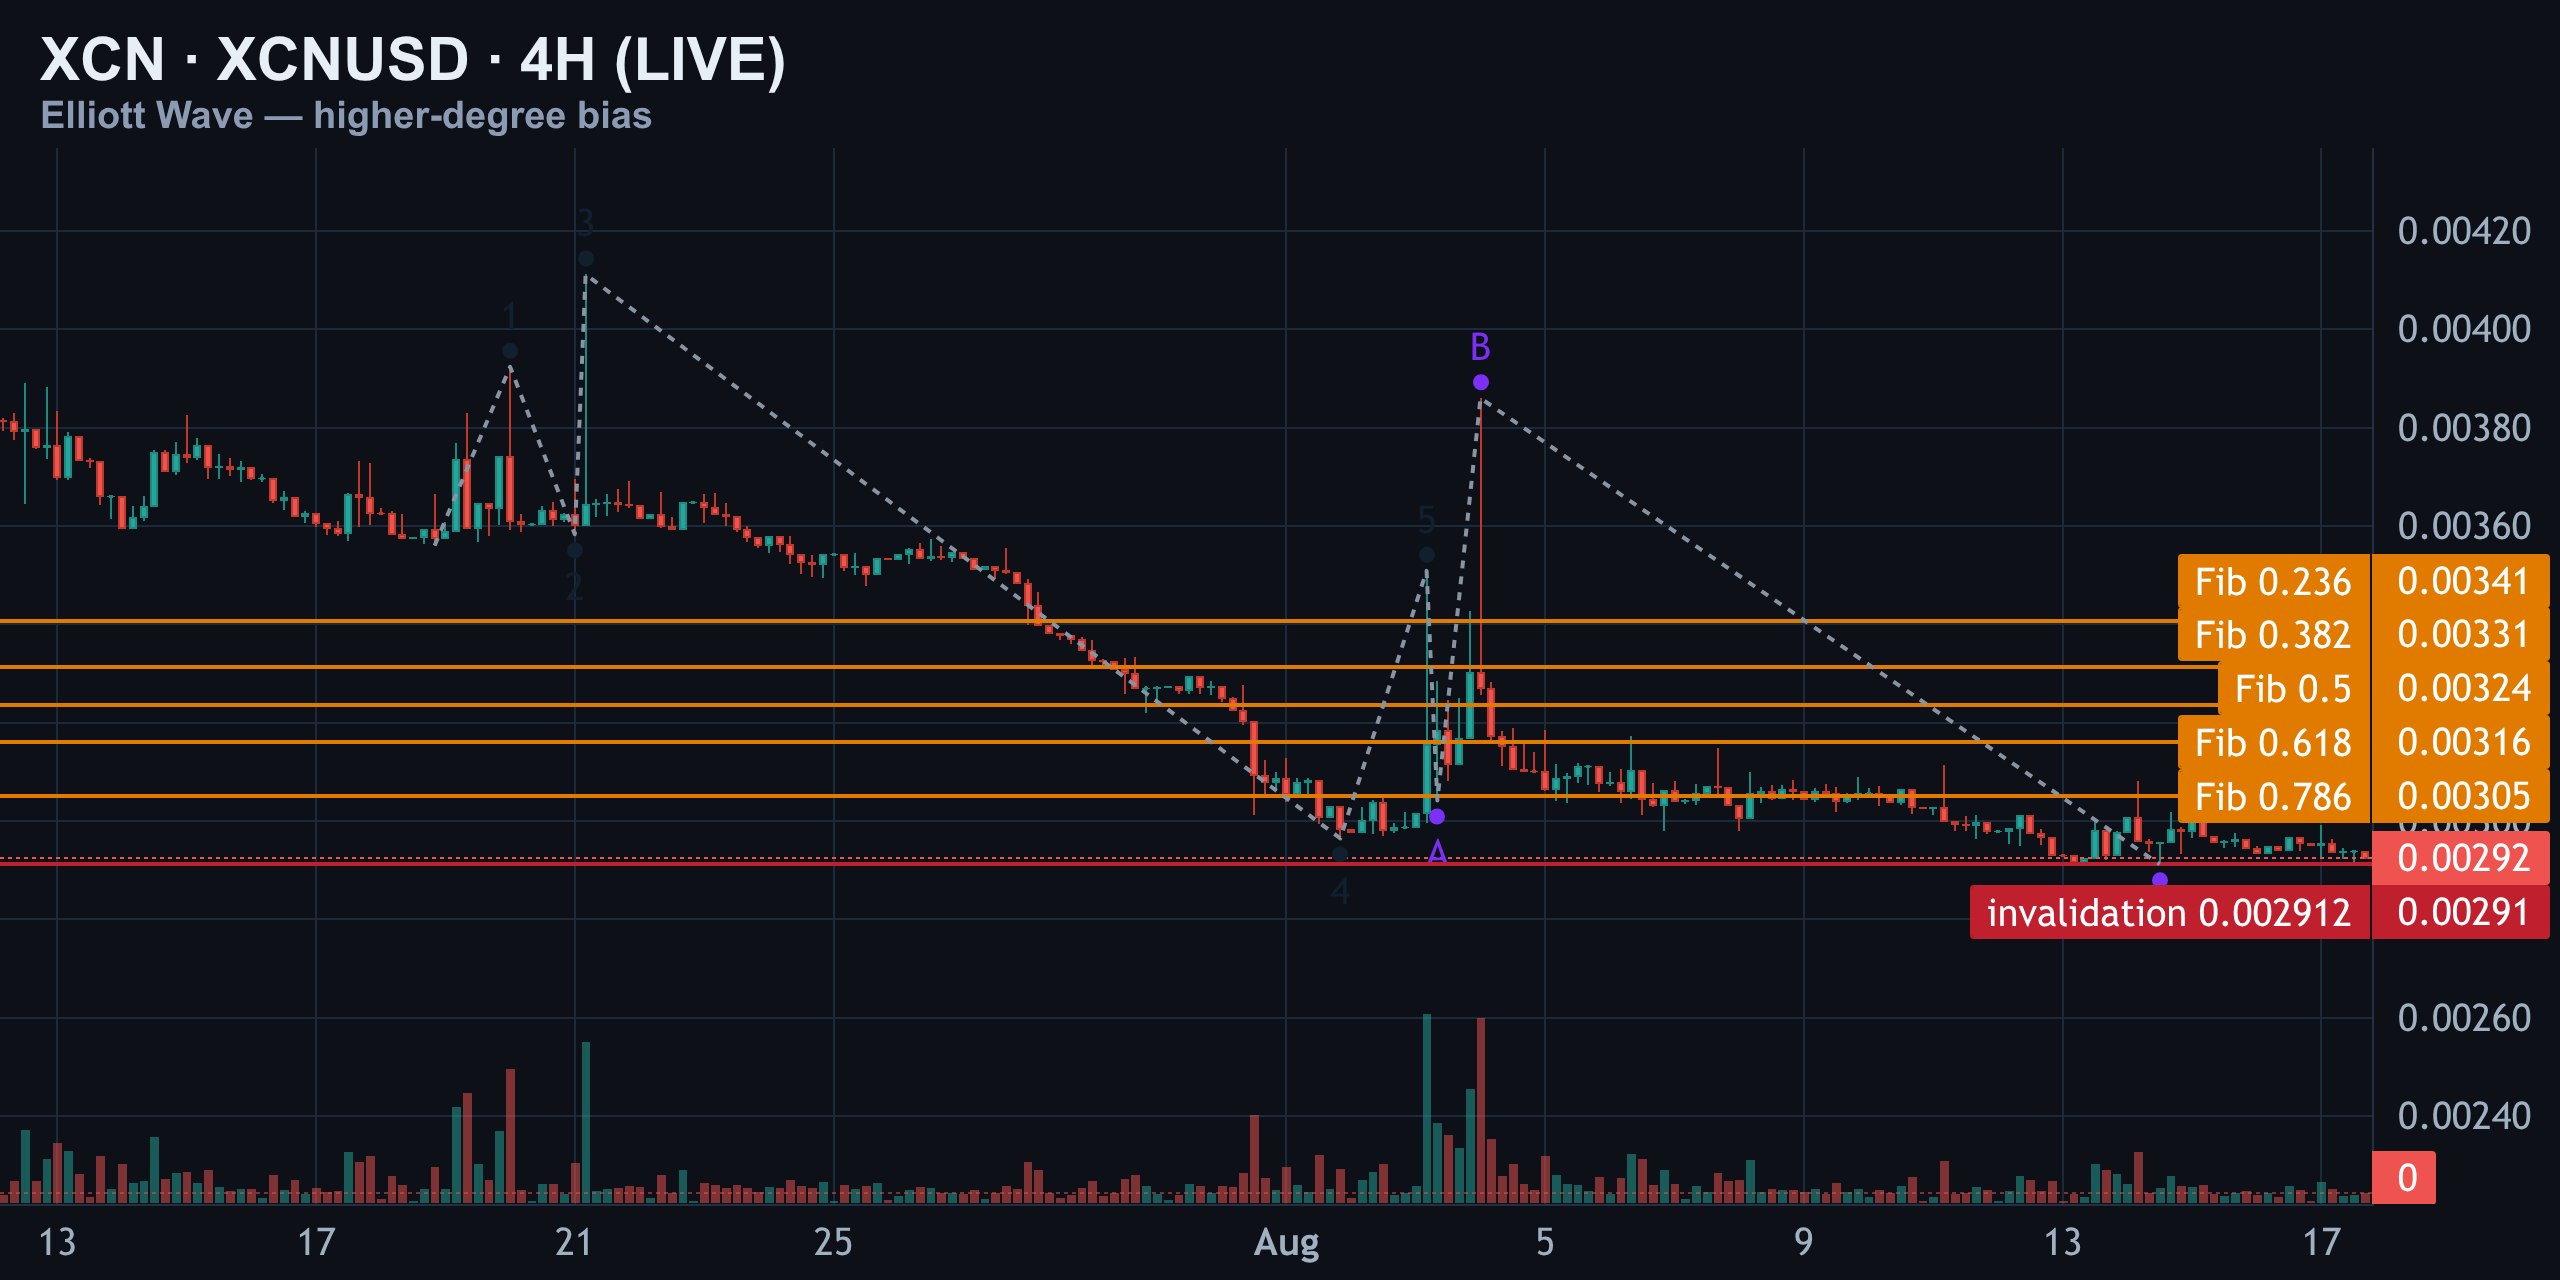
- B-wave ran 1.75x the A-wave — anything over 1.18 signals an expanded flat
- C-wave ran 2.03x the A-wave — a normal extension for this pattern
- The C-wave bottom at 0.002912 is now the single most important price on the chart
The four-hour bias is that we likely just finished a large expanded flat correction, with the C-wave bottoming at 0.002912. The whole higher-degree bullish case lives or dies at that level — the big drop looks like a completed correction, not a new crash, and one price confirms or kills that thesis.
1H — Walking the Primary Count, Then the Alternate
On the one-hour, the tail end of that four-hour C-wave subdivides into its own five-wave sequence: wave one at 0.0032840, a sharp wave three to 0.0038600, wave four dipping to 0.0029810, and wave five closing at 0.0031490. Right after that, price carved a small A-B-C — A at 0.0029140, B rallying to 0.0030820, C undercutting to 0.0029120.
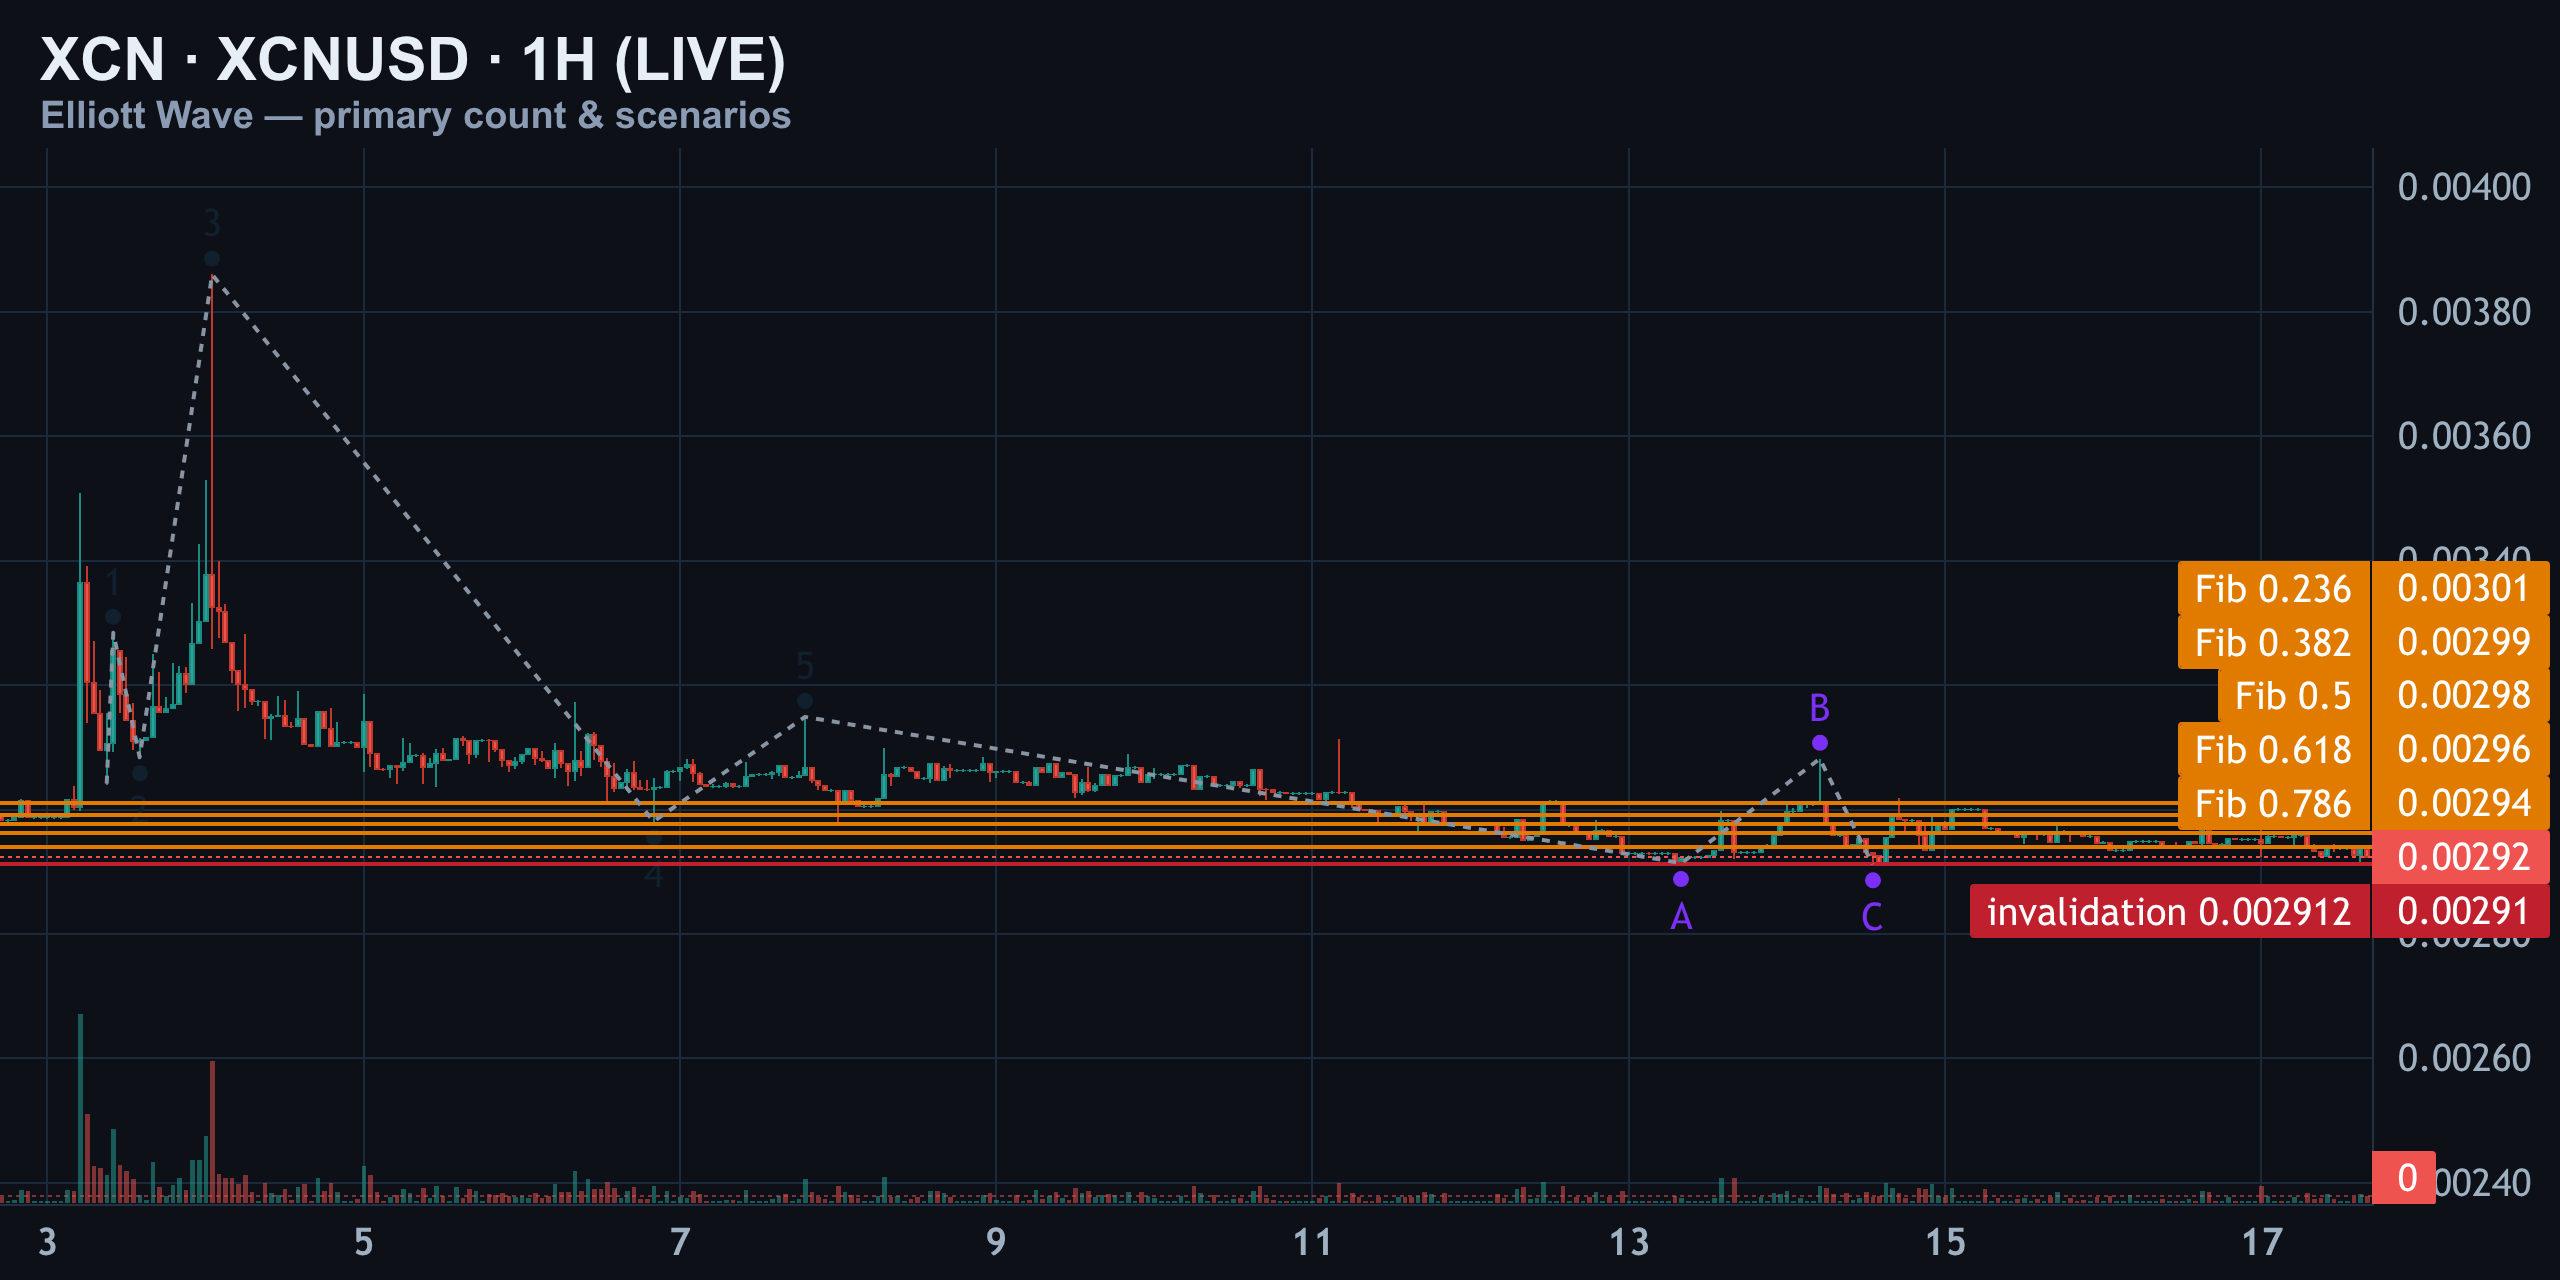
That final C-wave lands on the exact same floor the four-hour flagged. Two independent degrees agreeing on one number is the kind of confluence you actually trust. Confirmation for this primary count is a reclaim of the 0.5 fib near 0.00298, then 0.00301.
The alternate: a double zigzag that isn't finished
Clear the chart and look at the other possibility. If the whole move down from 0.0035090 is a double zigzag — a W-X-Y — then the B-wave bounce to 0.0030820 was just the X-wave, and the Y-leg is still unfinished. That would mean the real low hasn't printed yet.
15M — Timing the Entry Off the Floor
Drop to the fifteen-minute chart and this is purely about timing. Price carved a small five-wave sequence: wave one at 0.0030820, wave two diving all the way to 0.0029120 — a full 100%-plus retrace of wave one, which technically breaks the rule that wave two can't fully retrace wave one.
That's a red flag for calling this a clean impulse. It's messier, more corrective-looking price action — which actually fits the bigger picture of a market still digesting a bottom rather than launching cleanly. Wave three only made it to 0.0030180, smaller than wave one, another atypical flag, before wave four dropped to 0.0029360 and wave five topped at 0.0030.
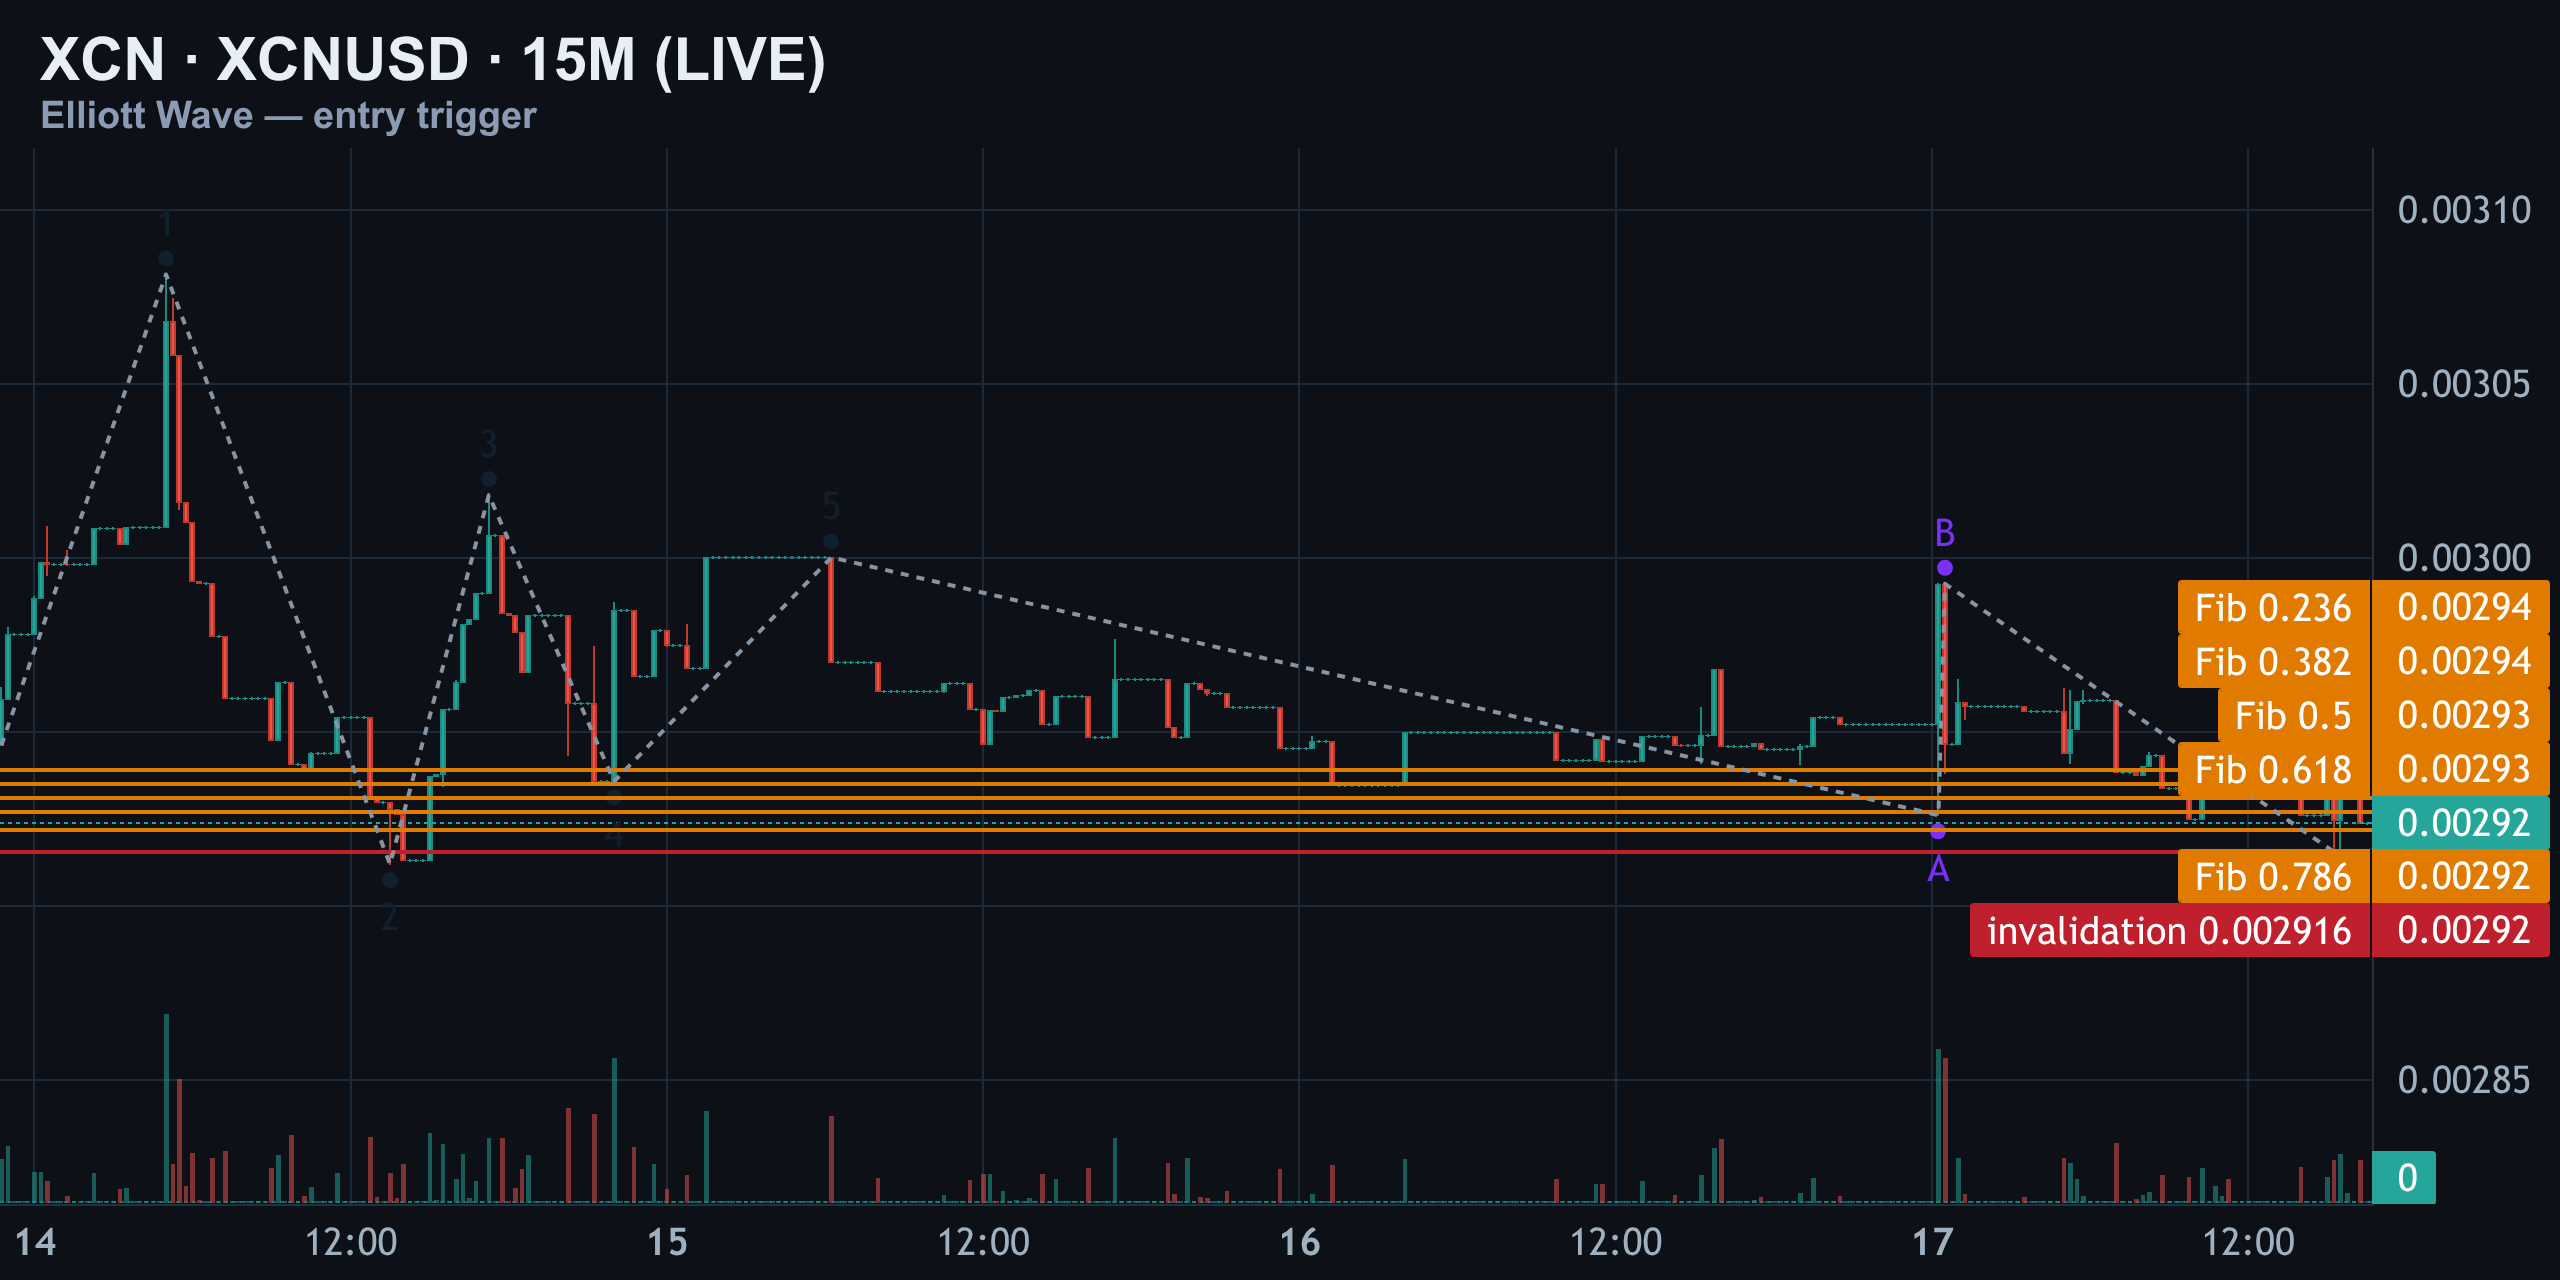
After that, a fresh A-B-C formed: A at 0.0029260, B at 0.0029930, C at 0.0029160 — again, right on the same shelf. Price is basing directly above the invalidation, chopping in a tight band between roughly 0.00292 and 0.00300.
The Scenarios, Ranked
Putting all three timeframes together, here's how the paths stack up right now.
| Scenario | Probability | Confirmation trigger | Implication |
|---|---|---|---|
| Expanded flat complete (primary) | 55% | 15M close above 0.00298, then 0.00301 | Correction over; targets 0.00298 / 0.00301 / 0.00306 |
| Double zigzag, Y-leg unfinished (alternate) | 30% | Hourly close below 0.002912 | One more leg down before real low |
| Extended chop / no clear resolution | 15% | Neither trigger fires within 24-48h | Range-bound between 0.00292–0.00300 |
Note the shift from yesterday: the primary count gained five points of conviction purely because the floor was retested and defended, while the alternate lost two. Same floor, same trigger, slightly more confidence in the bullish resolution — but confidence isn't confirmation.
Structure vs Positioning — Do They Agree?
Wave structure is only half the picture. It helps to check whether real trading activity backs up the chart story. CoinMarketCap's latest read on XCN points to a recent 36% jump in 24-hour trading volume, up to roughly $3.8 million on the move that preceded this basing action — a sign of renewed trader interest rather than a market being abandoned.
Current volume has cooled back to around $1.99 million on CoinGecko's tracking, which is consistent with the chop we're seeing on the 15-minute chart — traders aren't committing hard in either direction while the market sits on top of 0.002912. Metamask's price feed independently shows XCN trading near $0.0029 with a market cap around $115 million, corroborating the CoinGecko print and suggesting this isn't a data anomaly on one exchange.
Longer-term, Kraken's price-prediction model — built on trend extrapolation rather than wave theory — pencils in XCN reaching roughly $0.0031 by 2027, which happens to sit right inside the target zone the primary Elliott Wave count is pointing at ($0.00298–$0.00306). That's not confirmation of the wave count, but it's a useful sanity check that the bullish resolution isn't chart-fiction — it's roughly where a slower, model-driven view expects price to land too.
Levels to Watch
| Level | Price | Why it matters |
|---|---|---|
| Hard floor / invalidation | 0.002912 | Break below here flips primary bullish count into the bearish double-zigzag alternate |
| Current price | 0.002924 – 0.002935 | Sitting just above the floor, inside the chop zone |
| Local trigger (15M) | 0.00298 | First reclaim needed to confirm the bottom is in |
| 1H 0.5 fib / Target 1 | 0.00301 | Confirms primary count is playing out |
| Target 2 | 0.00306 | Next resistance if reclaim holds |
| Recent range high | 0.0035090 | Where the larger corrective move down began |
Every one of these numbers matters more together than alone. The floor at 0.002912 is the line that separates two entirely different stories — everything else is just confirmation along the way.
Setup Per the Count (Not Advice) — And the Bottom Line
This is the primary count across all three timeframes, stitched together. The four-hour shows a full A-B-C, with the B-wave running 1.75 times the A-wave — the signature of an expanded flat, where B overshoots the start of A before C completes the pattern. The one-hour subdivides that same C-wave into a clean five, then a smaller A-B-C landing on the identical floor. The fifteen-minute is where you'd time an entry, but only on a reclaim of 0.00298, not on a guess.
- If bullish: wait for a 15M close above 0.00298, then look for follow-through toward 0.00301 and 0.00306
- If bearish: a clean hourly close below 0.002912 flips the whole picture and suggests one more leg down in a double zigzag
- If neither: expect continued chop between 0.00292 and 0.00300 — not a setup, just noise
This is not financial advice — it's a map of what the structure says has to happen for either side to be right. Nothing here is triggered yet, and that's the point: the market hasn't decided, so neither should you.
Summary
XCN held the 0.002912 floor we flagged yesterday, and three separate timeframes are bottoming in almost the exact same spot — that's real confluence, not coincidence. The primary count (expanded flat complete) now sits at 55% confidence, up from 50%, purely because the floor got retested and defended. But nothing is confirmed until price reclaims 0.00298. Until then, this is a floor worth watching, not a floor worth chasing.
More on Onyx: elliott wave · technical analysis
Analysis and education, not investment advice. See our editorial policy.