Daily market analysis
Ethereum (ETH) technical analysis today
Last updated
Ethereum Daily Pulse Aug 18, 2026: Pinned at $1,901
Where We Left It — 7 Days Ago
Last week's Daily Pulse, published on August 11, called this exact setup: Ethereum pinned between its 50-day and 200-day moving averages, no clean edge in either direction, standing aside instead of forcing a trade. That call has aged well — almost too well.
Since then, ETH has traded in a range from roughly $1,841 on the low end up through a rejection near $1,919, and as of today it's changing hands around $1,901 to $1,912 depending on the feed — Yahoo Finance has it at $1,911.89, Metamask's price tracker shows $1,895.08, and Fortune's snapshot from the prior morning had it at $1,891.33. Split the difference and you land almost exactly where the market opened the week.
Options Snapshot — A Calm Surface, A Defensive Undertow
The options board tells a more interesting story than spot price does. The put-call ratio by open interest sits at 0.50 — structurally bullish on paper, since there are twice as many calls outstanding as puts. But today's volume ratio is even lower at 0.26, meaning the fresh flow hitting the tape right now is skewing hard toward calls, not puts.
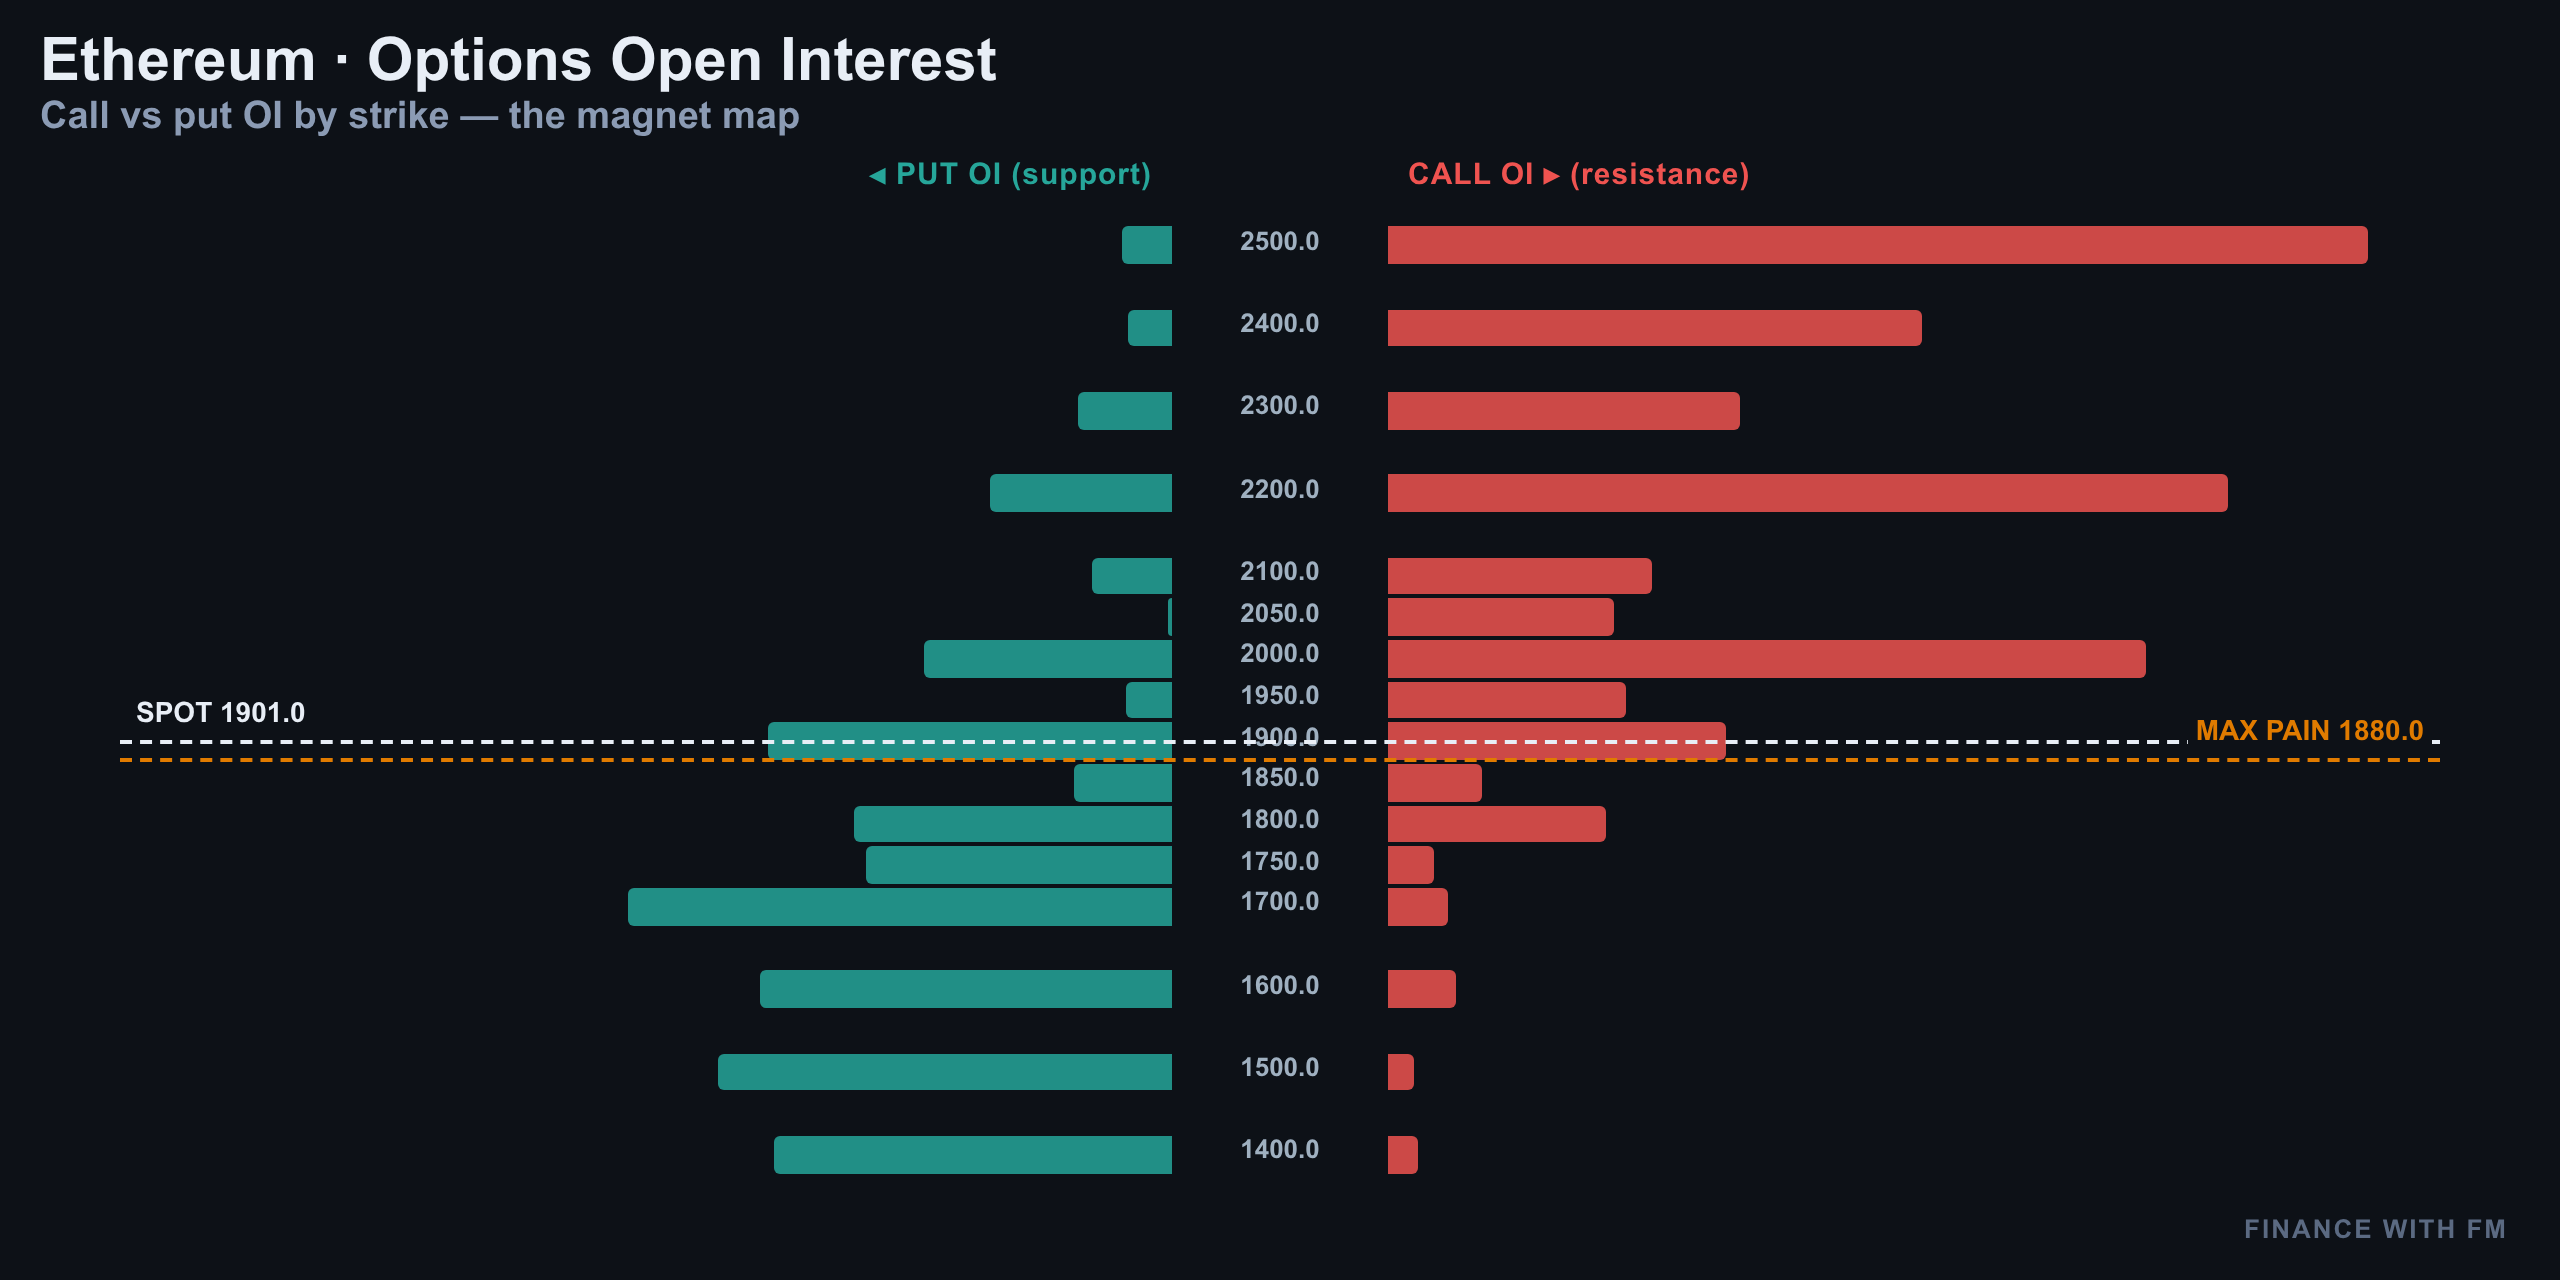
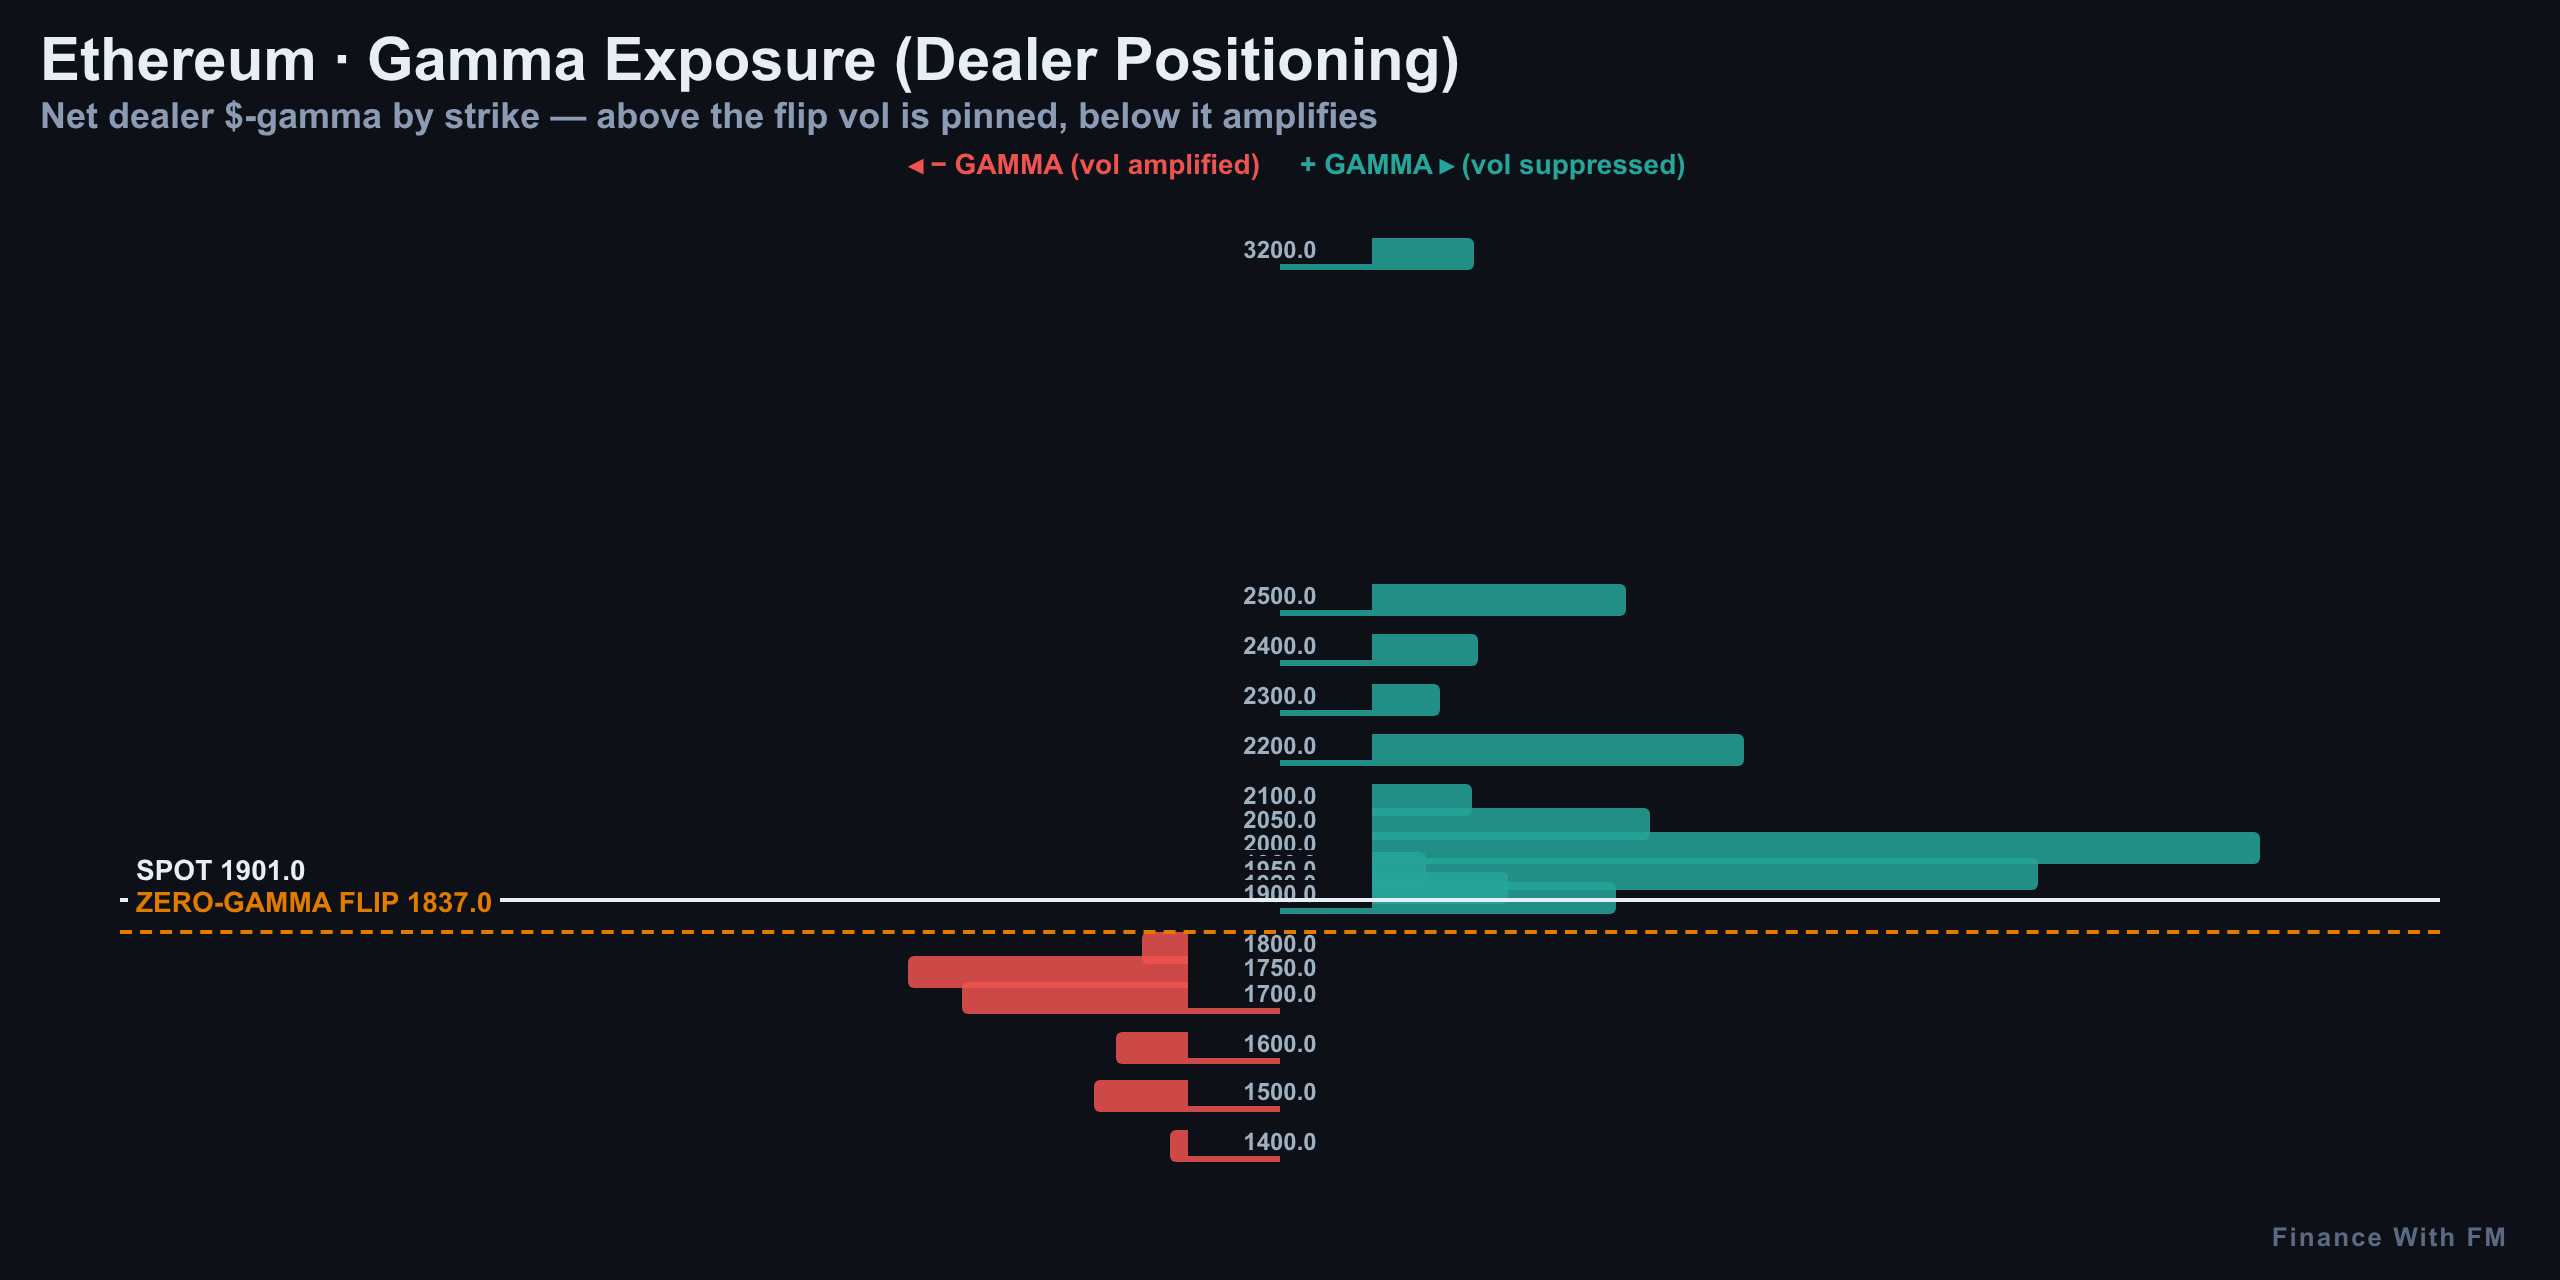
Max pain for the August 19 expiry is sitting at $1,880, which is acting like a magnet pulling price back toward it into expiry. Overhead, the big call wall is way up at $2,500 — mostly irrelevant for this week's price action. Downside, the put wall at $1,700 is the real safety net dealers are watching if things turn ugly fast.
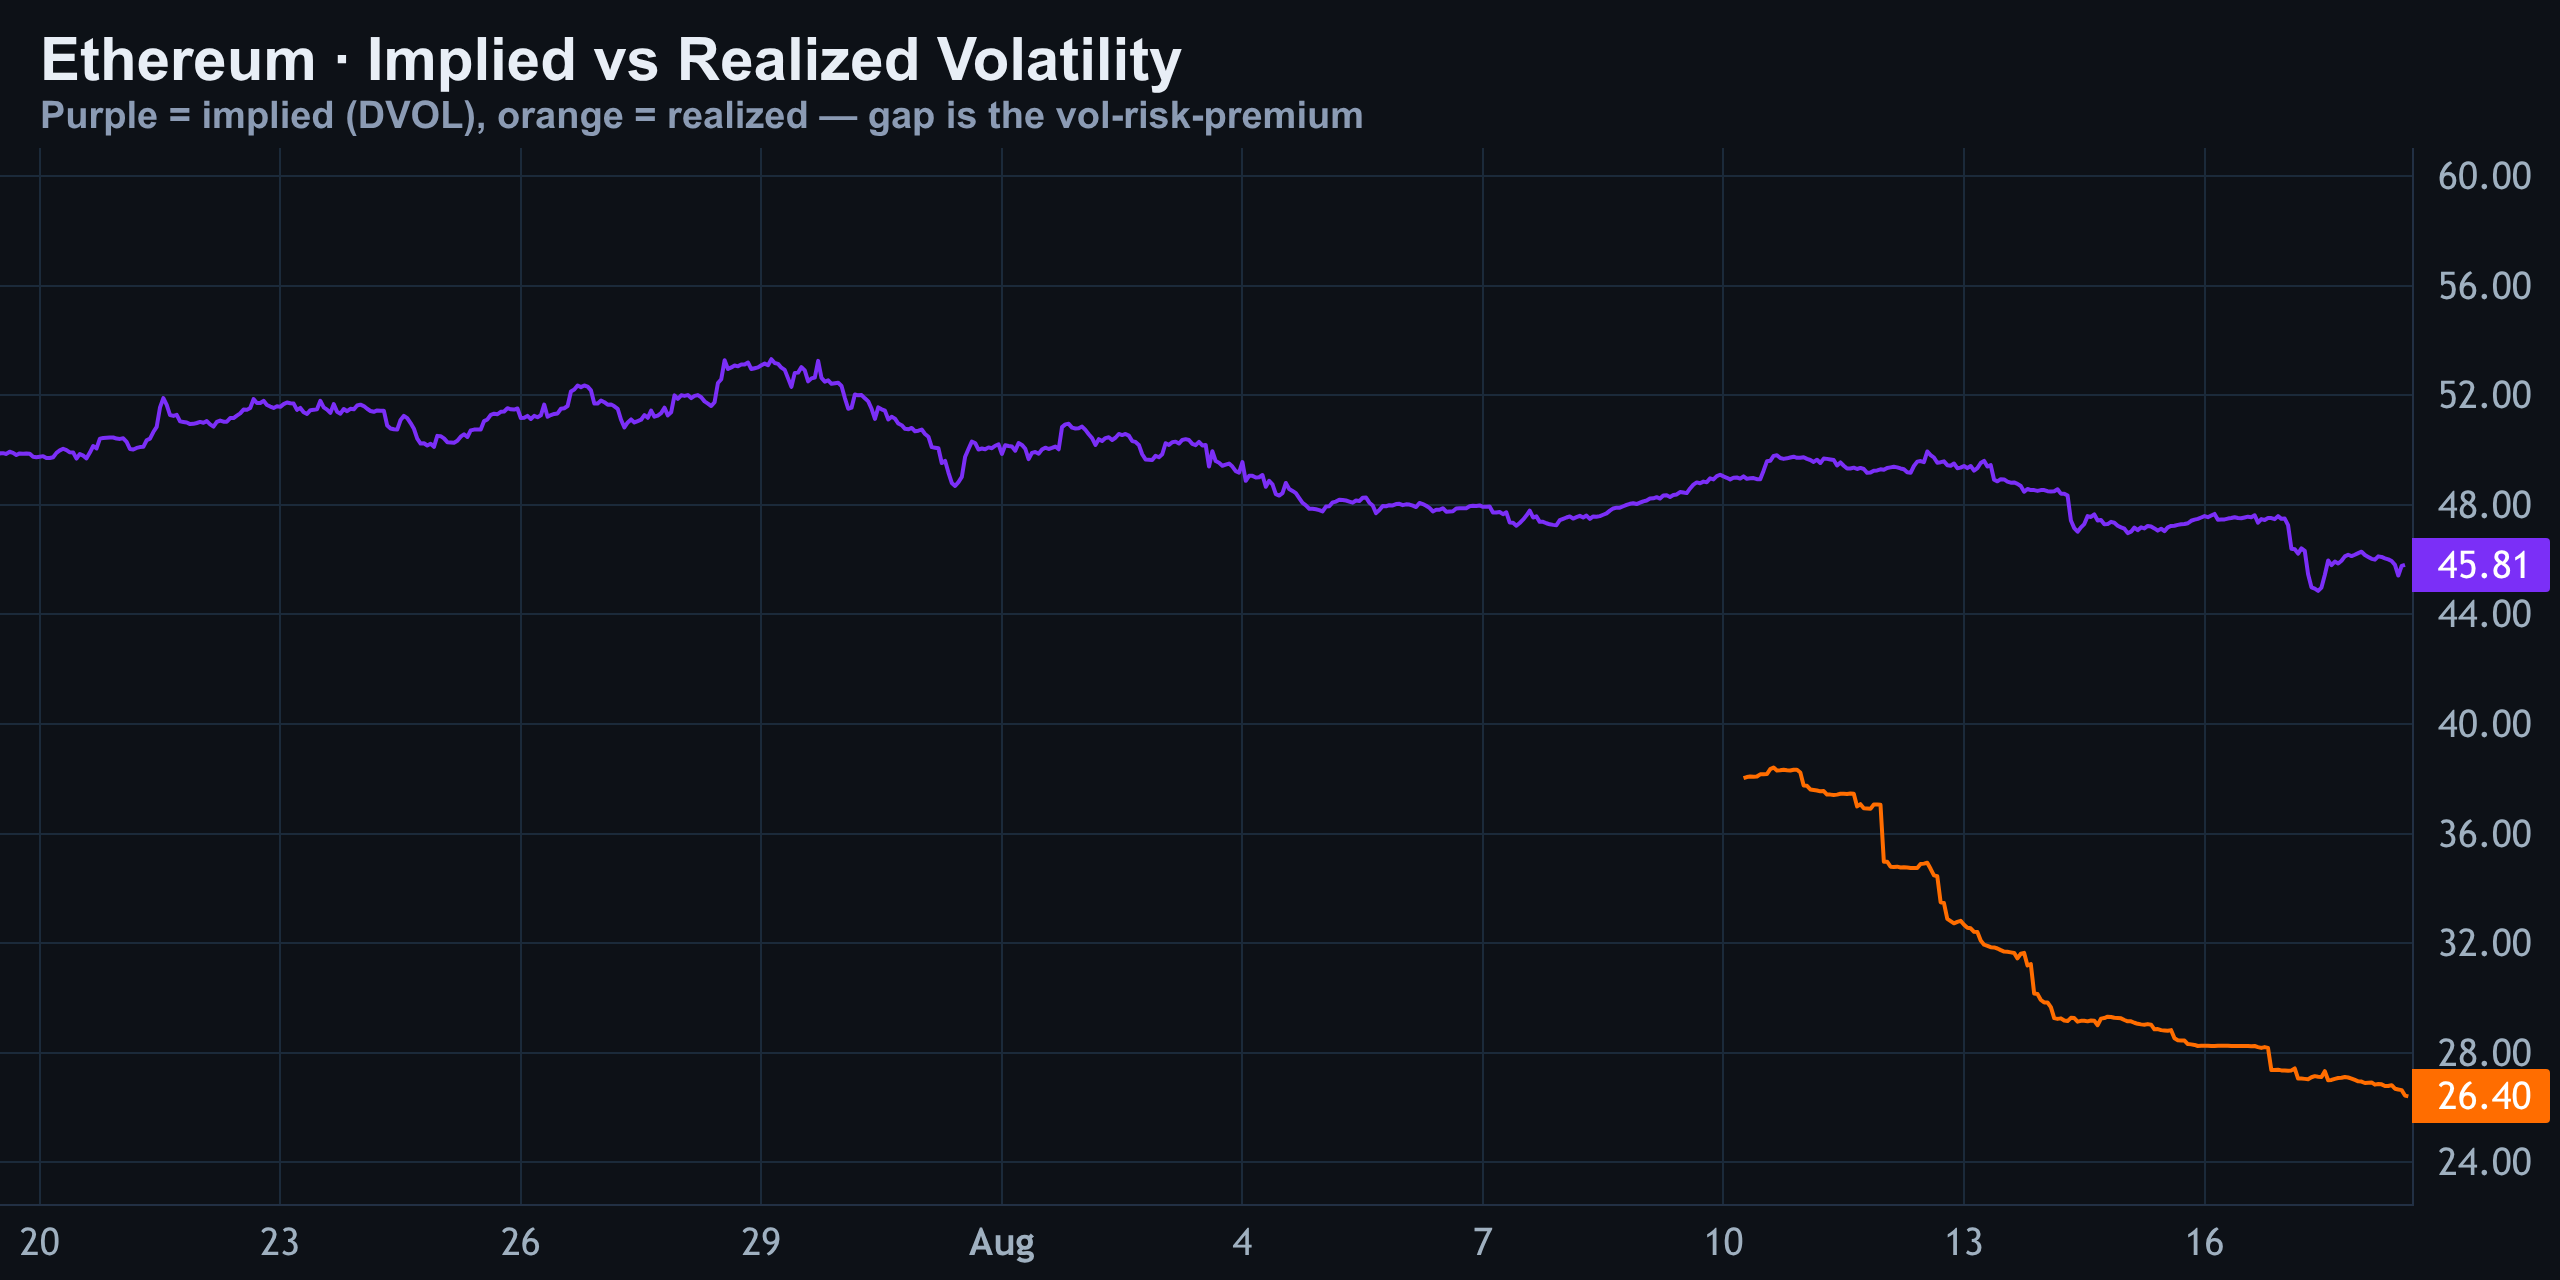
Implied volatility is running at 45.8% against realized volatility of just 26.4% — a vol-risk-premium of roughly 19 points. In plain English: options are expensive relative to what the market is actually doing. Someone is paying up for protection in a tape that hasn't moved.
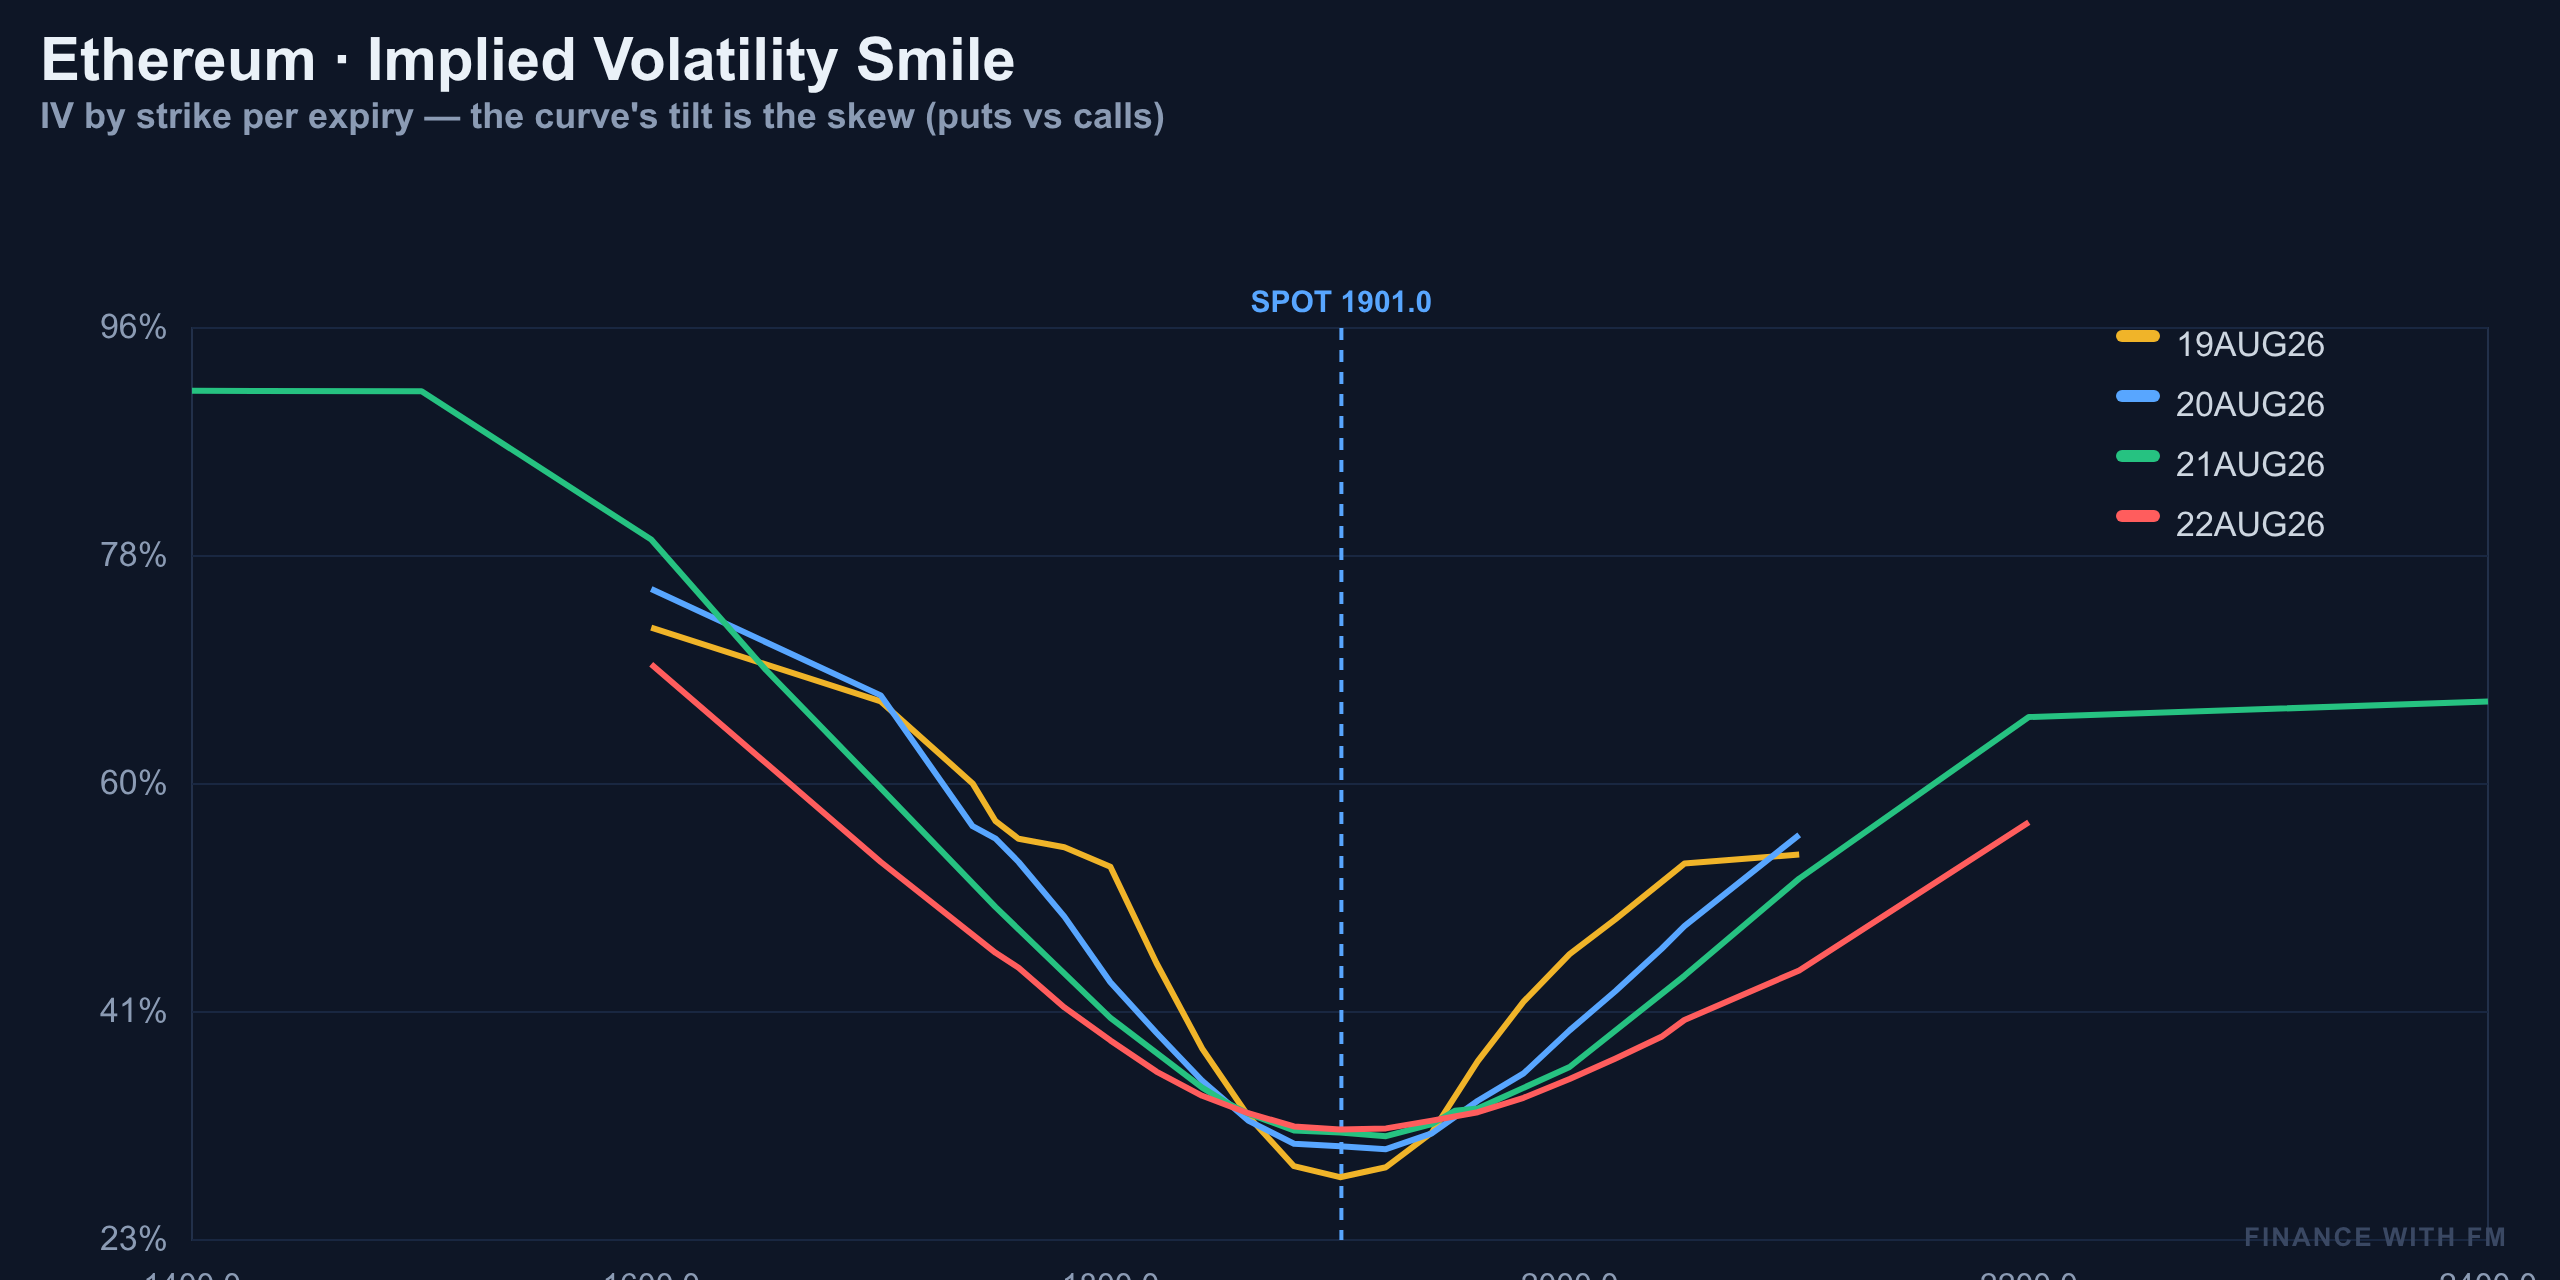
The 25-delta skew is +12.3%, meaning puts are bid richer than calls at equal distance from spot. Across the entire smile, that same downside tilt shows up — not panic pricing, but a persistent defensive lean that's been sitting there for a while now.
| Metric | Reading |
|---|---|
| Implied Volatility | 45.8% |
| Realized Volatility | 26.4% |
| Vol-Risk-Premium | +19.4 pts |
| Put/Call Ratio (Open Interest) | 0.50 |
| Put/Call Ratio (Volume) | 0.26 |
| 25-Delta Skew | +12.3% |
| Max Pain (Aug 19 expiry) | $1,880 |
| Call Wall | $2,500 |
| Put Wall | $1,700 |
Probability Above Strike & The Expected Move
By the August 22 expiry, the option market is pricing essentially zero probability of Ethereum trading above $2,100 — that's the ceiling the entire curve currently agrees on.
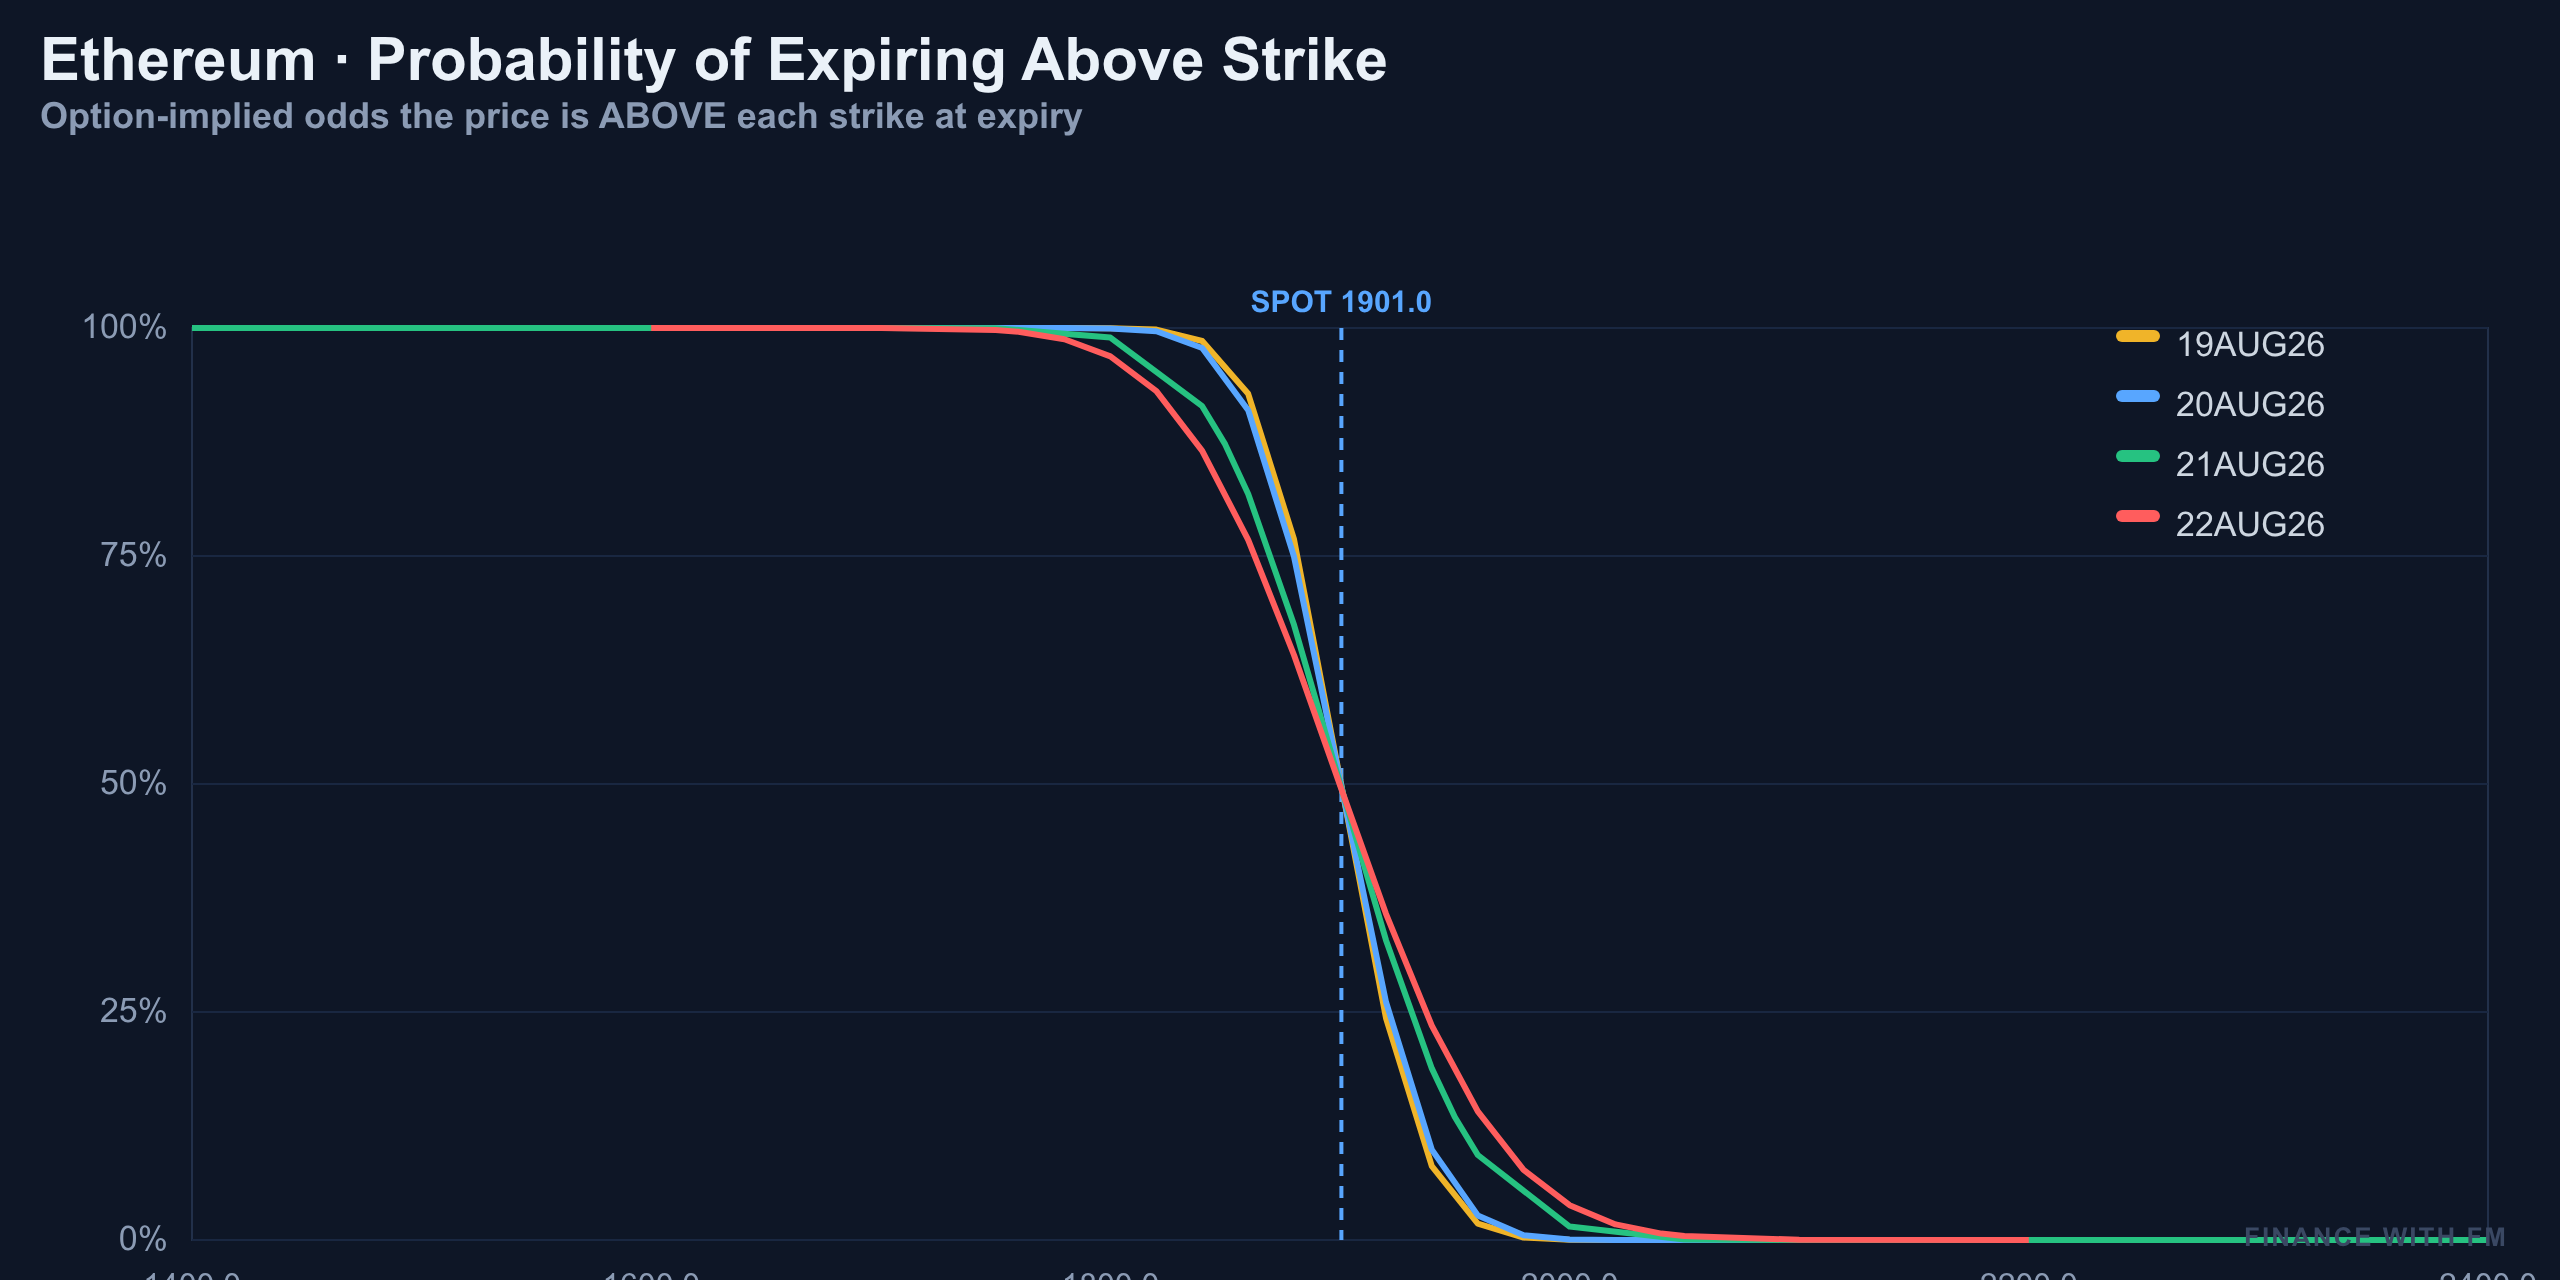
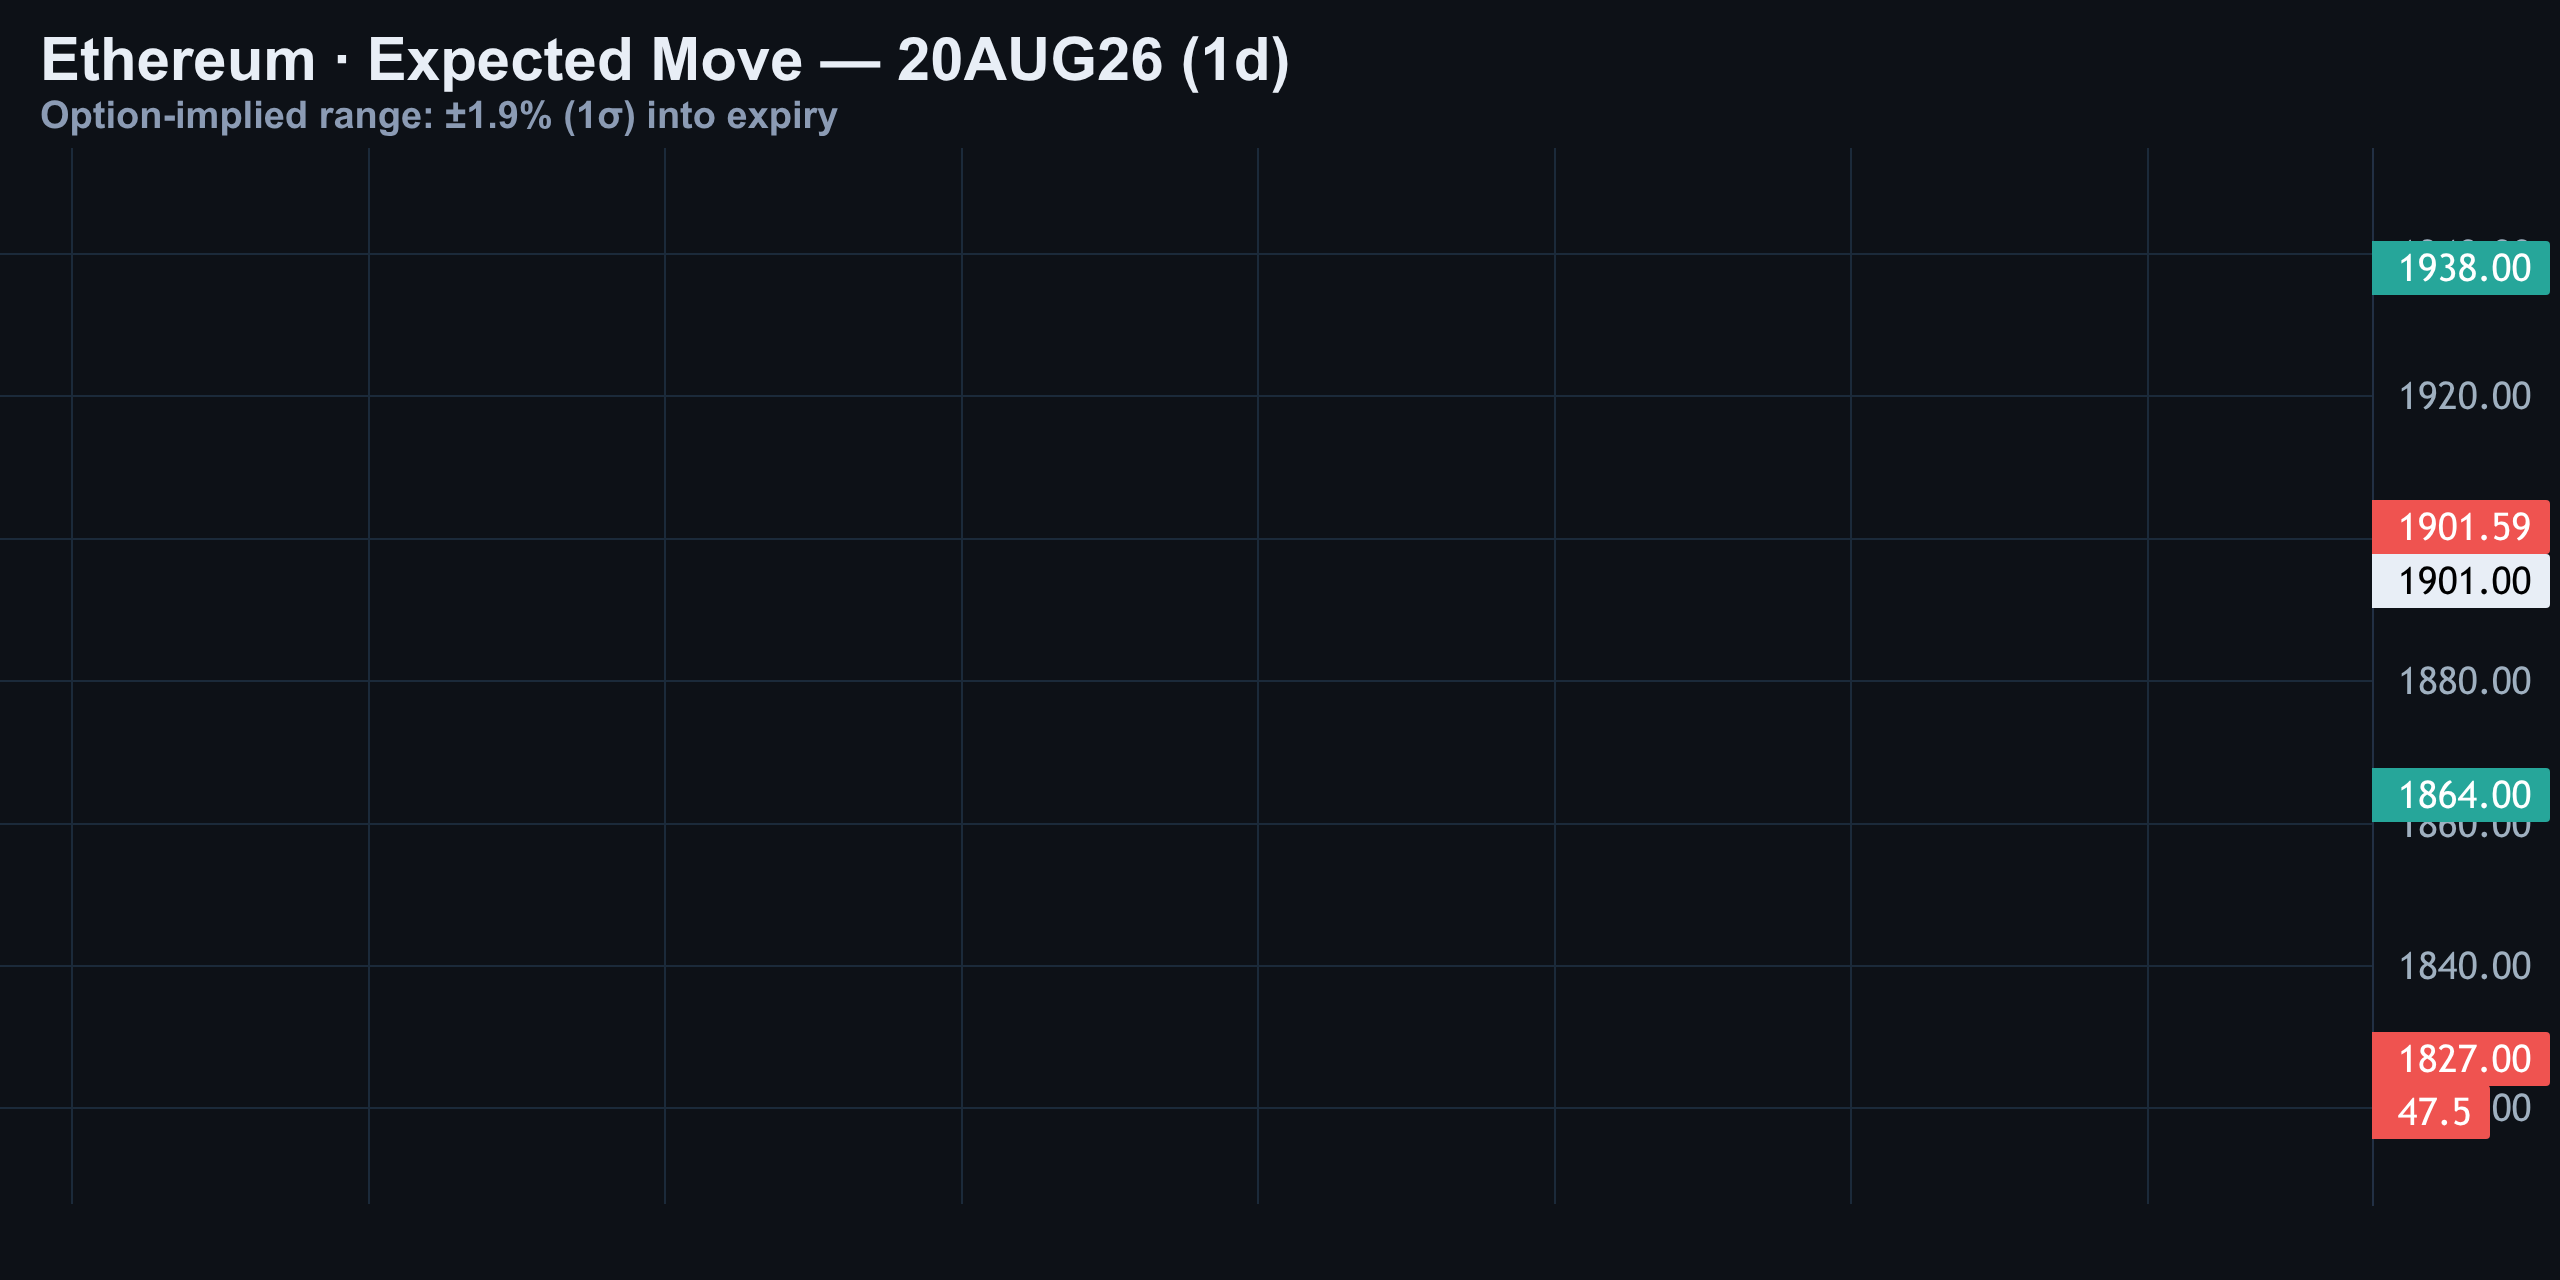
Zoom in closer and the one-day expected move for August 20 is roughly ±1.9%, which puts the high-probability band between about $1,864 and $1,938. Anything outside the $1,827–$1,975 two-sigma band right now is genuinely a long-shot bet.
| Band | Range |
|---|---|
| 1-Sigma (Aug 20 expected move, ±1.9%) | $1,864 – $1,938 |
| 2-Sigma (long-shot territory) | $1,827 – $1,975 |
| Options-implied ceiling (Aug 22) | $2,100 (~0% probability above) |
Positioning & Order Flow — Whales Aren't Committing Either
The heaviest whale block flow isn't even about this week — it's stacked out on the December expiry, with 500-plus contracts each at the $3,200 and $2,800 strikes, a long-dated directional bet rather than a near-term signal.
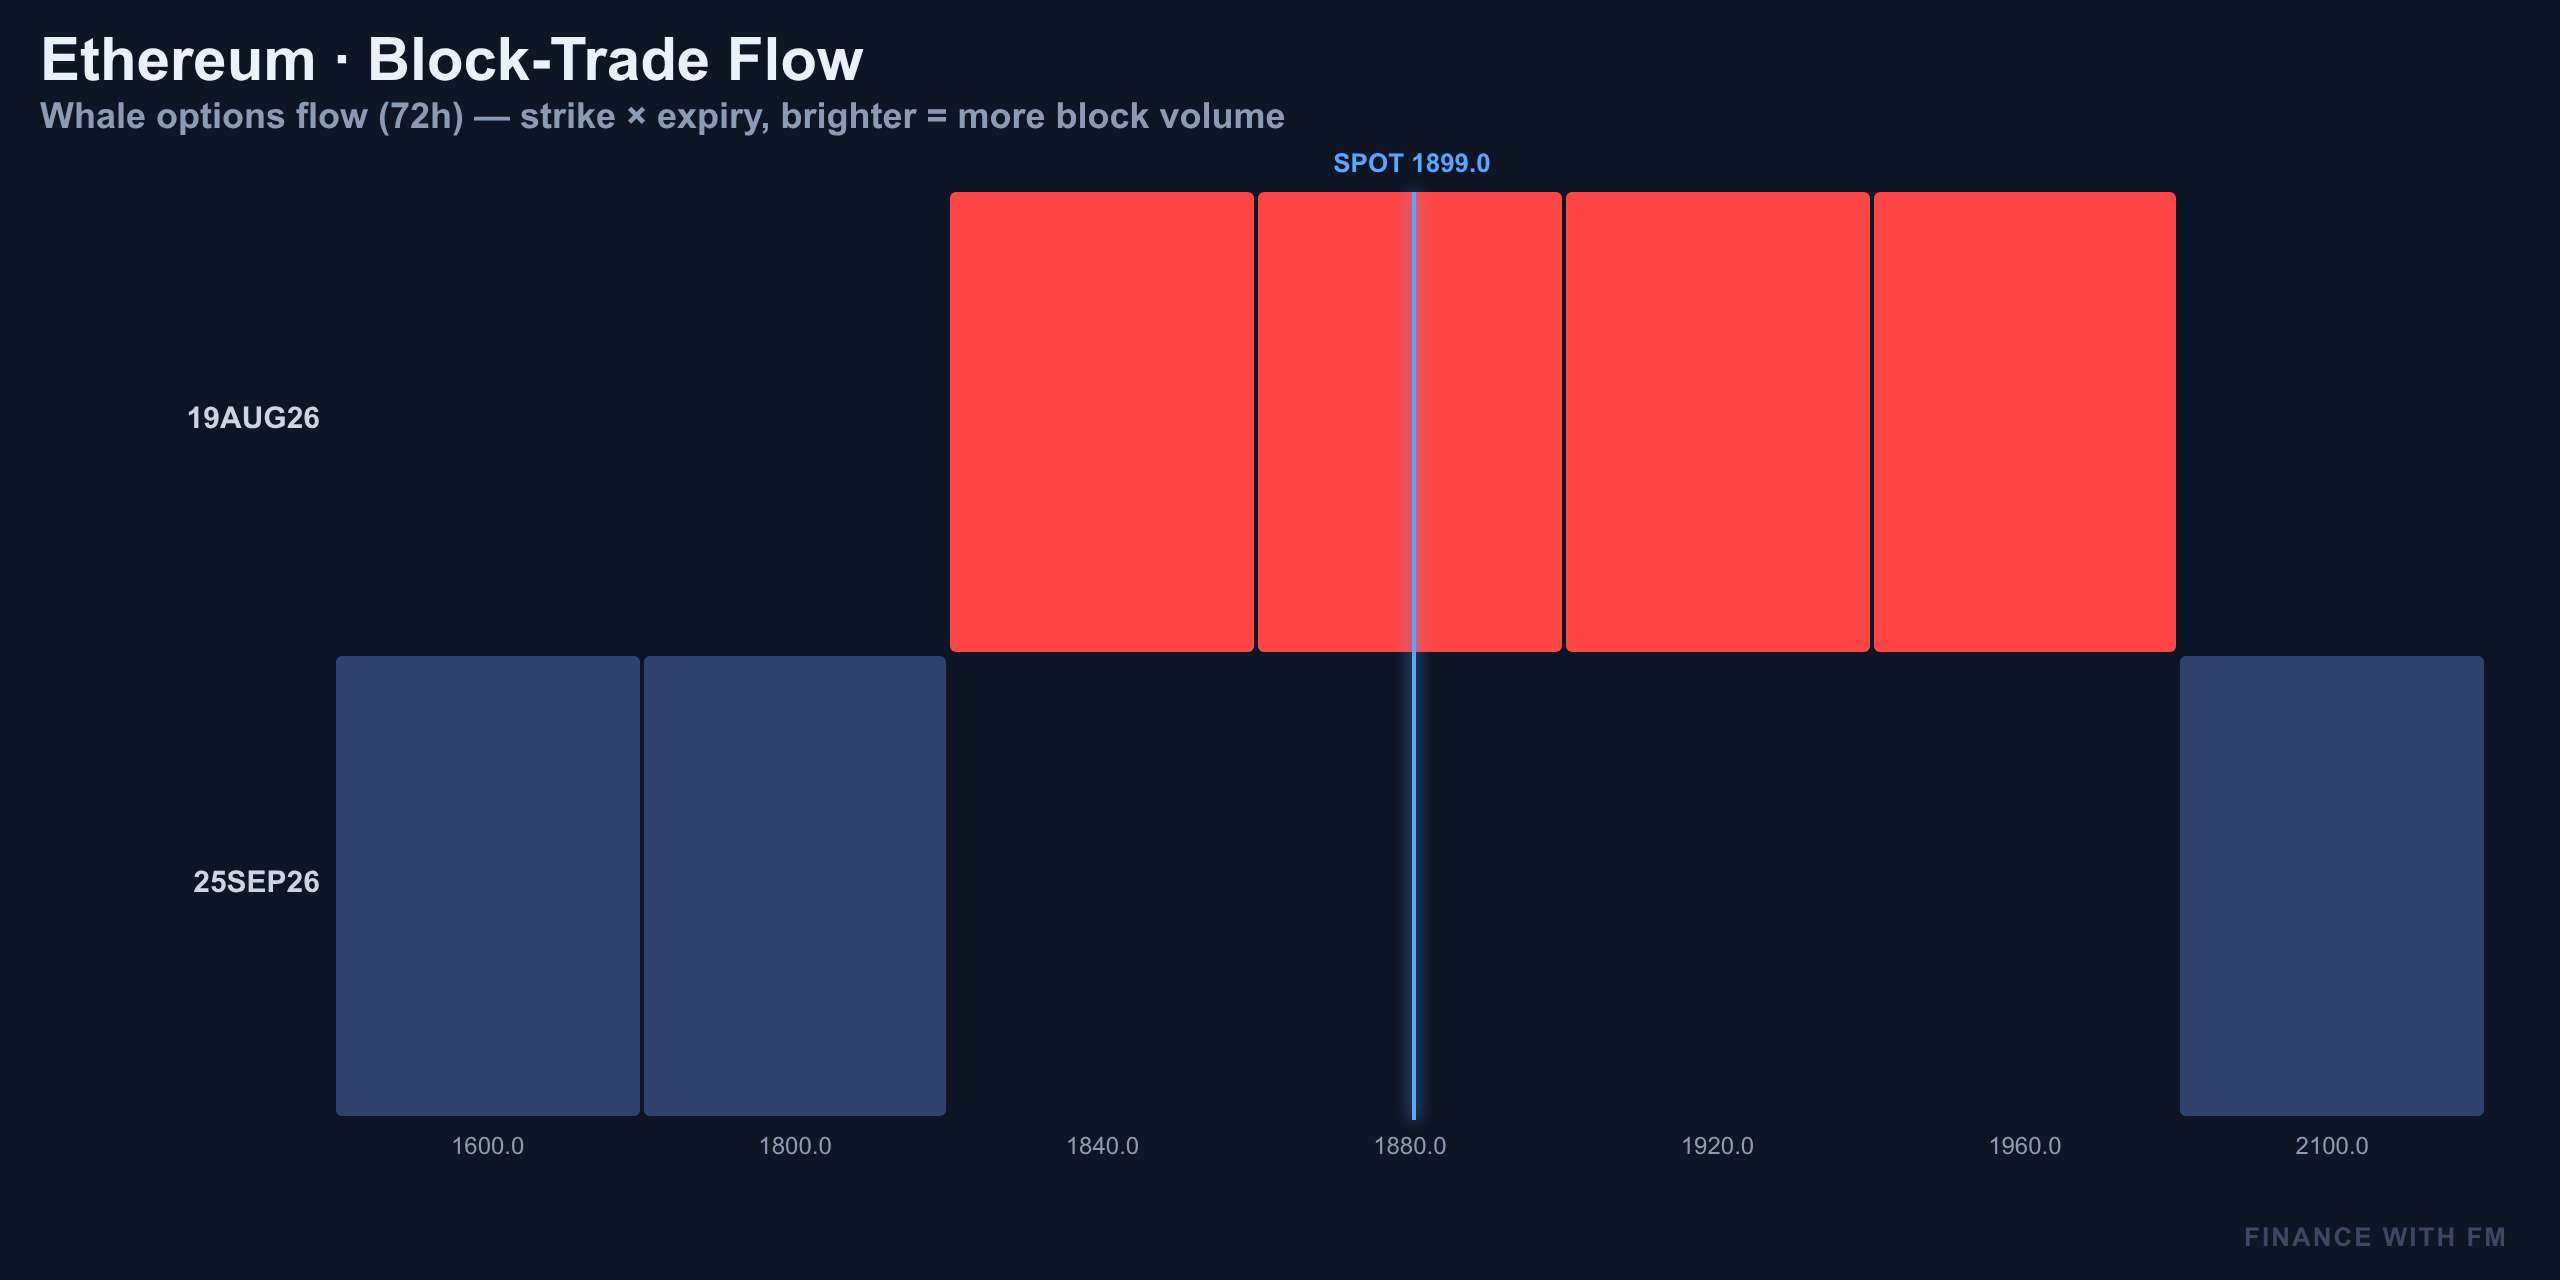
Closer to today's expiry, there are 500 contracts each at the $1,920 and $1,840 strikes on the August 19 expiry — bracketing spot almost symmetrically. Overall whale direction is mixed: 1,250 calls bought against 1,335 calls sold, with puts bought and sold almost perfectly balanced at 585 each. Smart money isn't leaning hard either way today.
| Strike | Expiry | Contracts | Side |
|---|---|---|---|
| $3,200 | December | 500+ | Call (long-dated) |
| $2,800 | December | 500+ | Call/Put (long-dated) |
| $1,920 | Aug 19 | 500 | Bracketing spot |
| $1,840 | Aug 19 | 500 | Bracketing spot |
Technical Structure — One Falling Channel, Three Timeframes
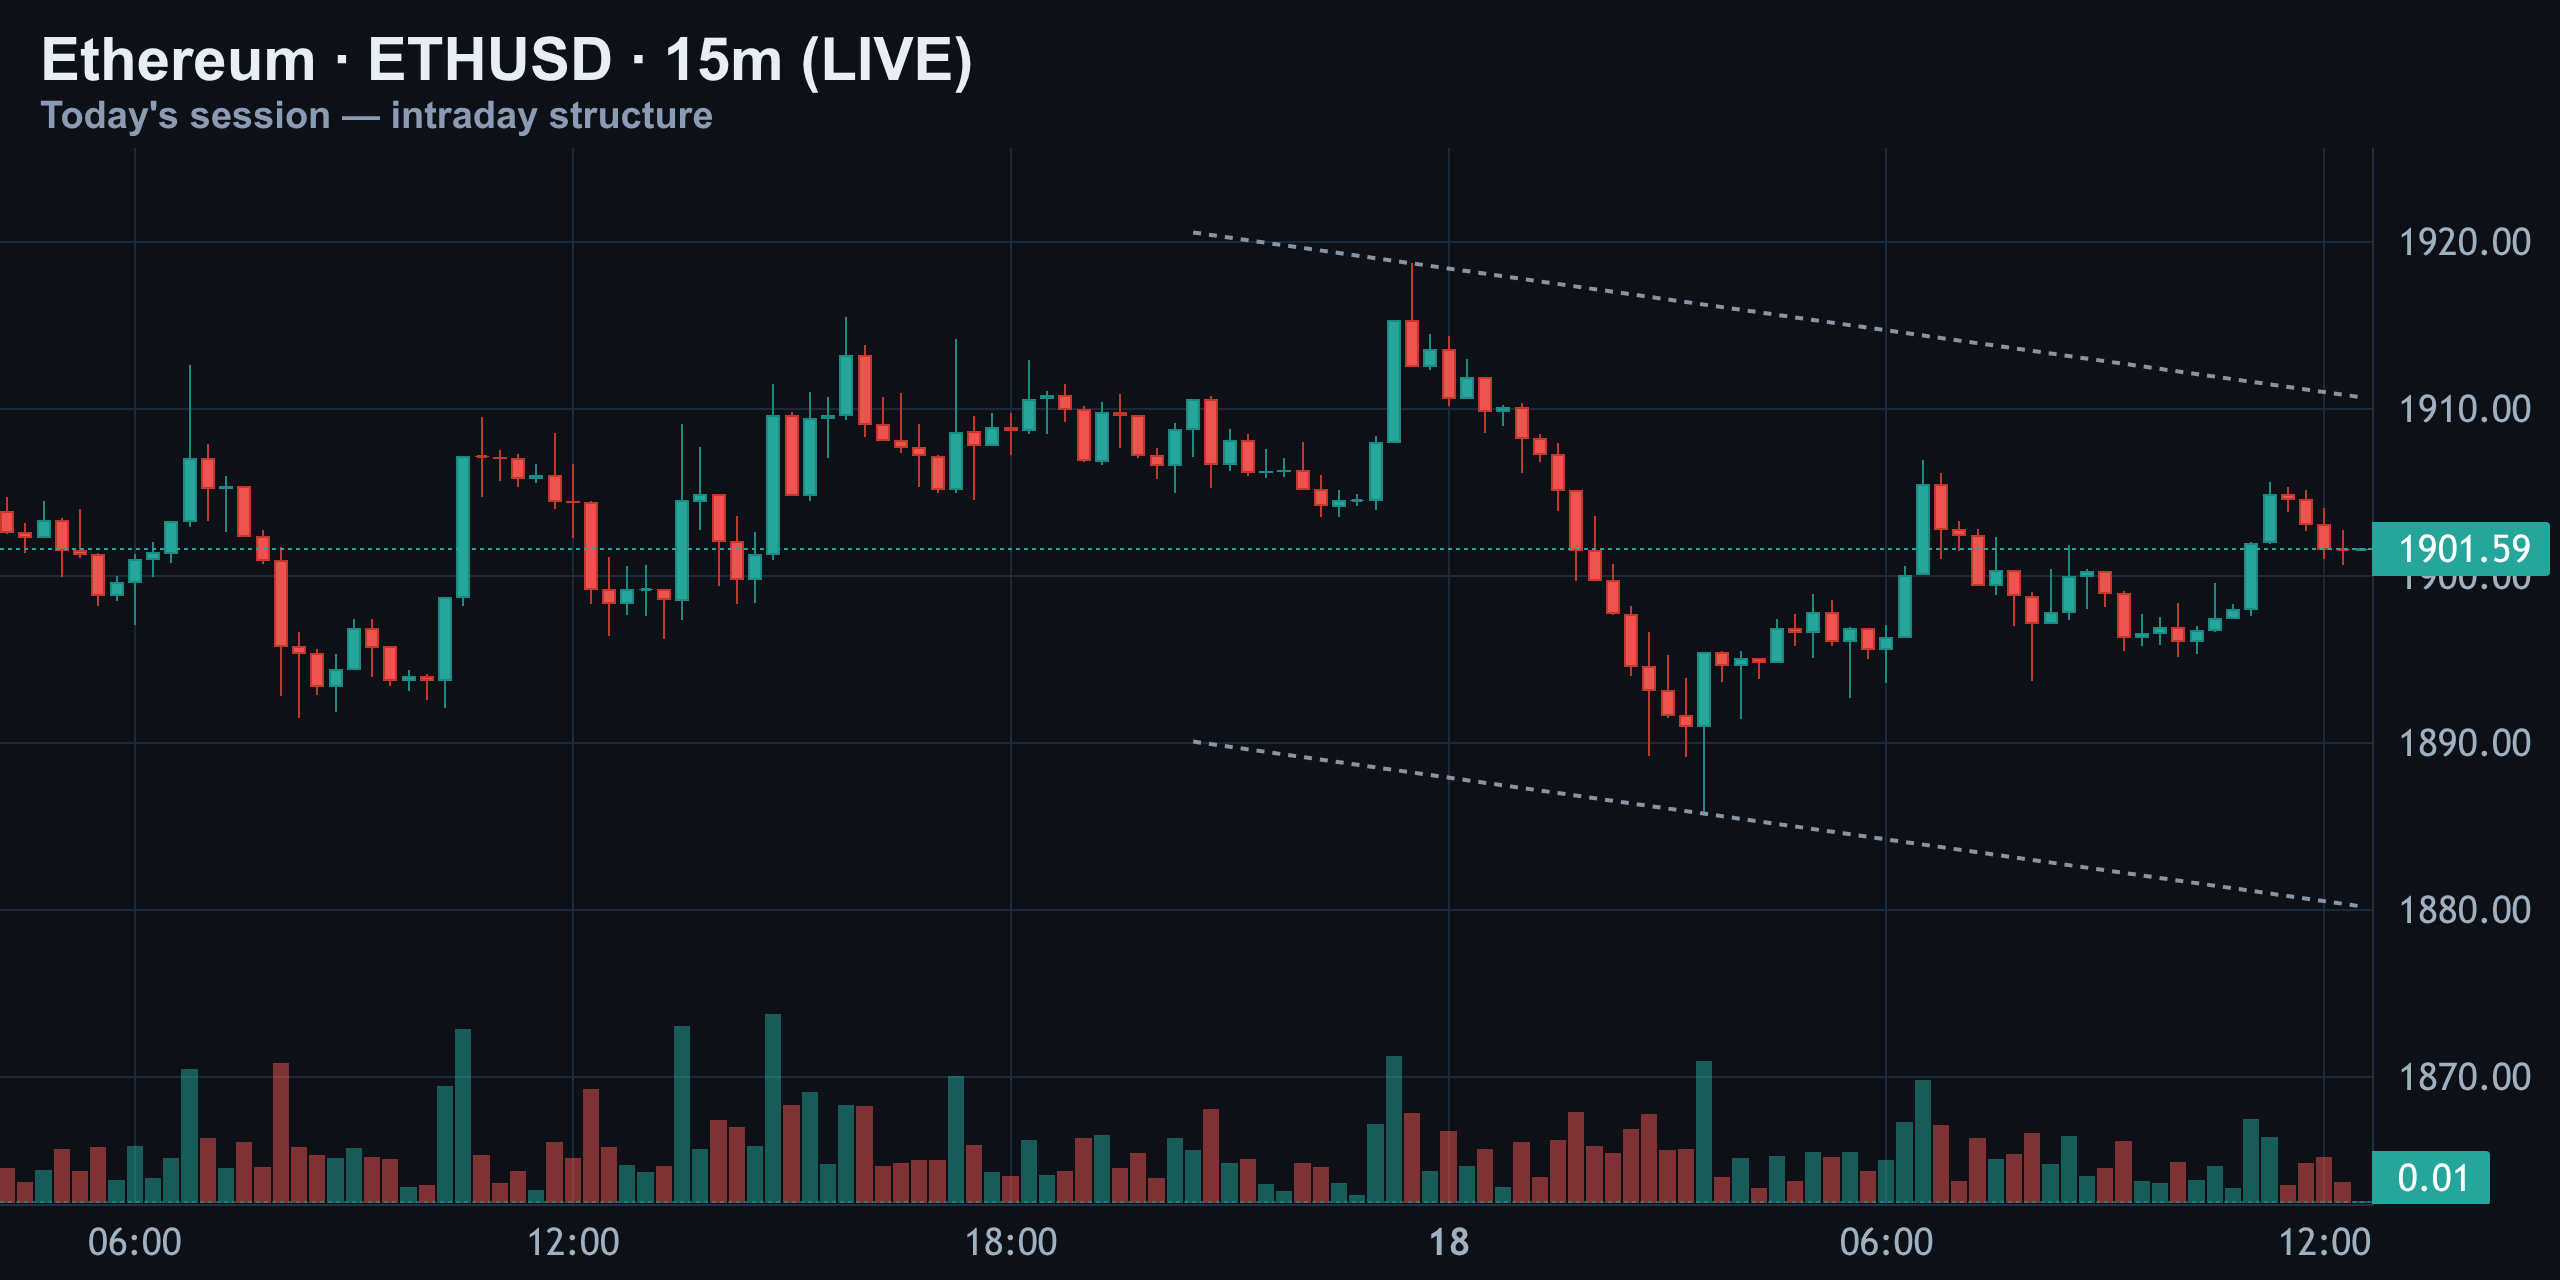
On the 15-minute chart, Ethereum has been drawing lower highs since the overnight session, boxed inside a gently falling channel. Price tagged the top of that channel near $1,919, got rejected, and has been grinding back toward the middle since — right where it's glued to the $1,901 line, today's volume-weighted anchor.
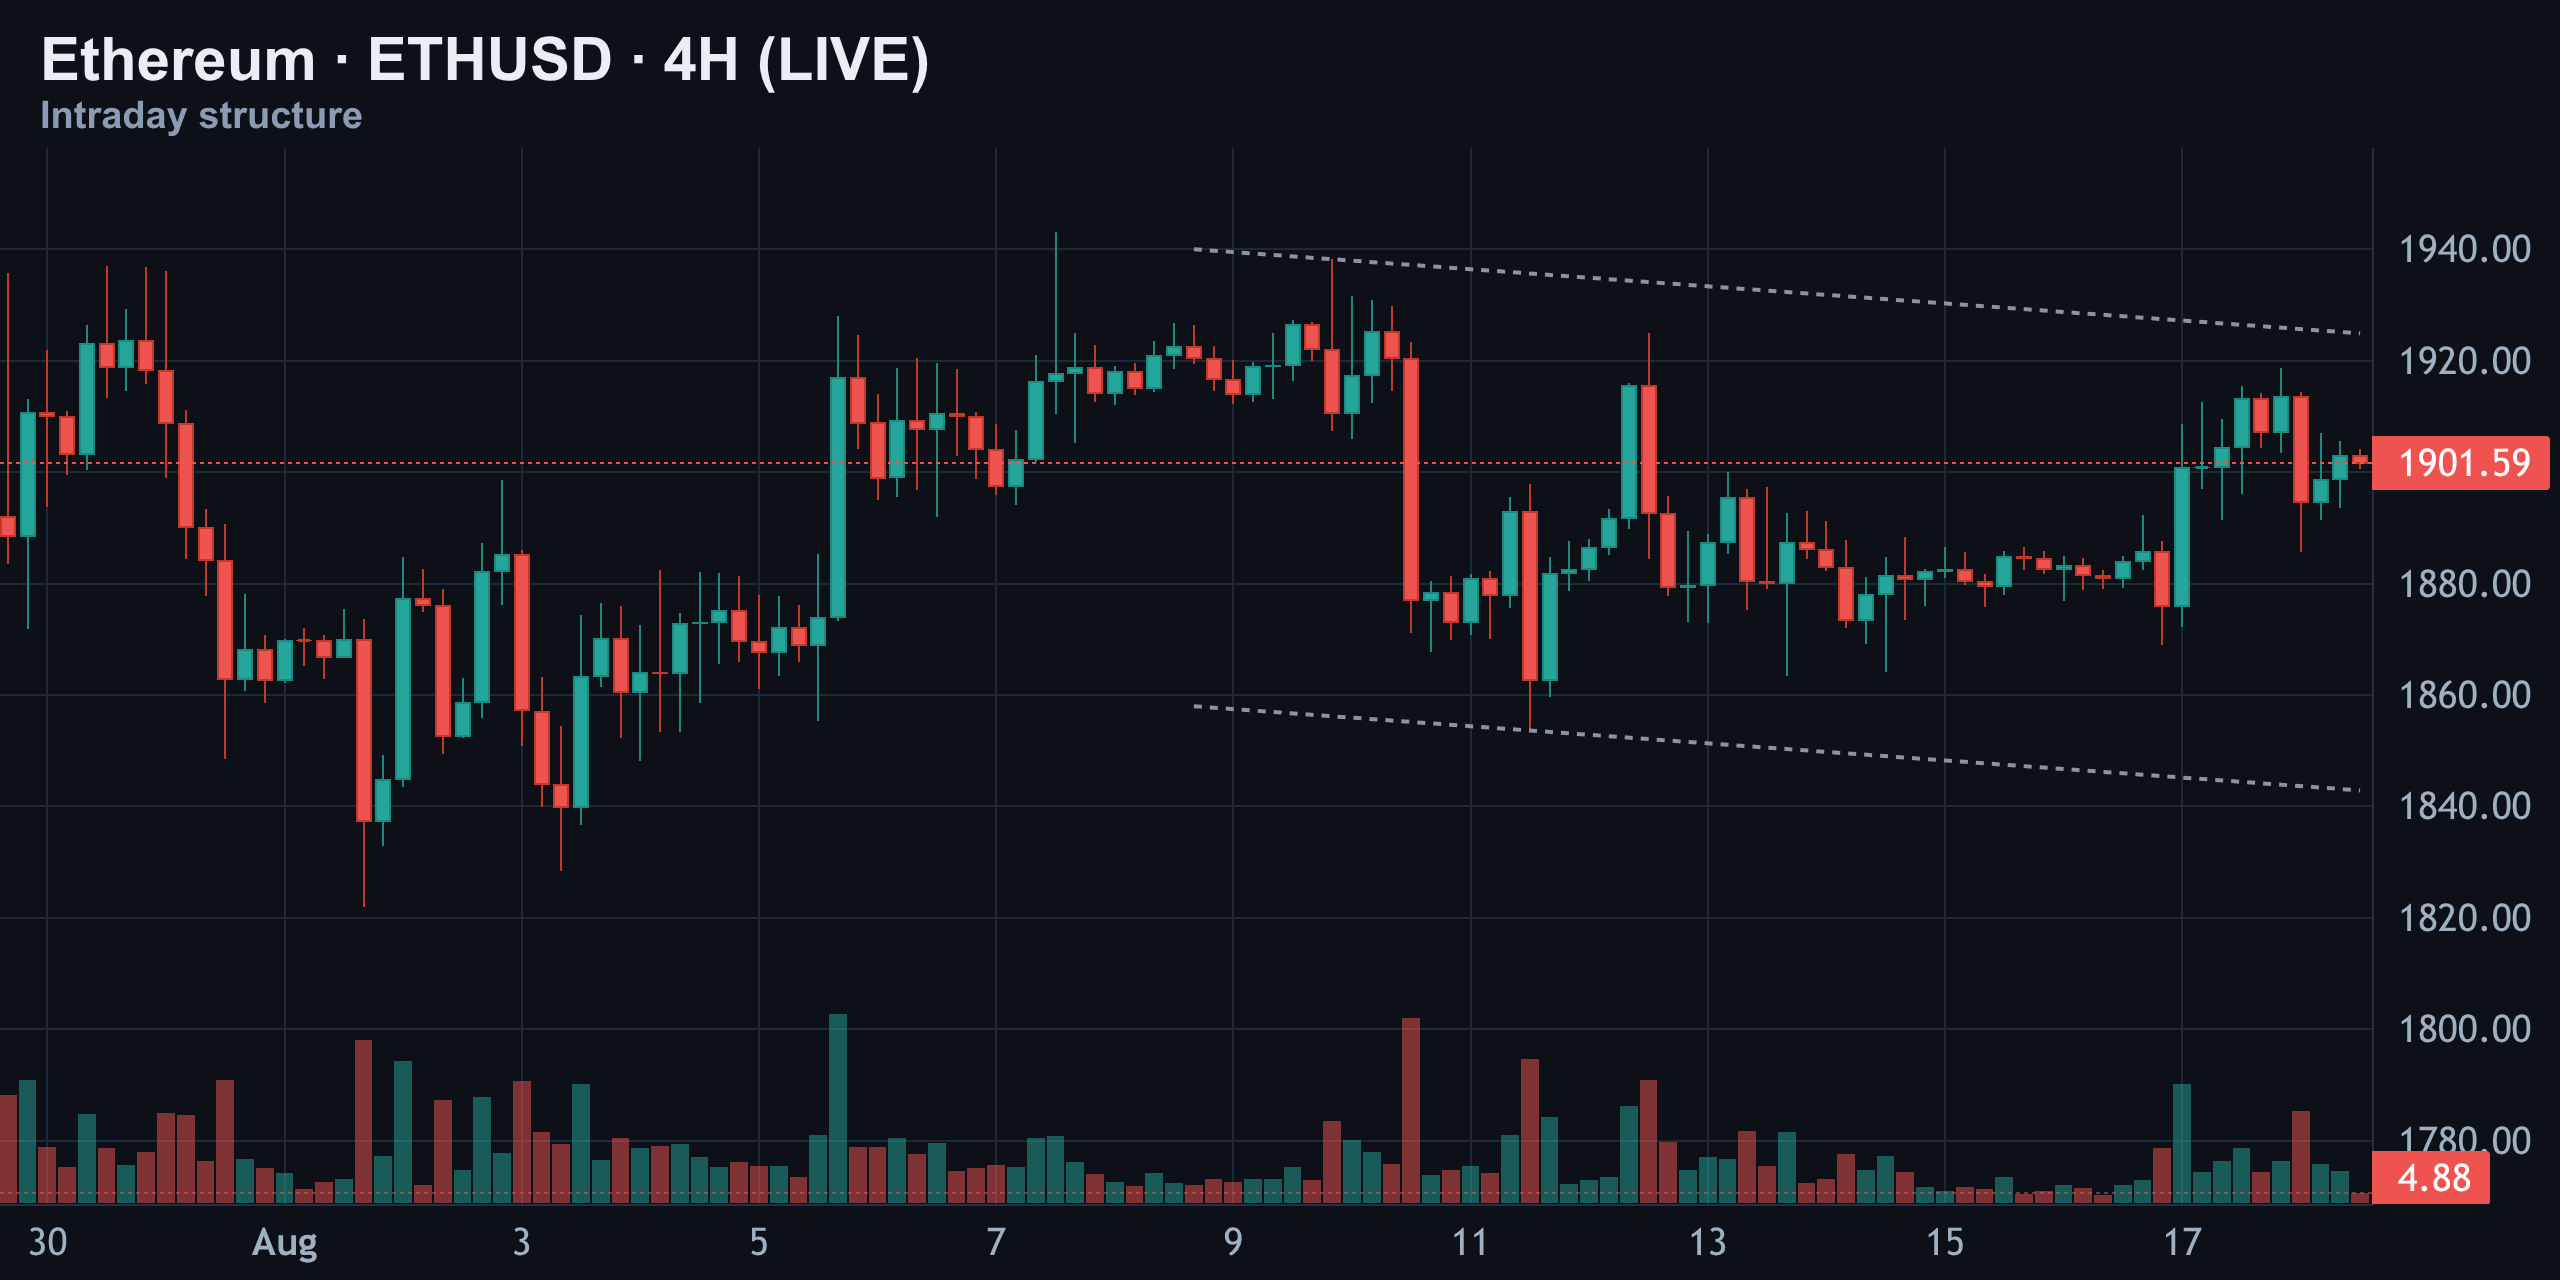
Zoom out to 4-hour candles and the same falling channel shows up, just wider — stretching from the August 9 peak near $1,943 down through today. In between, ETH dropped hard to around $1,841 before buyers stepped back in and clawed price back above $1,900. That whole move reads like a shakeout, not a breakdown.
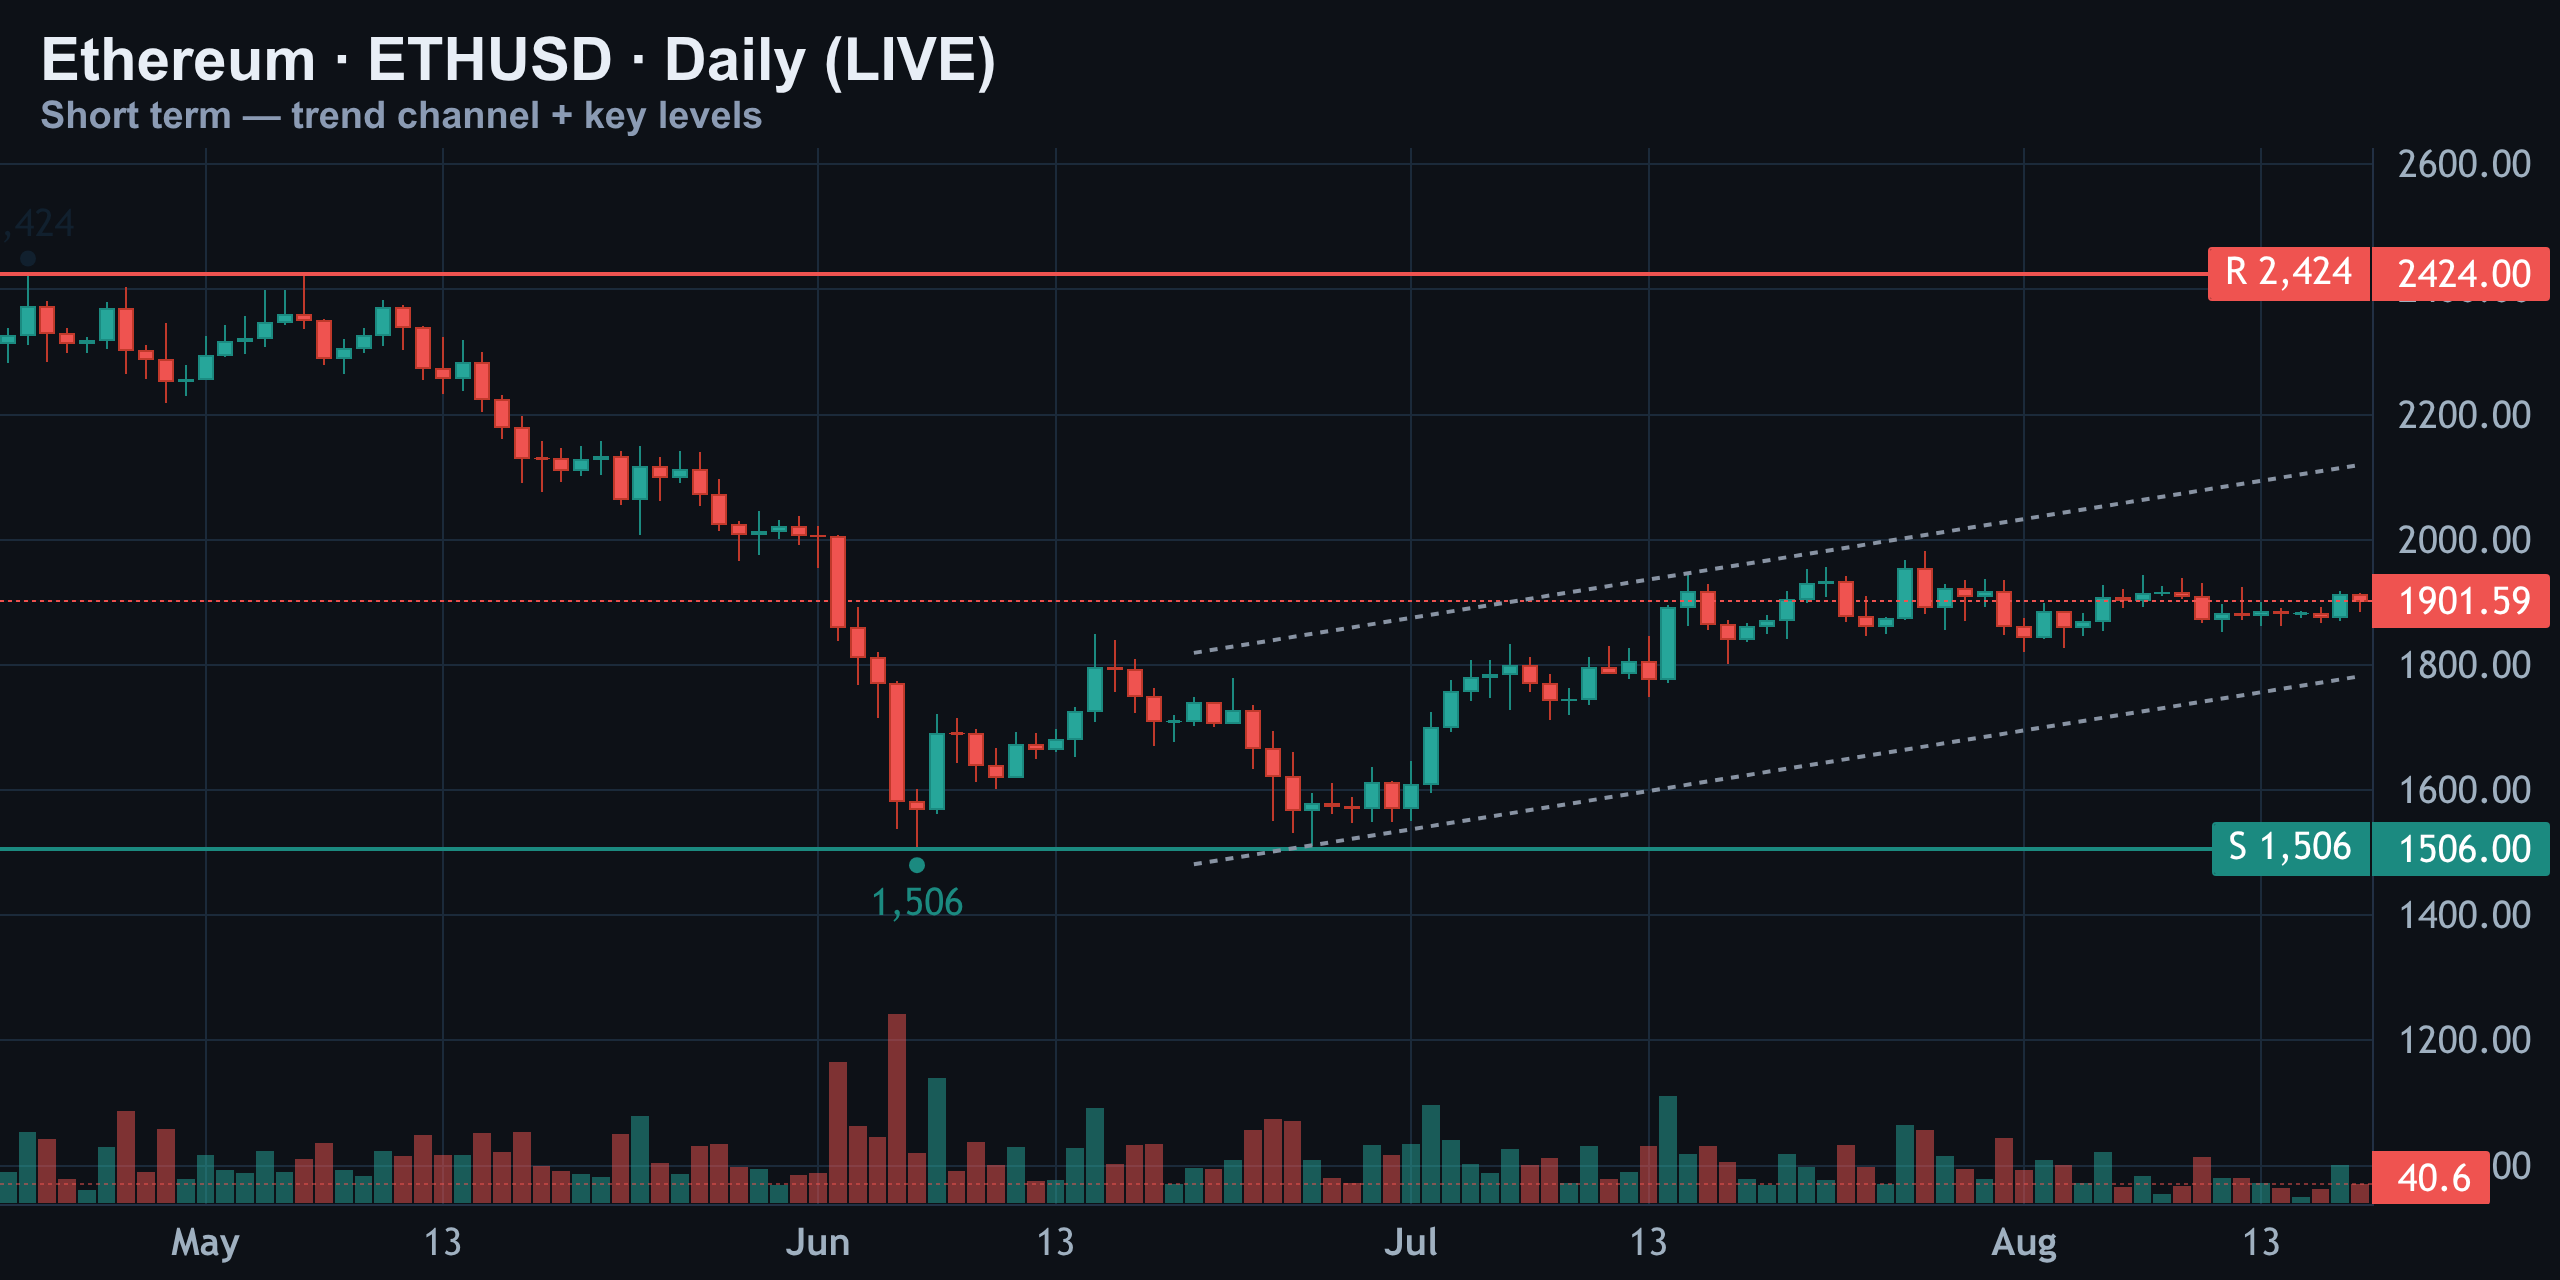
On the daily chart, Ethereum remains trapped between its 50-day and 200-day moving averages, exactly as it was a week ago. Neither average has been decisively broken, and neither is close enough to force a cross. This is the definition of a coiling market, not a trending one.
Momentum Check — RSI and MACD Both Say: Nothing's Happening
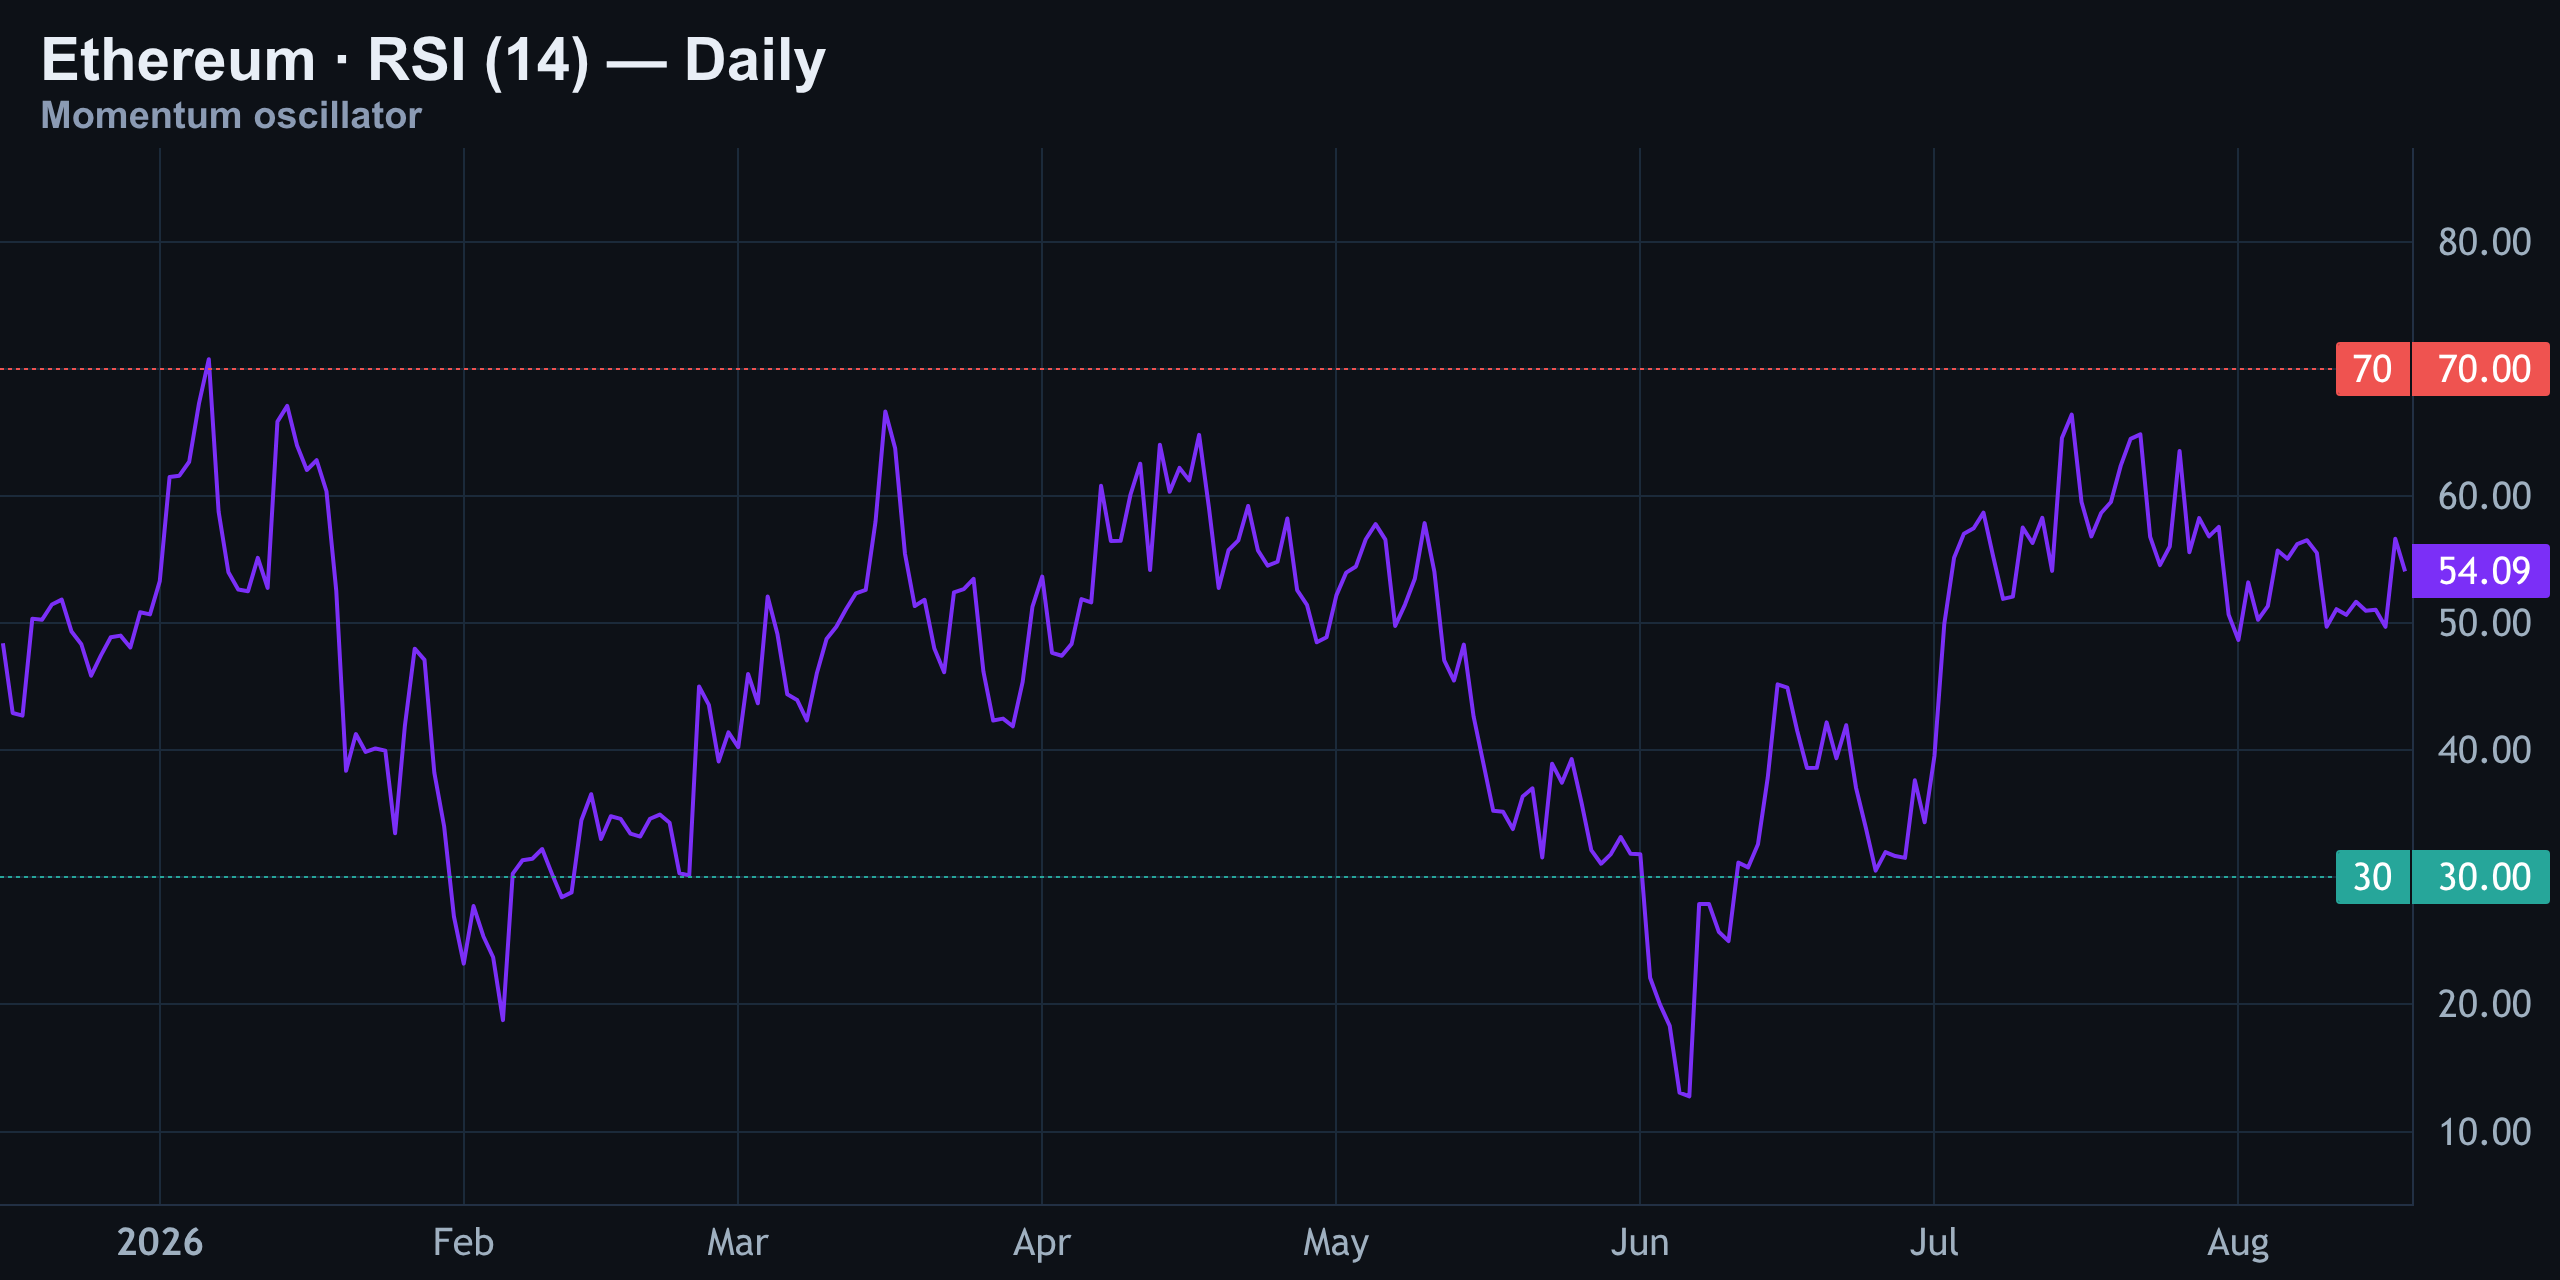
RSI (14) is sitting dead center, offering no directional edge whatsoever. That's consistent with everything else on the board today — a market that isn't oversold, isn't overbought, and isn't leaning.
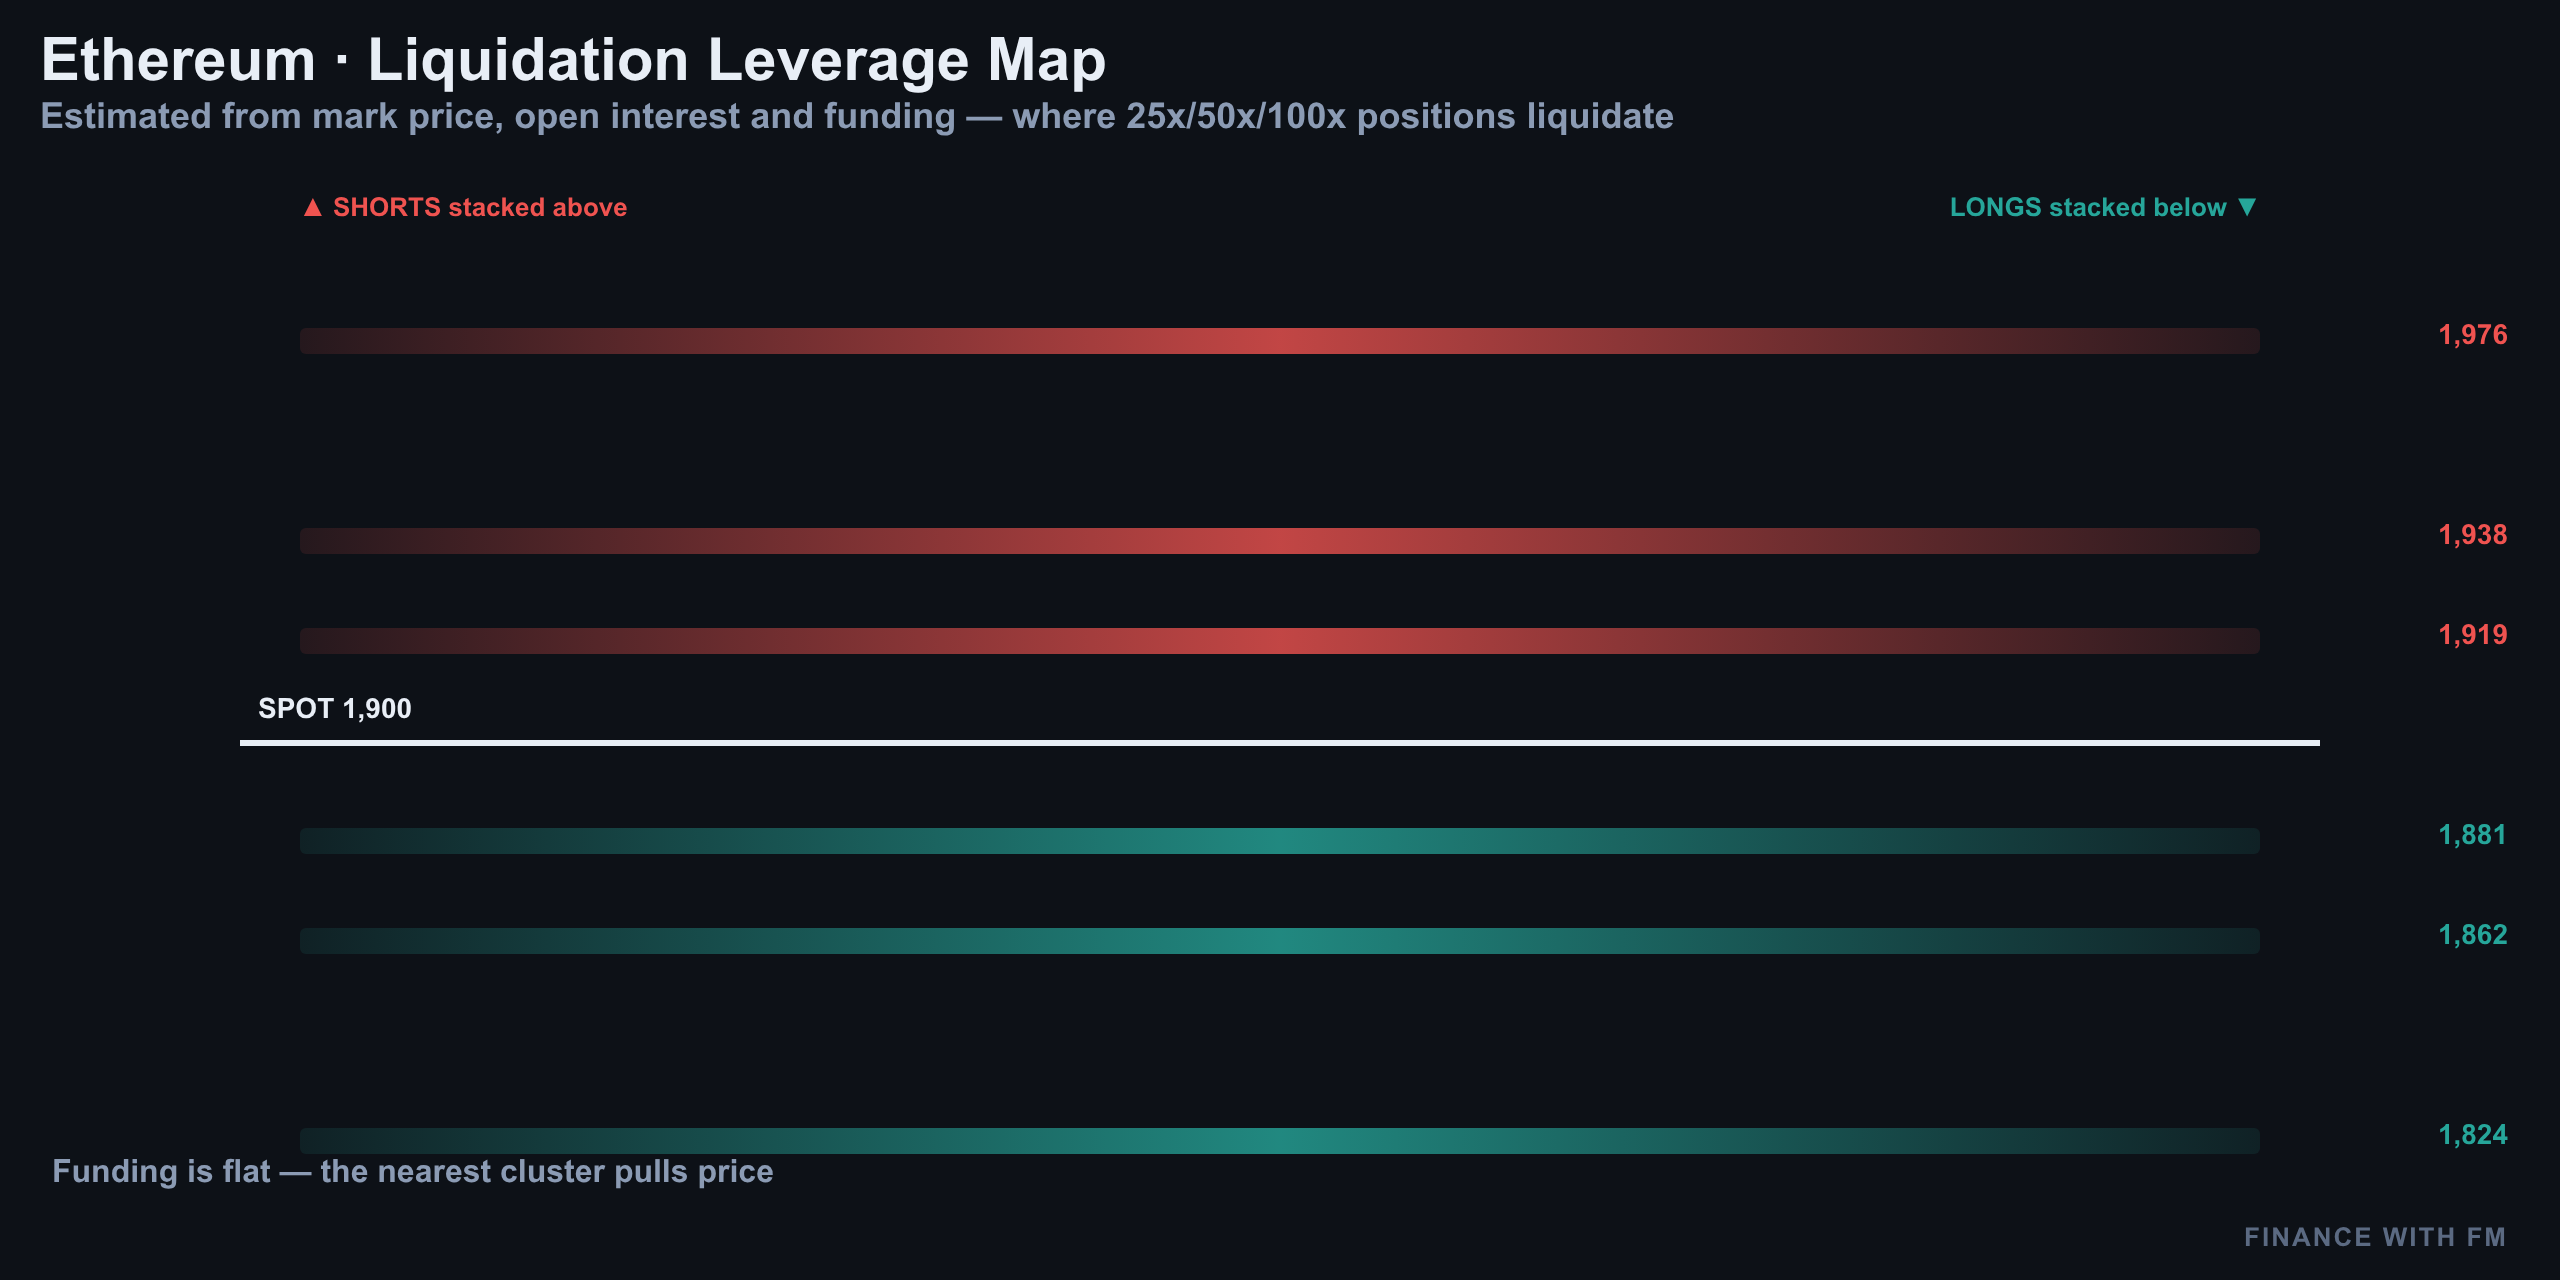
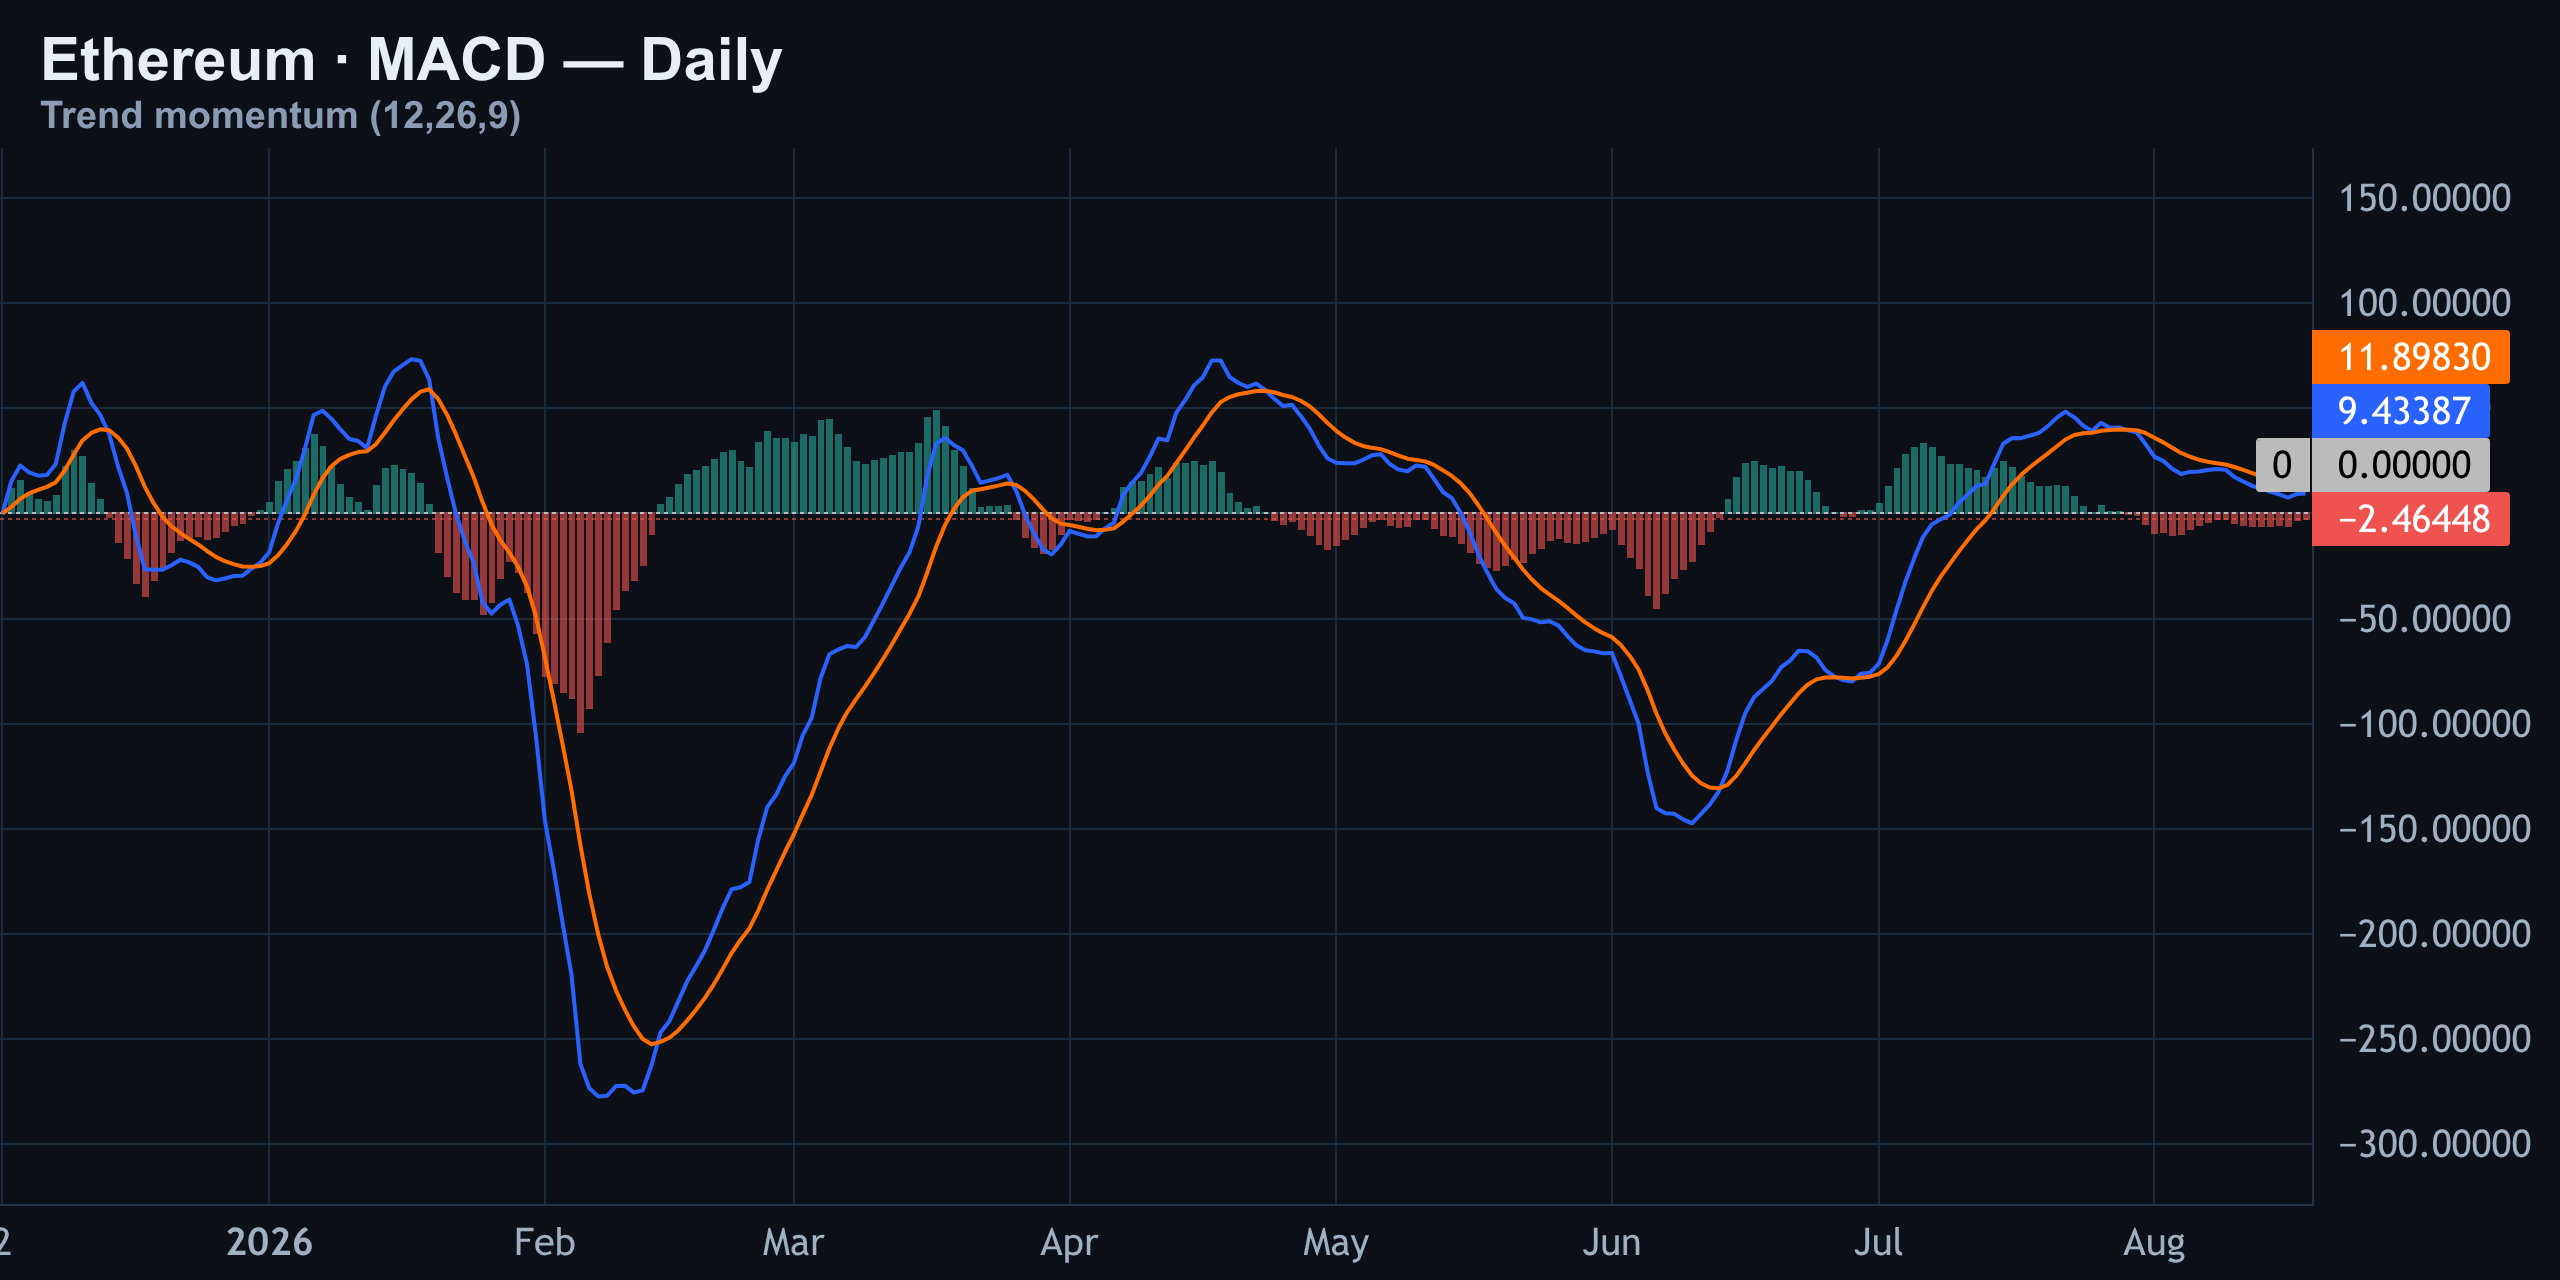
MACD is more interesting: it has quietly rolled over beneath the surface even while price itself hasn't blinked. That's a subtle momentum warning — not a signal to act on alone, but worth watching alongside the defensive options skew and the liquidation cluster below spot.
Levels to Watch & Why the Desk Is Standing Aside
| Level | Price | Why It Matters |
|---|---|---|
| Intraday range | $1,886 – $1,919 | Today's trading box |
| Volume-weighted anchor | $1,901 | Where price keeps getting pulled back to |
| Max pain (Aug 19) | $1,880 | Magnet into tomorrow's expiry |
| 1-sigma expected move (Aug 20) | $1,864 – $1,938 | High-probability band |
| Put wall / downside safety net | $1,700 | Dealer hedging floor |
| Call wall (mostly noise this week) | $2,500 | Upside ceiling for options flow |
| Options-implied ceiling (Aug 22) | $2,100 | ~0% probability above by curve |
Put it all together and there's no clean 1:2.5 risk-to-reward trade on the table today. Funding is flat, open interest is shrinking, RSI is dead center, and the falling channel that's held for over a week hasn't been broken in either direction. The one genuinely actionable signal — the MACD rollover — isn't loud enough on its own to justify a position against a defensively-skewed options board.
Summary — Pinned, Coiling, and Waiting on a Breakout
Ethereum on August 18, 2026 is almost exactly where it was seven days ago: pinned near $1,901, boxed inside a falling channel across the 15-minute, 4-hour, and daily timeframes, with RSI offering no edge and MACD quietly rolling over beneath a calm-looking surface.
- Price is up about 0.6% over the week, but still trapped between the 50-day and 200-day moving averages
- Options are pricing a defensive downside skew (+12.3%) even as the volume put-call ratio (0.26) leans bullish
- Implied volatility (45.8%) is running well above realized volatility (26.4%) — a 19-point vol-risk-premium
- The market sees essentially zero chance of ETH above $2,100 by August 22
- Whale flow near-term is balanced; the real conviction trades are stacked out on the December expiry
- No 1:2.5 setup exists today — the desk is standing aside until the channel breaks
The level that changes everything is the bottom of that falling channel paired with the liquidation cluster below spot. A clean break there — or a decisive push through $1,919 — is what flips this from a coiling, wait-and-watch tape into a real, tradable move.
Previous days
08/11/2026 — Ethereum Daily Pulse Aug 11: Pinned Between the Averages
Ethereum Daily Pulse Aug 11: Pinned Between the Averages
Desk Snapshot: ETH Pinned at $1,890
Ethereum is trading right around $1,890 today, down a little over 1% on the session after swinging between roughly $1,868 and $1,916. Independent price feeds put spot in a nearly identical band — Yahoo Finance shows ETH closing near $1,875 after an intraday high of $1,879 and low of $1,870, while Investing.com has it printing $1,877 against a prior close of $1,925. Fortune's morning snapshot the day before had ETH at $1,916.73, underscoring just how much chop has happened in a 24-hour window without price actually going anywhere.
That's the whole story of today's session in one sentence: a lot of movement, very little progress. Ethereum isn't trending — it's coiled. Three forces are fighting for control underneath that flat surface: dealers sitting in positive gamma (which mechanically pins price), retail traders piling into longs (which is crowding one side of the boat), and whale options flow that's quietly leaning bearish. Something has to give.
The Options Board: A Battle of Two Walls
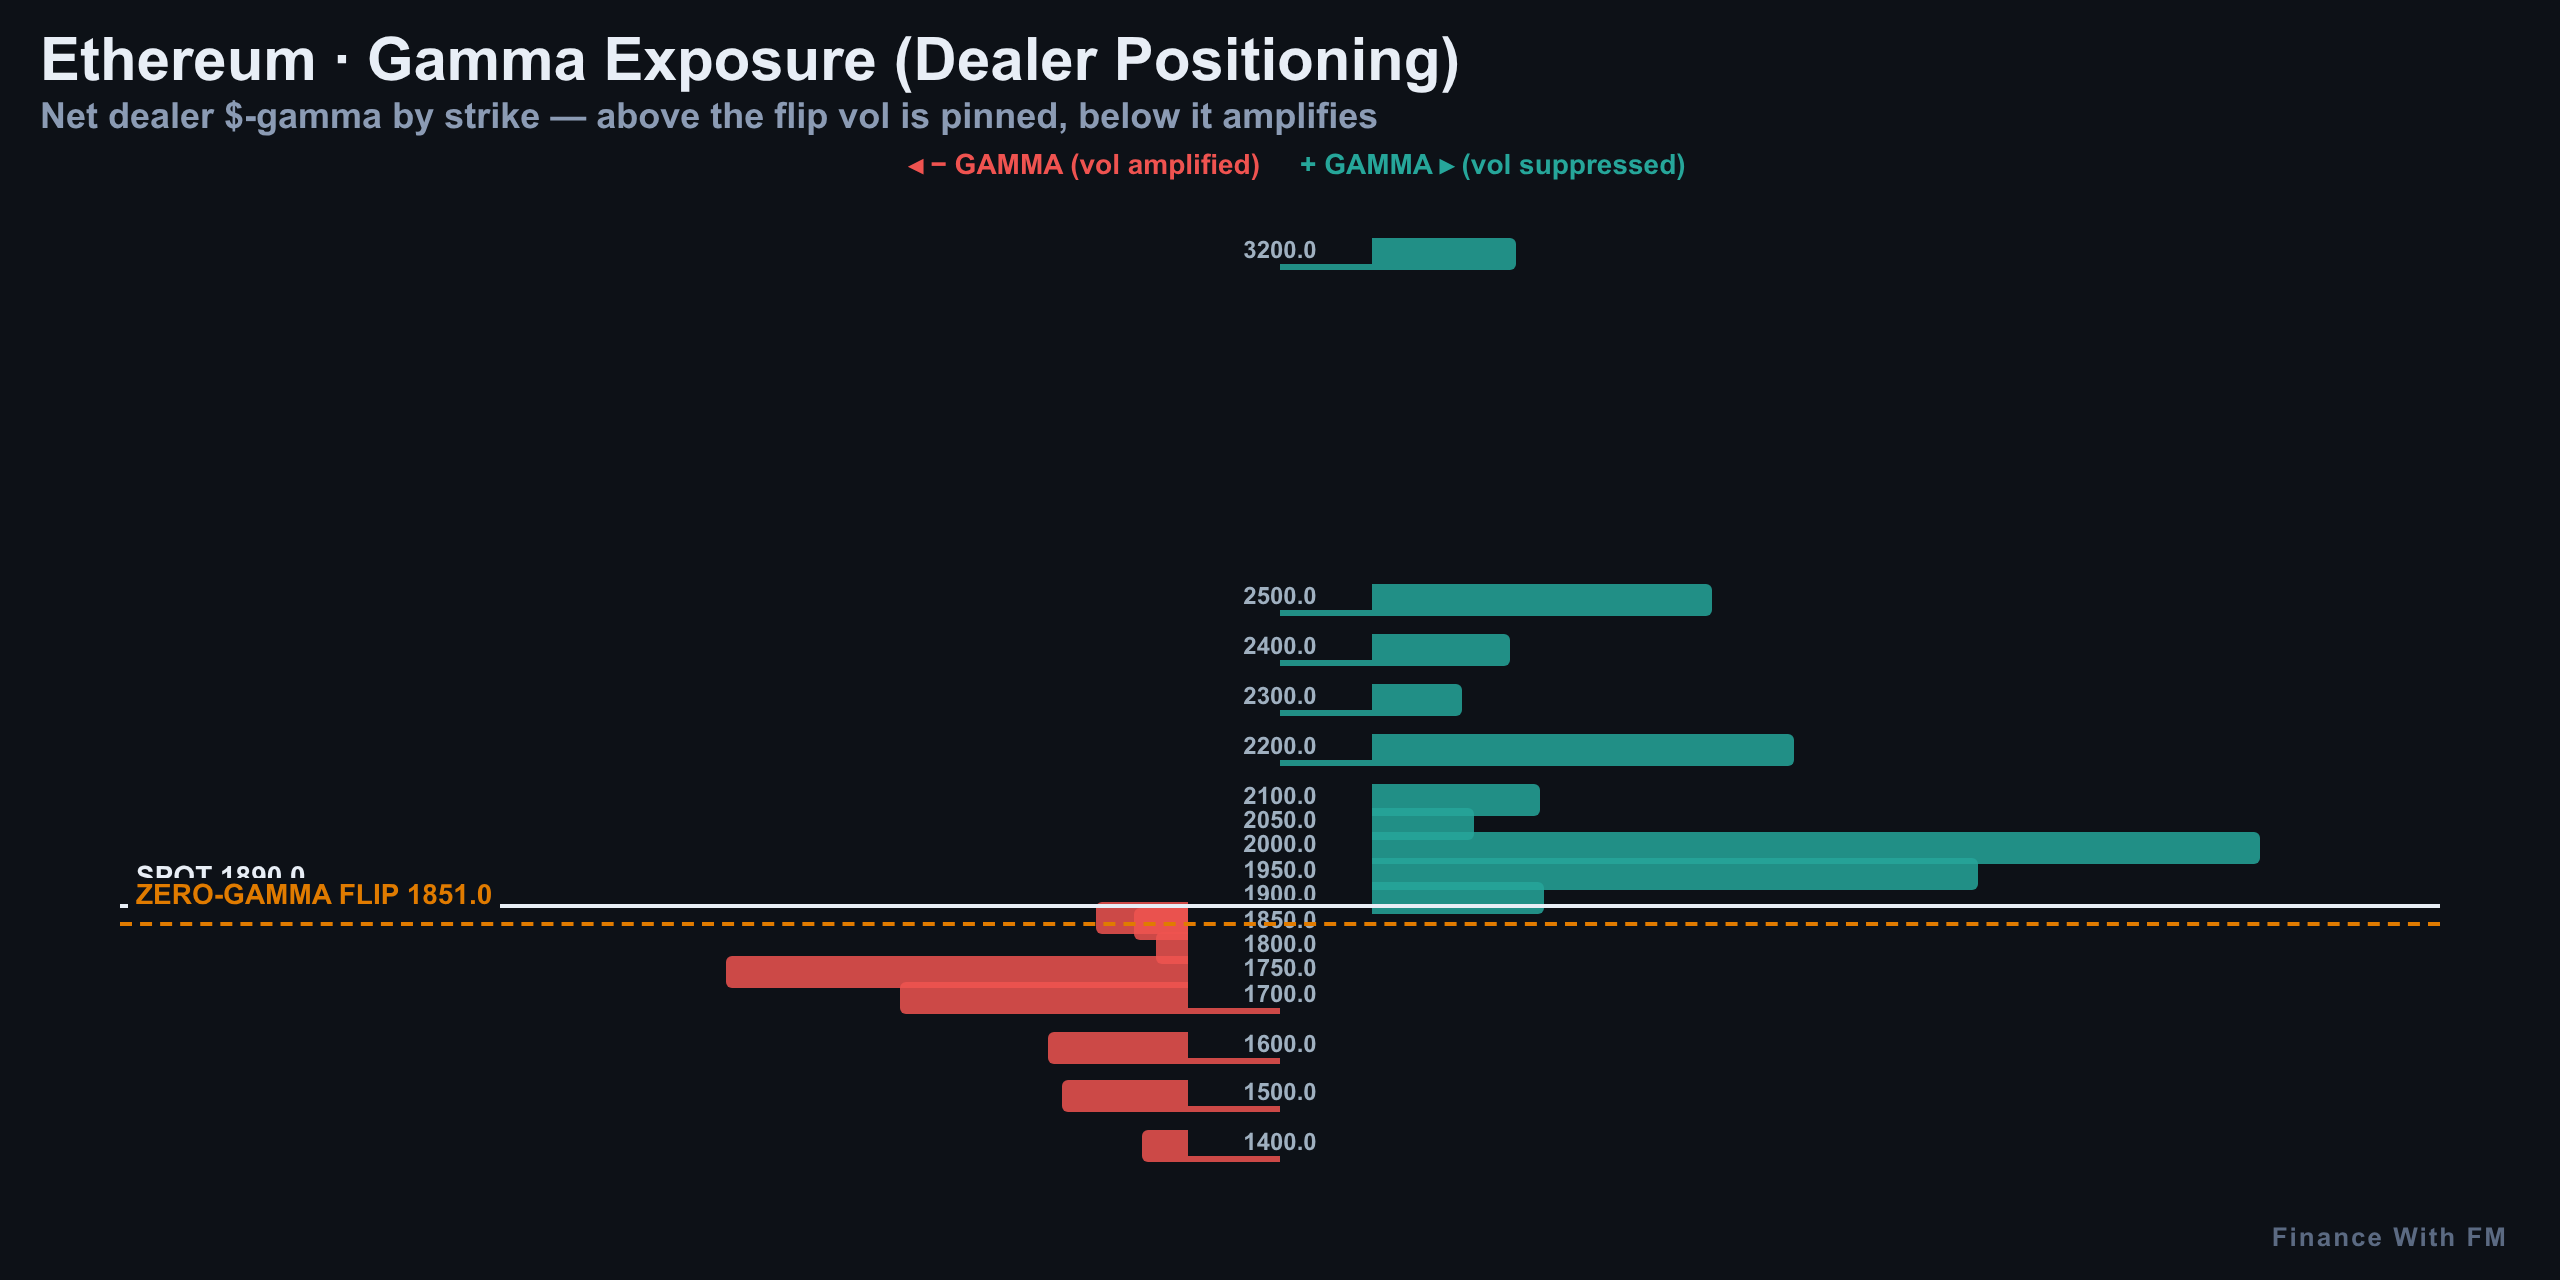
Zooming into the options chain tells you exactly where the tug-of-war lines are drawn. Open interest is heavier in calls than puts on paper, but the more telling number is what's actually trading today versus what's just sitting there from earlier in the month.
| Metric | Value |
|---|---|
| Put/Call Ratio (Open Interest) | 0.52 |
| Put/Call Ratio (Volume, today) | 0.65 |
| Max Pain (nearest expiry) | $1,900 |
| Call Wall (resistance) | $2,500 |
| Put Wall (support) | $1,000 |
A 0.52 put/call ratio by open interest looks bullish-leaning on the surface — more calls outstanding than puts. But today's volume ratio jumping to 0.65 tells you traders are actively hedging into this session, not chasing upside. Max pain sits almost exactly at spot, at $1,900, which typically acts like a magnet pulling price toward it into the close of an expiry cycle. The call wall way up at $2,500 is distant resistance, and the put wall at $1,000 is a deep insurance floor — neither is a near-term factor, but they frame the outer edges of where dealers have real skin in the game.
Volatility & Skew: Options Are Overpriced, and Fear Is in the Price
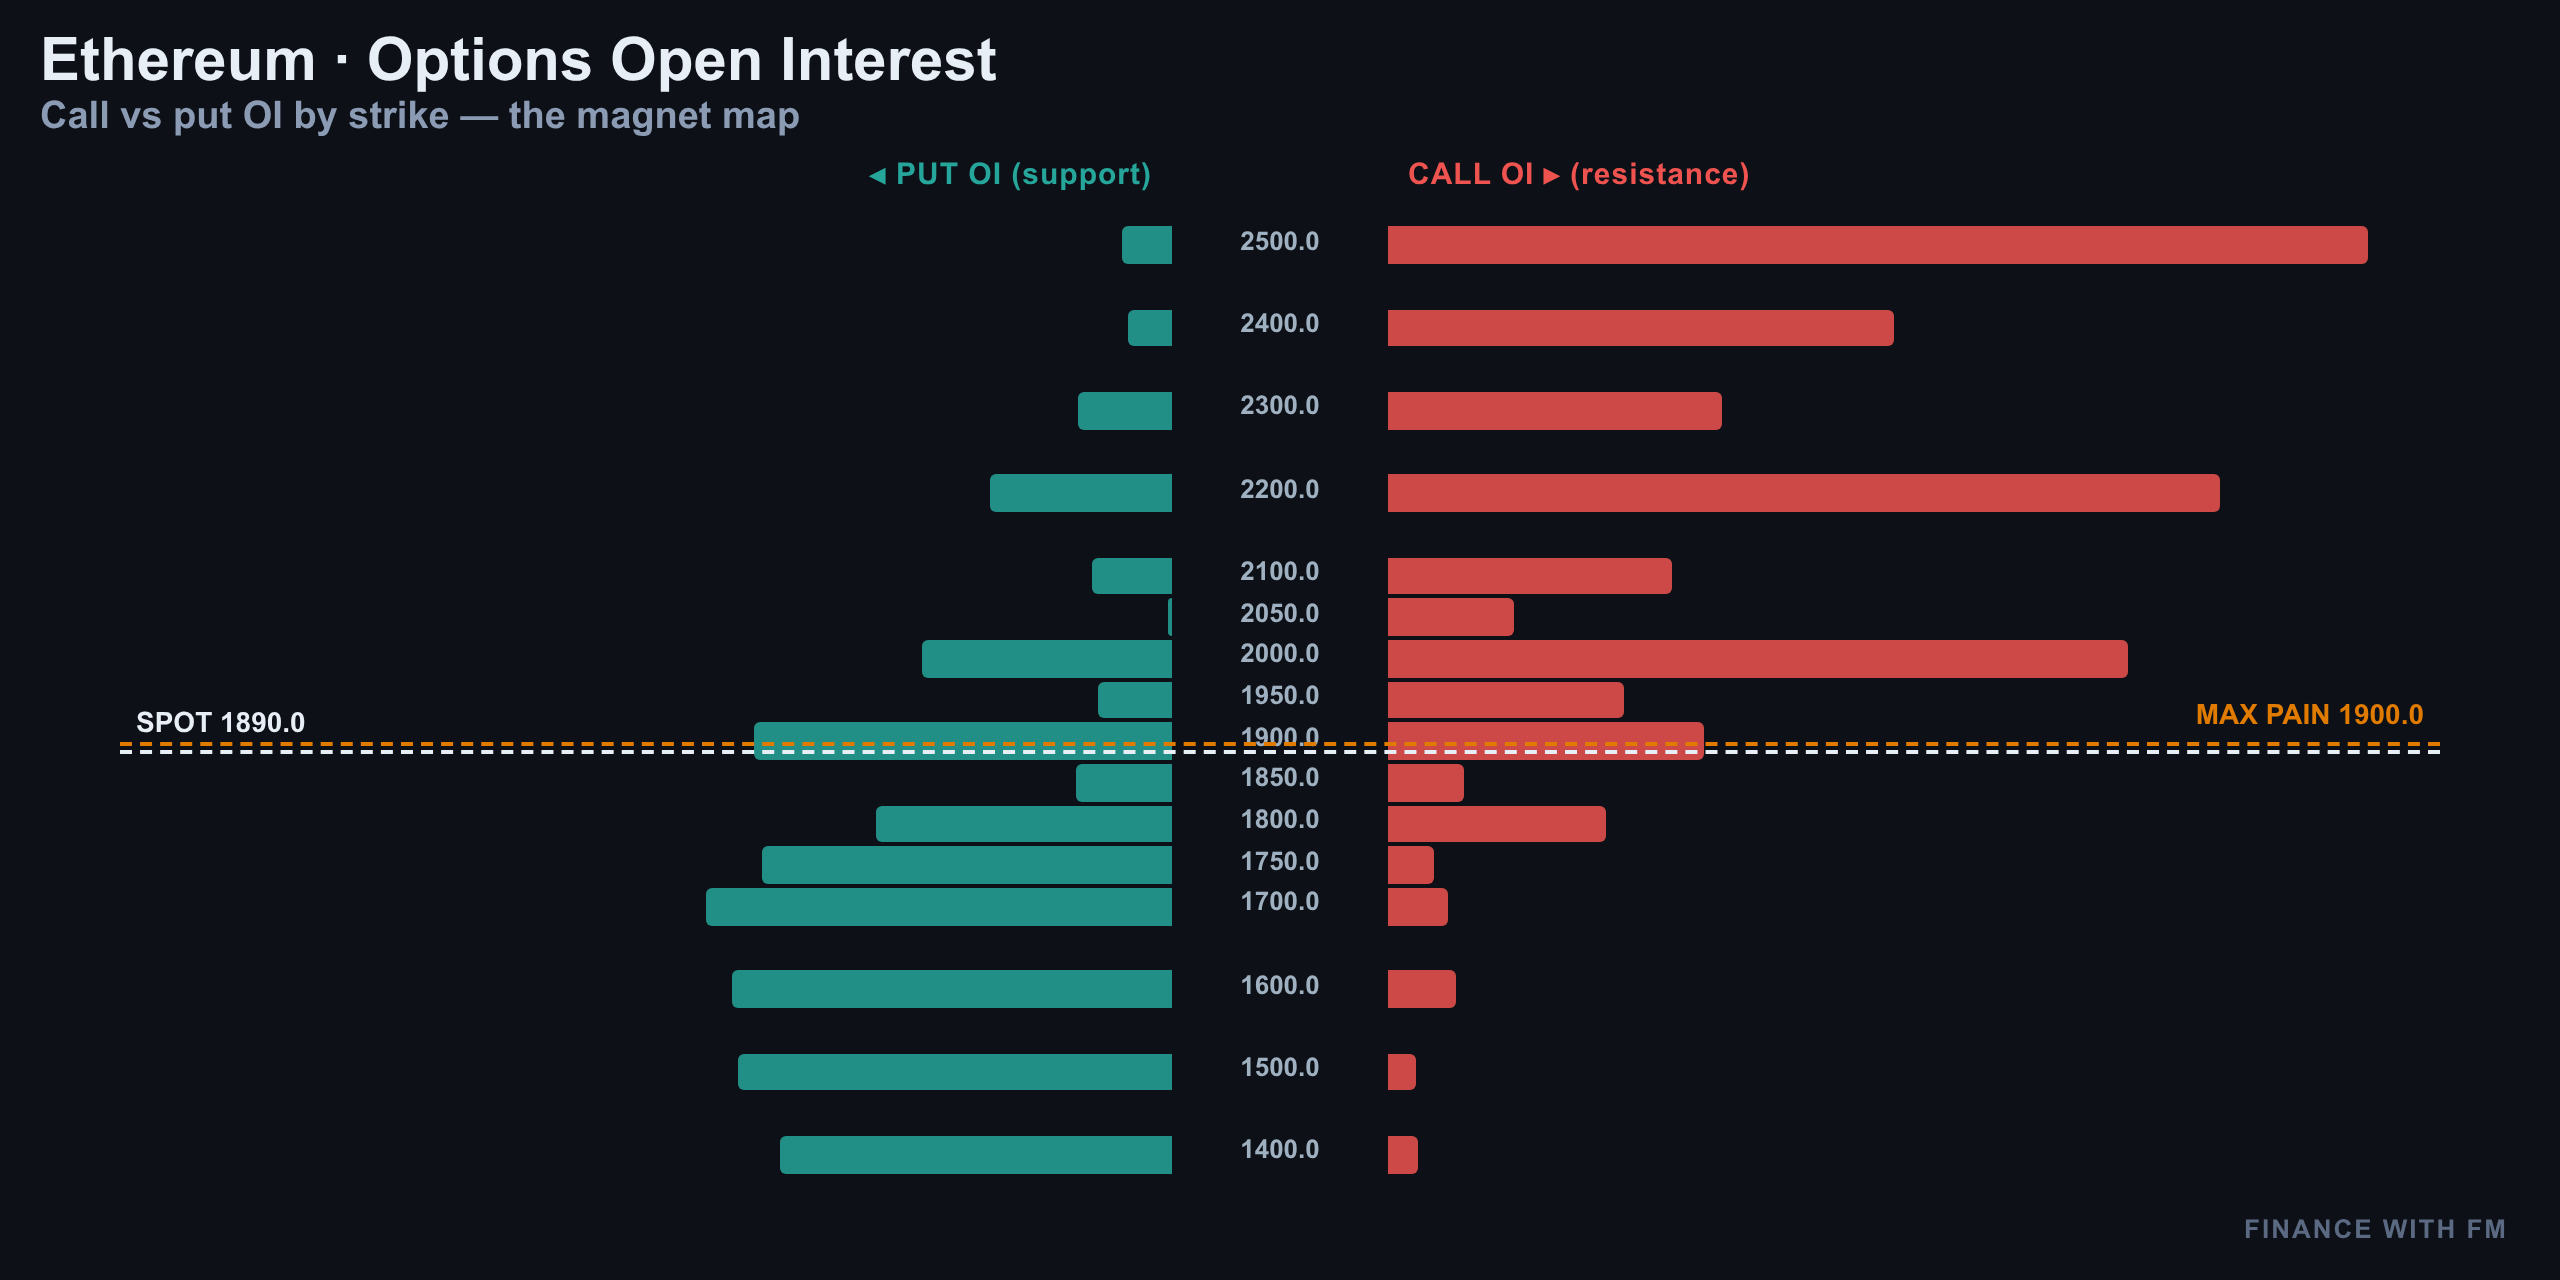
Implied volatility is running at 49.4% while realized volatility over the recent stretch is cooler at 37.5% — a vol risk premium of about 12 points. In plain English: options are pricing in more movement than Ethereum has actually delivered lately, which means they're expensive right now. That's a structural edge for premium sellers, but only if they respect what the skew is telling them.
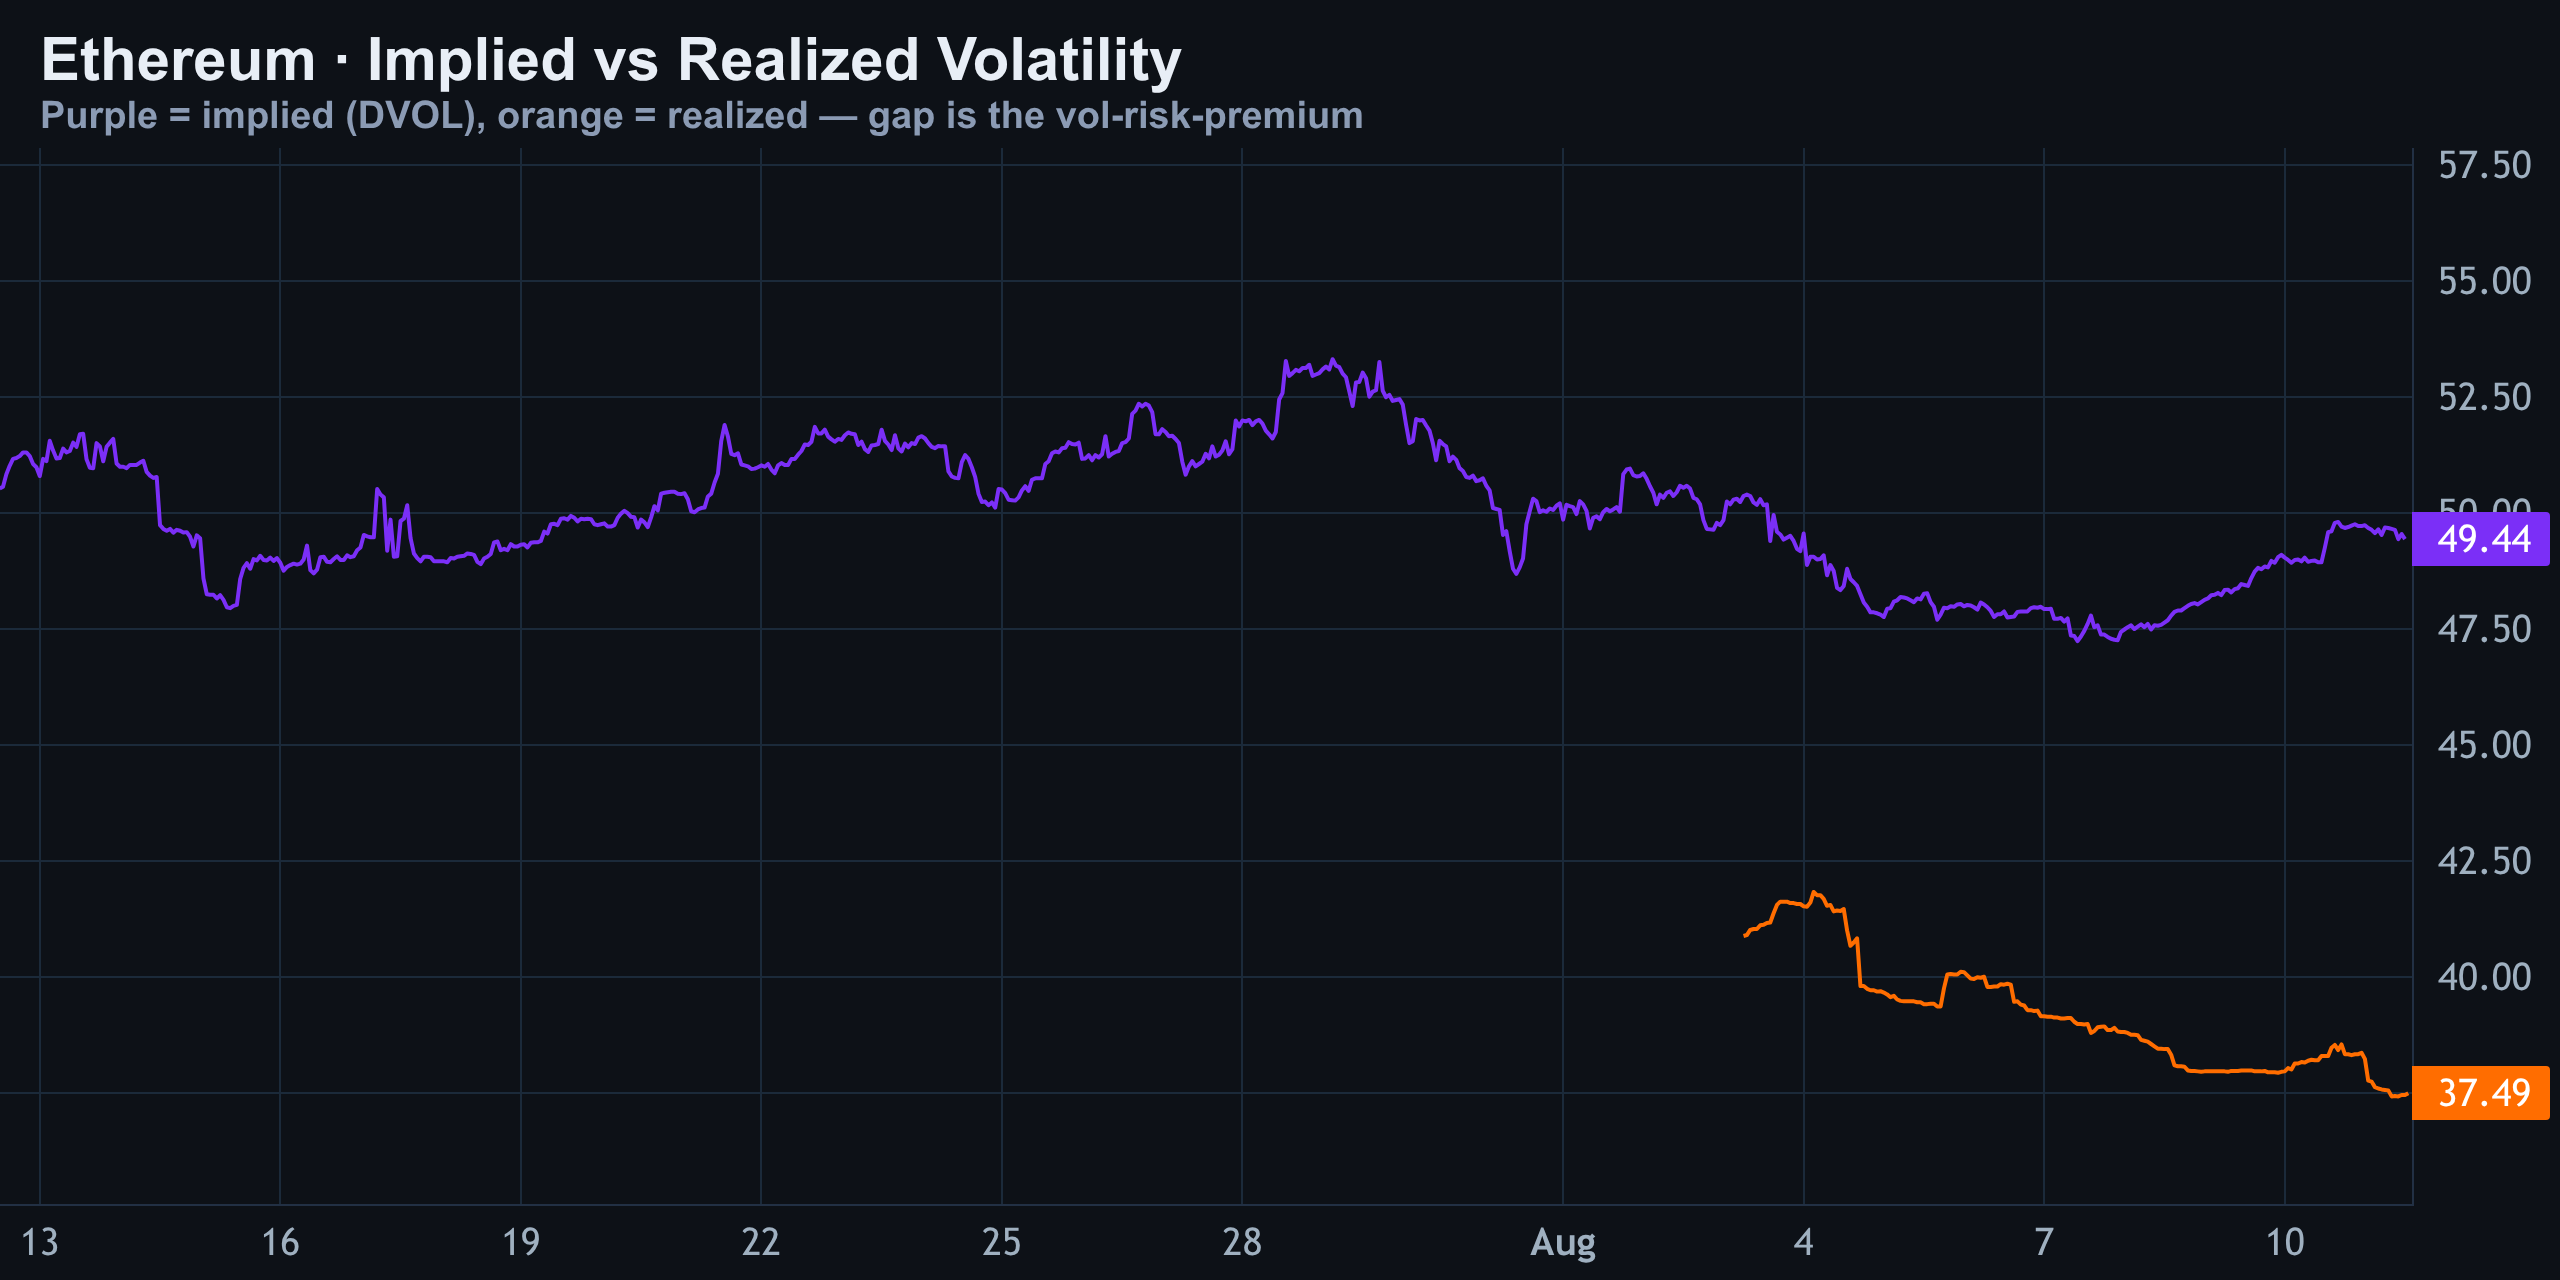
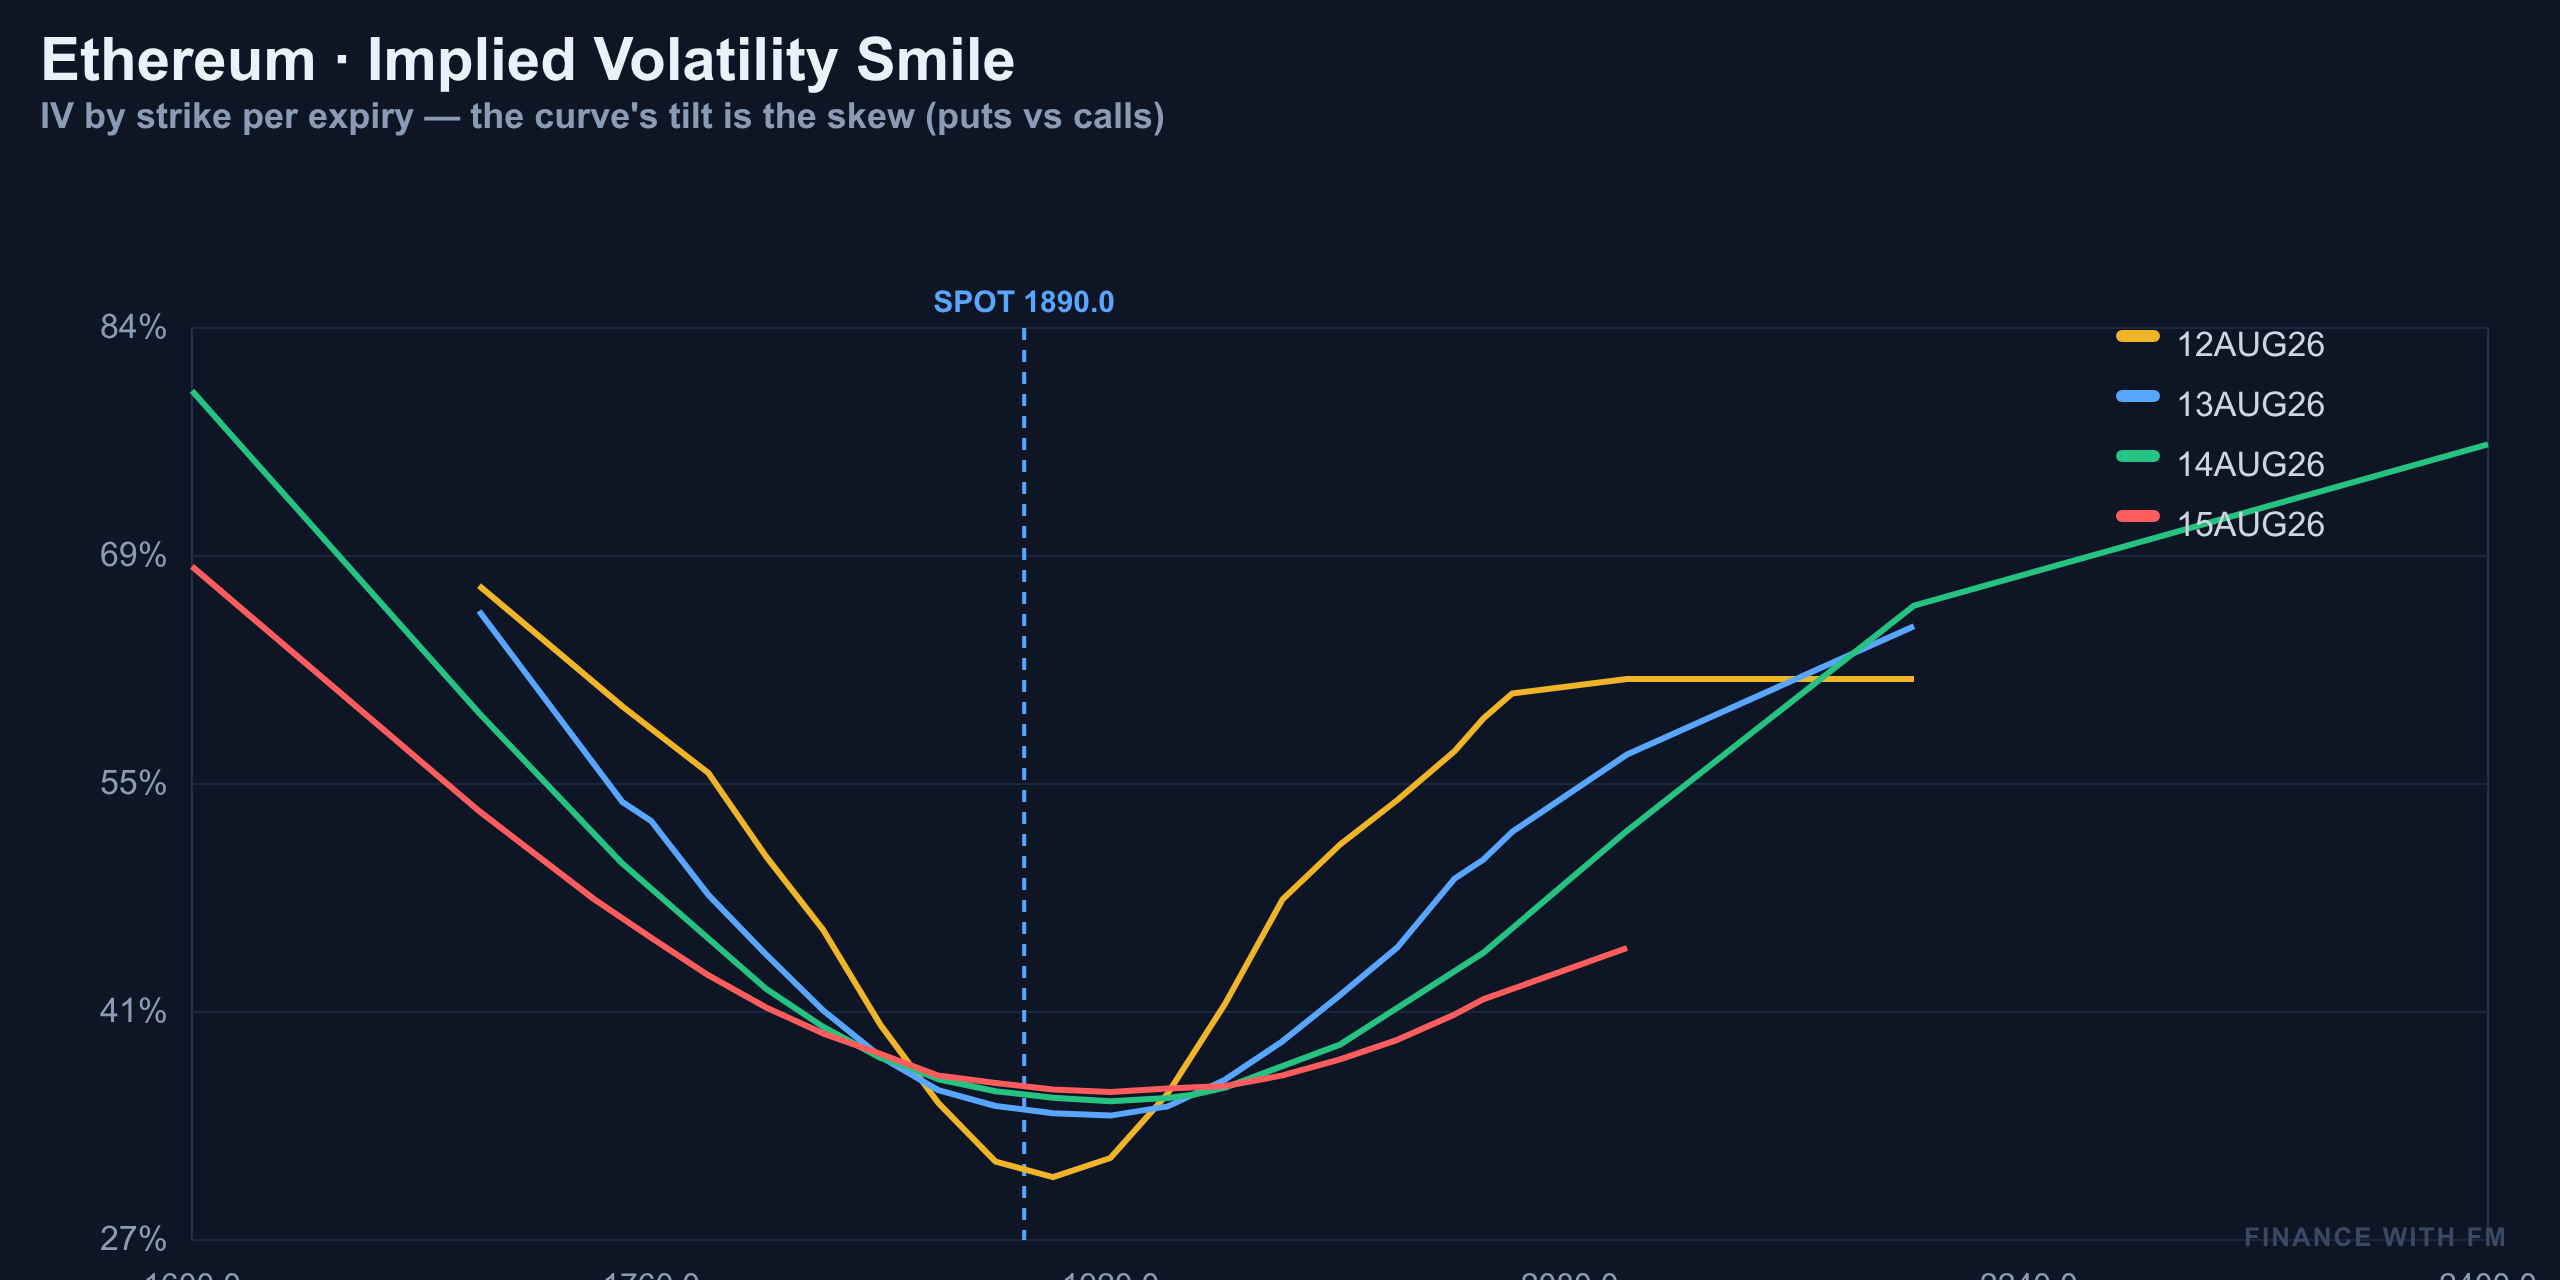
The 25-delta skew sits at +6.7%, with puts bid noticeably richer than equivalent calls. Look at the smile and that shows up as a steeper left side of the curve — market makers are charging more to insure against a drop than to chase a rally. That doesn't mean a crash is imminent; it means downside protection is in demand right now. When that curve flattens, or tilts back toward calls, that's usually the tell that fear is draining out of the market.
What the Options Market Actually Expects Next
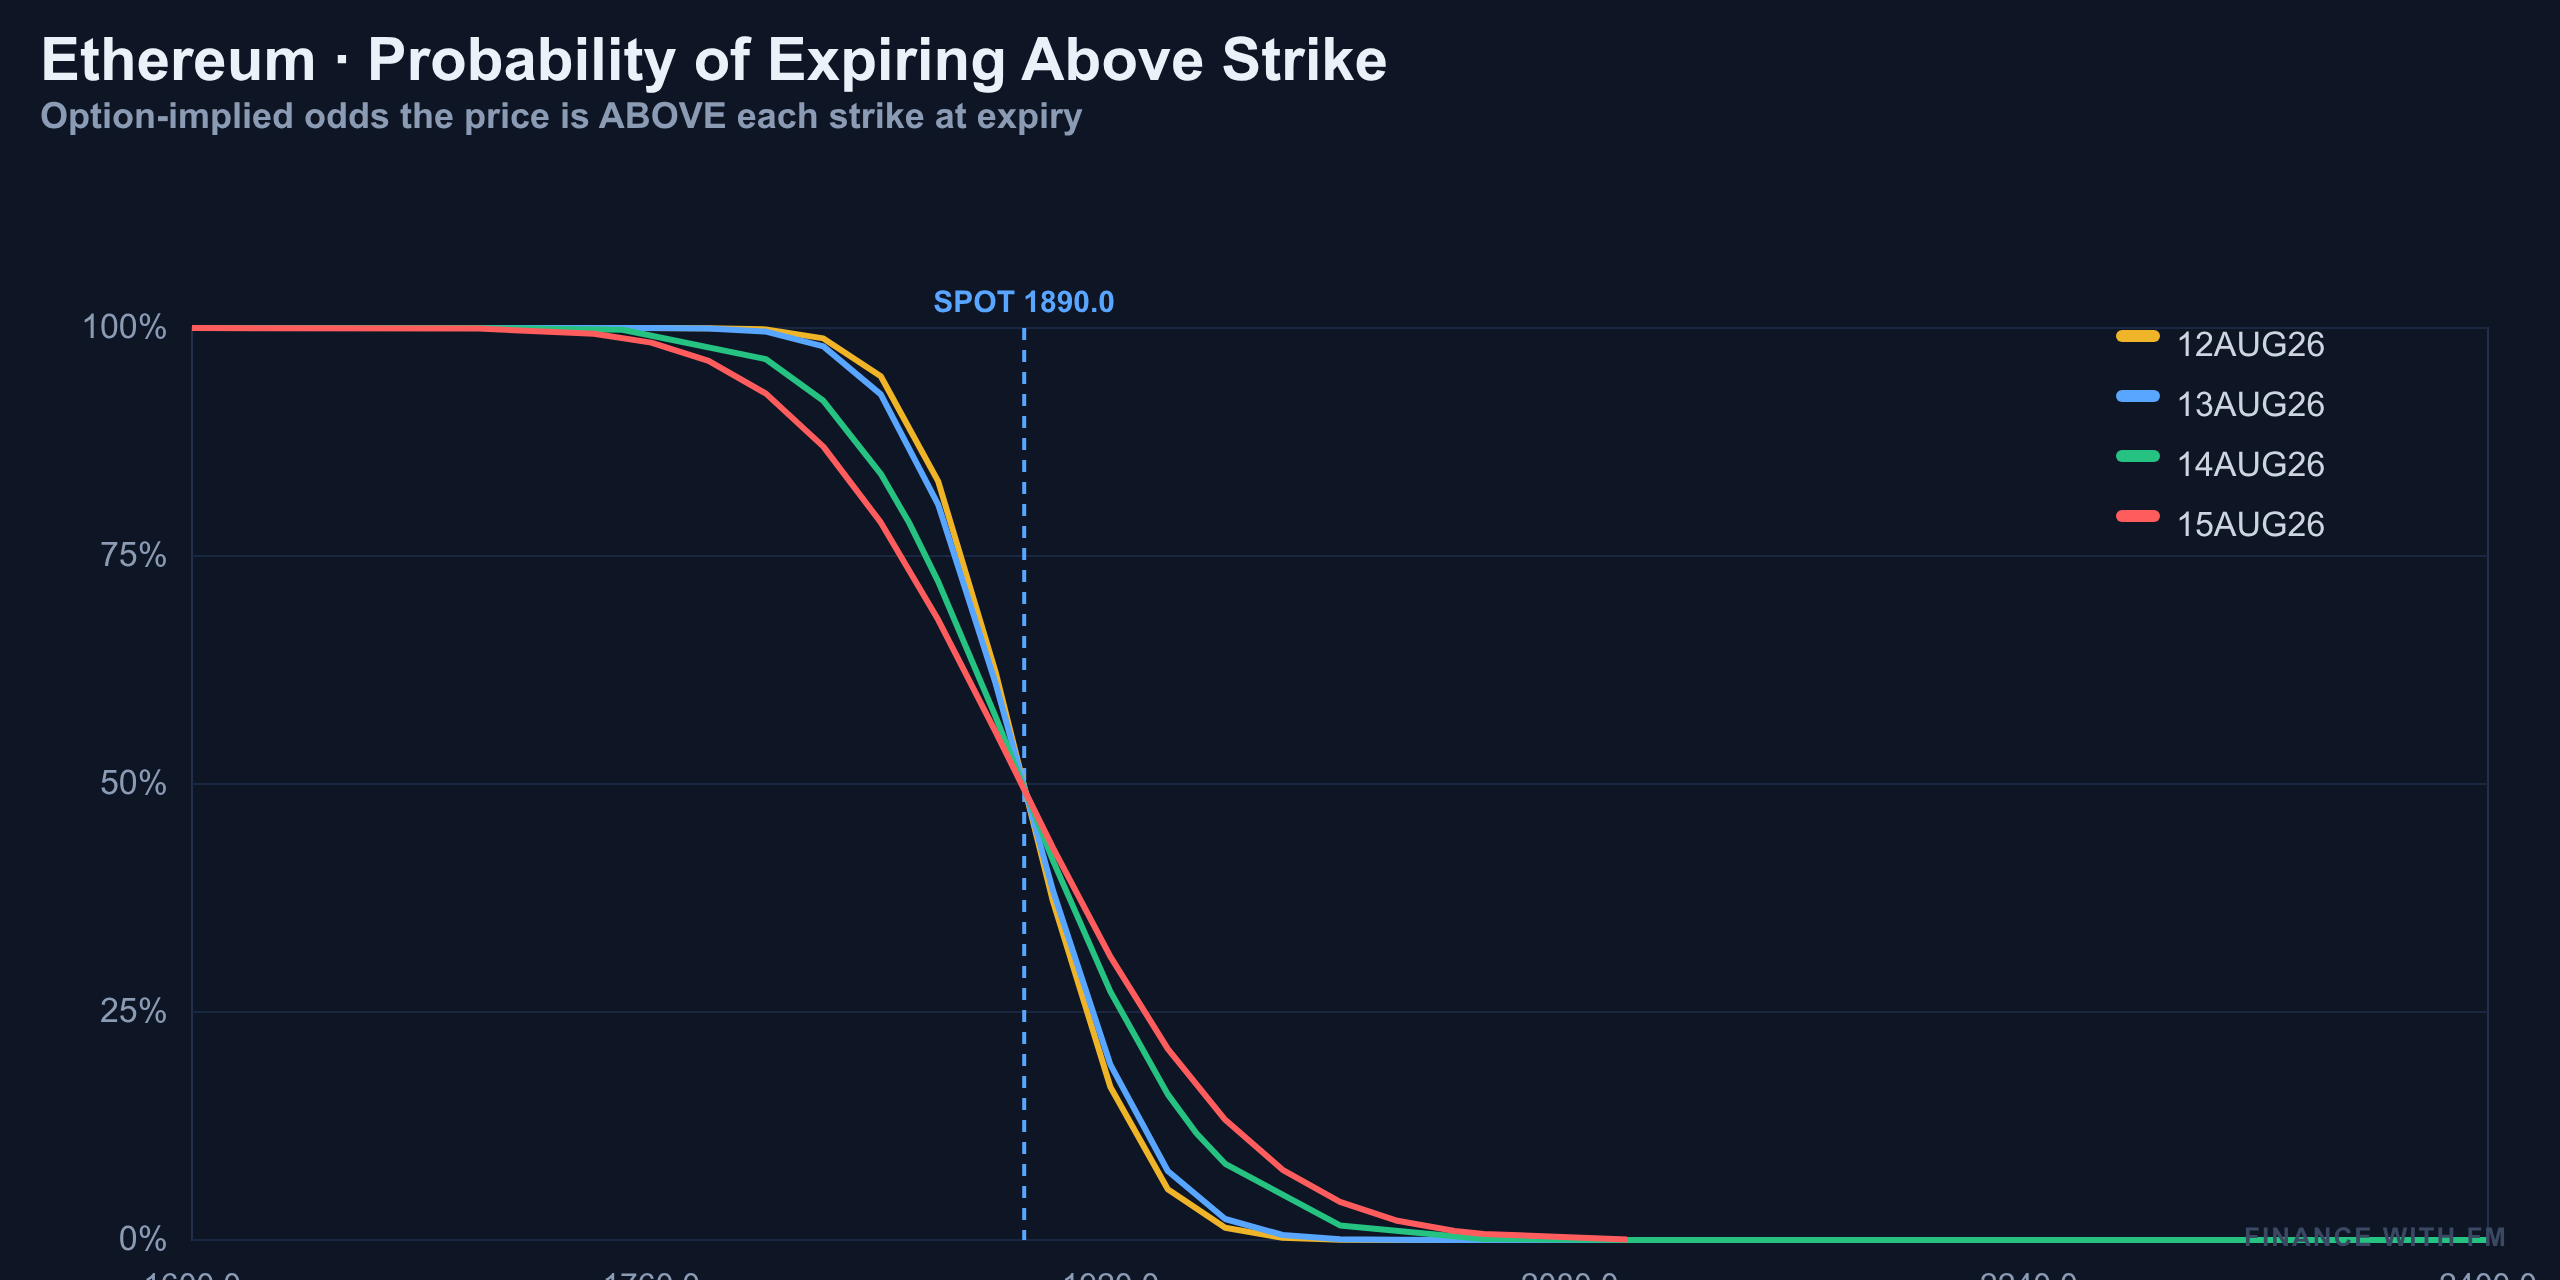
Strip away the noise and here's what the chain is pricing for the days ahead: essentially zero percent odds Ethereum closes above $2,100 by August 15. That's the options desk flatly telling you a big breakout isn't on the table this week.
| Range | Level |
|---|---|
| 1 Standard Deviation — Low | $1,849 |
| 1 Standard Deviation — High | $1,932 |
| 2 Standard Deviation — Low | $1,807 |
| 2 Standard Deviation — High | $1,974 |
| P(Close > $2,100 by Aug 15) | ~0% |
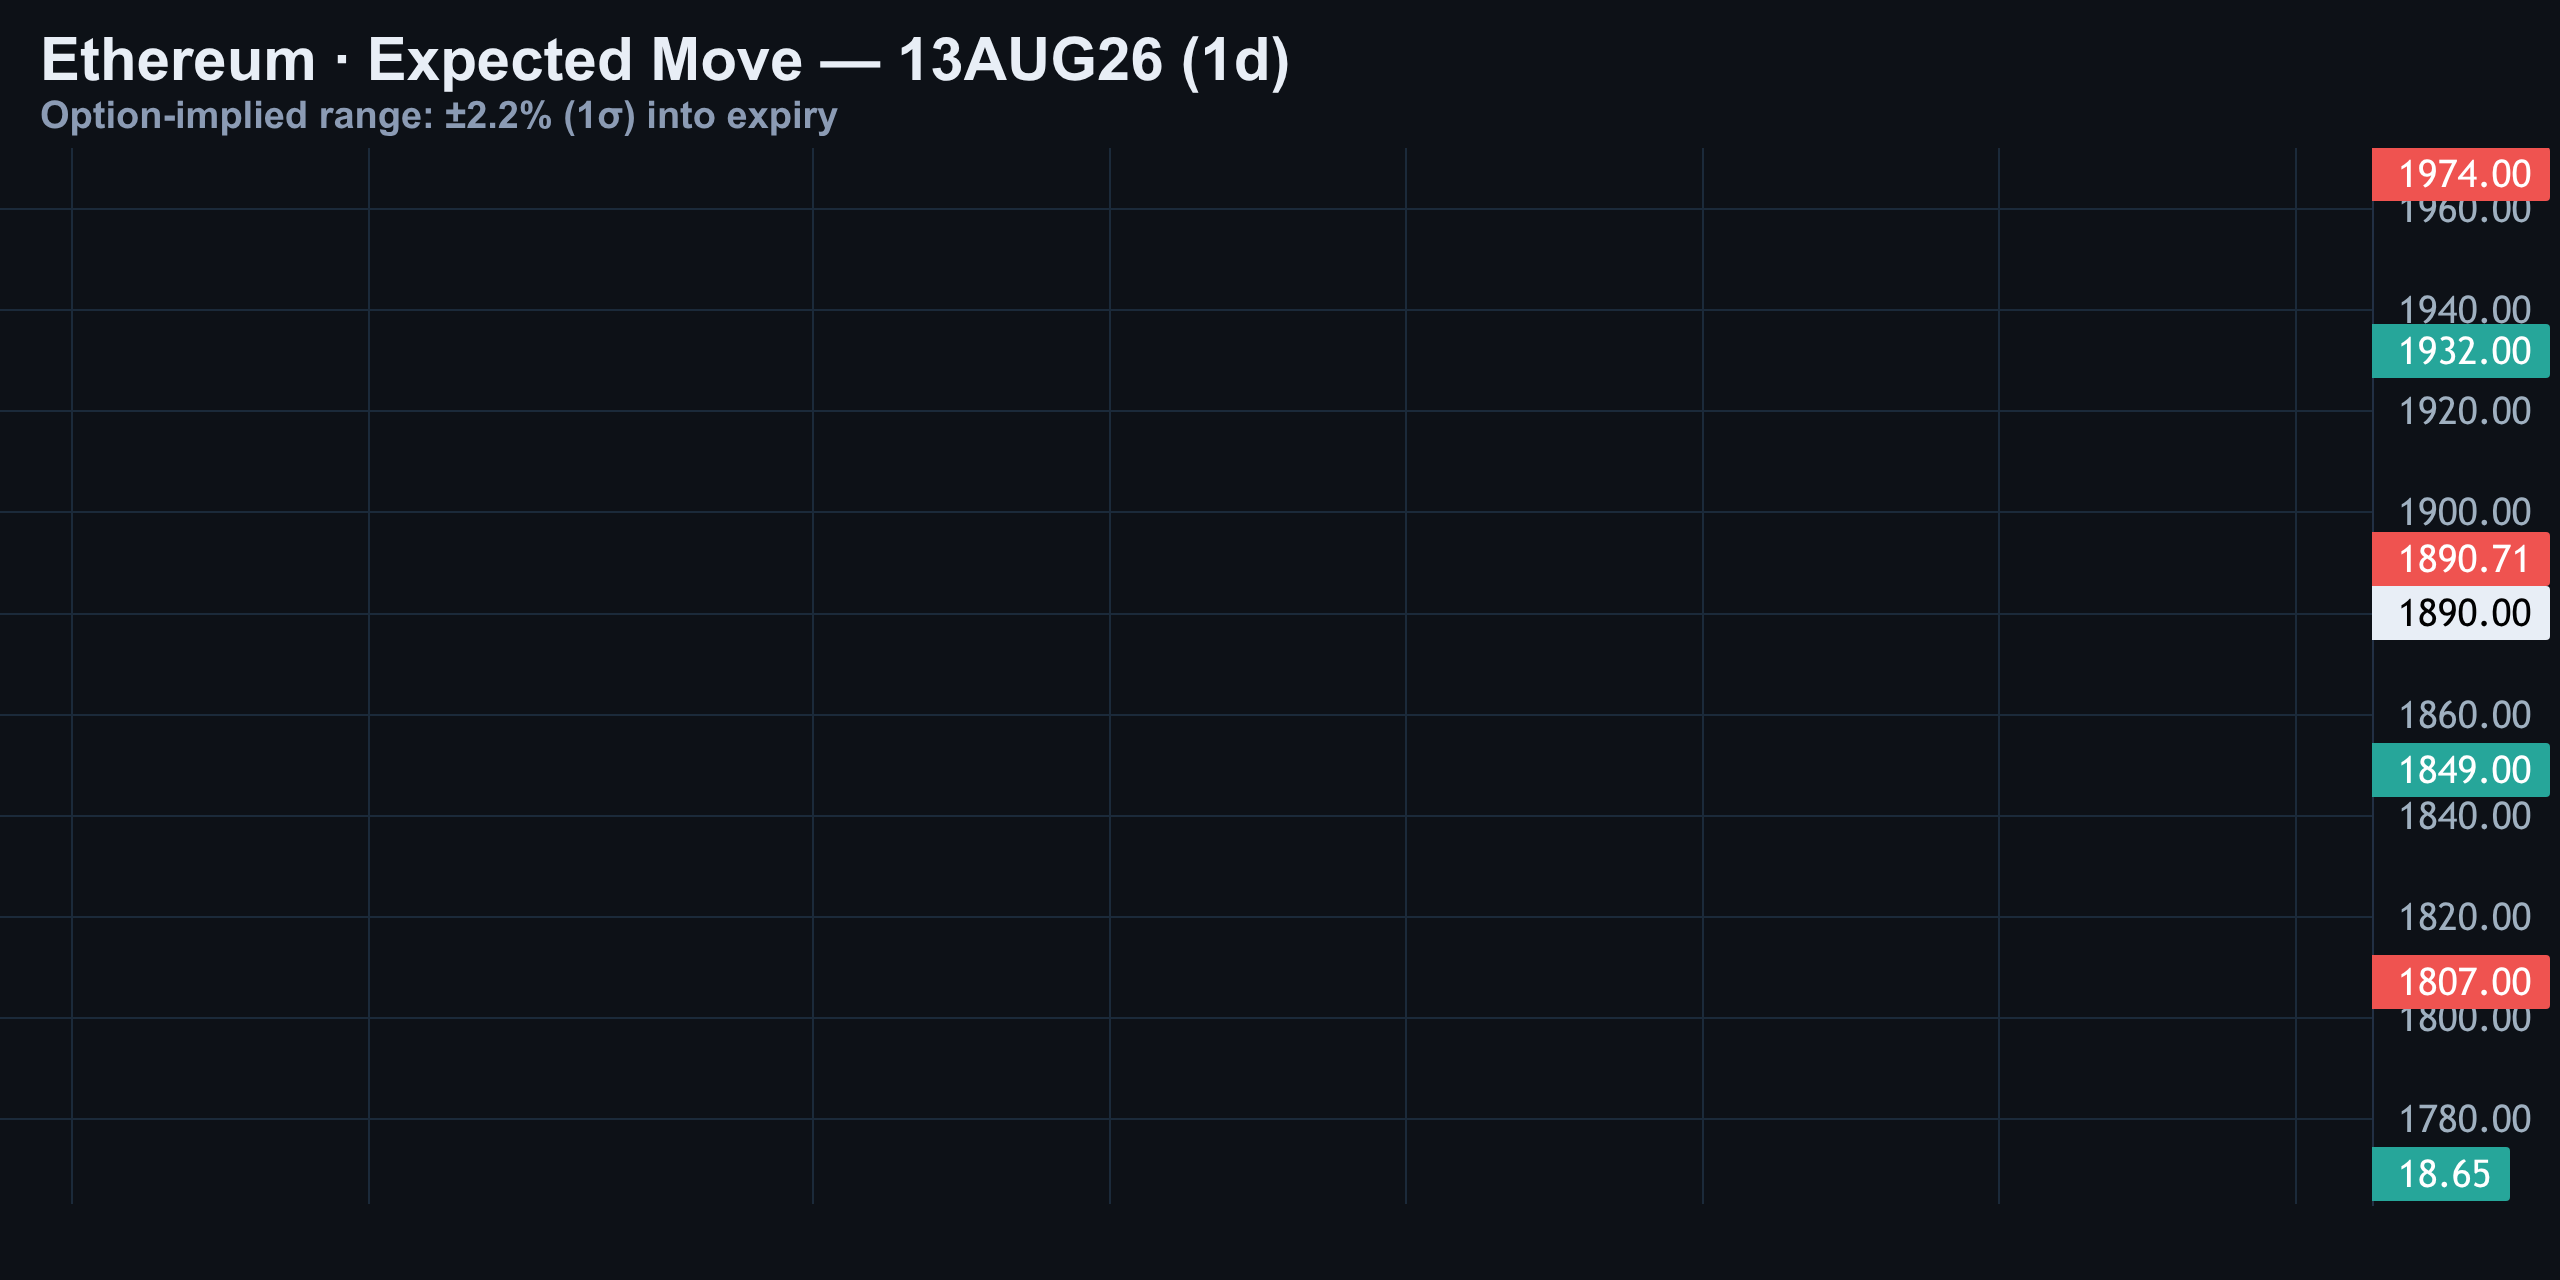
The expected move for tomorrow's expiry is roughly ±2.2%, putting the one-standard-deviation range between about $1,849 and $1,932, stretching to $1,807–$1,974 at two standard deviations. Trading inside that band is the high-probability lane; betting on a break beyond it is the tail bet.
Whale Flow: Smart Money Is Leaning Bearish
This is the part that actually matters most today — block-trade flow. Over the last 72 hours, the heaviest single print was 1,500 contracts at the $2,000 strike for the August 28 expiry, but direction is everything here.
| Trade | Strike / Expiry | Action | Read |
|---|---|---|---|
| Block 1 | $2,000 / Aug 28 | Bought 1,000 calls, sold 1,000 puts | Bullish tilt |
| Block 2 | $2,000 / Aug 28 | Sold 1,750 calls, bought 1,000 puts | Bearish tilt |
| Net position | — | Net calls sold, net puts bought | Bearish, size-weighted |
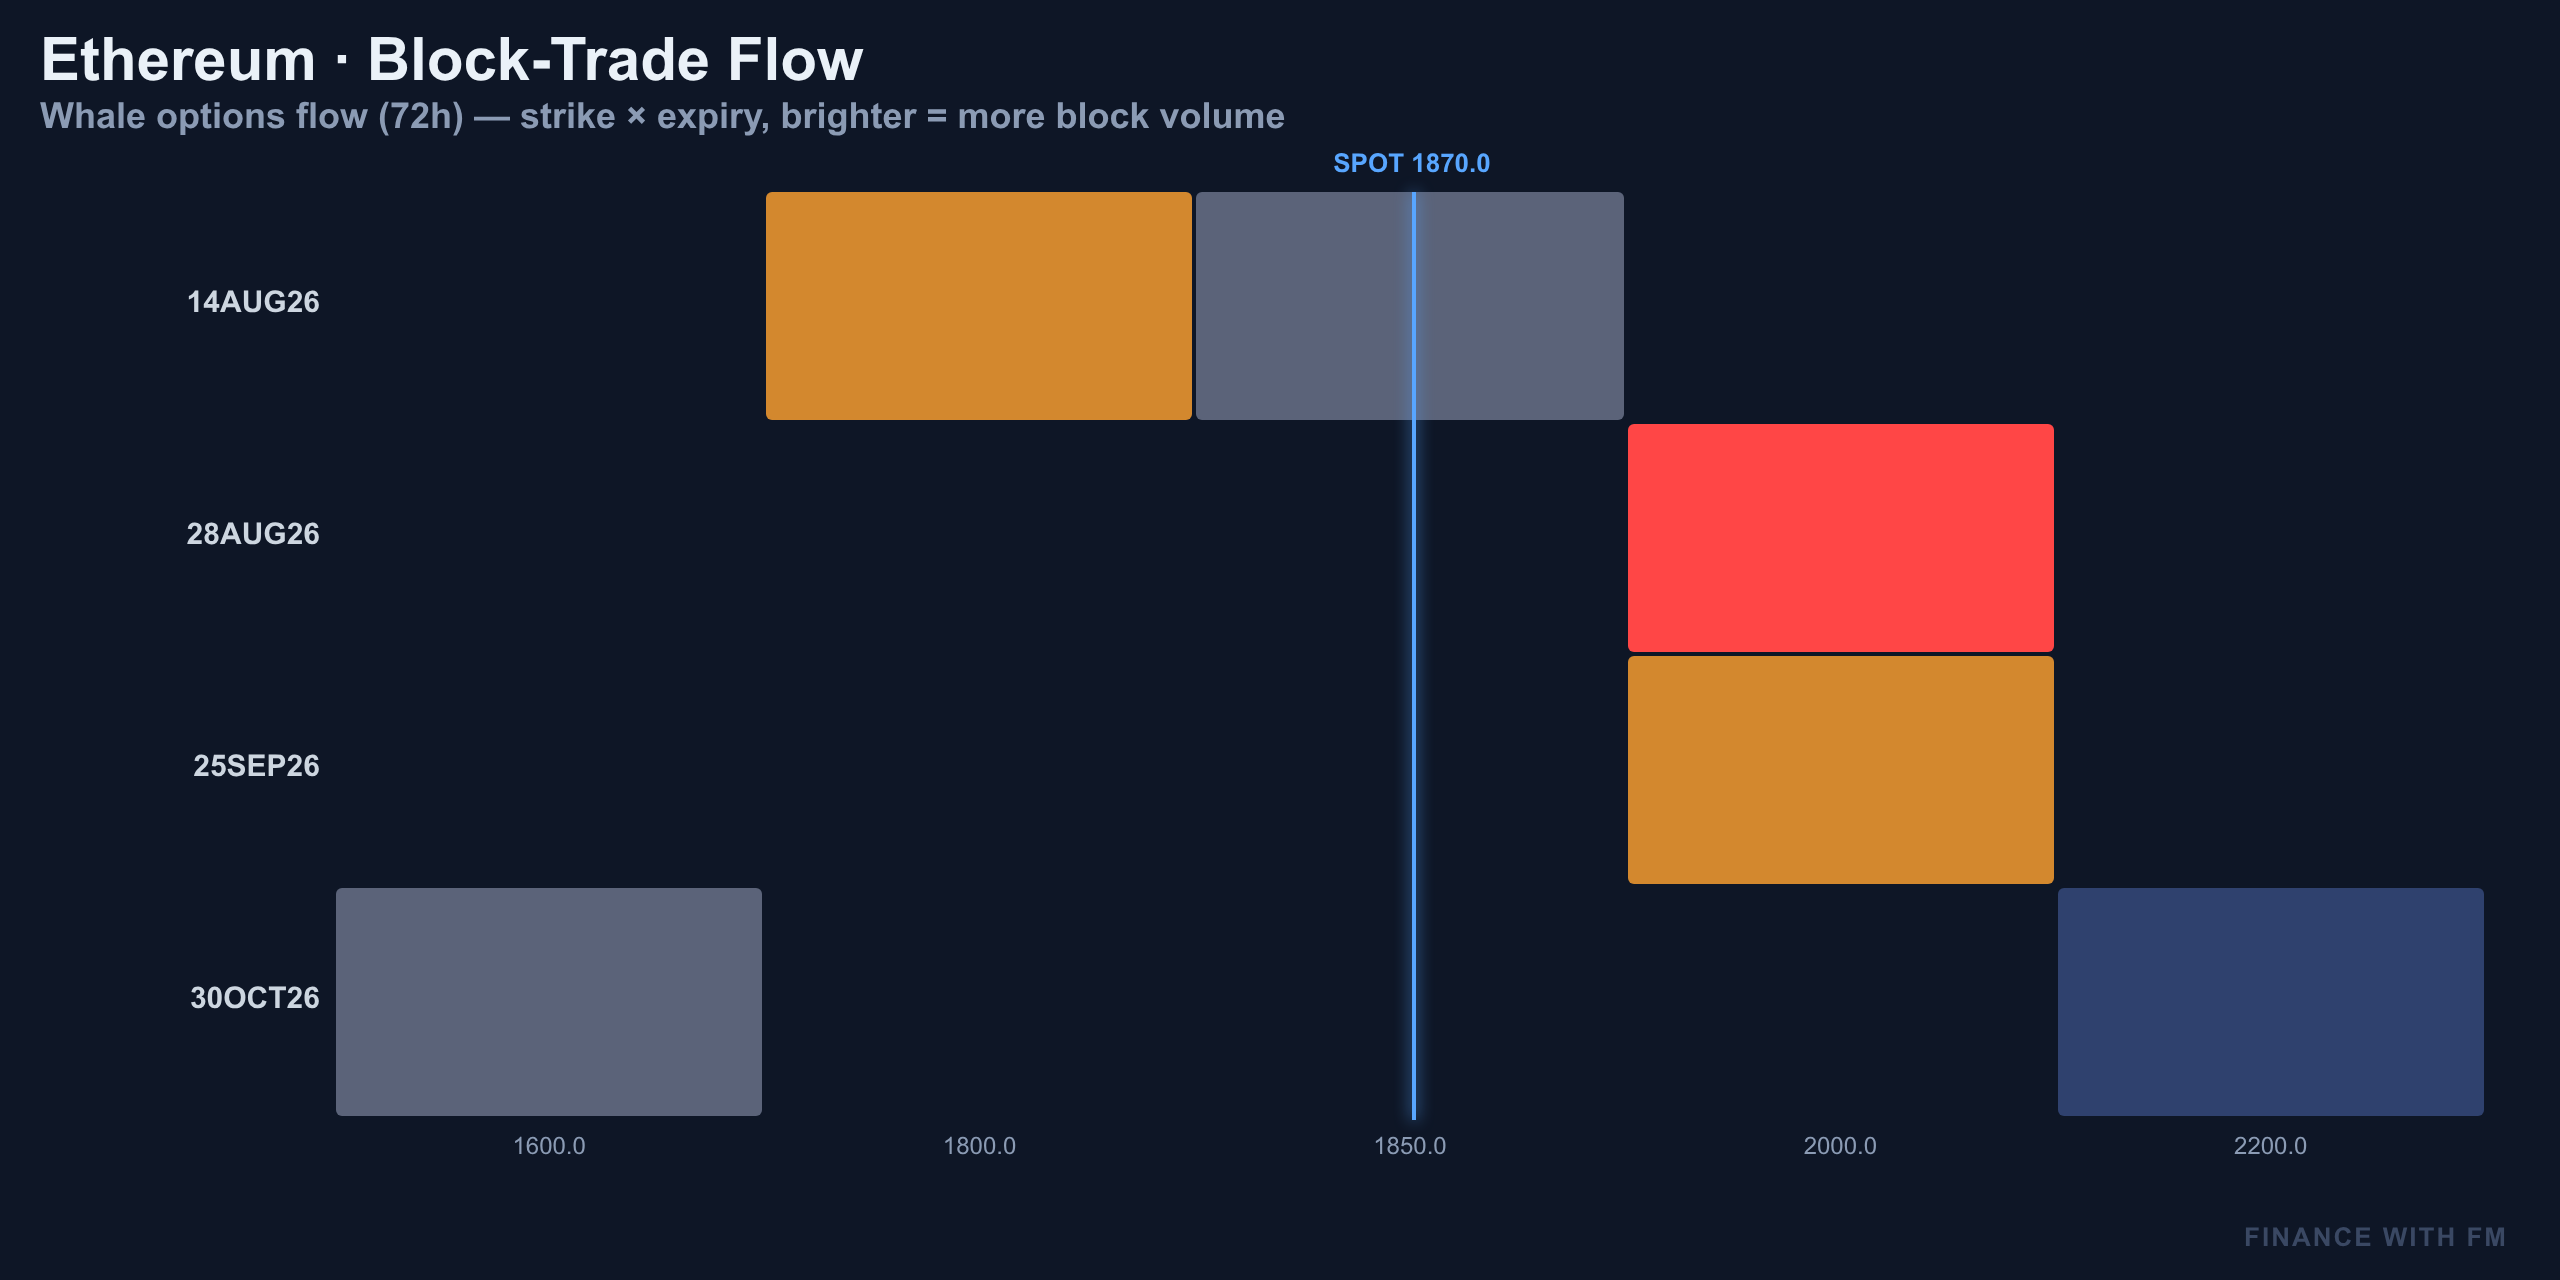
Net-net, that's calls sold and puts bought — bearish positioning from size. When whales lean that direction while retail stays crowded long, that divergence is exactly what's worth watching into the close.
Technical Structure: Intraday, 4-Hour and Daily All Say the Same Thing
Chart structure across three timeframes is converging on one message: Ethereum is boxed in and testing the same ceiling repeatedly.
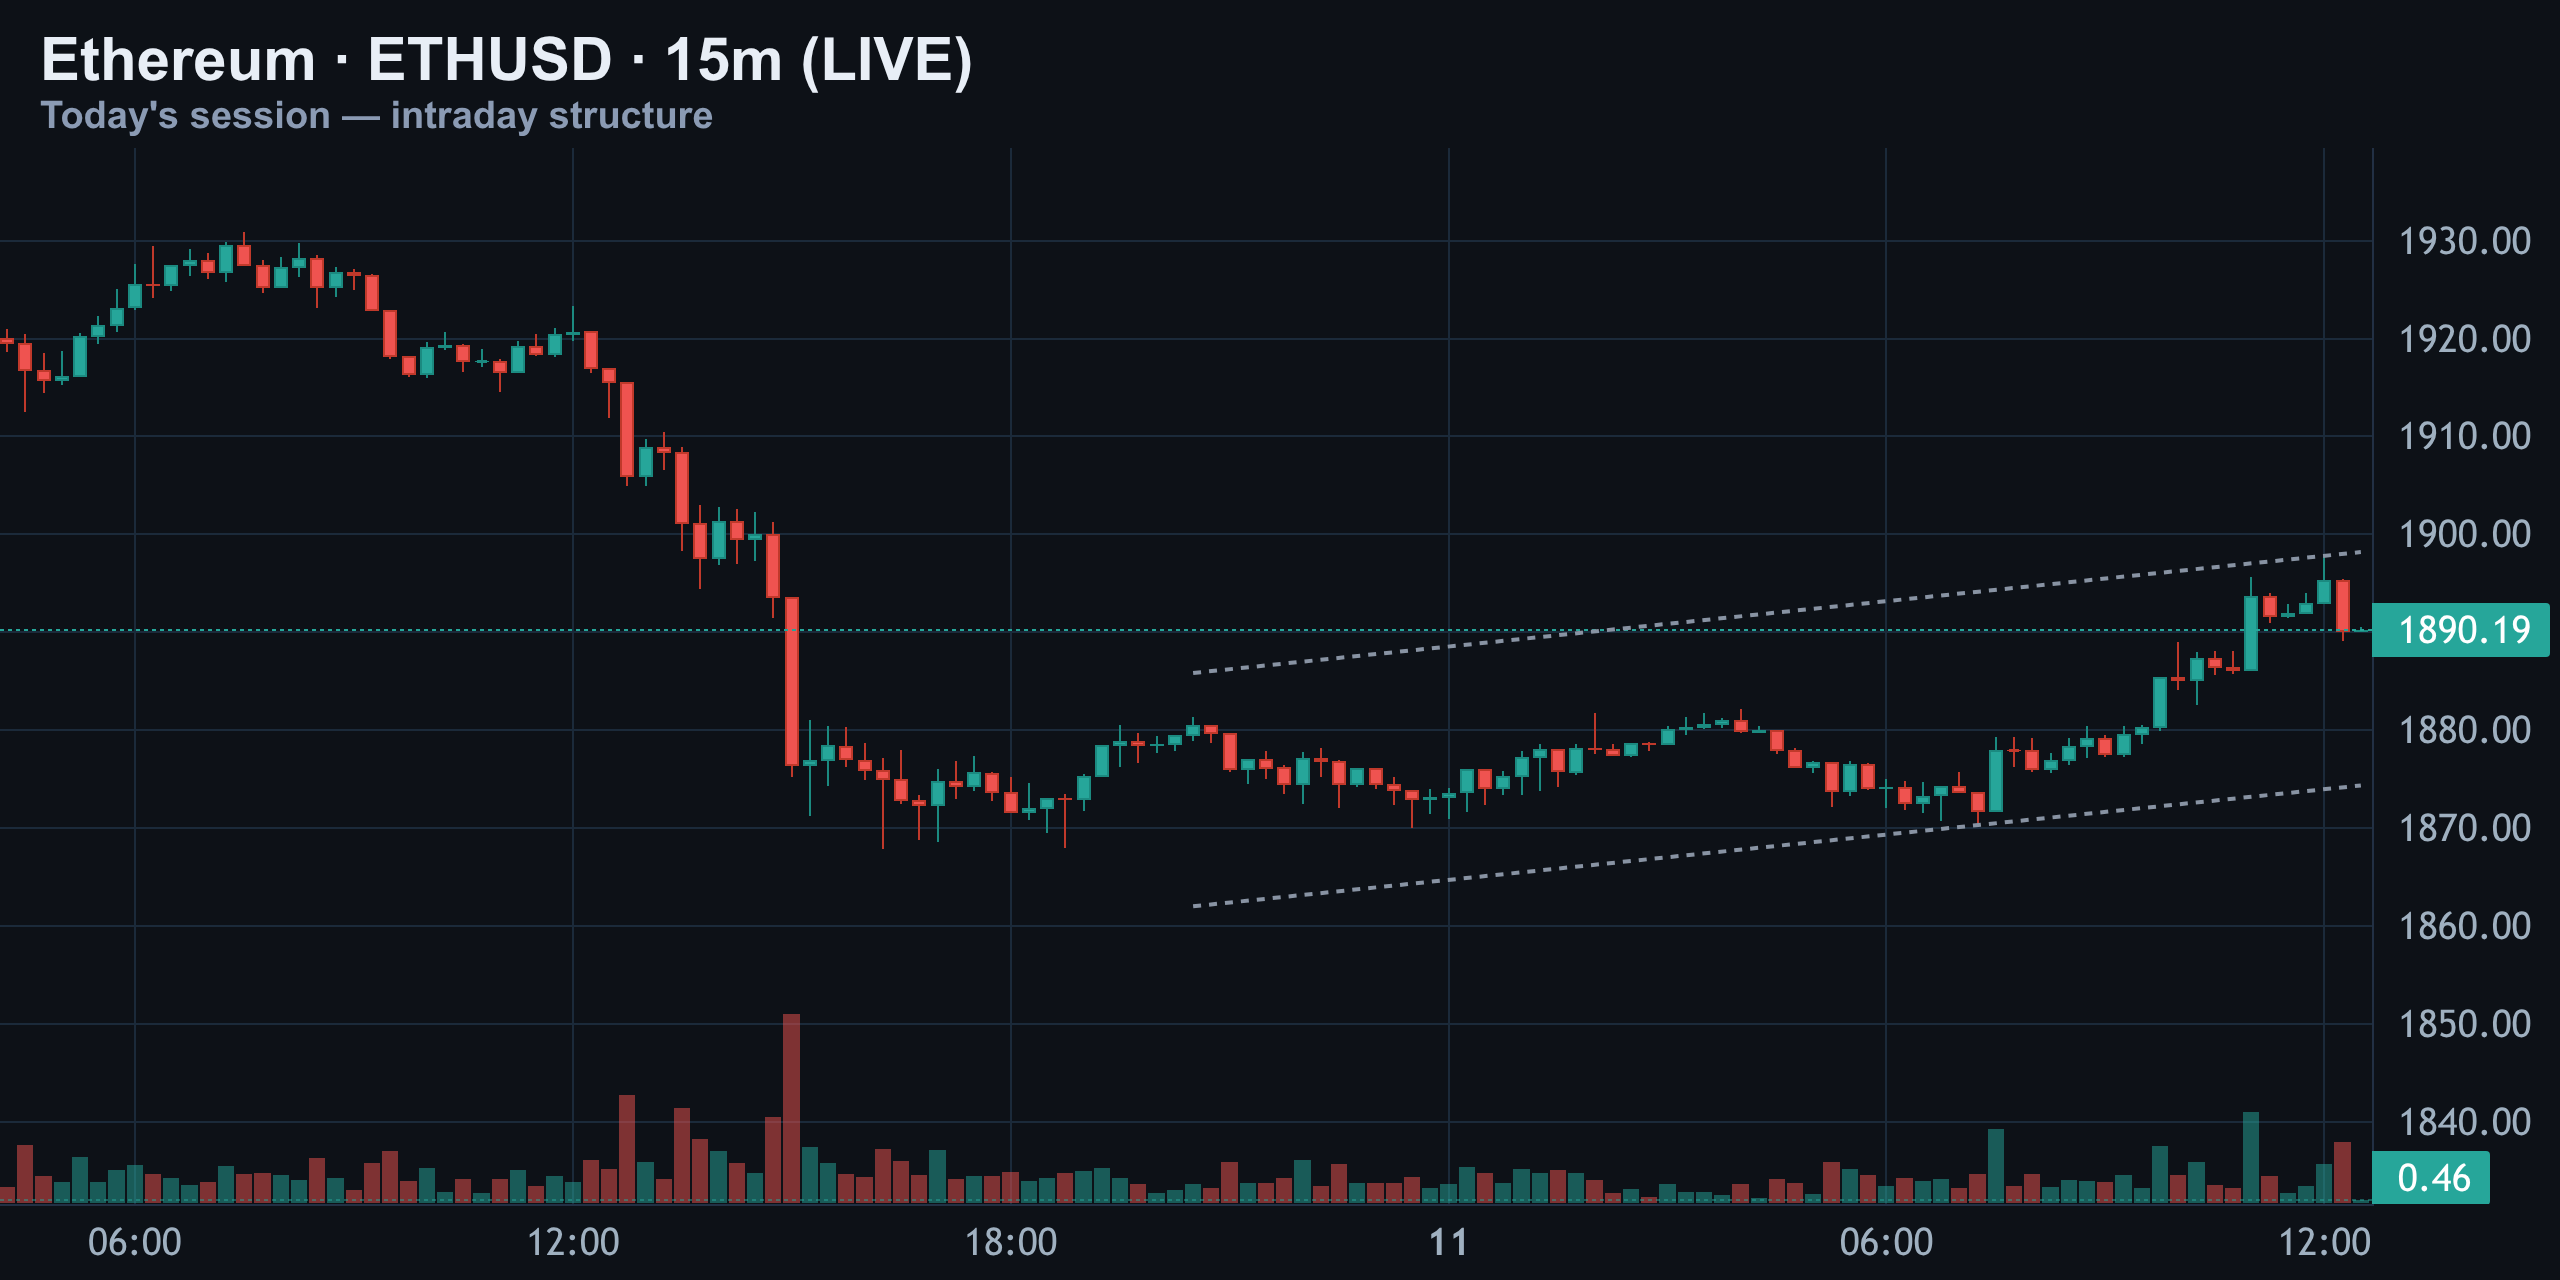
On the 15-minute chart, price just tagged $1,890 again, right at the upper rail of a rising wedge and directly into the order-book ask wall. Volume on this last leg up is noticeably lighter than the volume that drove the morning selloff — a classic low-conviction push into resistance that either breaks out on fresh volume or rolls back over.
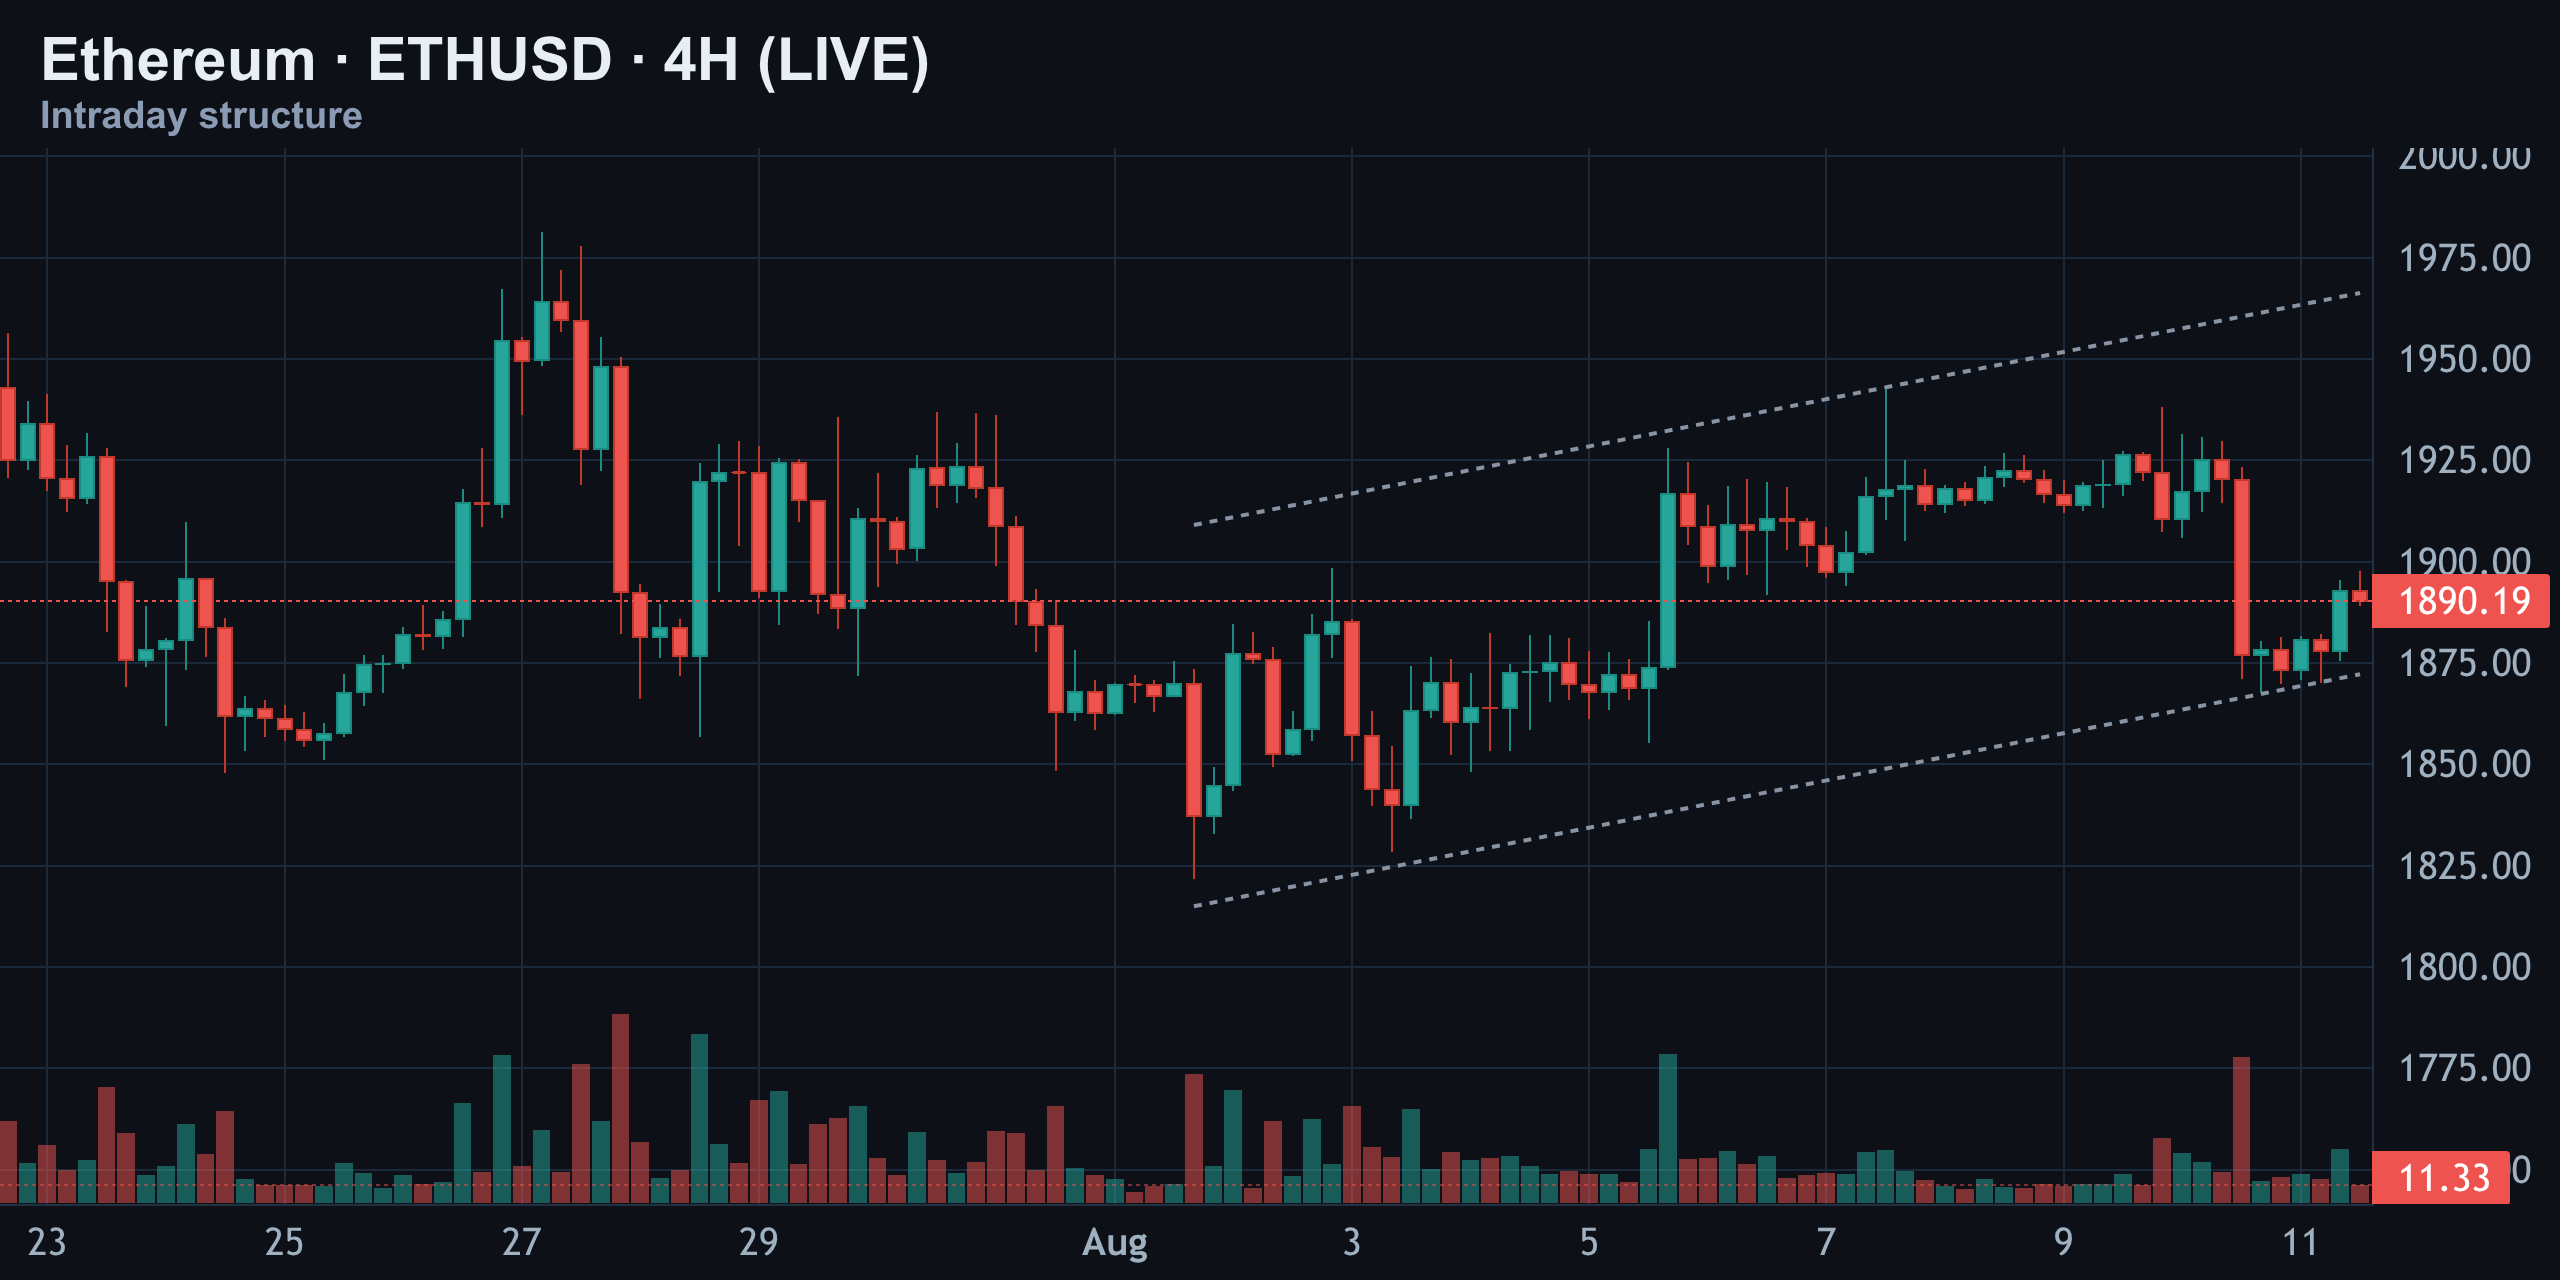
Zoom out to the 4-hour chart and Ethereum has been climbing inside an ascending channel since bottoming near $1,830 on August 6. Every dip has been bought a little higher than the last, and price is now sitting near the top edge of that channel for the third time. Third tests don't always hold — a clean break above, or a fail here, decides the next four-hour leg.
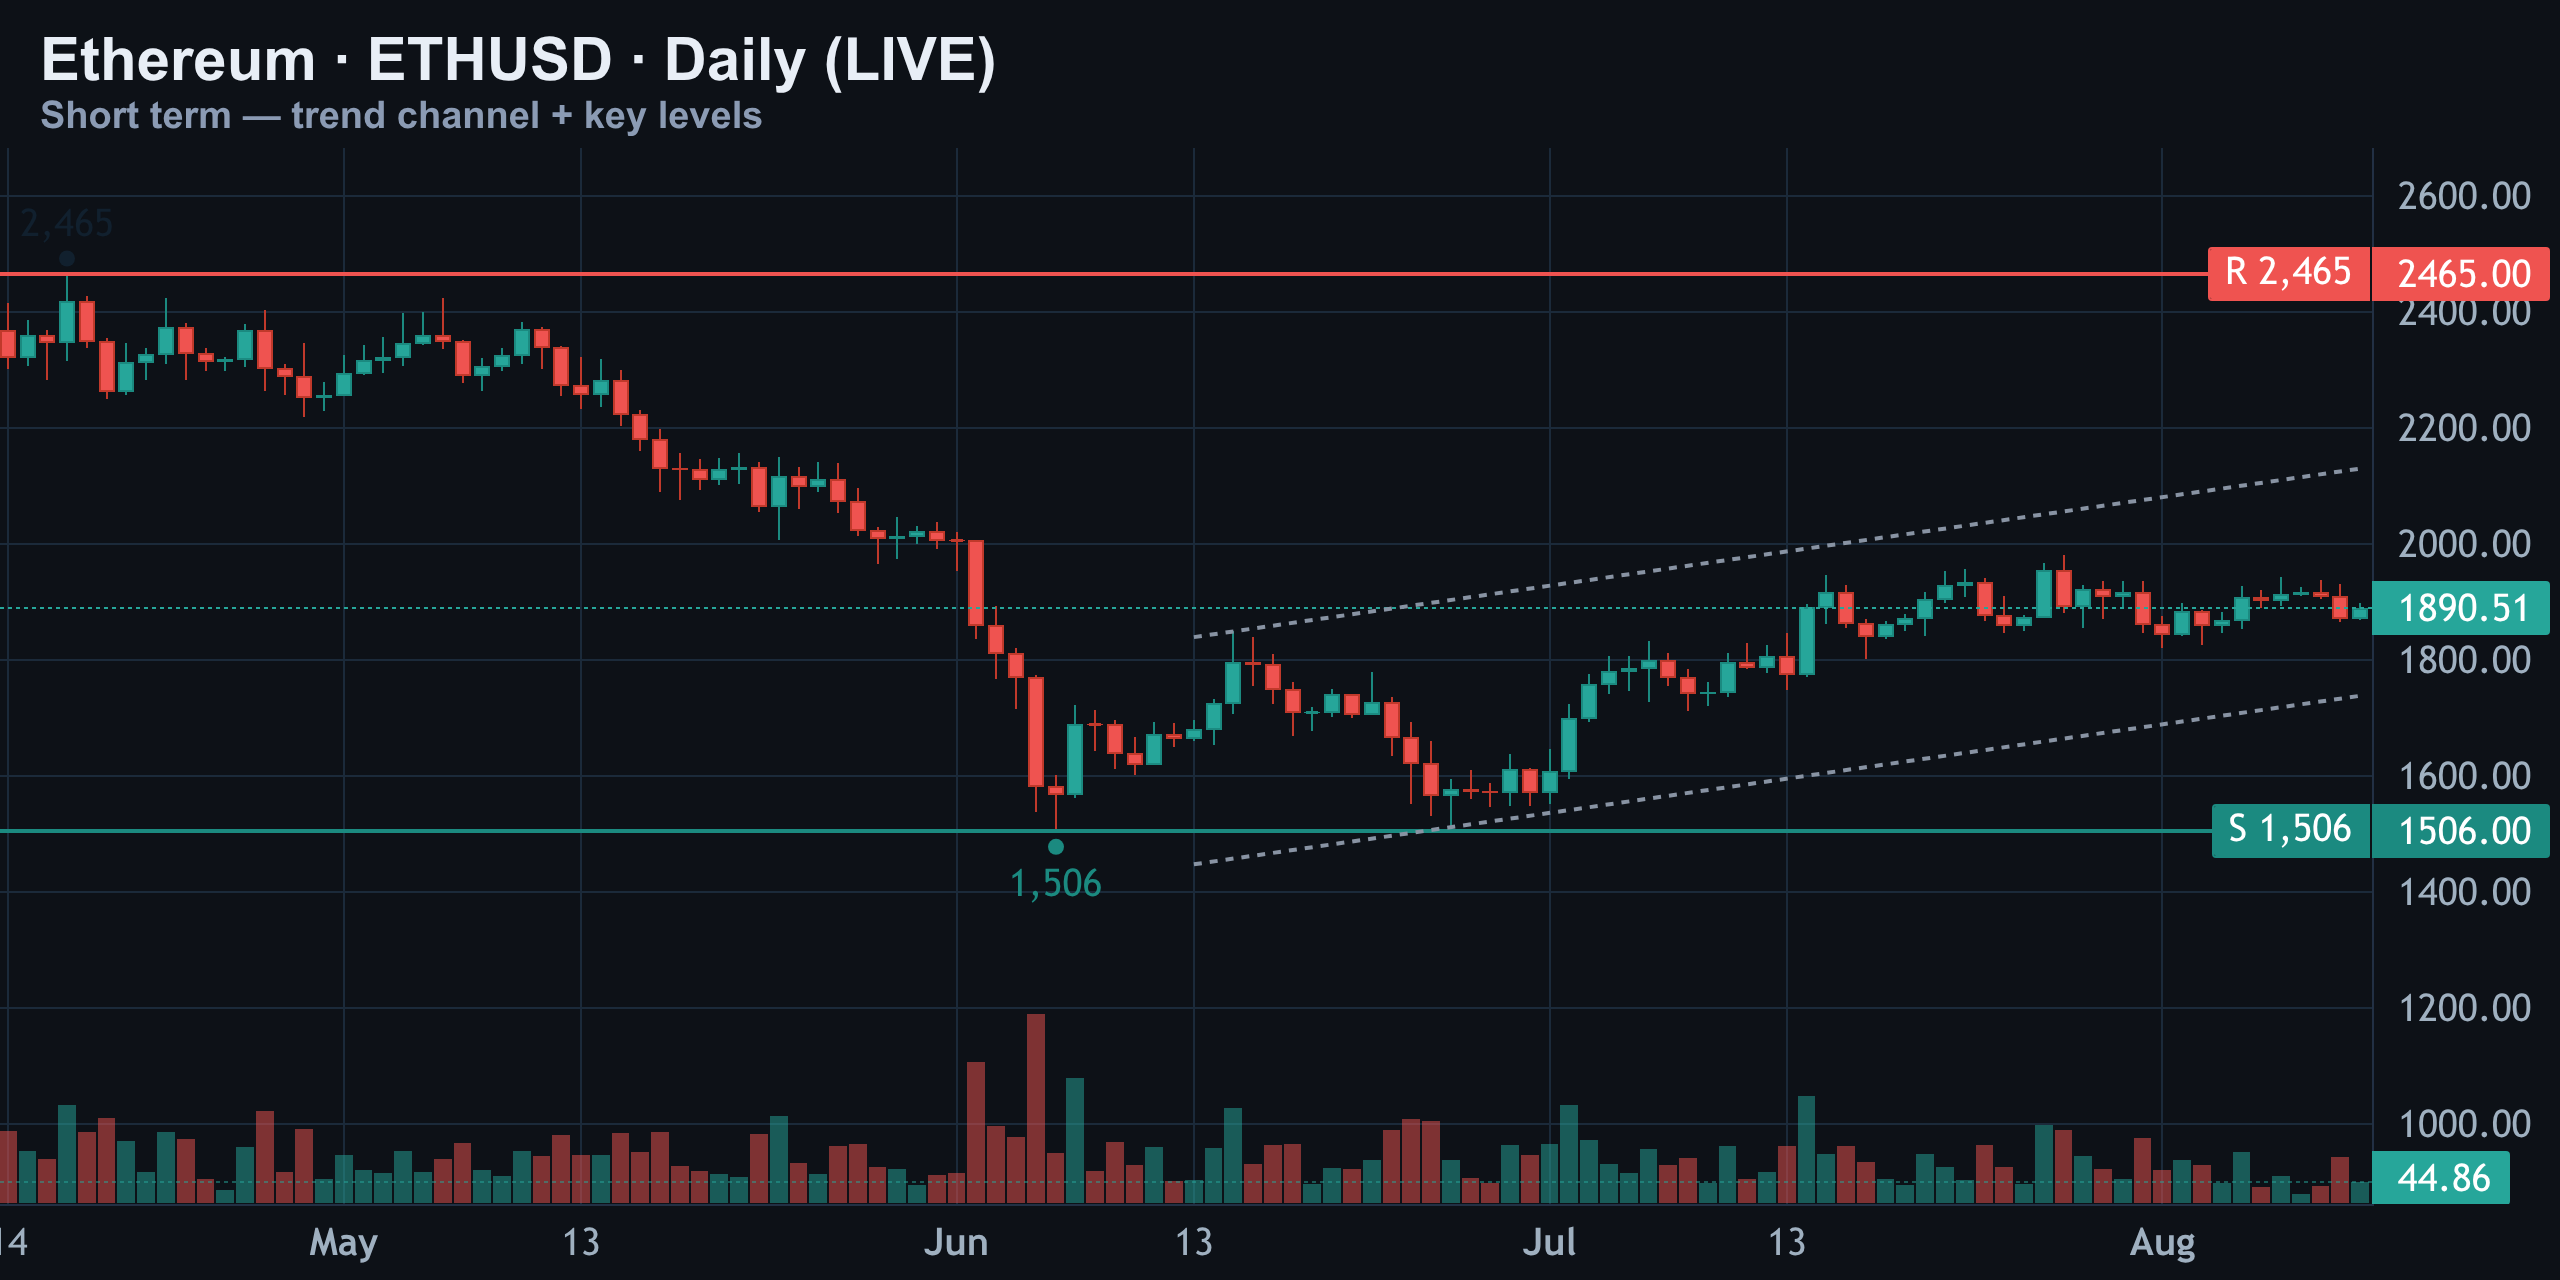
On the daily, Ethereum is still inside the recovery channel that started at the June low near $1,506, working its way back toward the broader resistance shelf up at $2,465. Barchart's cheat sheet confirms current pivots sit right in this same congestion zone, with resistance layered just overhead. Bitcoin Foundation's technical read similarly flags immediate resistance around $1,940–$2,000 with first support near $1,850–$1,880 — a near-identical box to what the options desk is pricing.
| Timeframe | Structure | Key Level |
|---|---|---|
| 15-Minute | Rising wedge into resistance | Resistance ~$1,890–$1,895 |
| 4-Hour | Ascending channel, third test | Support $1,830 / channel top ~$1,900 |
| Daily | Boxed recovery channel | Support ~$1,506 base / resistance $2,465 |
Momentum Check: RSI and MACD Say Wait
Momentum indicators back up the sideways read rather than fighting it.
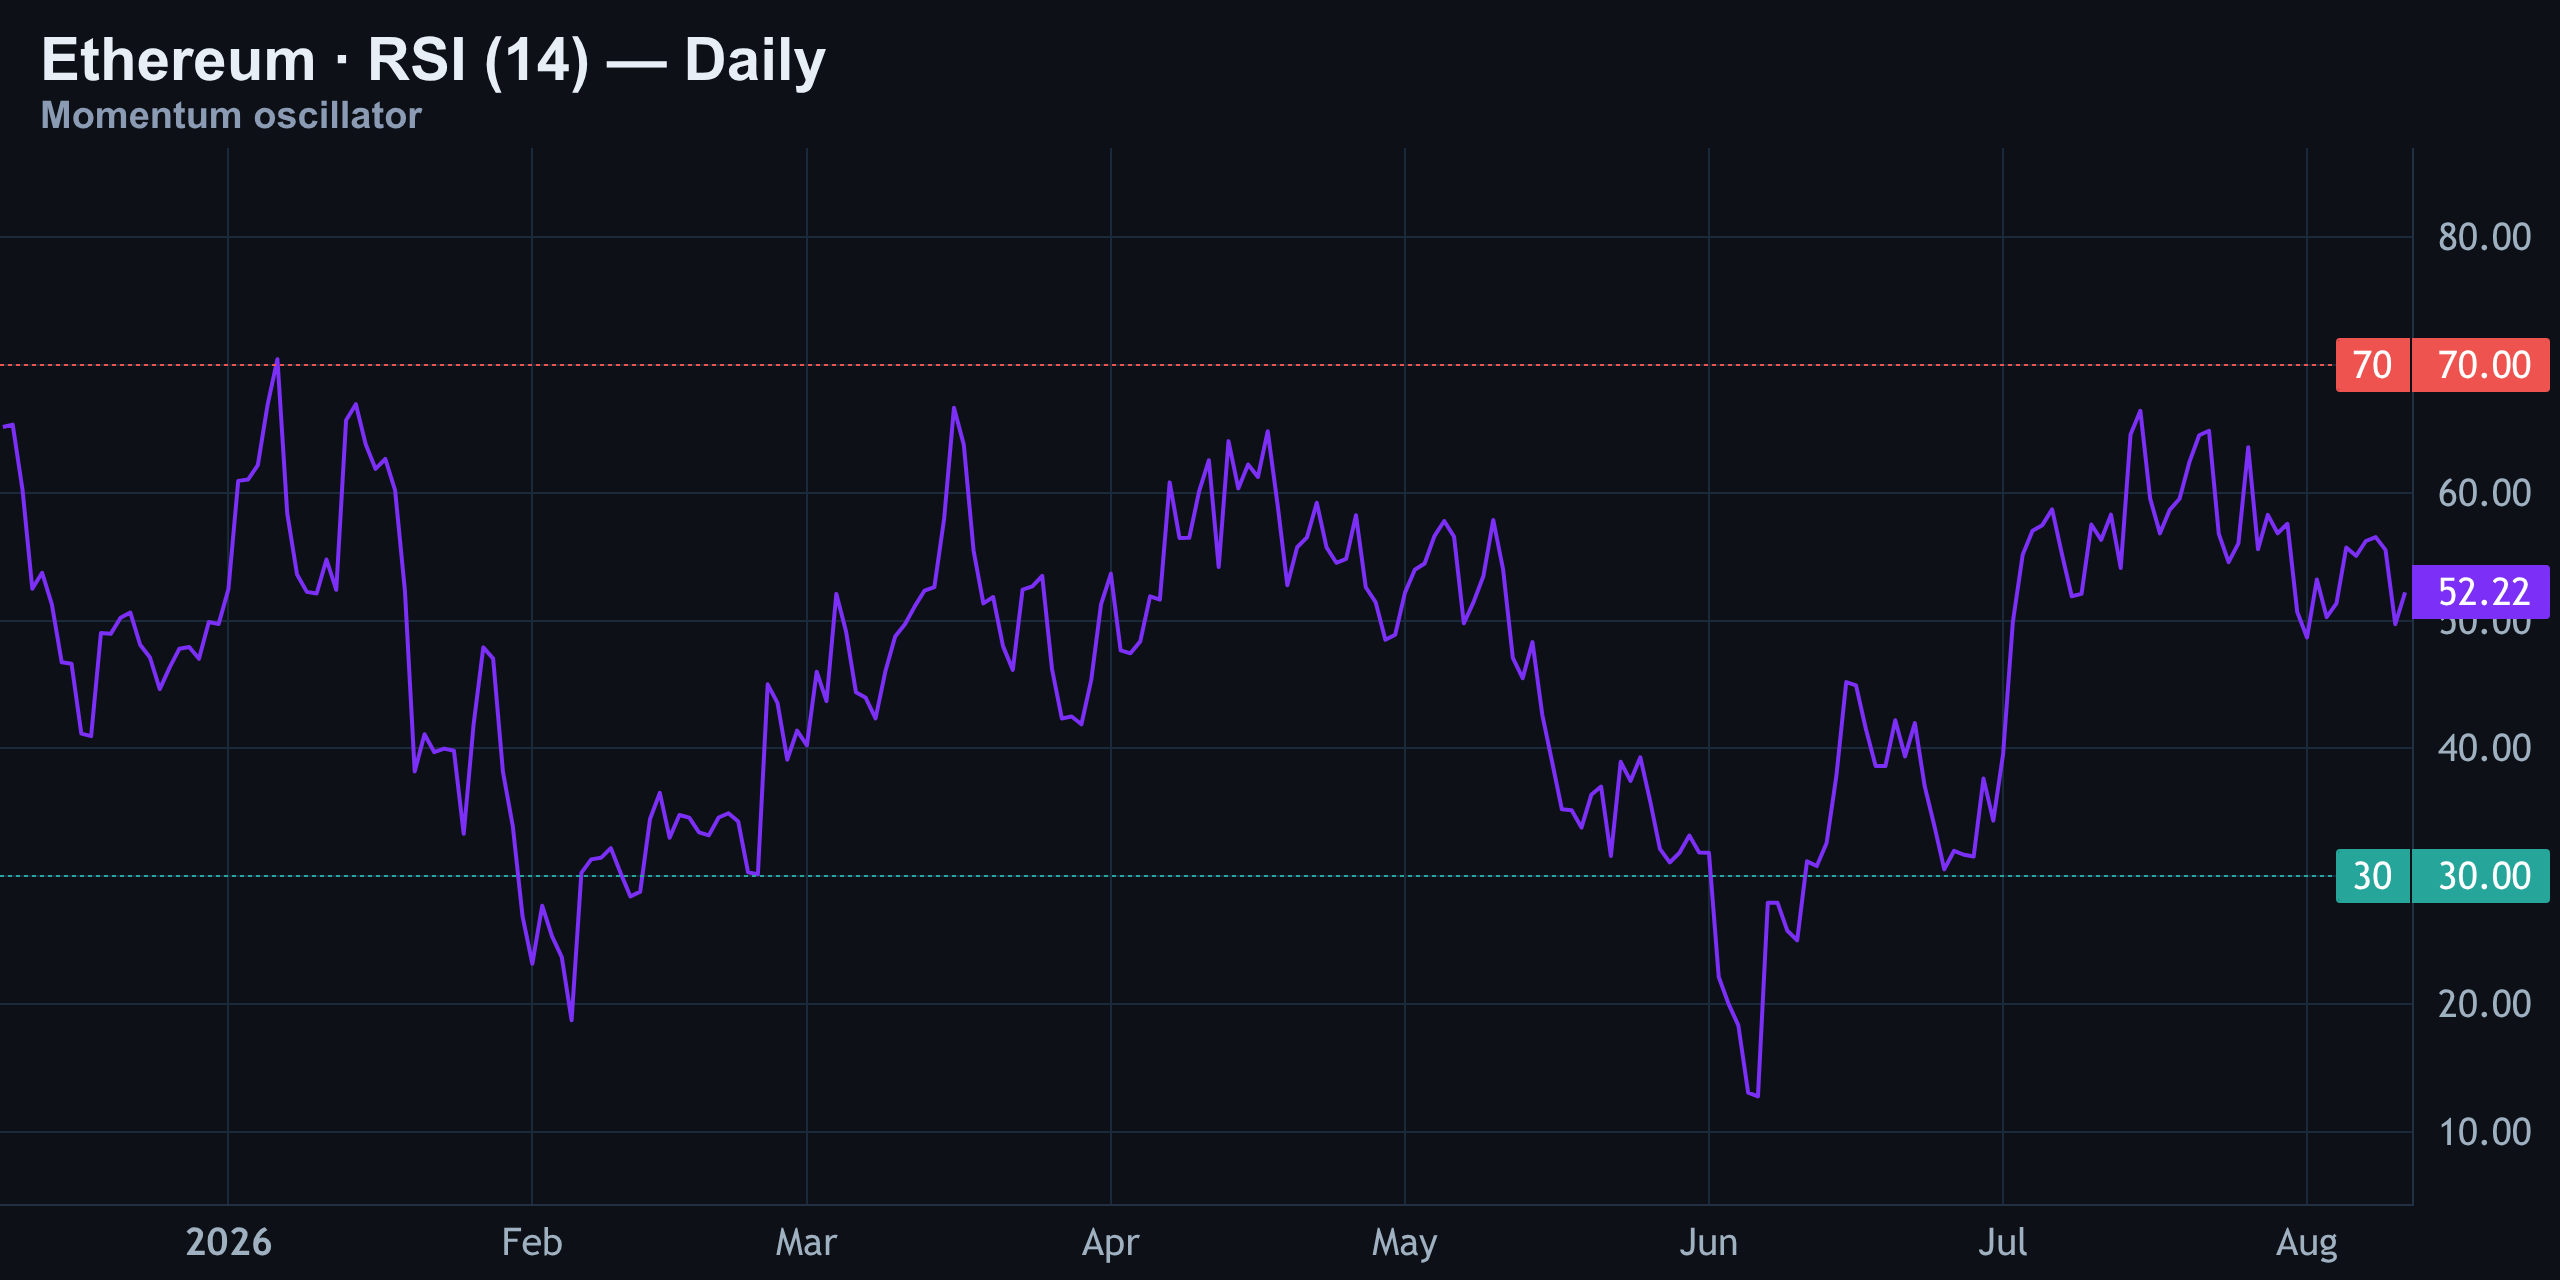
RSI (14) is parked dead center — no overbought, no oversold, nothing actionable. It's the indicator equivalent of a shrug, and it matches the price action: chop, not trend.
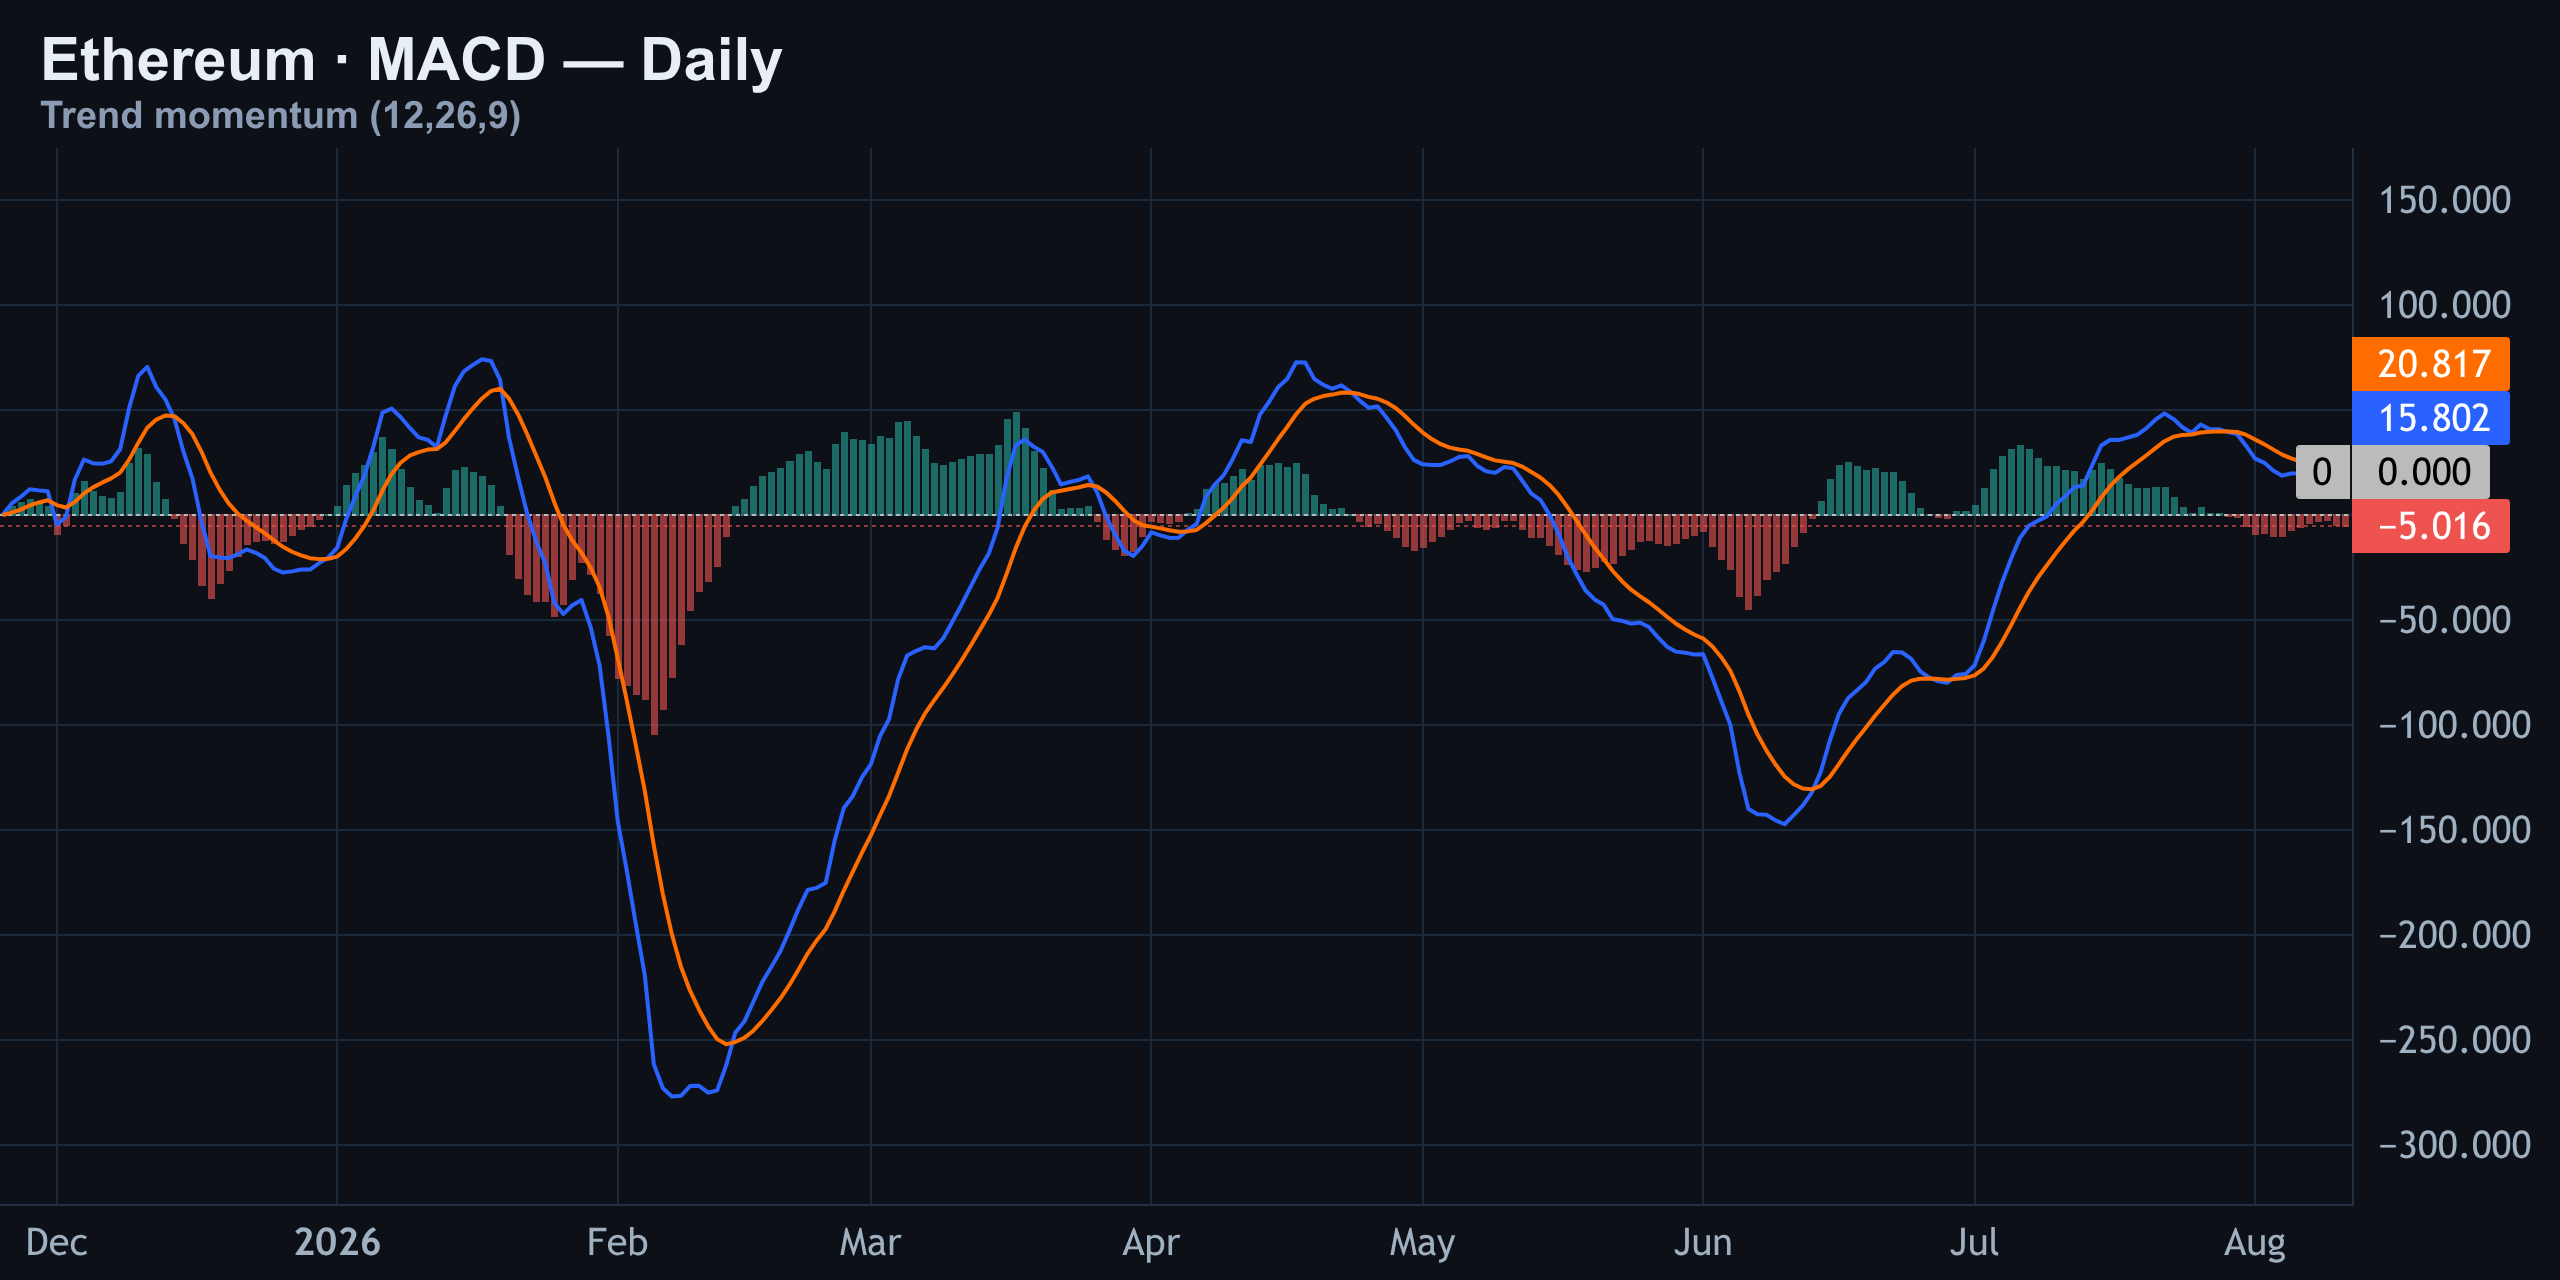
MACD is below its signal line with momentum fading, not accelerating. Combined with the RSI reading, neither classic momentum tool is giving a green light to chase this move in either direction right now.
Liquidation Map & Today's Verdict
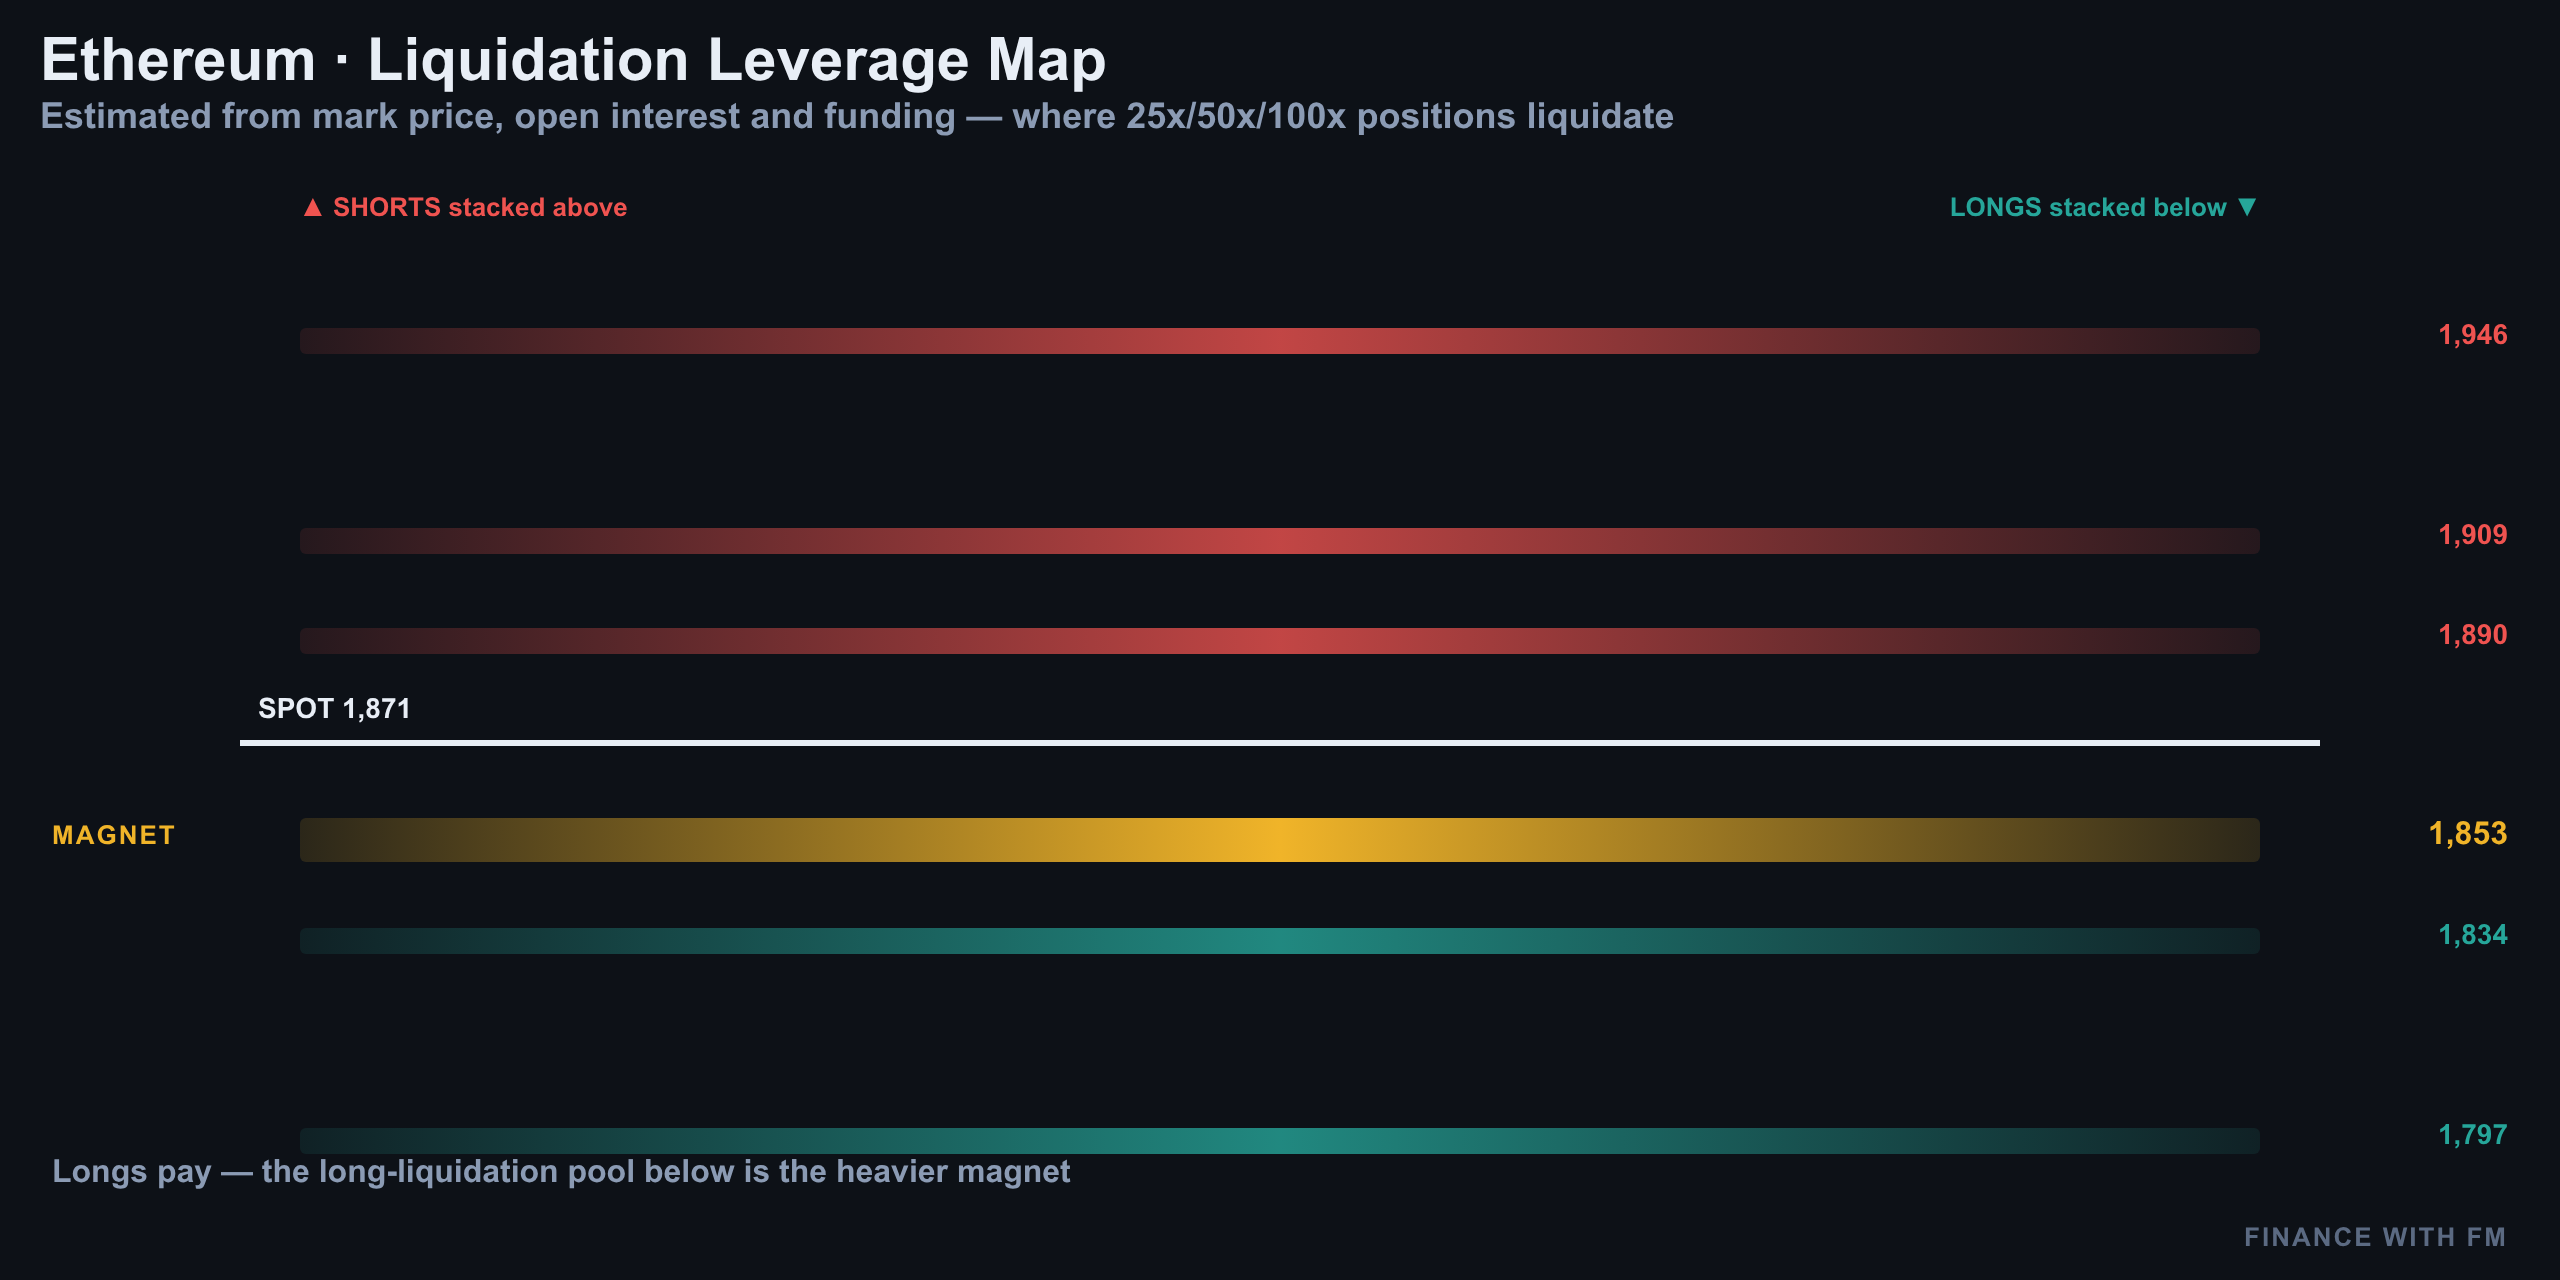
This is where the setup gets genuinely interesting. Funding data shows longs are crowded, and long-liquidation clusters are stacked just below spot — meaning if that positive-gamma pin breaks to the downside, there's fuel to accelerate the move.
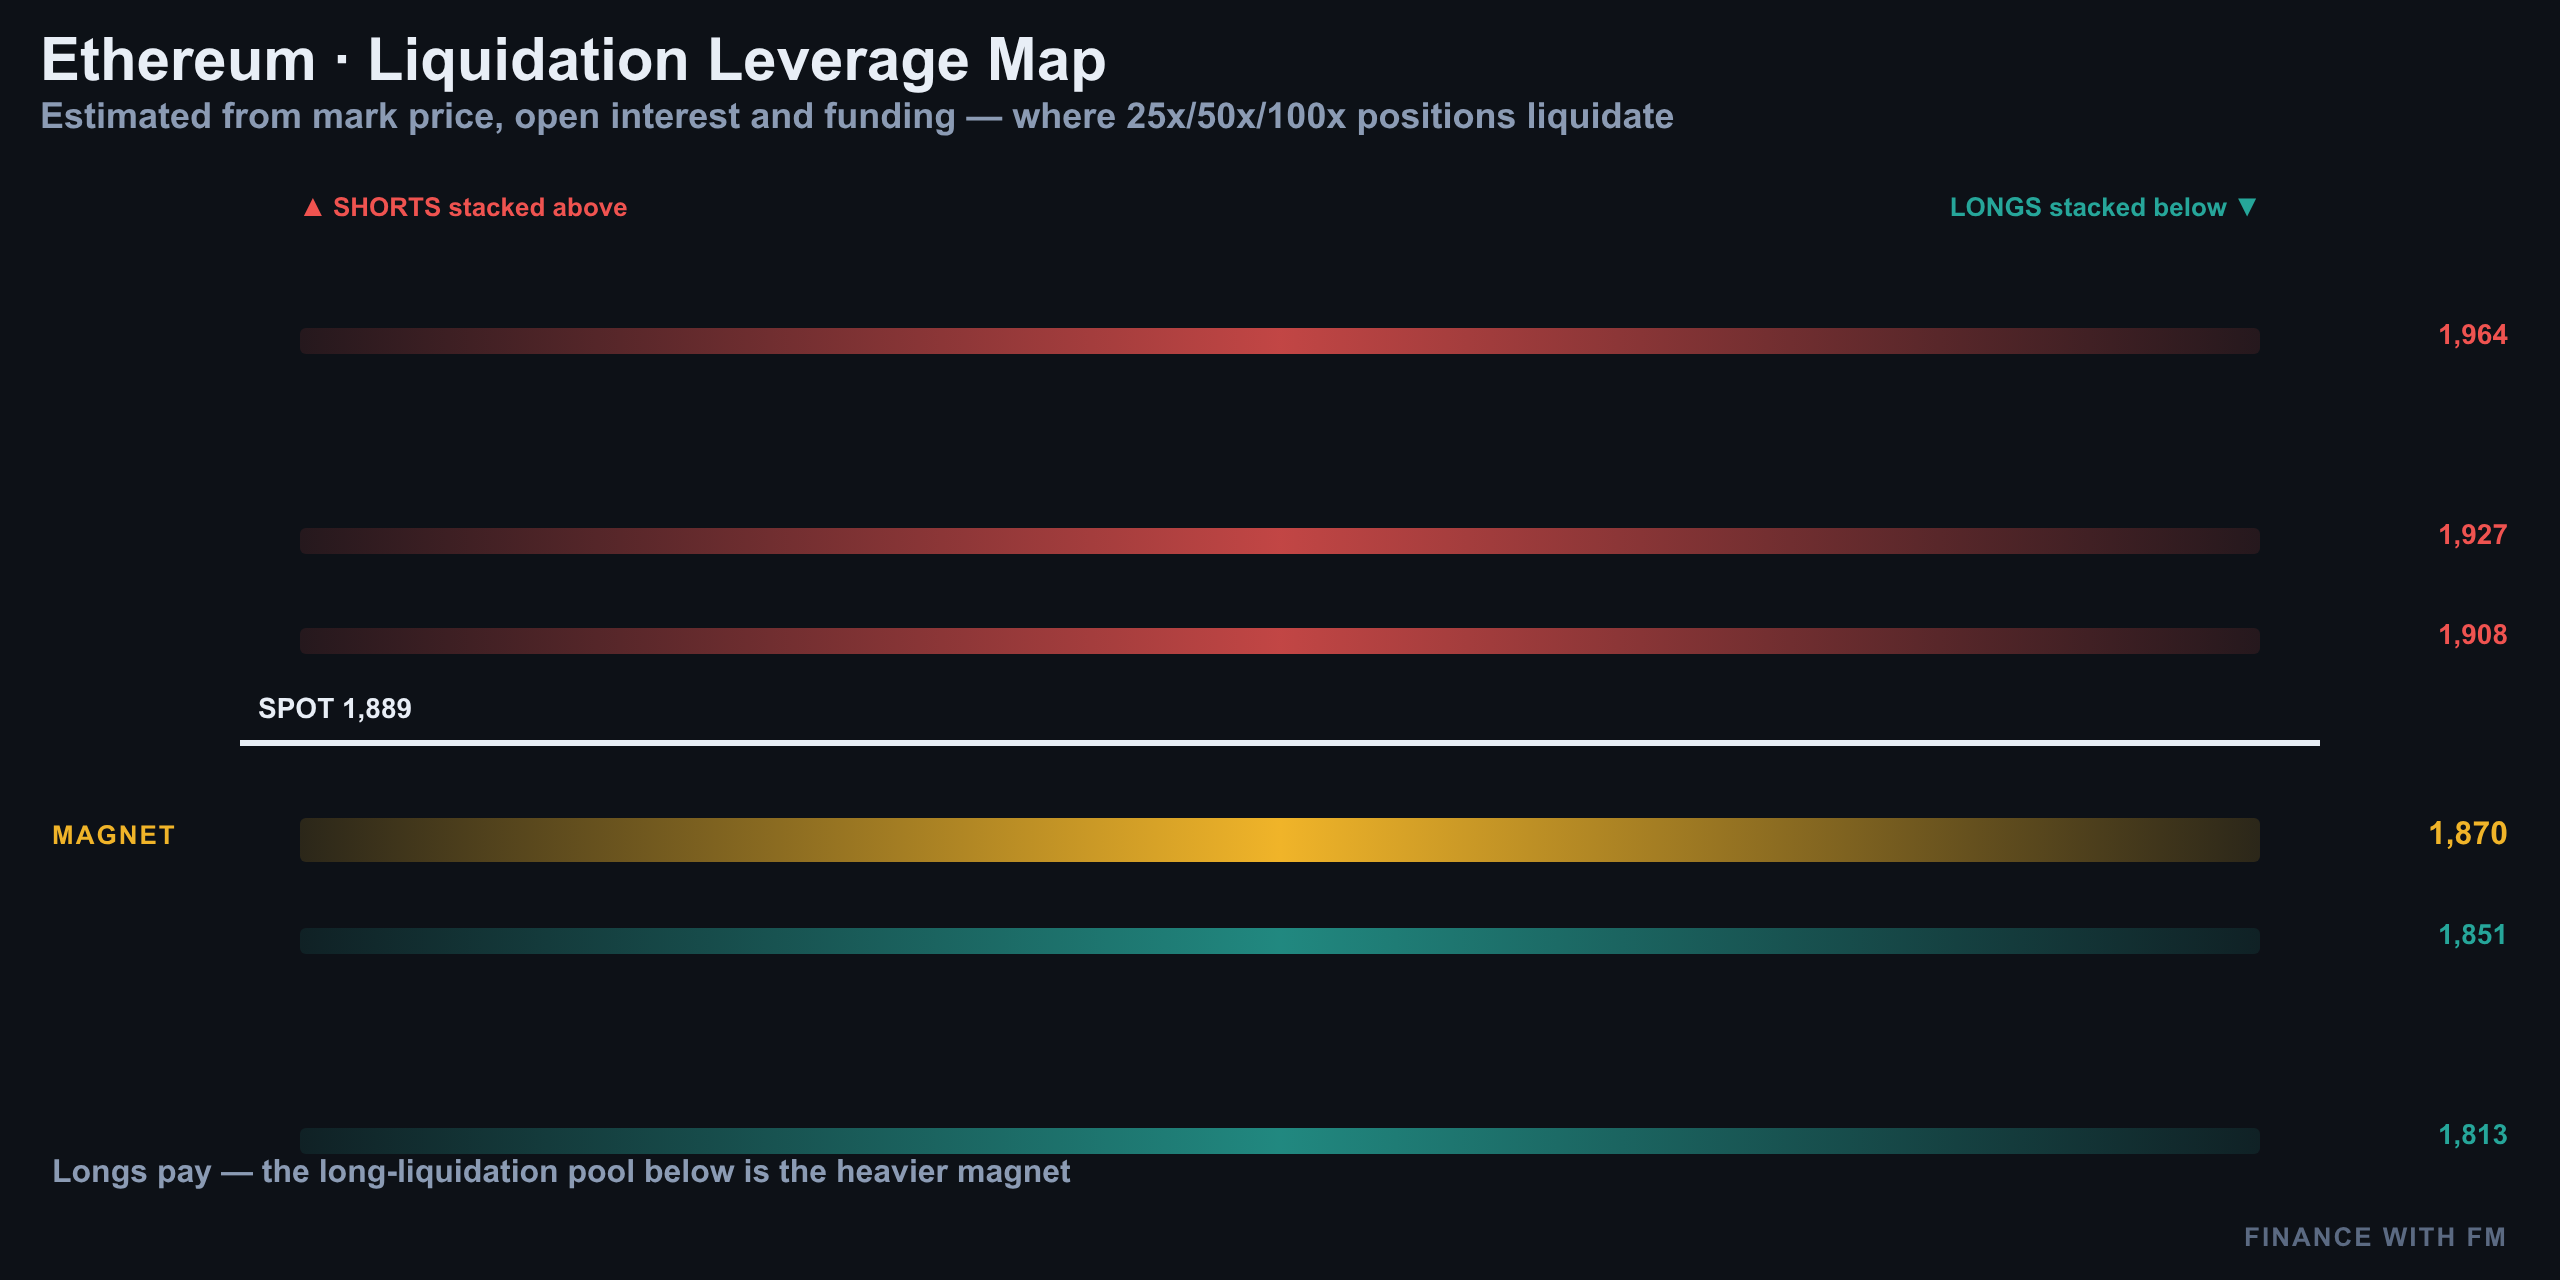
| Level | Price | Significance |
|---|---|---|
| Dealer gamma pin zone | $1,885 – $1,895 | Positive gamma; dips bought, rallies sold |
| Long liquidation cluster | ~$1,850 – $1,860 | Downside accelerant if pin breaks |
| Max Pain (nearest expiry) | $1,900 | Magnet into today's close |
| Call Wall | $2,500 | Distant upside resistance |
| Put Wall | $1,000 | Deep downside insurance floor |
Put it all together and you get three forces pulling in different directions: dealers pinning price flat via positive gamma, retail traders crowding into longs, and whale options flow quietly leaning bearish with calls sold and puts bought. Max pain sitting almost exactly at spot only reinforces the pin. Price prediction models from Binance and Changelly both show ETH essentially flatlining through mid-August in the $1,745–$1,975 zone, which lines up neatly with the options-implied expected move discussed above.
The honest read for August 11: this is a neutral, wait-for-the-break market. A decisive close above the 4-hour channel top and today's ask wall (roughly $1,900–$1,916) opens room toward the $1,940–$2,000 zone flagged by multiple independent technical reads. A break of the long-liquidation cluster near $1,850–$1,860 risks a faster slide toward the lower end of the 2-standard-deviation expected-move band near $1,807. Until one of those two walls actually gives, standing aside is the trade.
08/04/2026 — Ethereum Daily Pulse Aug 4 2026: The Level That Wakes It Up
Ethereum Daily Pulse Aug 4 2026: The Level That Wakes It Up
Ethereum Sits at the Coil — Here's the Full Picture
Ethereum is trading around $1,871, up roughly 1.5% on the day, chopping between $1,838 and $1,882. That's not a trend — that's a market holding its breath. Price is pinned almost exactly between the 50-day and 200-day moving averages, dealers are sitting in positive gamma (which means dips get bought and rallies get sold), and momentum indicators are flat across the board.
But under the surface, two very different stories are being told. Retail traders on Binance are net long at a 2.33 ratio — piling into upside bets while price grinds sideways. Top traders, meanwhile, are doing the opposite, and the options desk backs that up: over the past 72 hours, whales have been selling calls and loading puts in size. That divergence is the real story of August 4.
| Metric | Value |
|---|---|
| Spot price | $1,871 |
| 24h range | $1,838 – $1,882 |
| 24h change | +1.5% |
| Structure | Neutral / coiled |
| Dealer gamma | Positive |
Price Structure: A Coil, Not a Trend
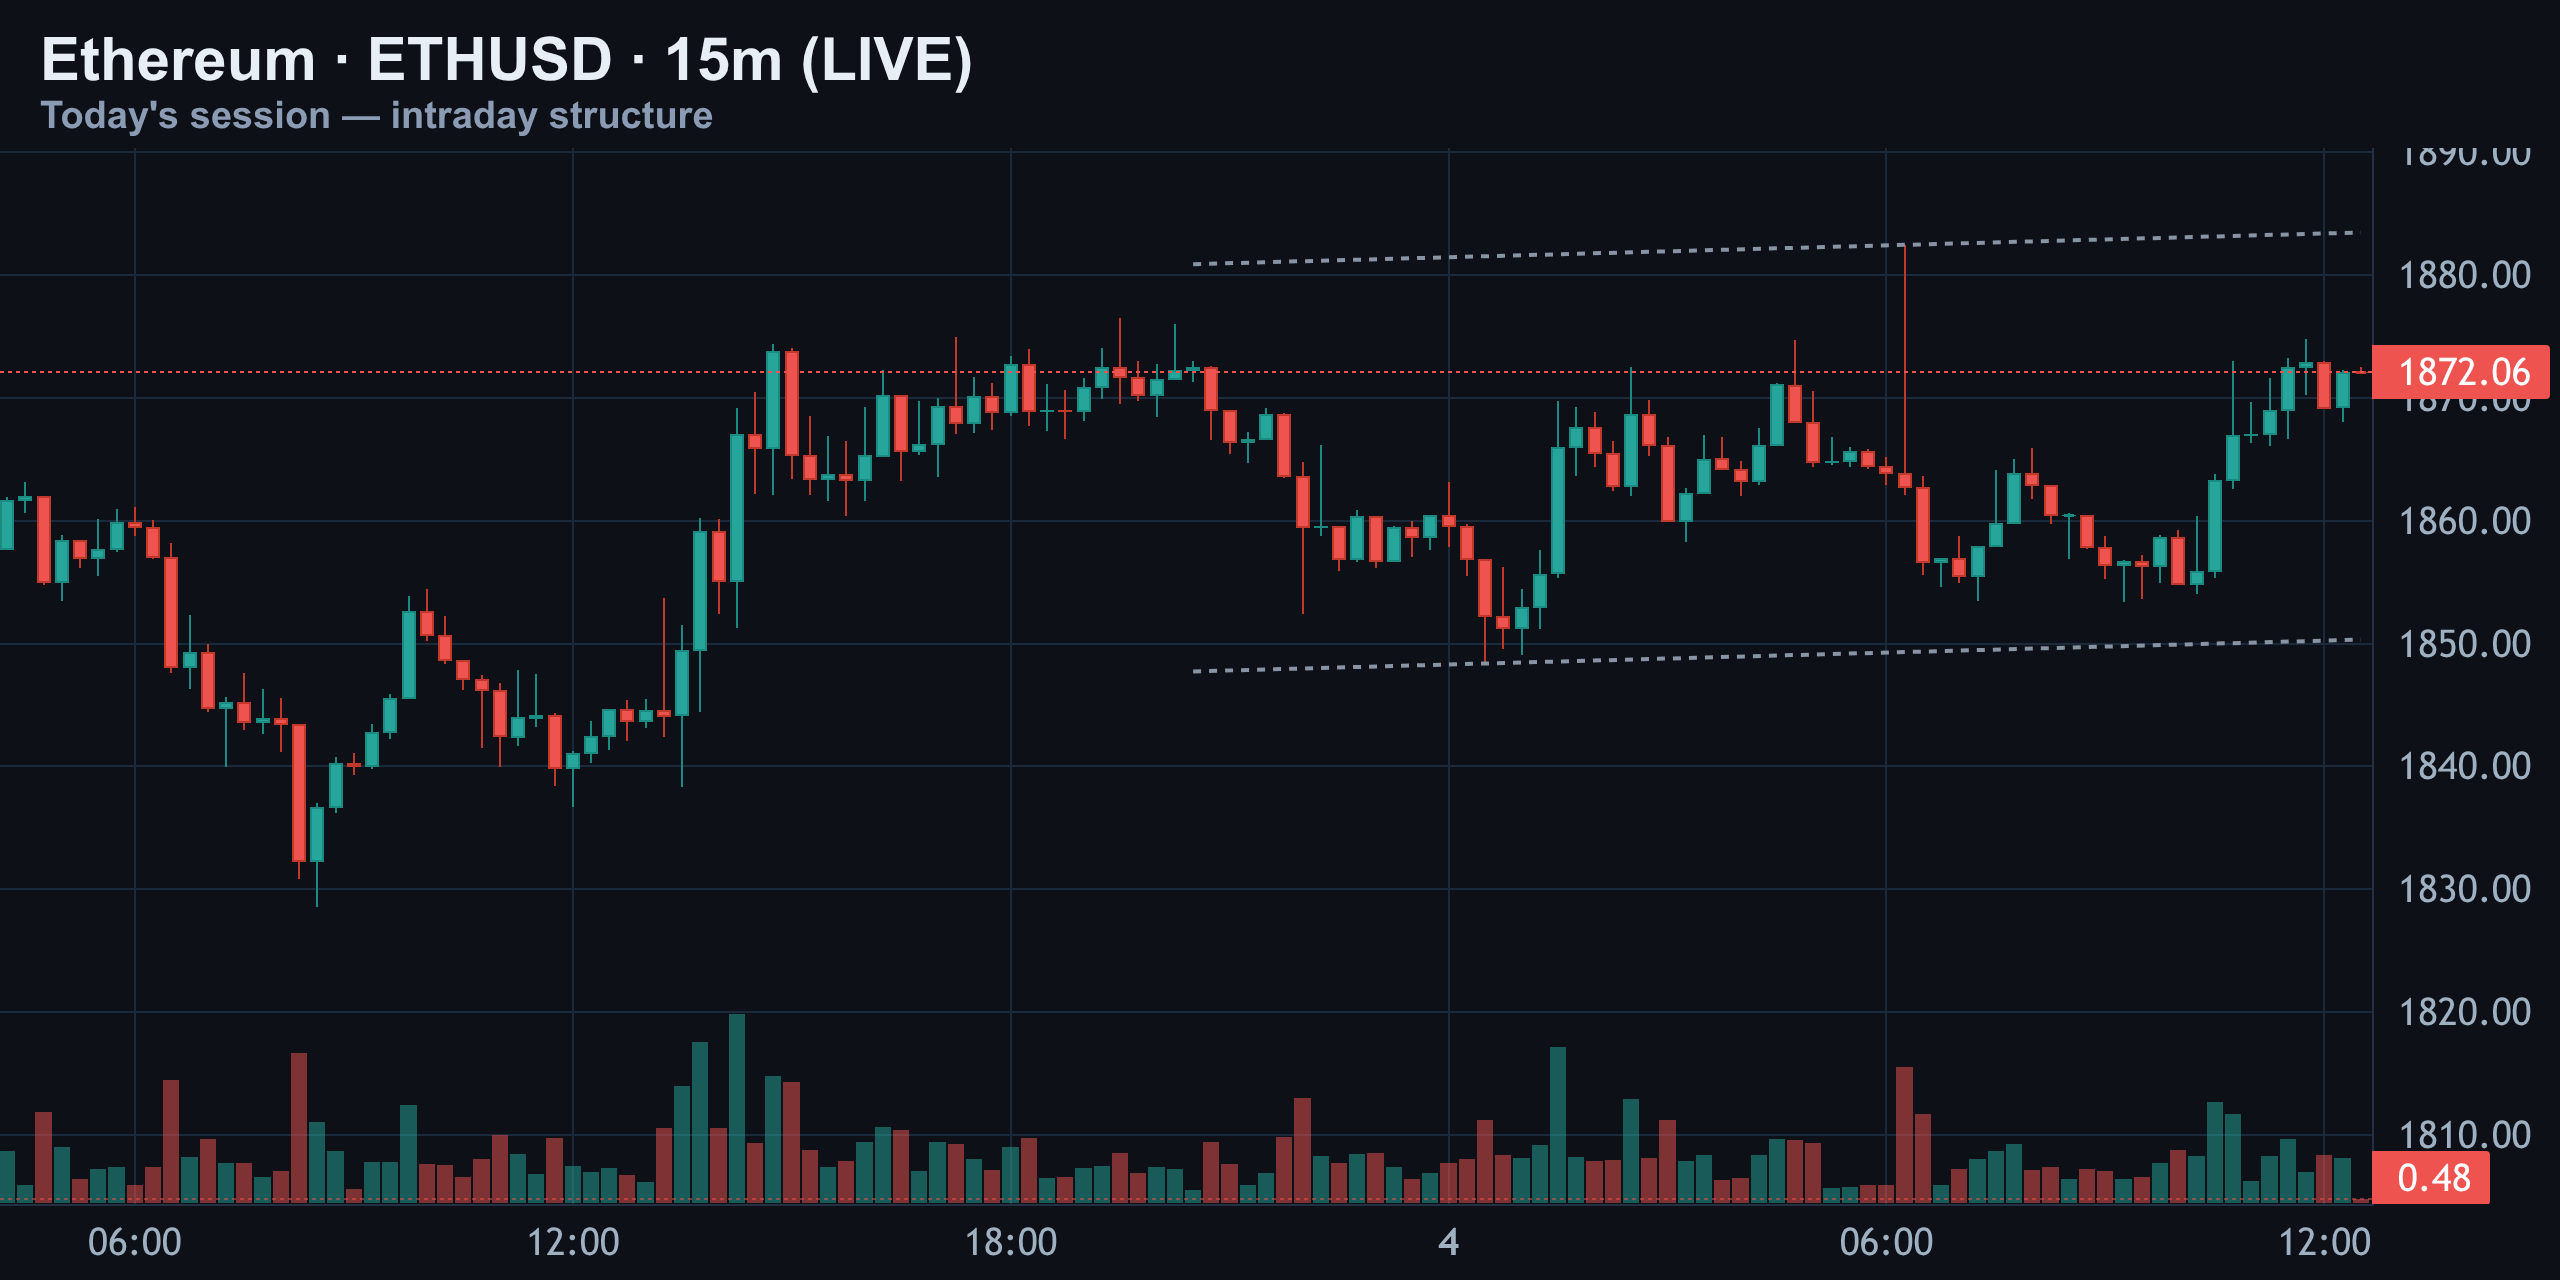
Zoom into the 15-minute chart and the setup is obvious: today's session is boxed into a shrinking triangle. Price dipped to $1,838 overnight, ripped back above $1,870, and has been chopping around $1,872 since. Two dashed trendlines are converging — resistance sloping down from near $1,880, support sloping up from around $1,848. Volume on the bars underneath is thin, which confirms this is consolidation, not conviction. Whichever line breaks first, breaks with force.
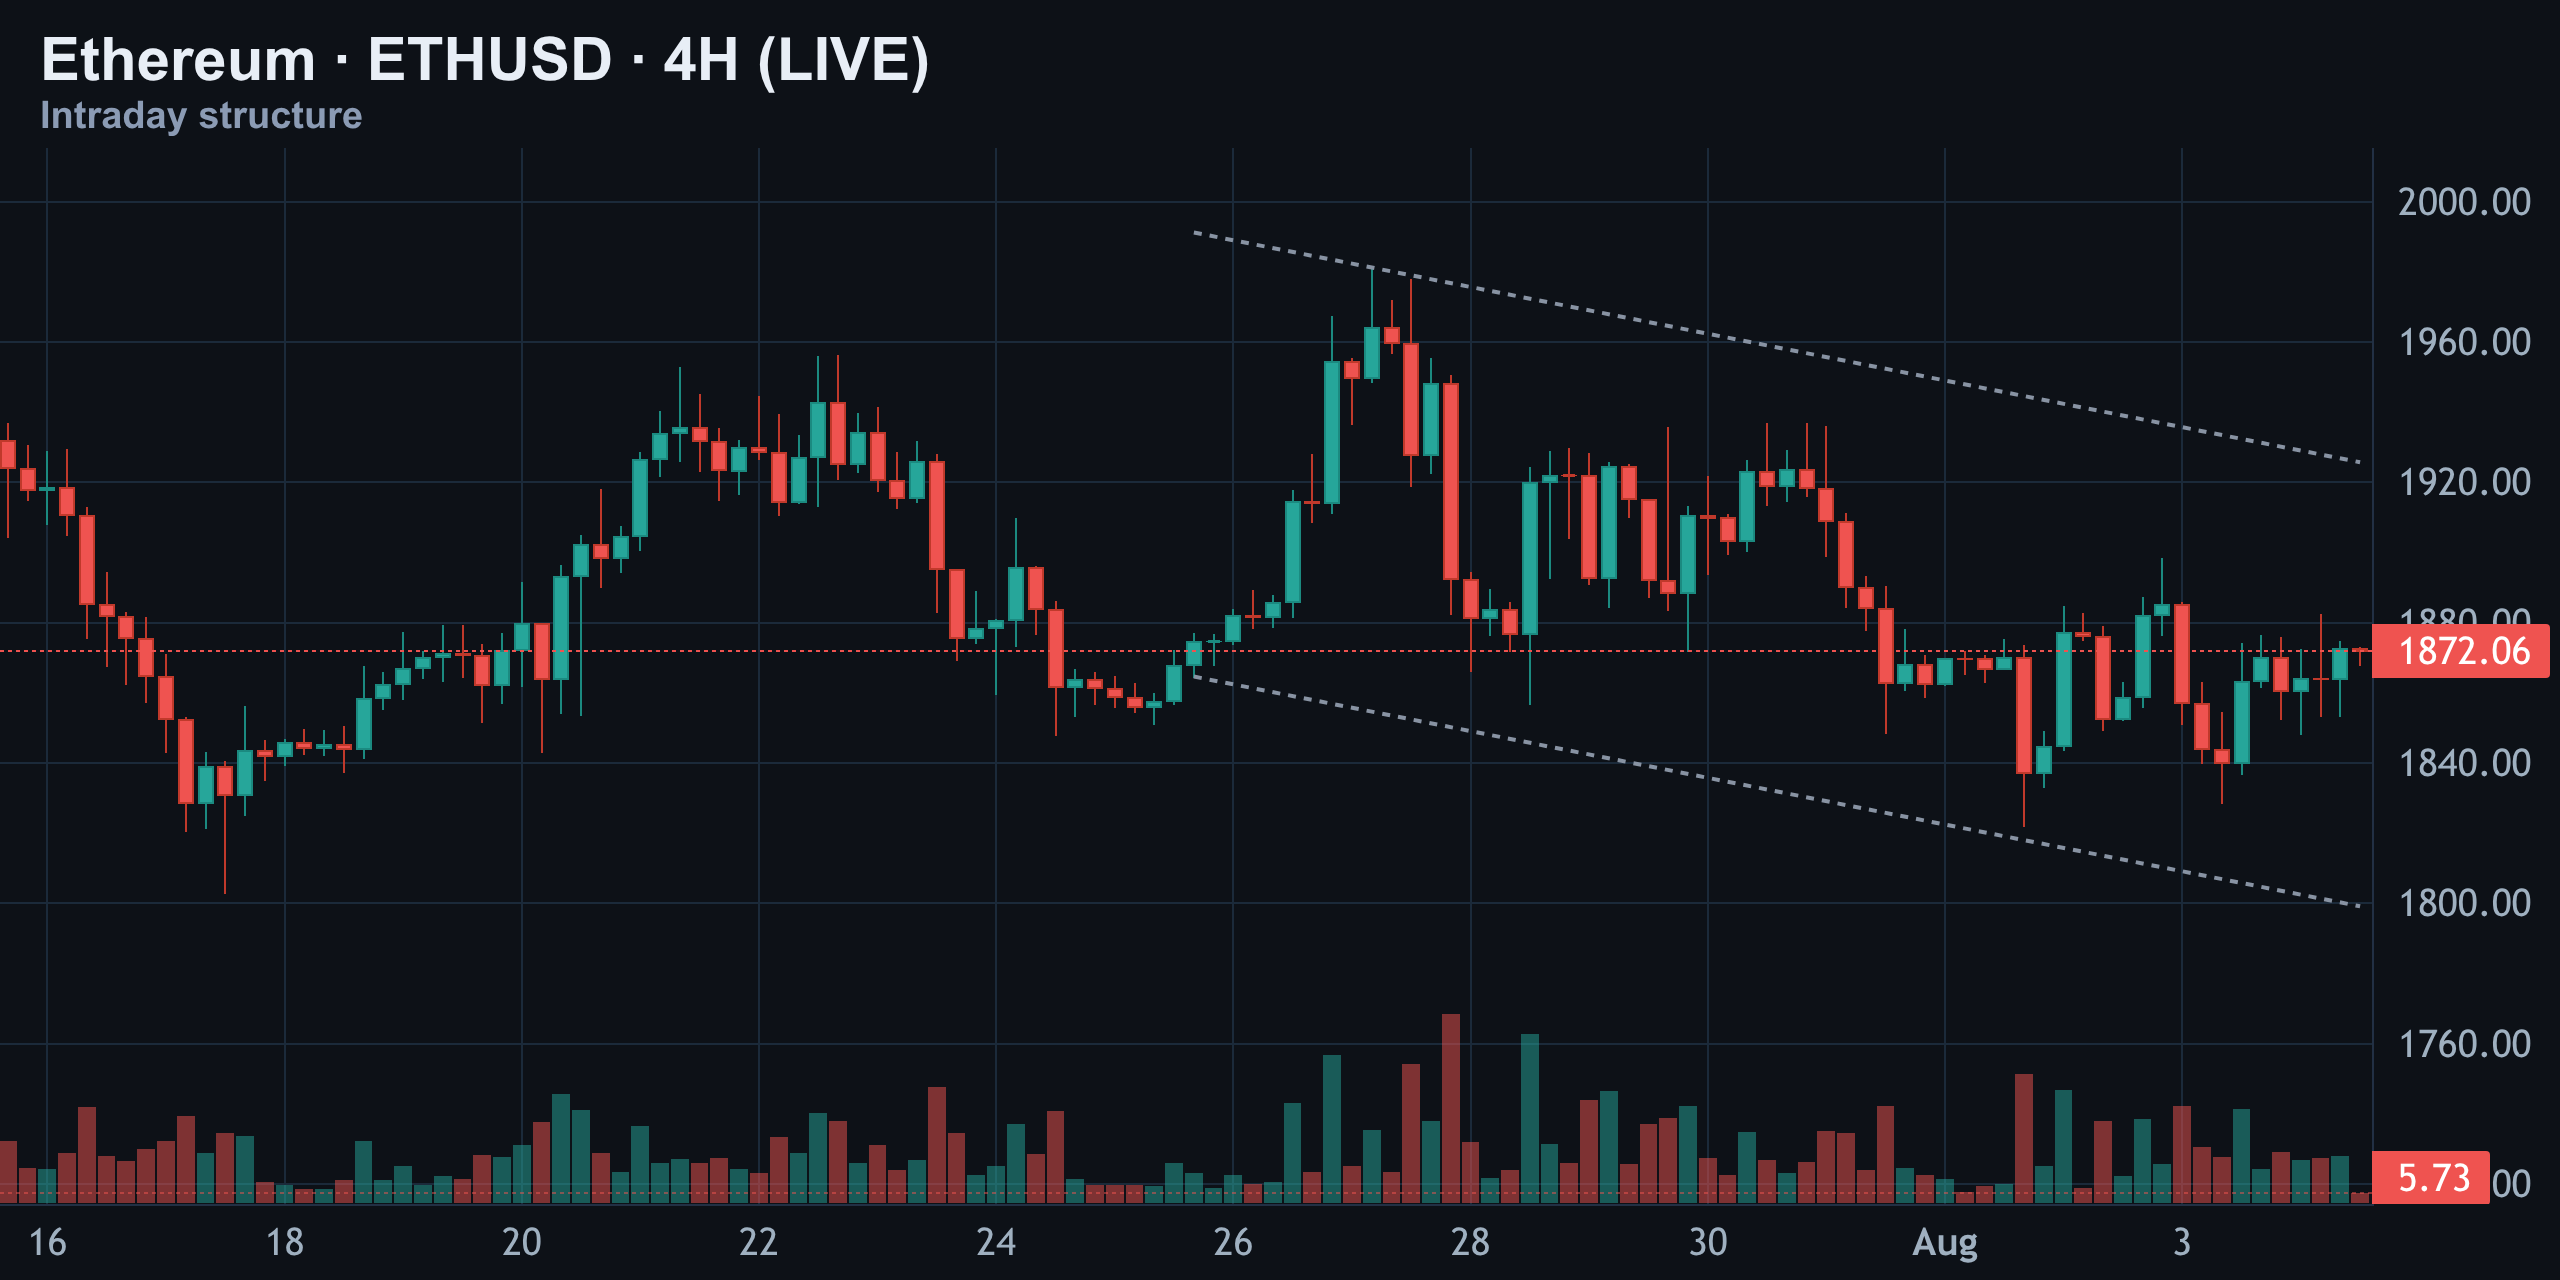
Step back to the 4-hour chart and the same story repeats at a larger scale — price is boxed between the 50 and 200-period averages with no clear directional bias. The daily chart tells the same tale: short-term structure is neutral, with neither bulls nor bears controlling the tape.
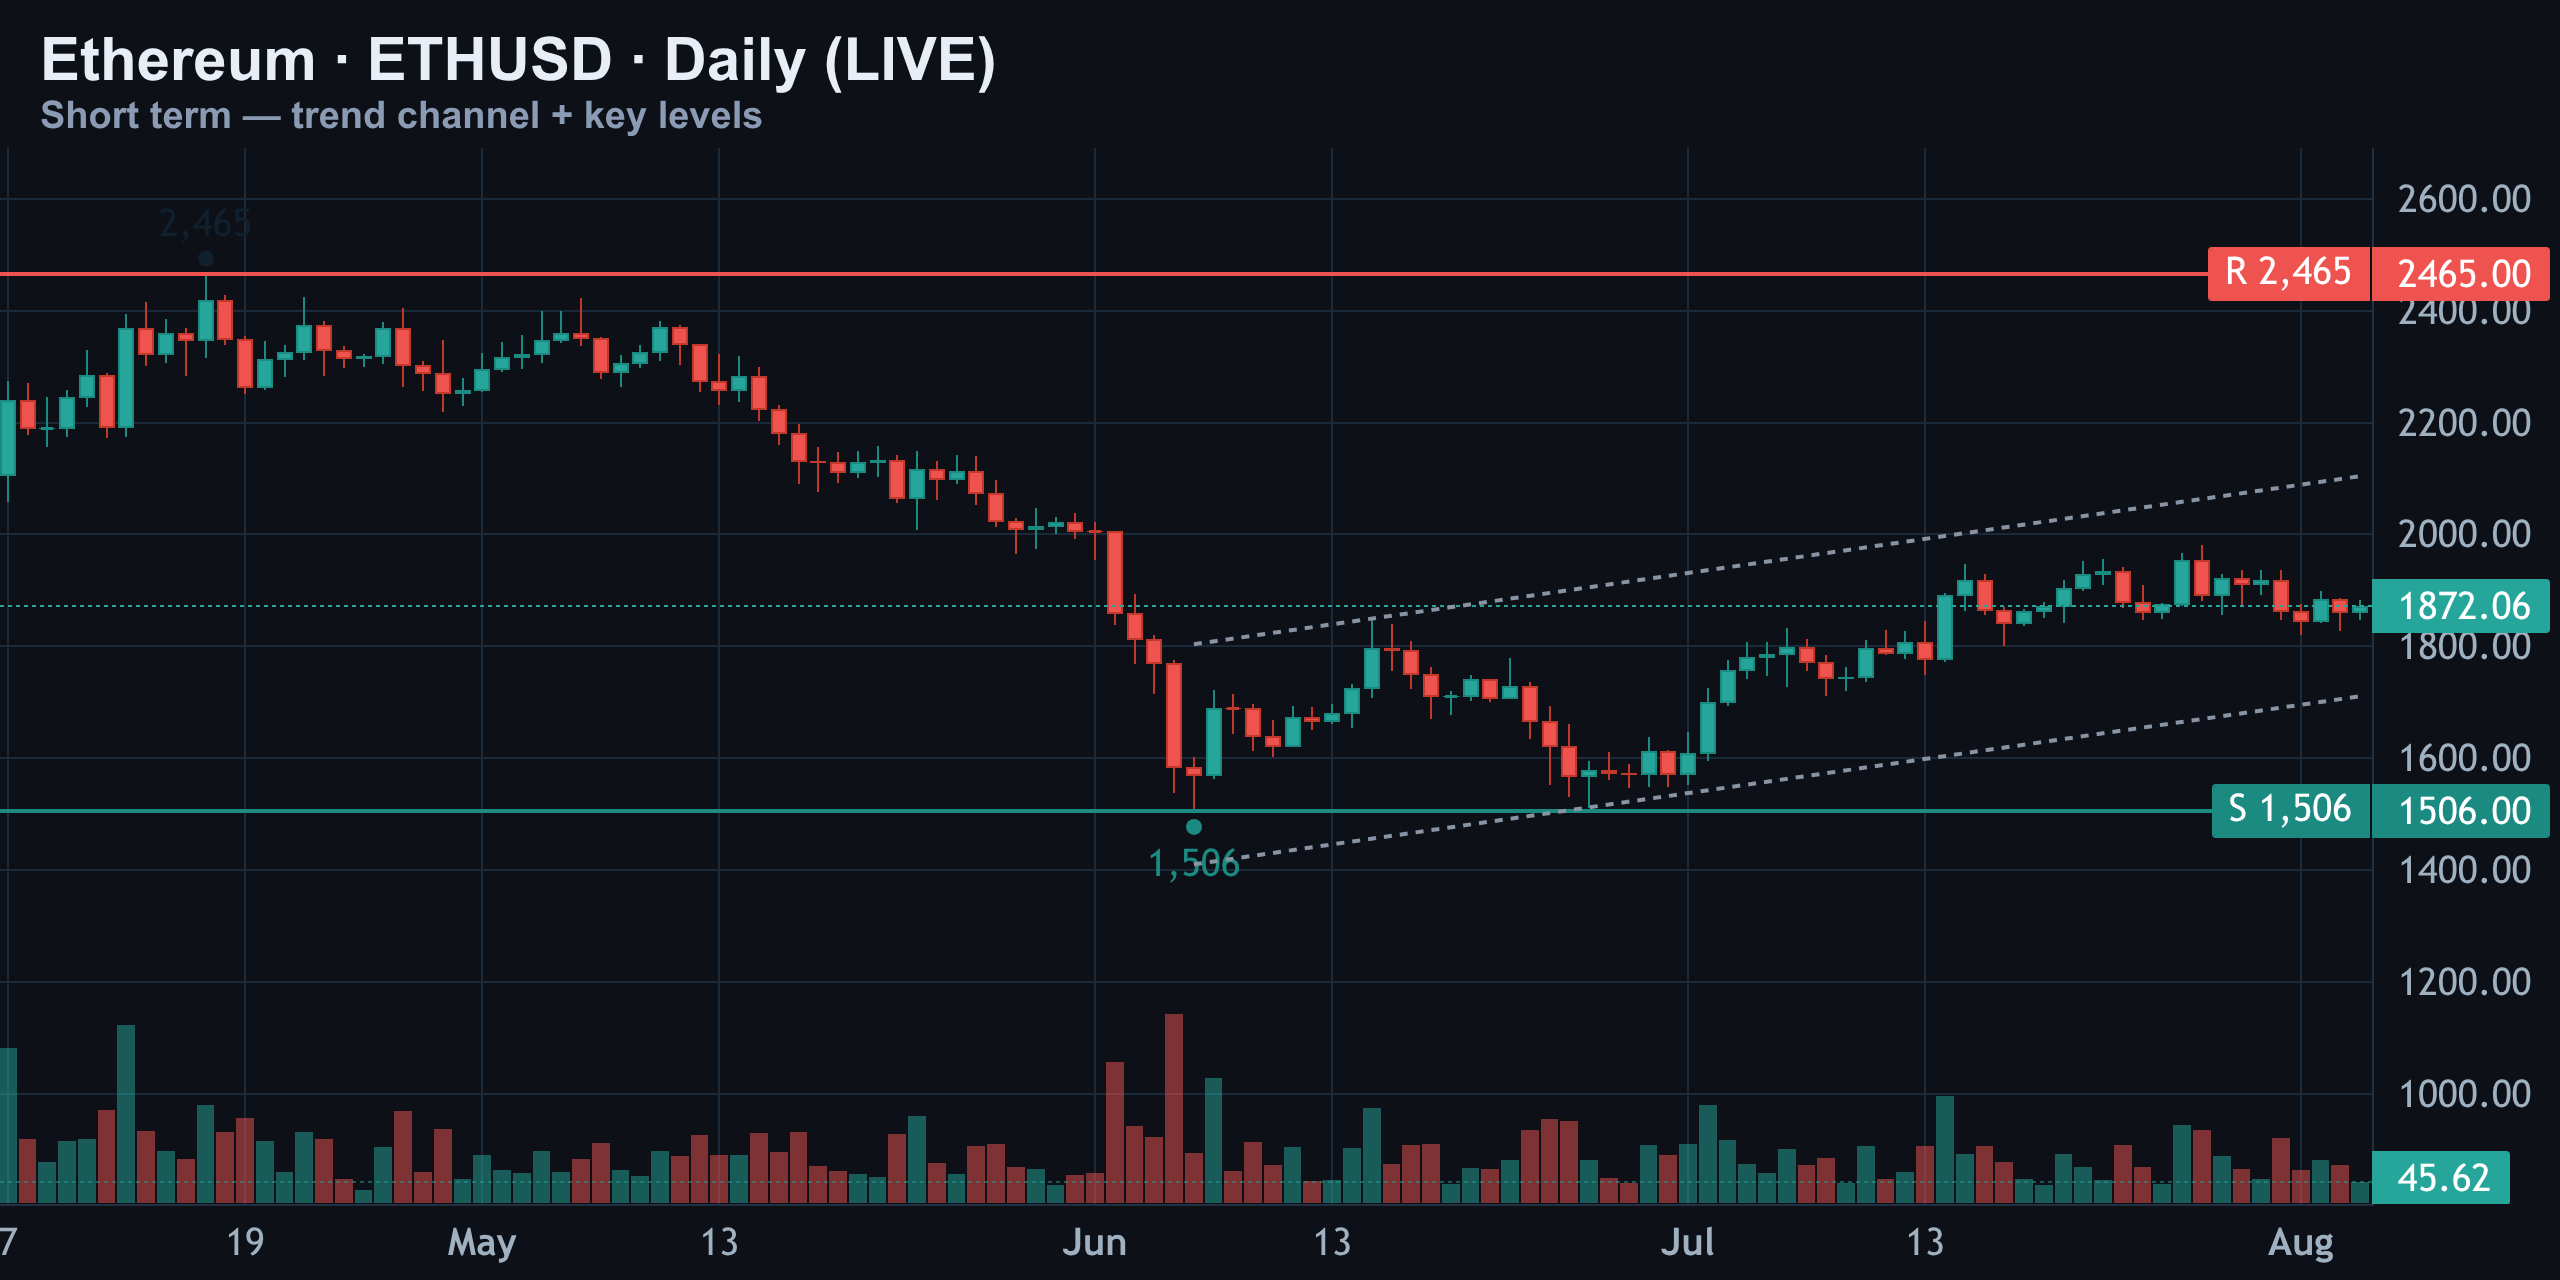
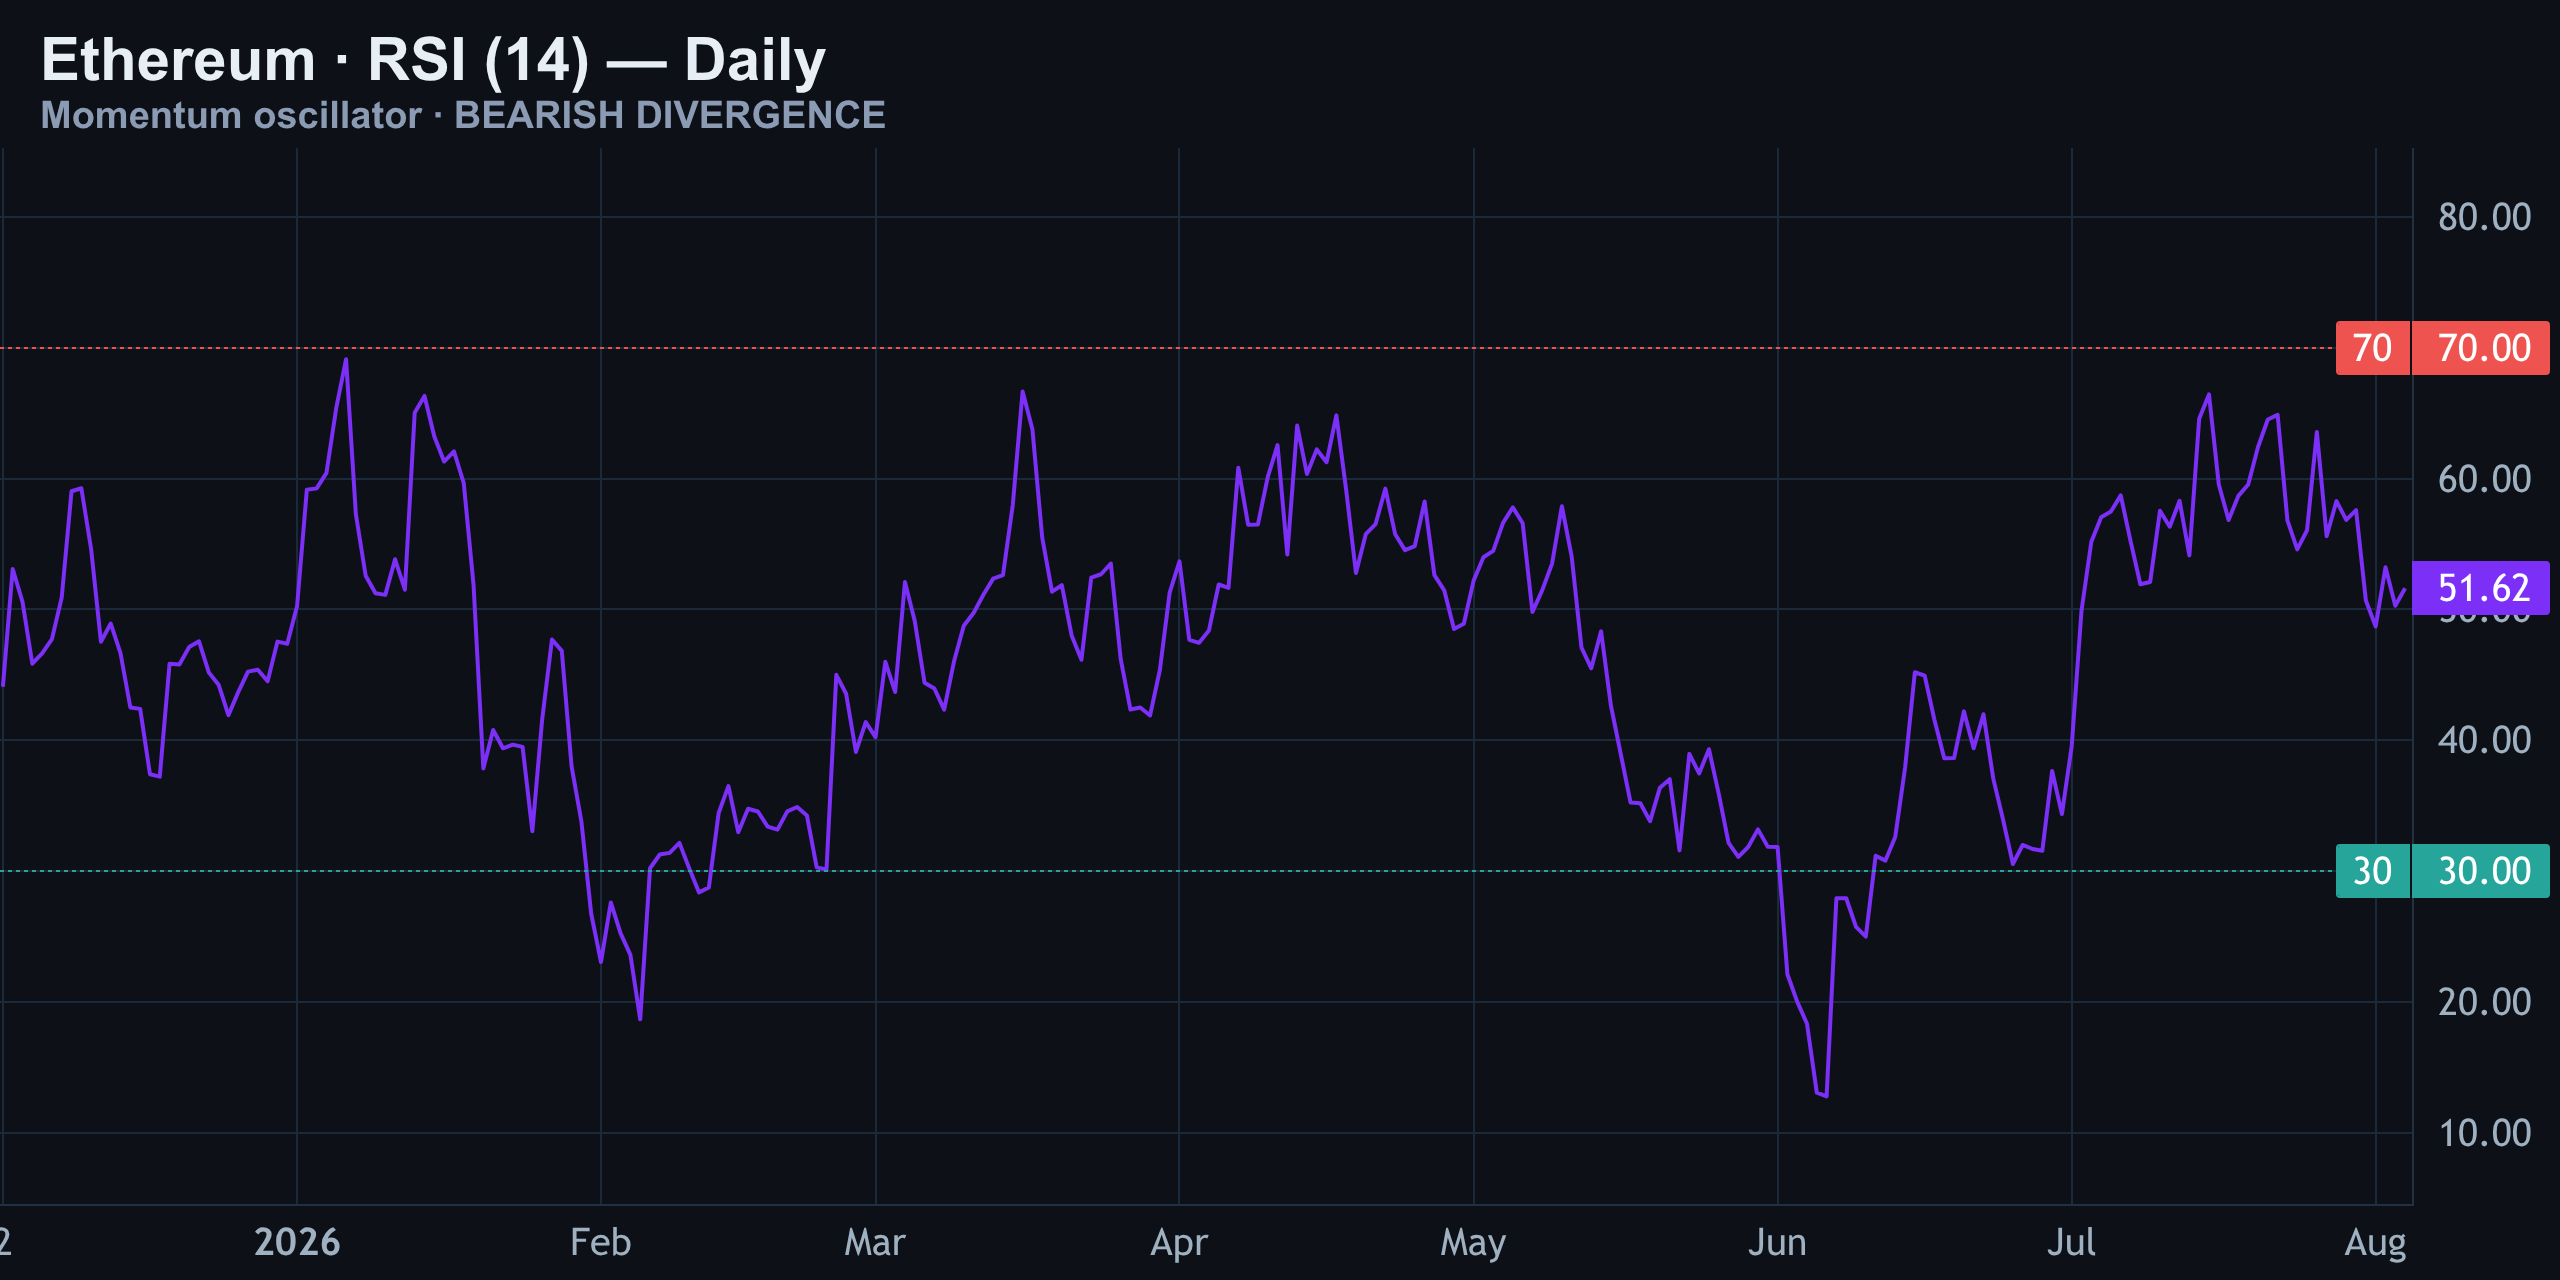
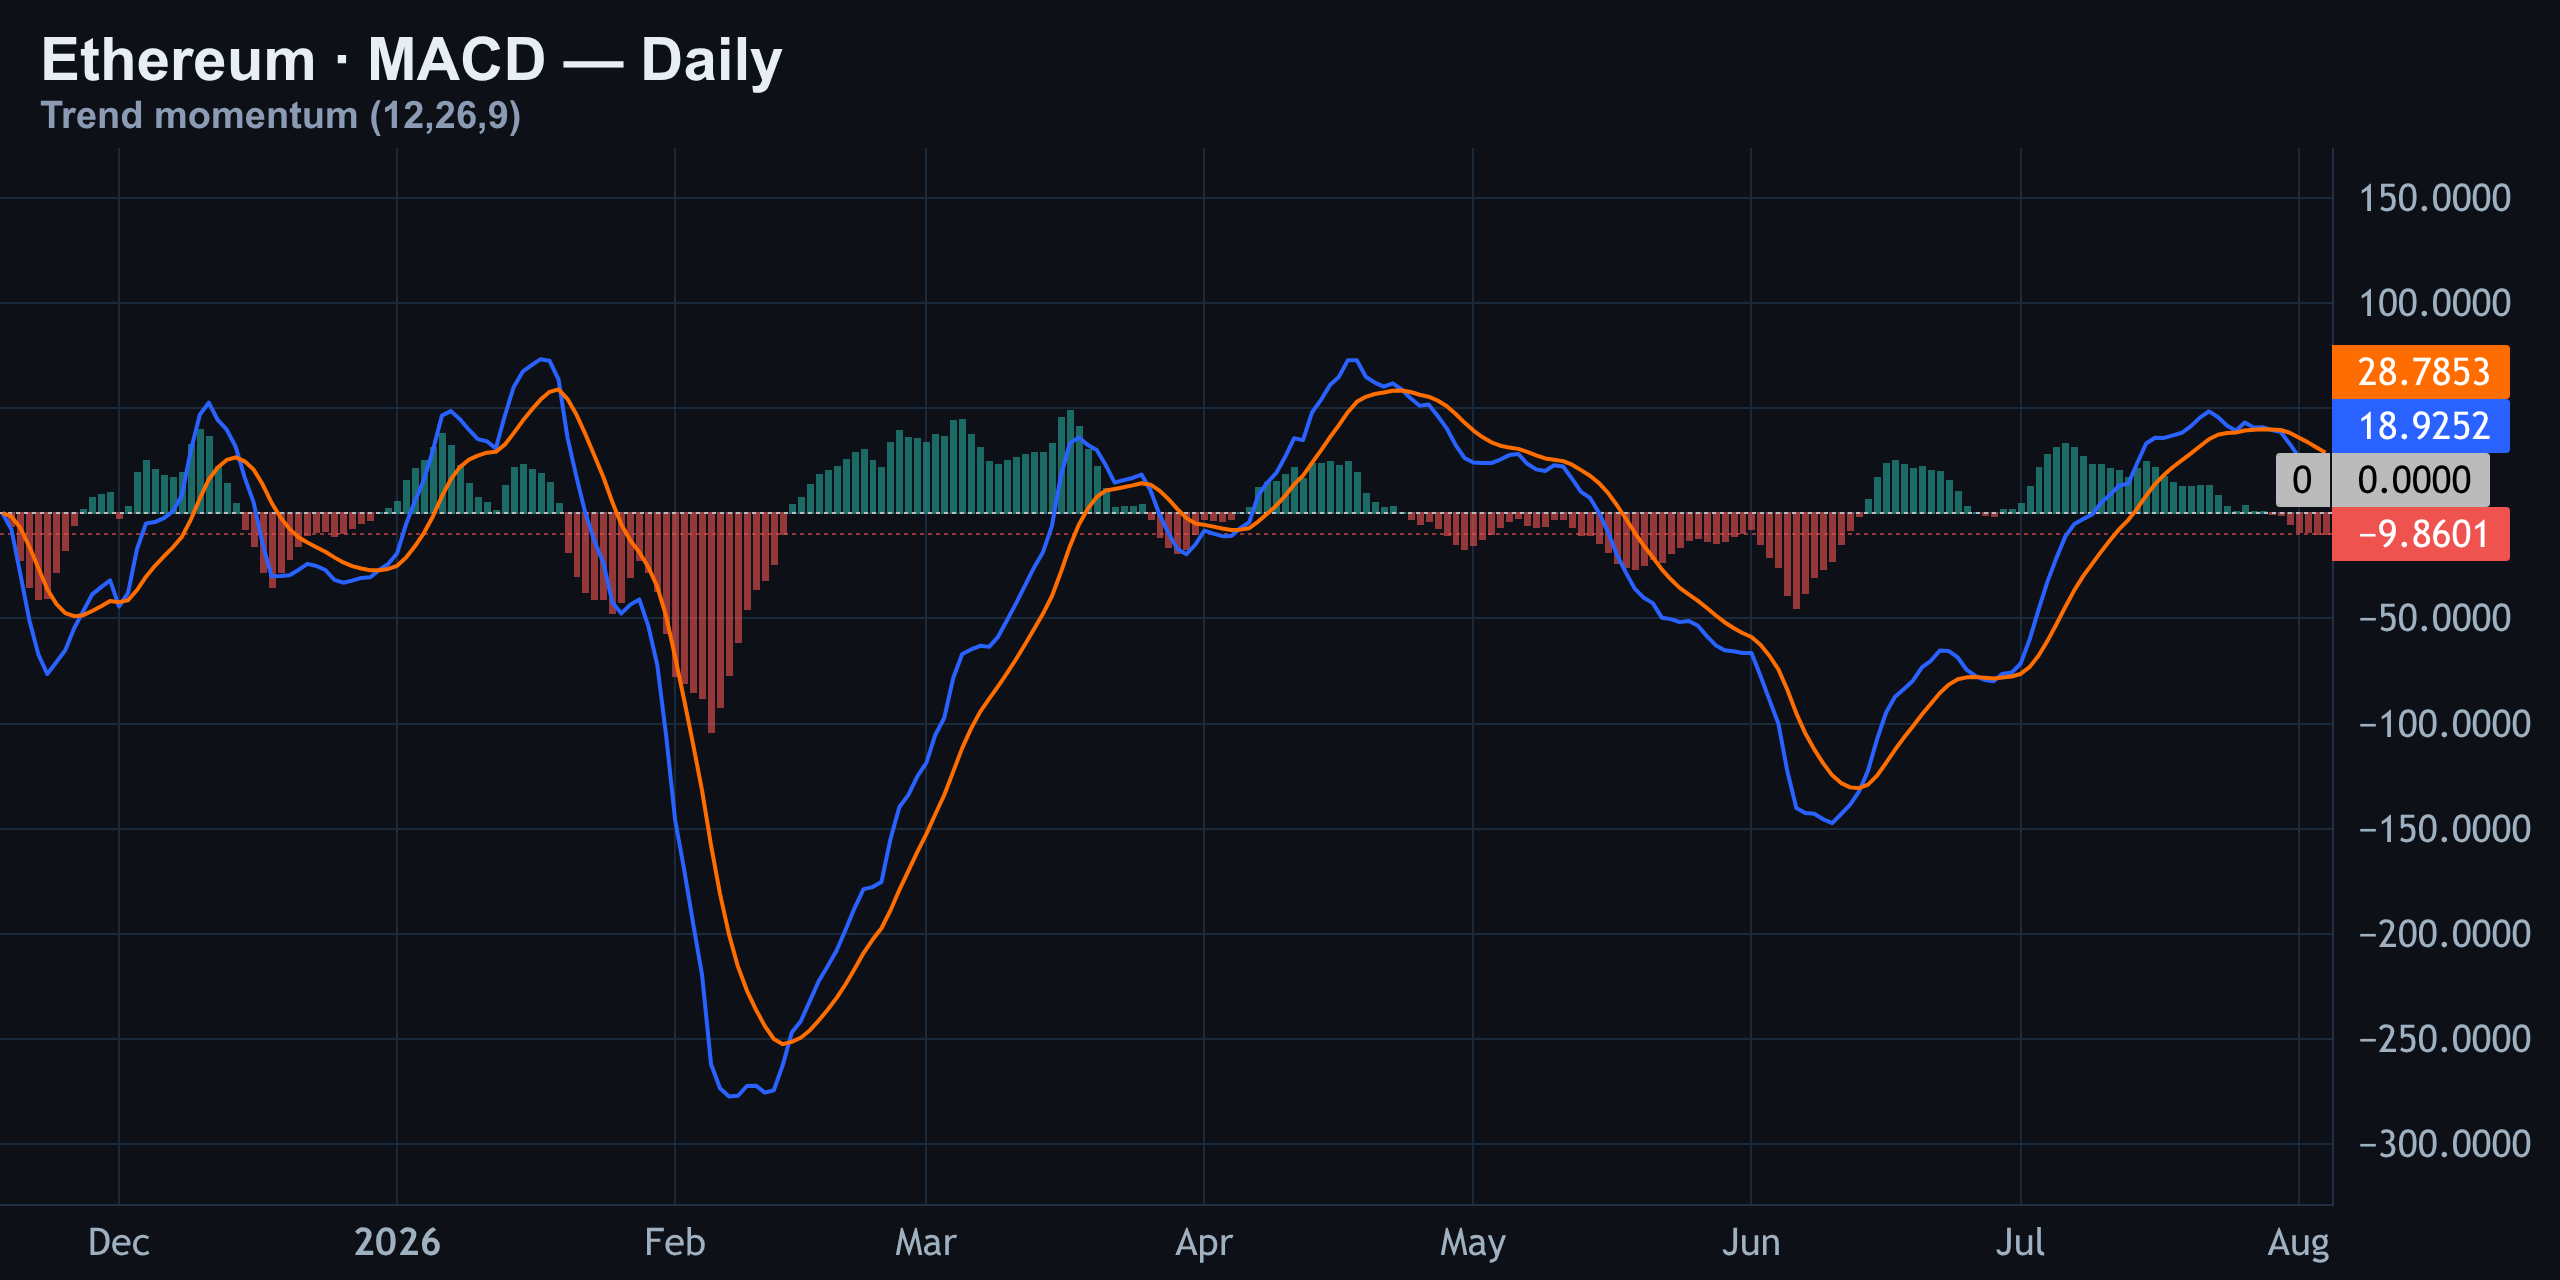
Momentum confirms the standoff. RSI(14) is sitting near the midline — neither overbought nor oversold, just flat. MACD is hugging the zero line with no meaningful histogram expansion in either direction. Both are textbook readings for a market that's waiting on a catalyst rather than trading one.
Options Positioning: Bullish Structure, Cautious Flow
The options open interest board leans bullish on paper — but the details matter more than the headline. The put-to-call ratio by open interest is 0.53, meaning more calls are outstanding than puts, a bullish-leaning skew built up over time. But today's volume ratio is nearly even at 0.93, which tells you fresh flow isn't chasing calls the way the existing book suggests. New money is far more balanced than old positioning.
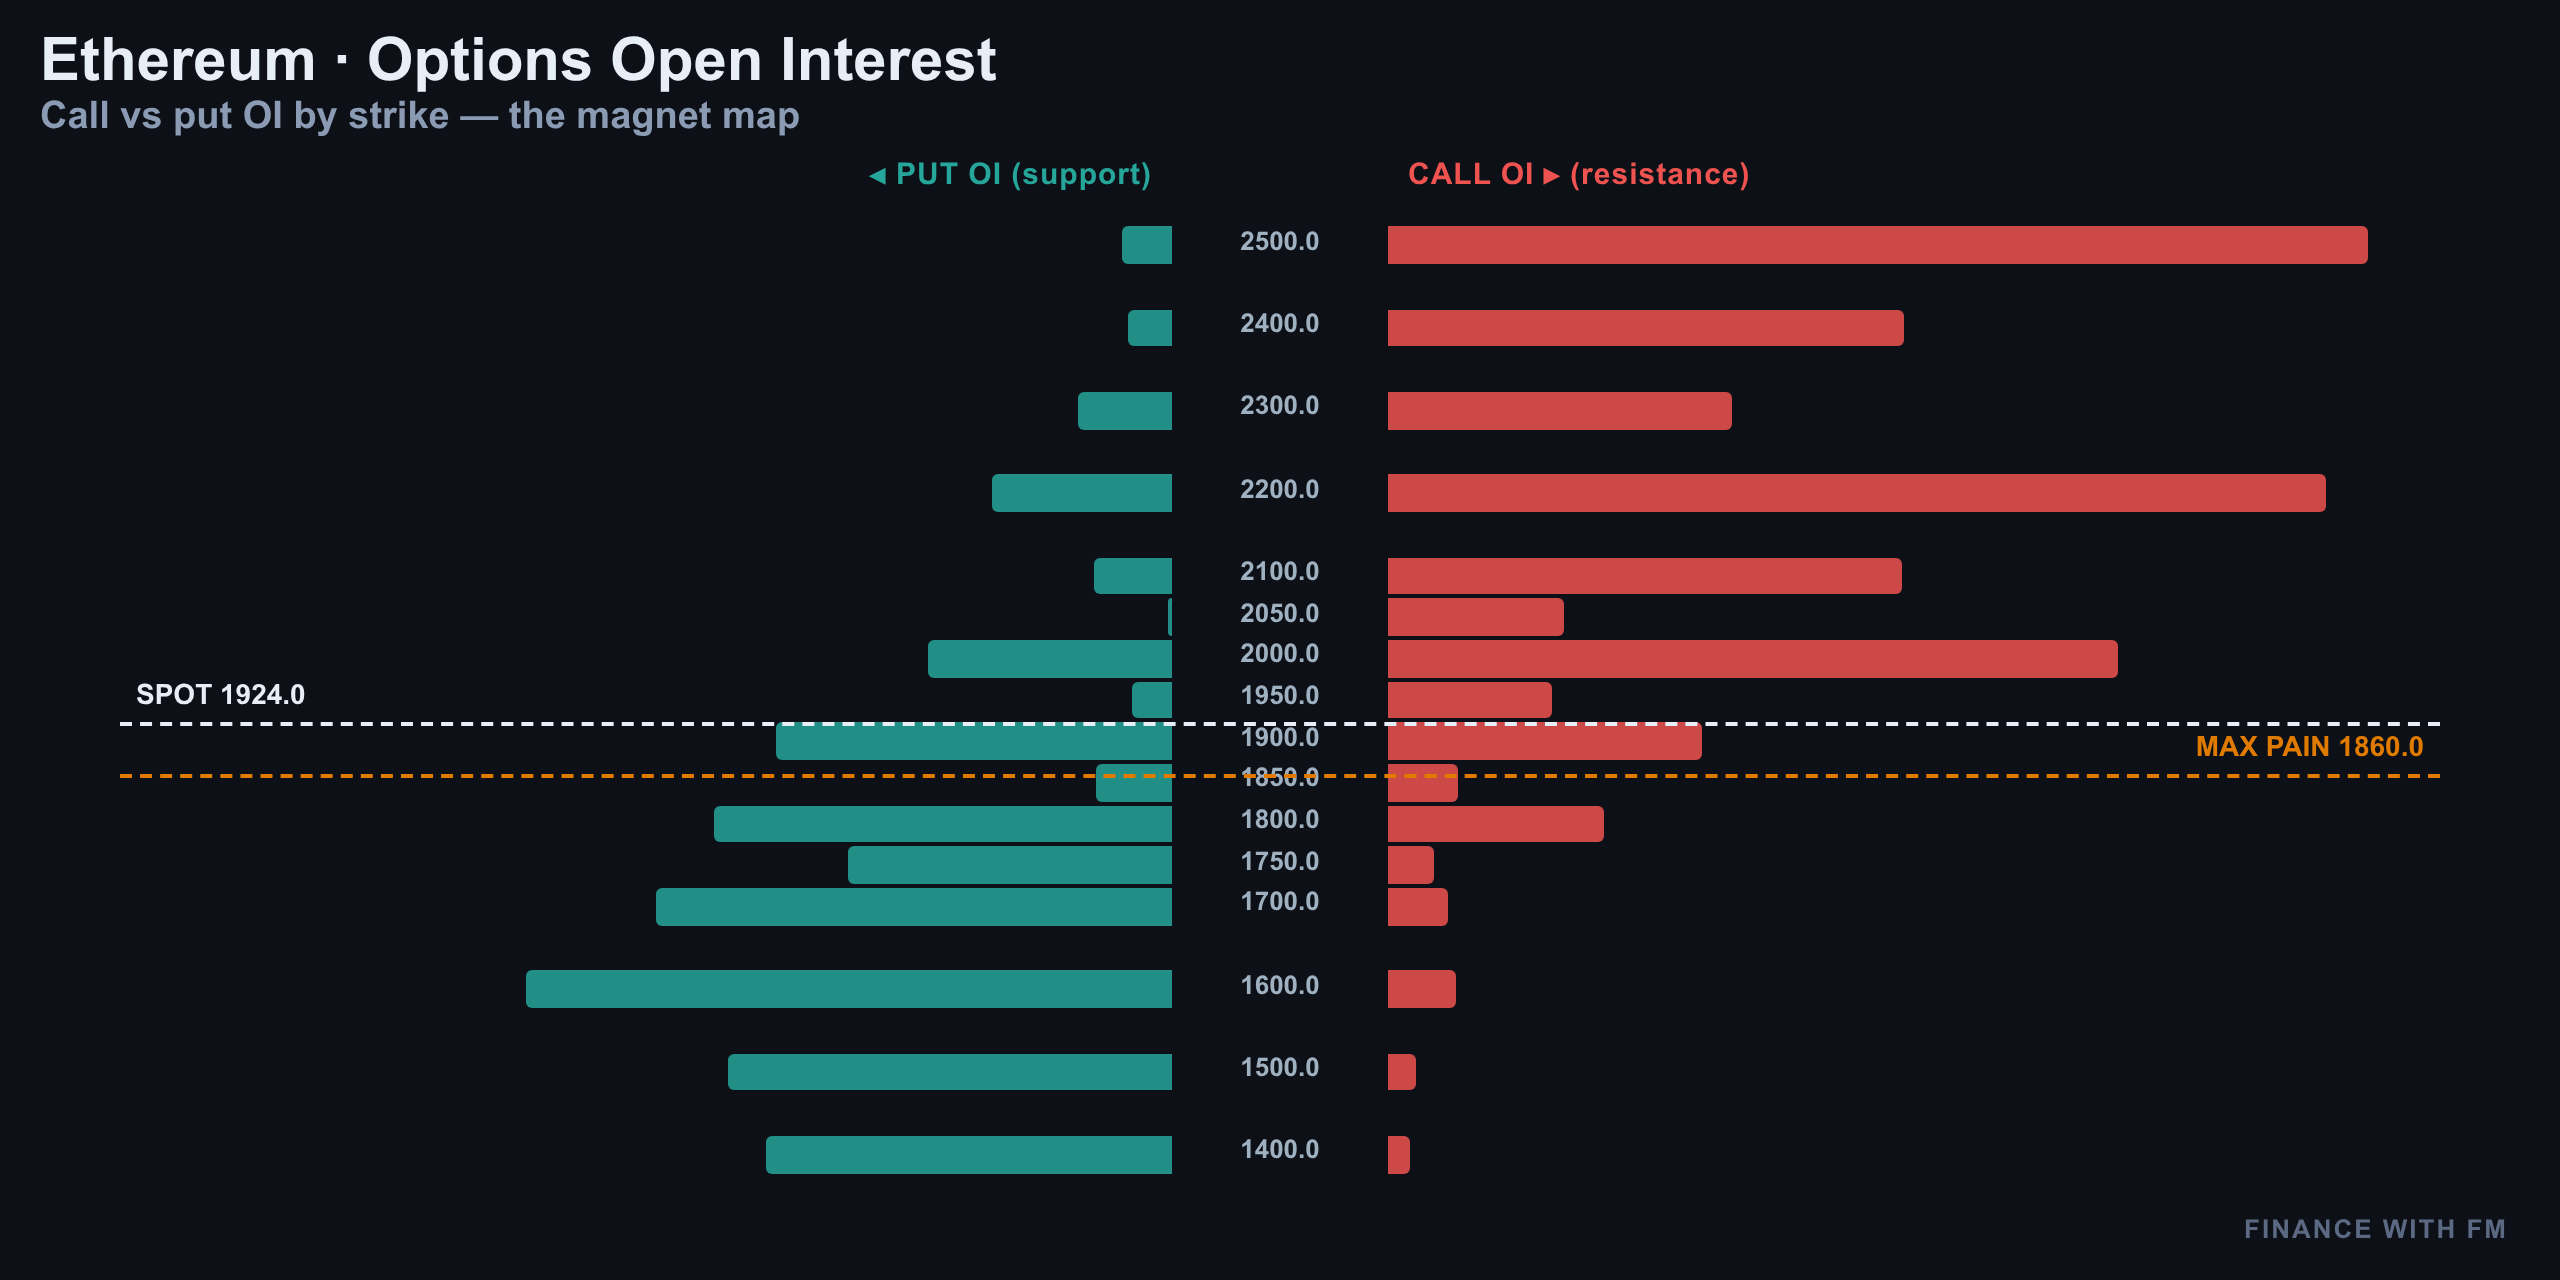
Max pain for the nearest expiry sits at $1,860 — essentially where spot is trading right now, acting like a magnet pulling price into that pin heading into expiry. The real structural walls are much further away and don't matter this week: a call wall at $2,500 and a put wall at $1,600.
| Metric | Value |
|---|---|
| Put/Call ratio (OI) | 0.53 |
| Put/Call ratio (Volume) | 0.93 |
| Max pain (nearest expiry) | $1,860 |
| Call wall | $2,500 |
| Put wall | $1,600 |
Volatility: Options Are Priced Richer Than Reality
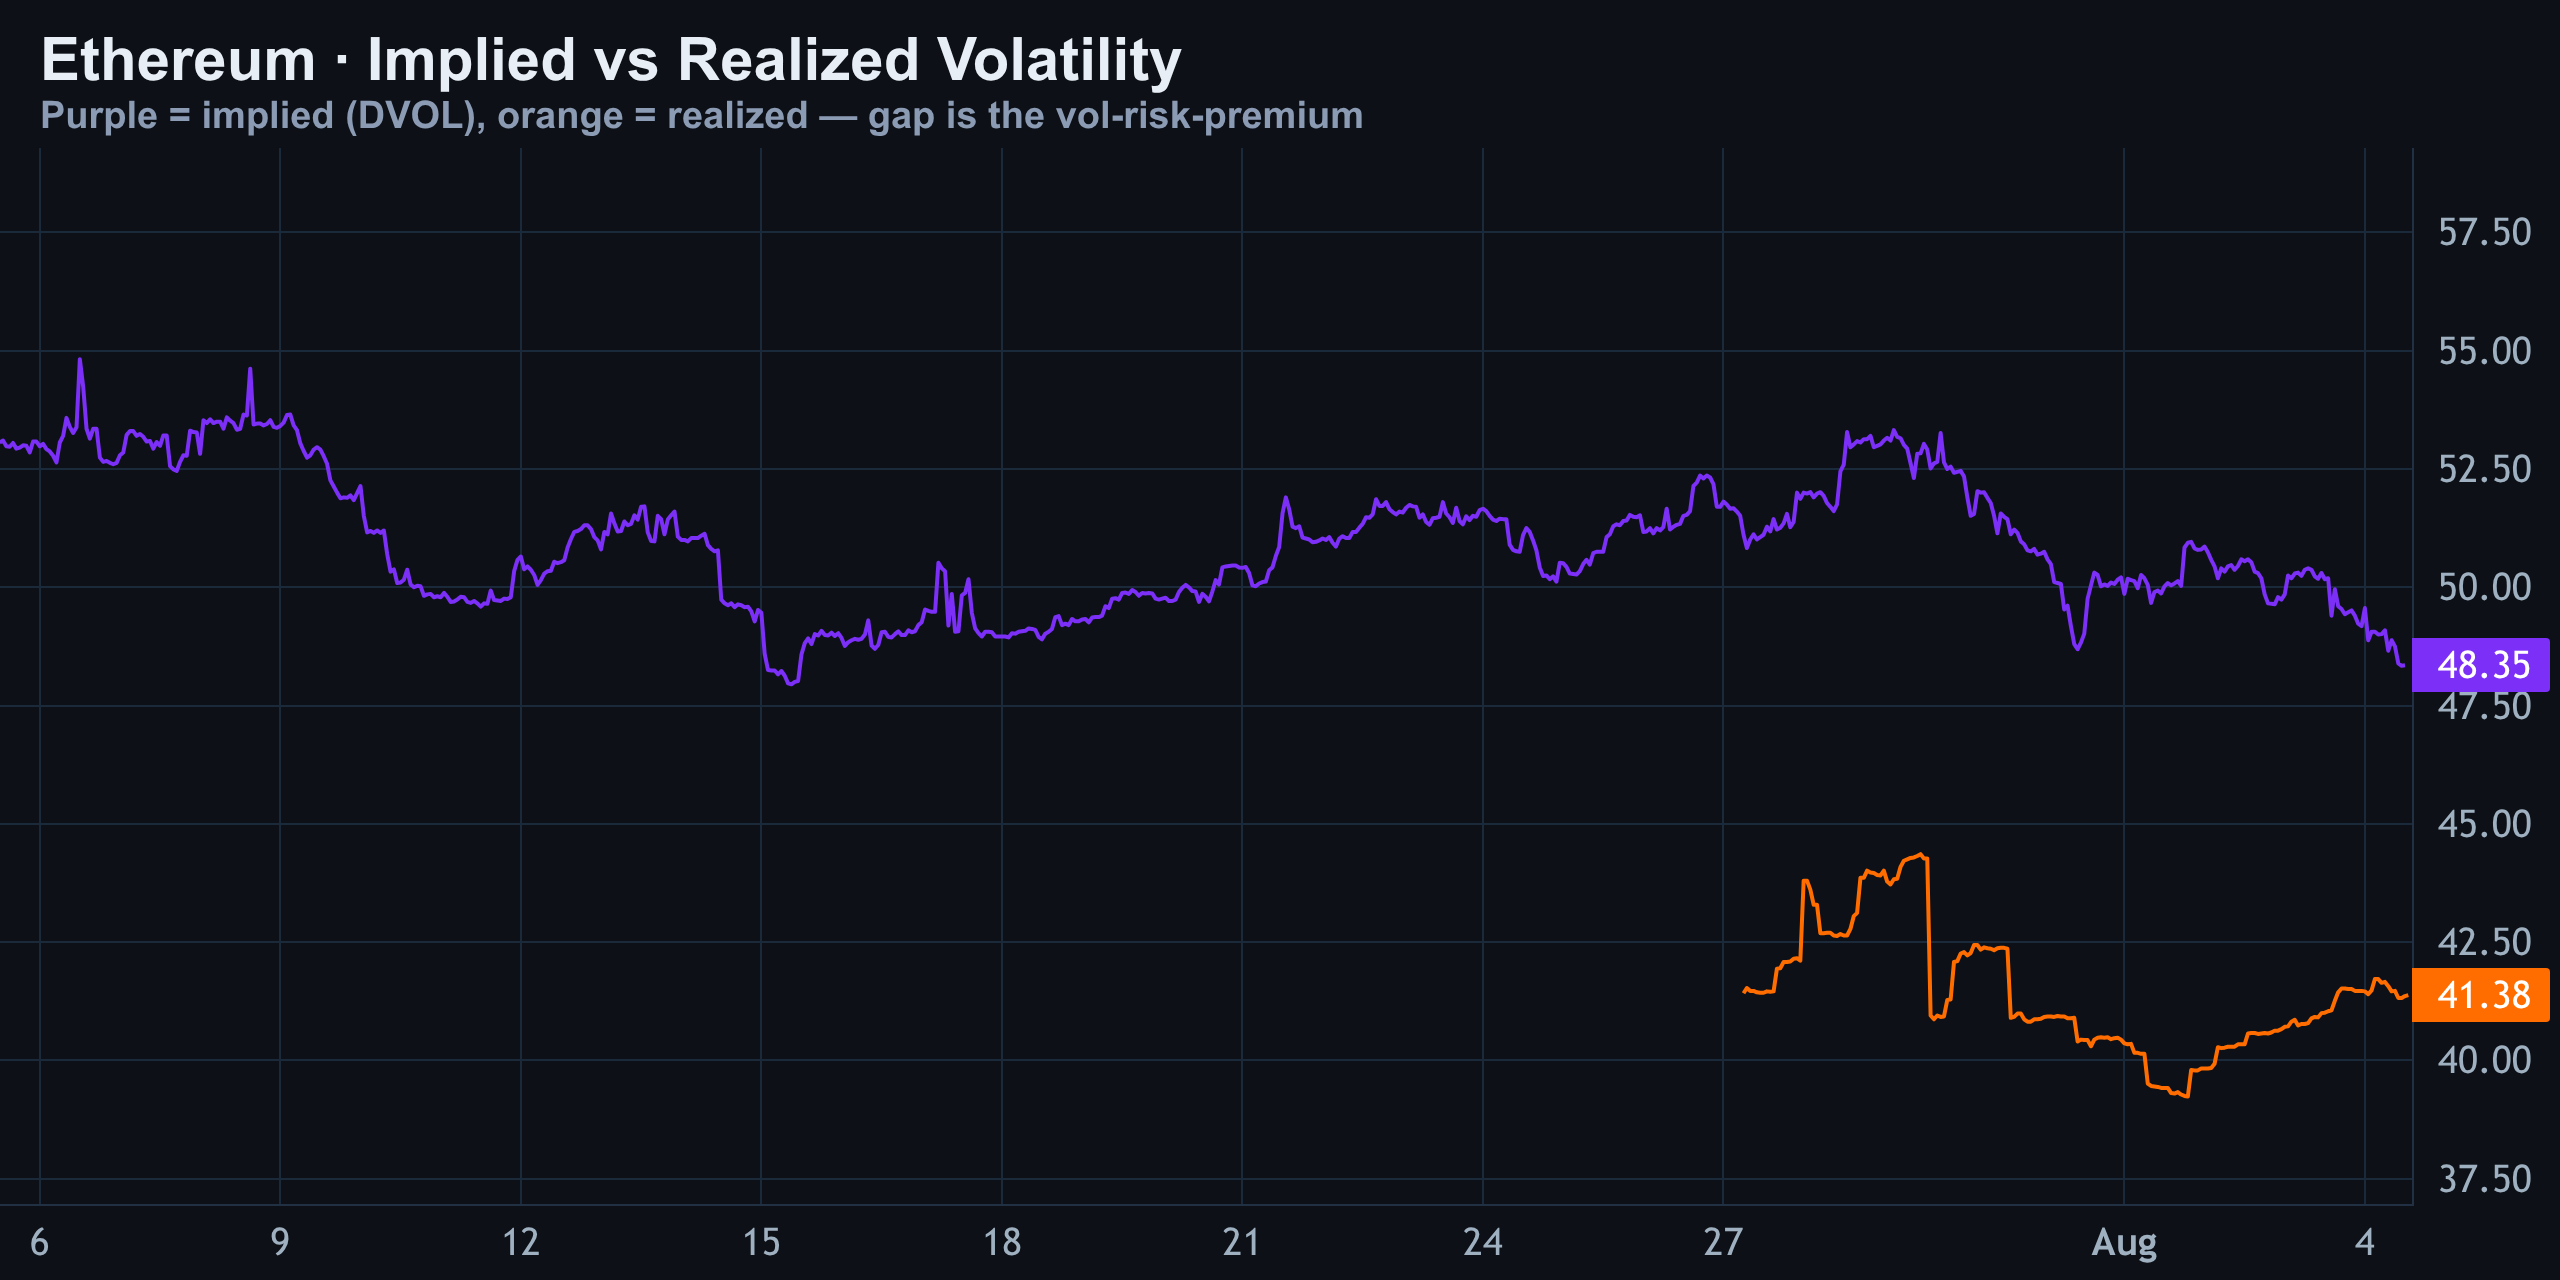
Implied volatility sits at 48.4% against realized volatility of 41.4% — a vol-risk-premium of about 7 points. That means options are pricing in more chop than Ethereum is actually producing right now. Statistically, that favors premium sellers over premium buyers: the market is charging more for insurance than the underlying risk currently justifies.
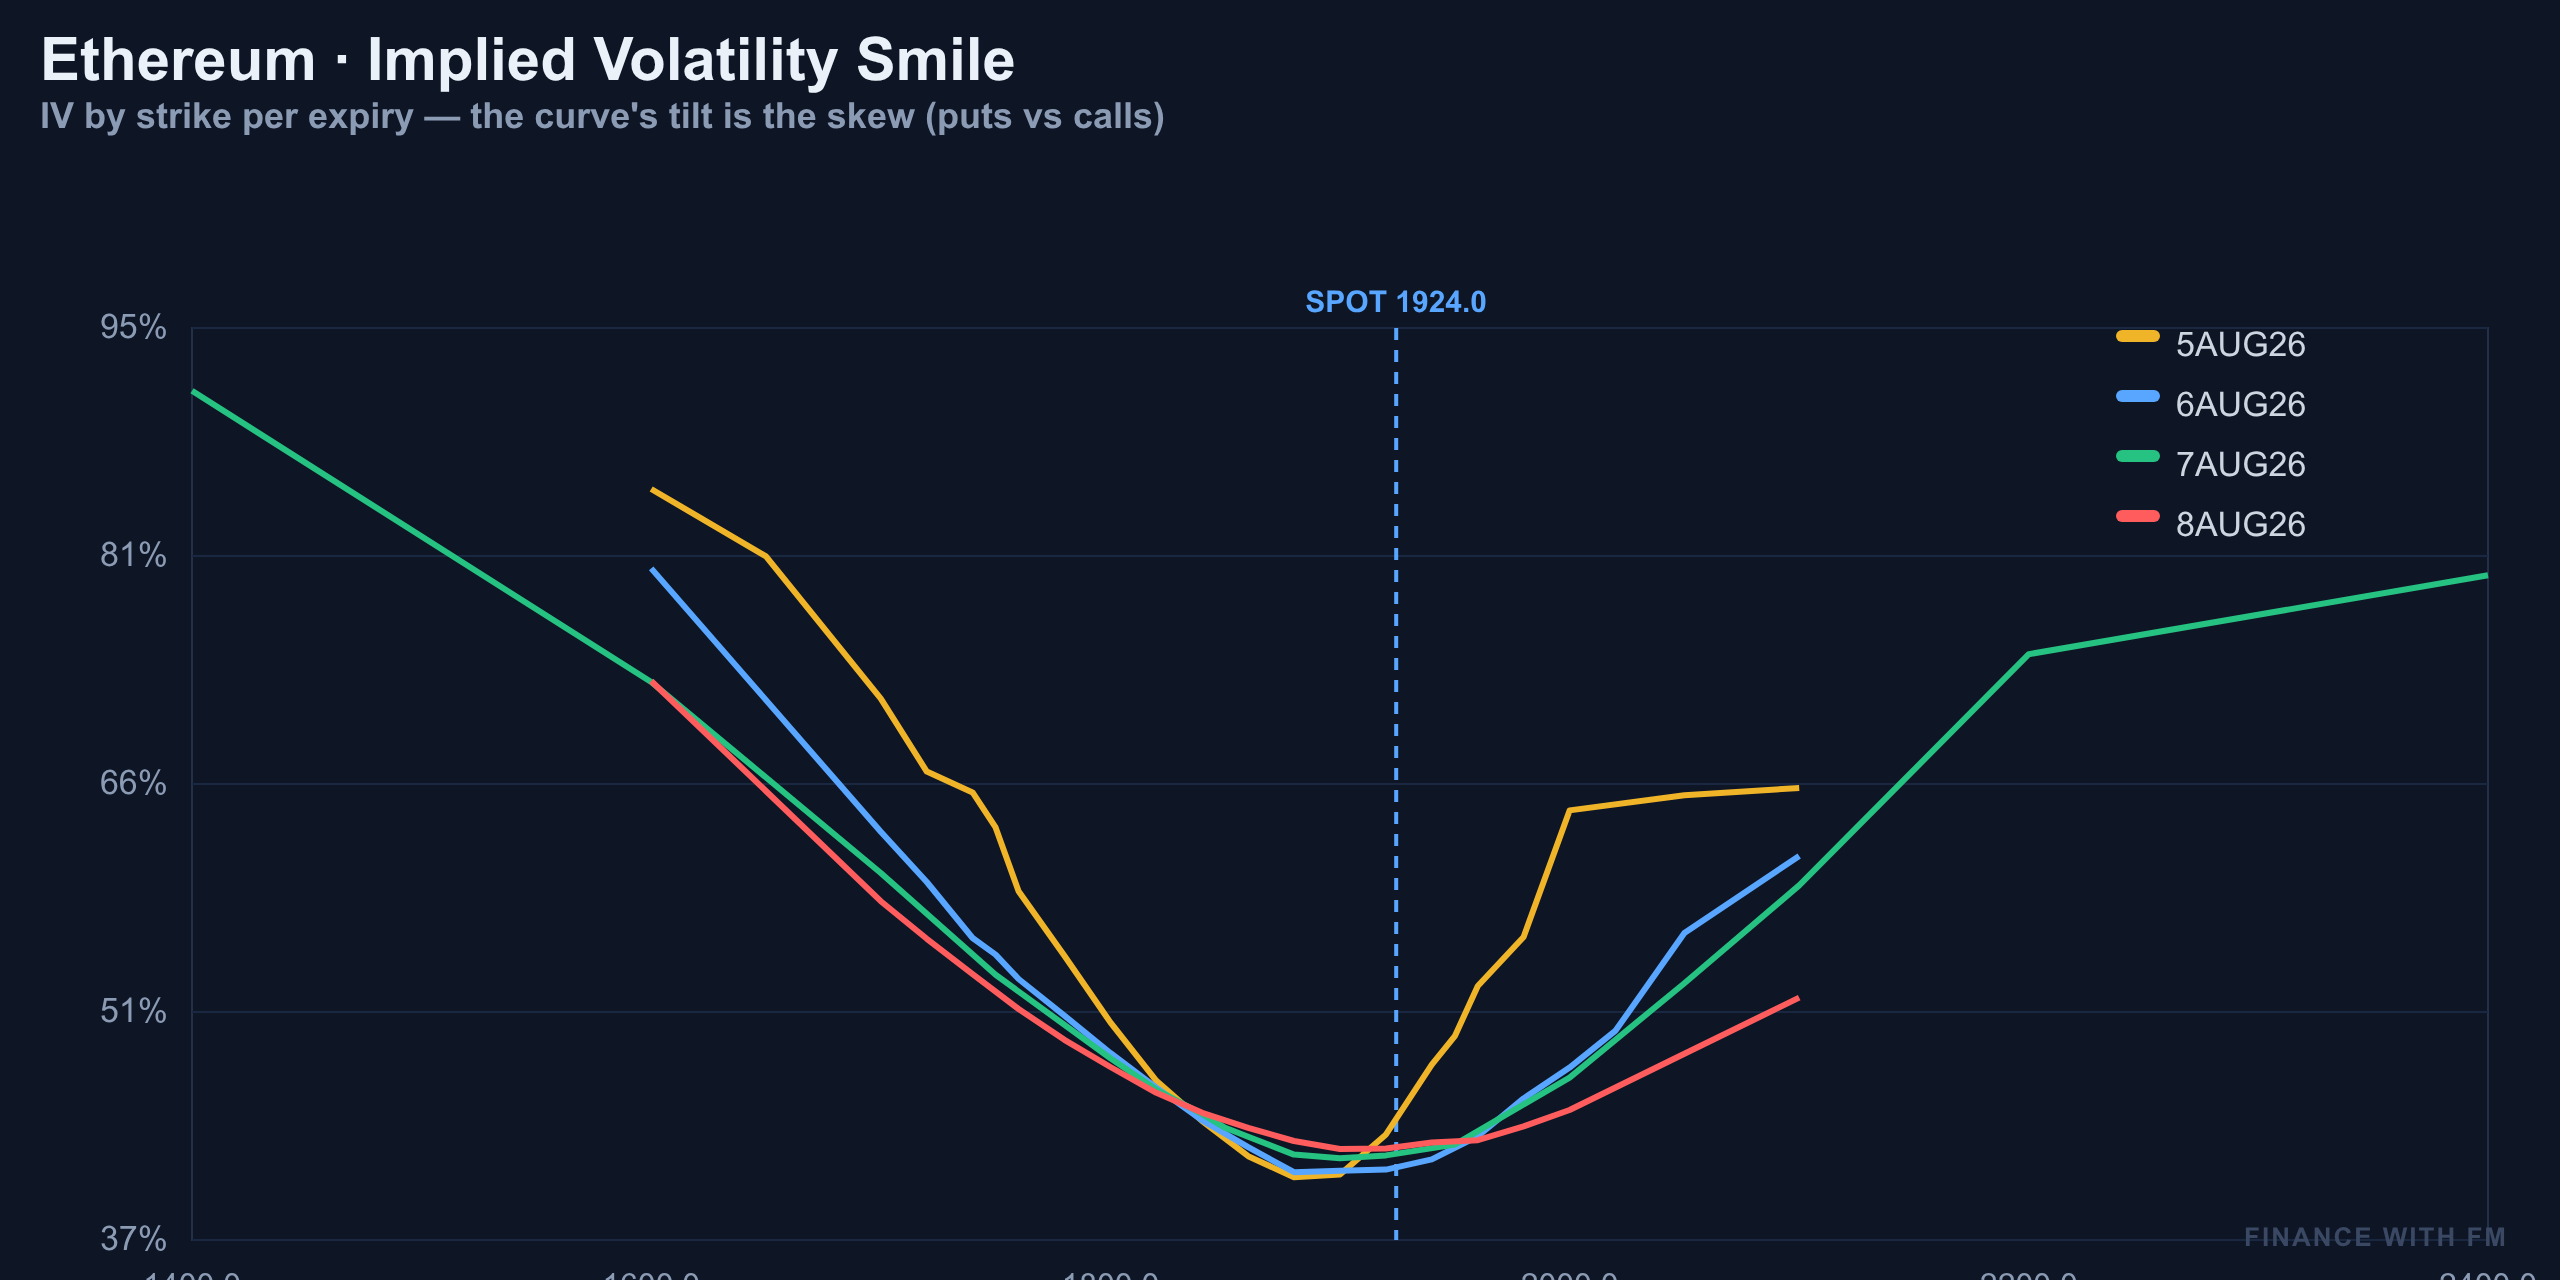
The skew across strikes adds a second layer. At 25-delta, skew reads -0.3%, meaning calls command a slight premium over equivalent puts — traders are paying up for upside exposure even with spot sitting mid-range. It's a mild smirk, not a steep smile — real but modest upside demand baked into the chain.
| Vol Metric | Reading |
|---|---|
| Implied volatility | 48.4% |
| Realized volatility | 41.4% |
| Vol-risk-premium | +7.0 pts |
| 25-delta skew | -0.3% |
What the Probability Math Actually Says
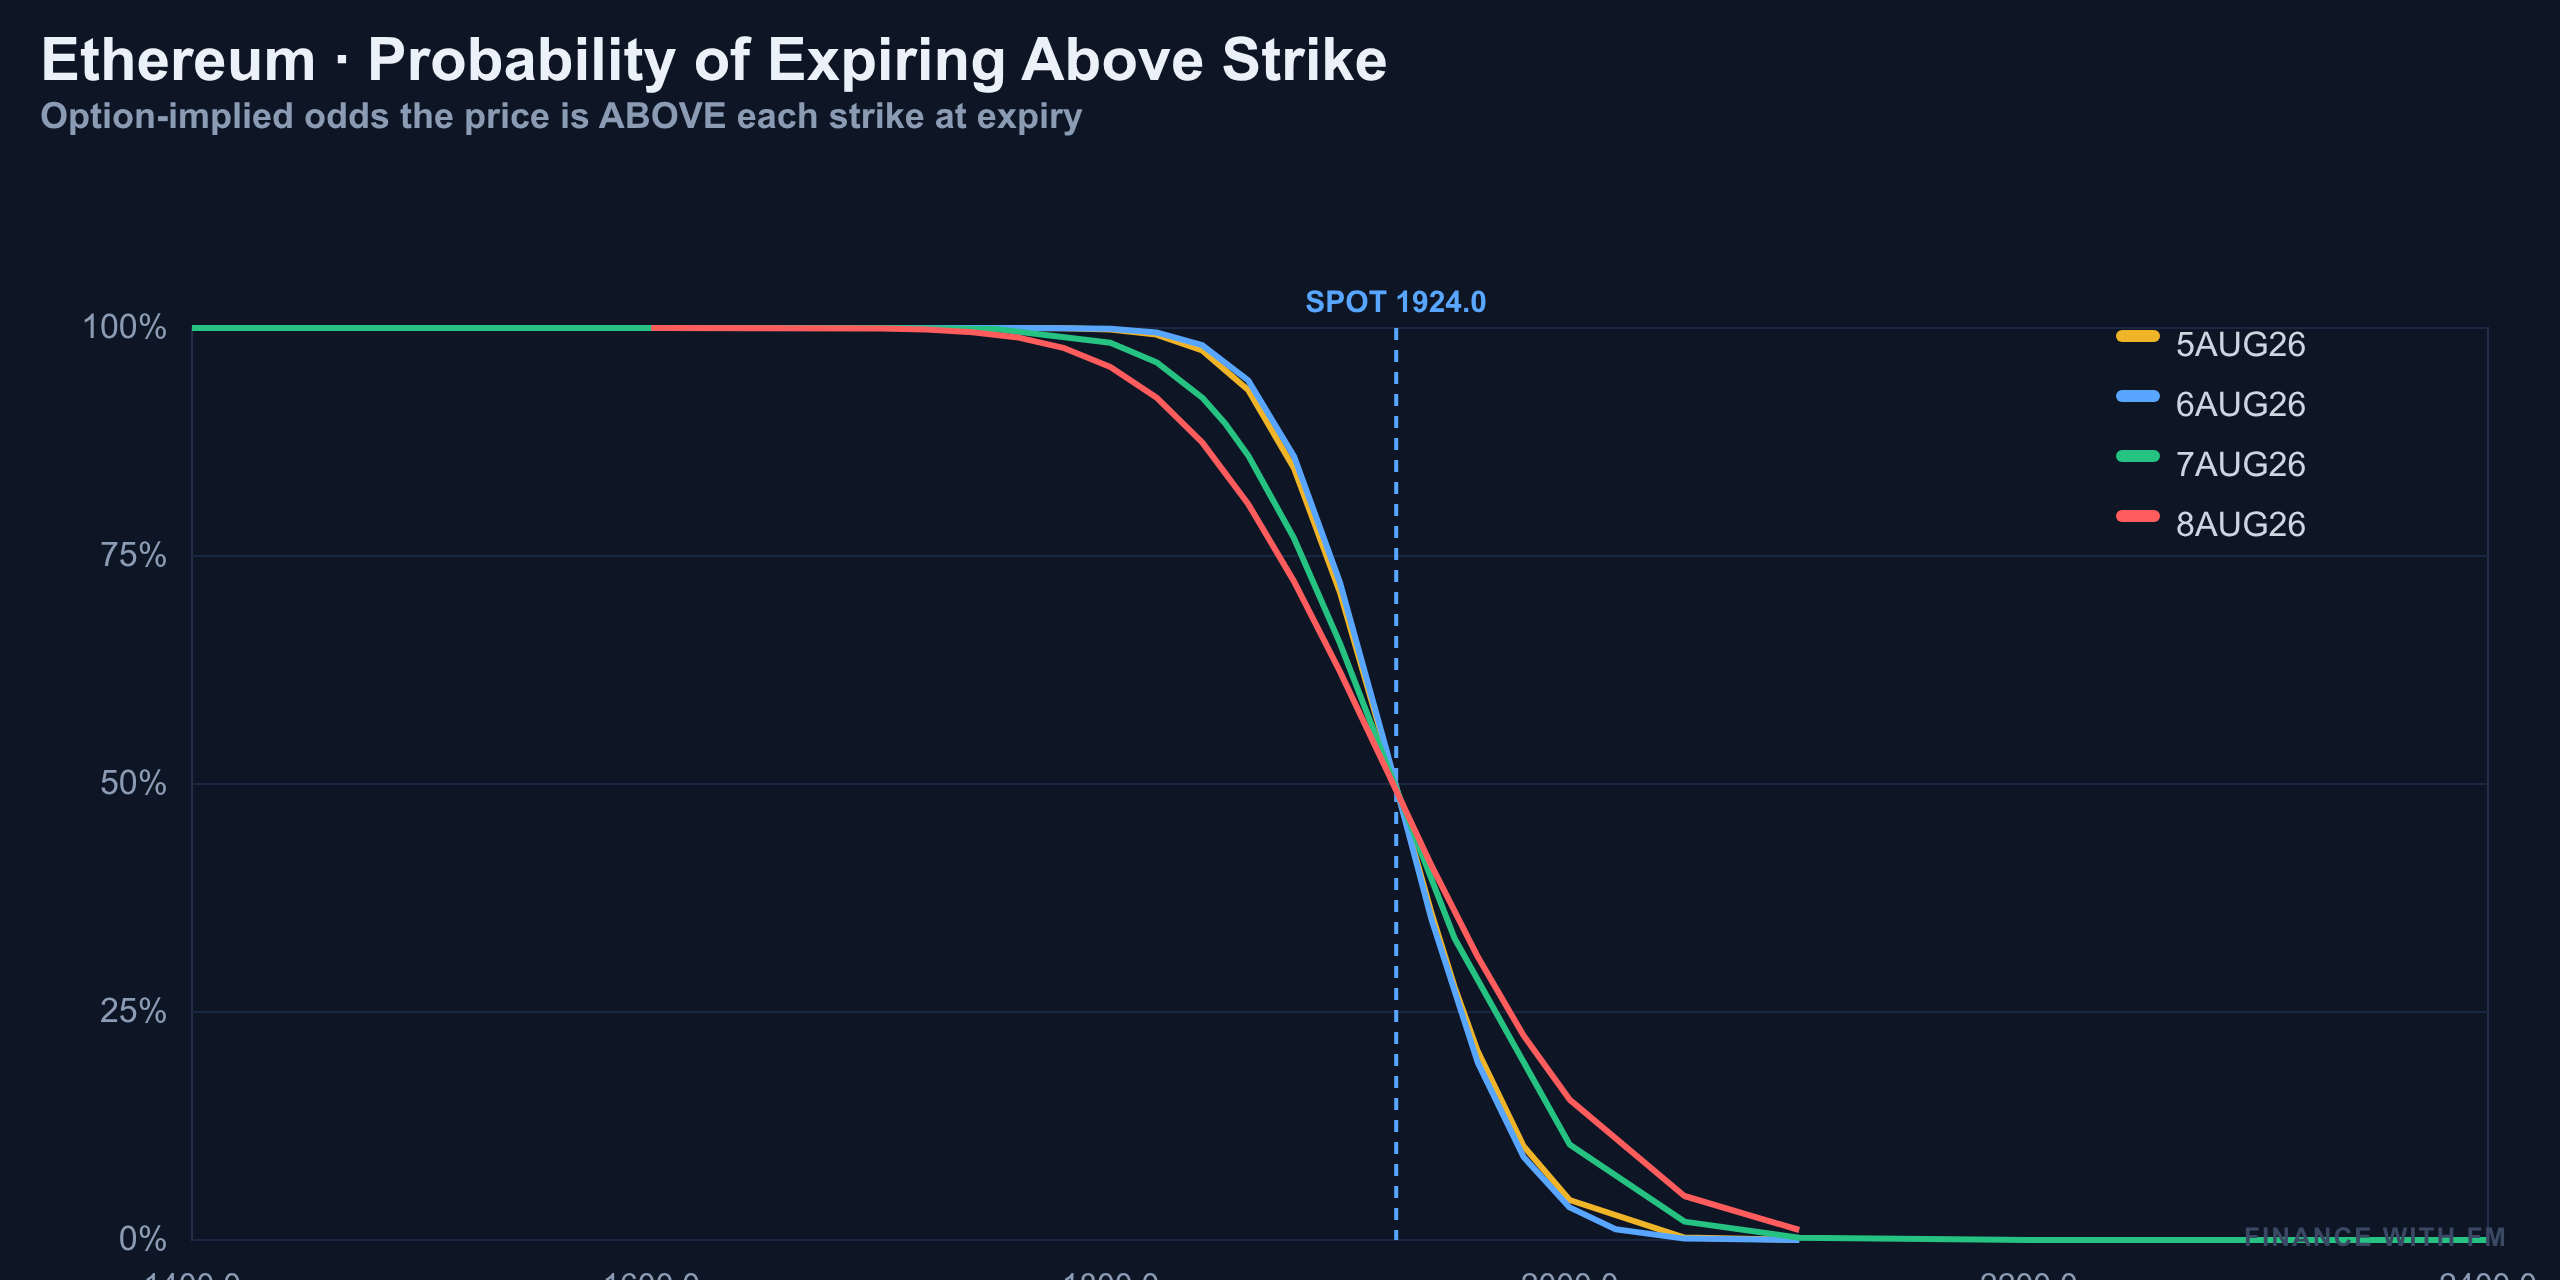
Option pricing is blunt about the near-term ceiling. By the August 8 expiry, the market prices only about a 1% probability that Ethereum trades above $2,100. A breakout to new highs this week is effectively off the table by option math.
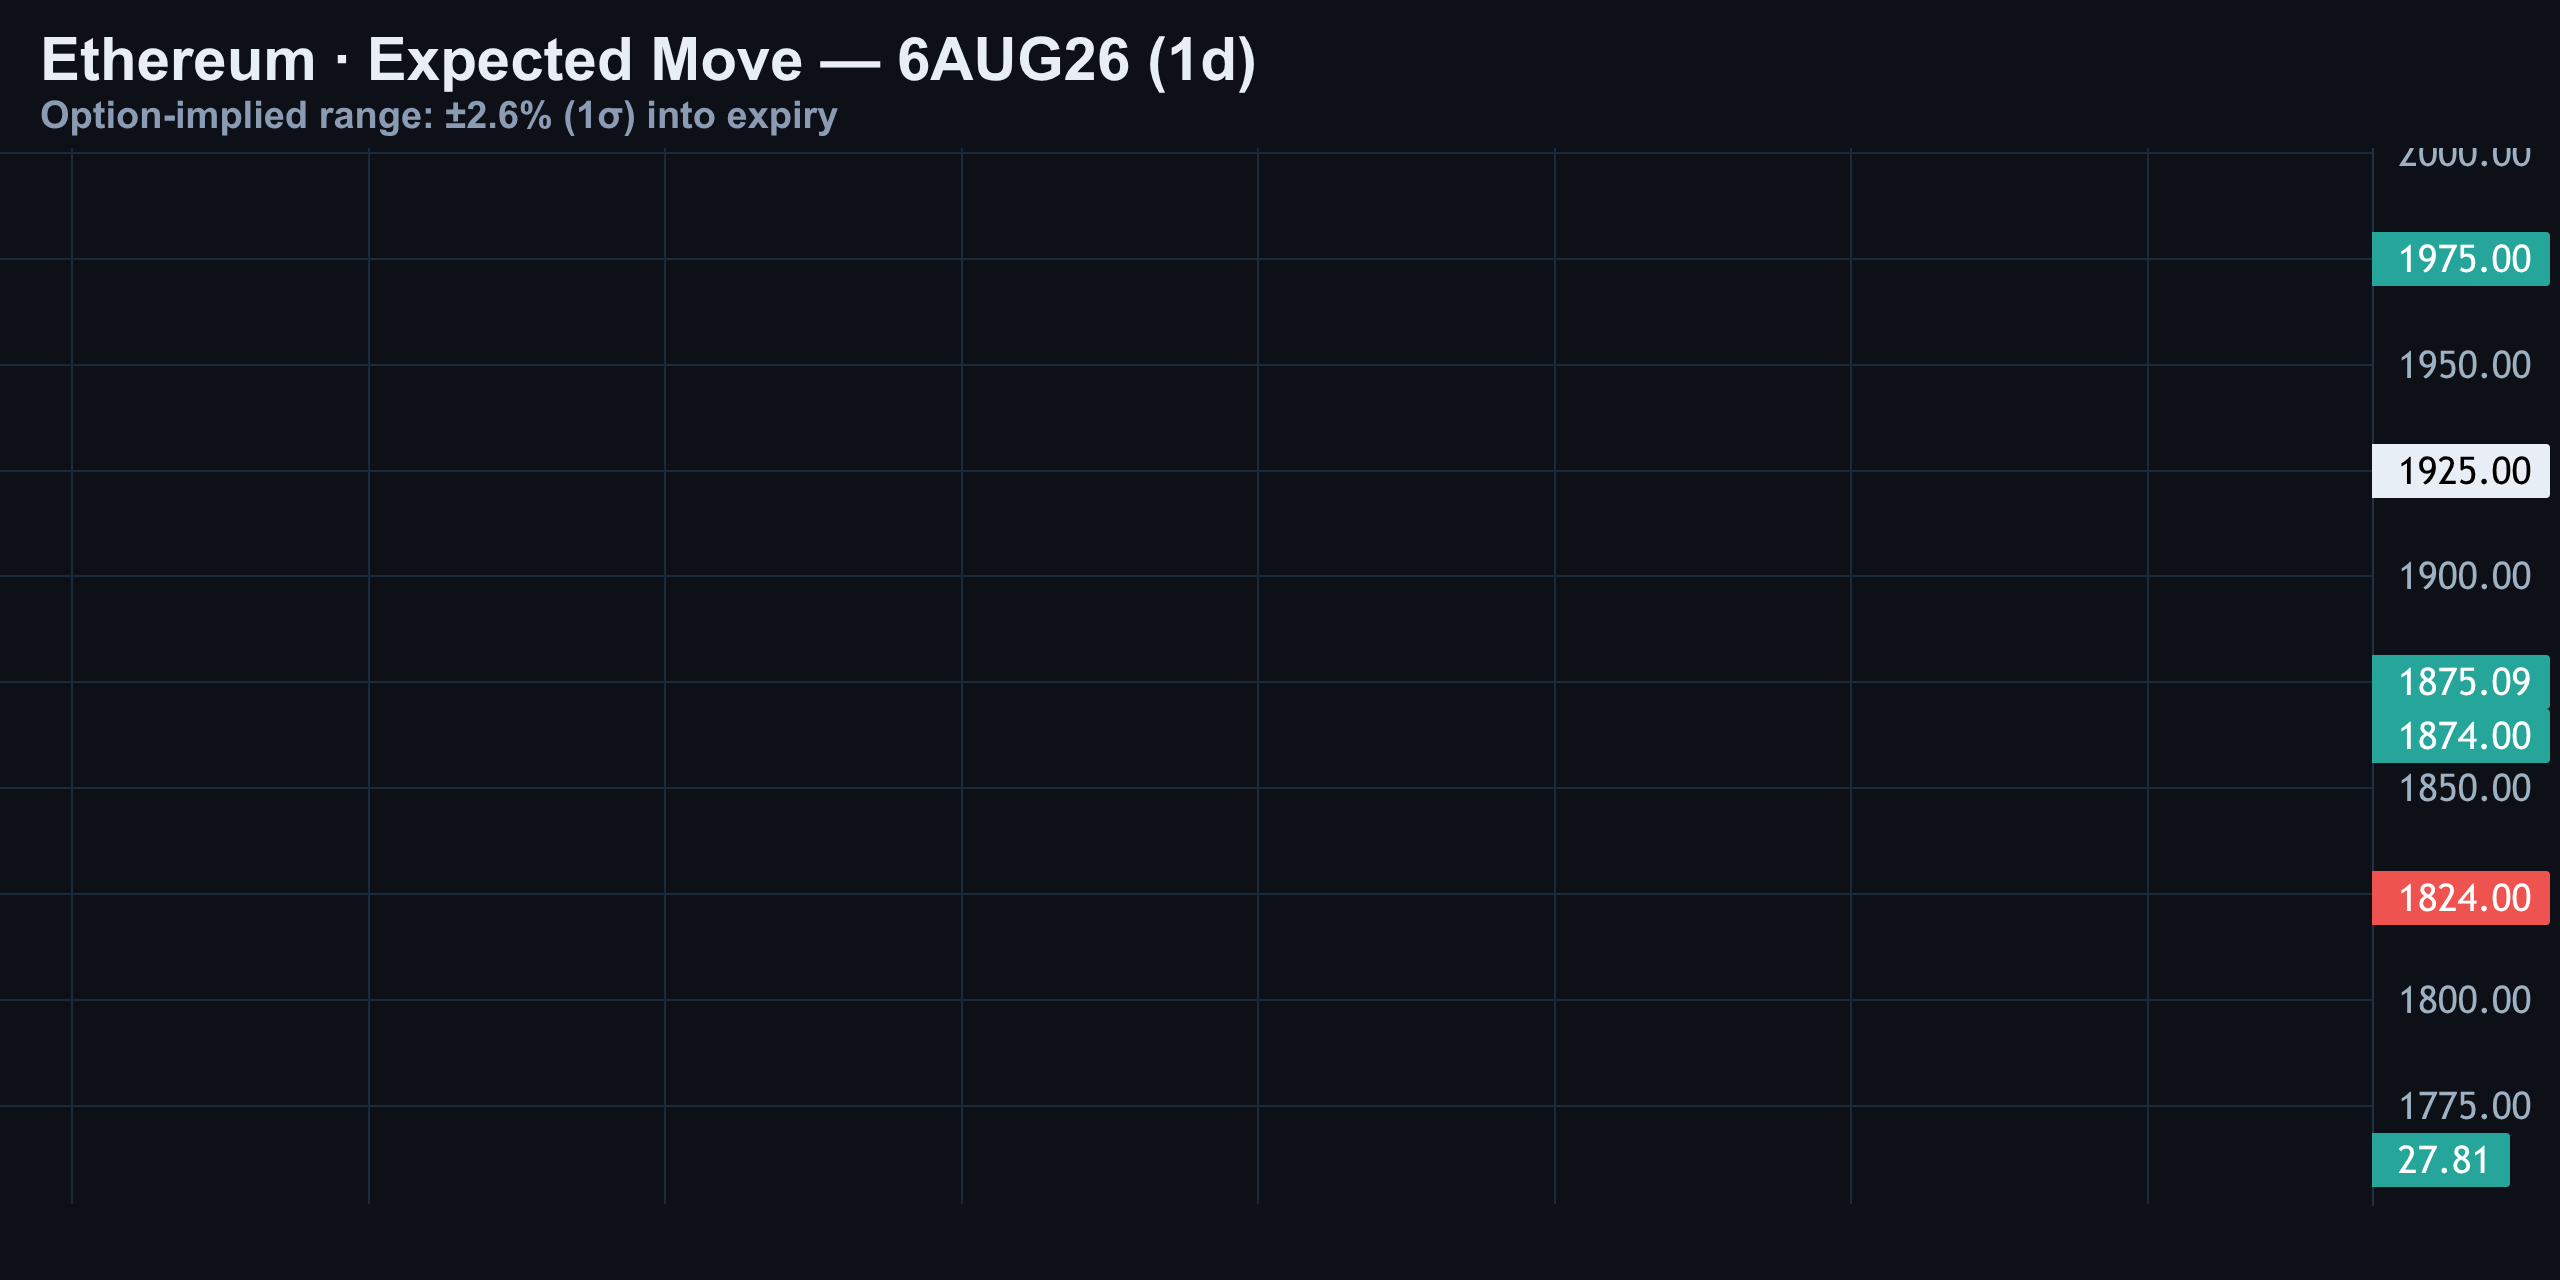
Most of the probability mass sits inside the one-sigma band — roughly $1,874 to $1,975 — with the wider two-sigma range (about 95% confidence) spanning $1,824 to $2,026. Translation: the crowd is pricing a contained week, not a moonshot and not a crash.
| Band | Range | Confidence |
|---|---|---|
| One-sigma | $1,874 – $1,975 | ~68% |
| Two-sigma | $1,824 – $2,026 | ~95% |
| ATM implied vol | 41% | — |
Follow the Whales: Block Trades Tell a Bearish Story
This is where the picture darkens. Over the last 72 hours, block trade flow shows whales buying 16,685 puts and selling the same in calls, against just 50 calls bought and 635 puts sold. Net positioning is decisively bearish. Size clusters at $1,900 and $1,800 on the September expiry, and $2,000 on the December expiry — hedges or bearish bets stacked well above and below current spot.
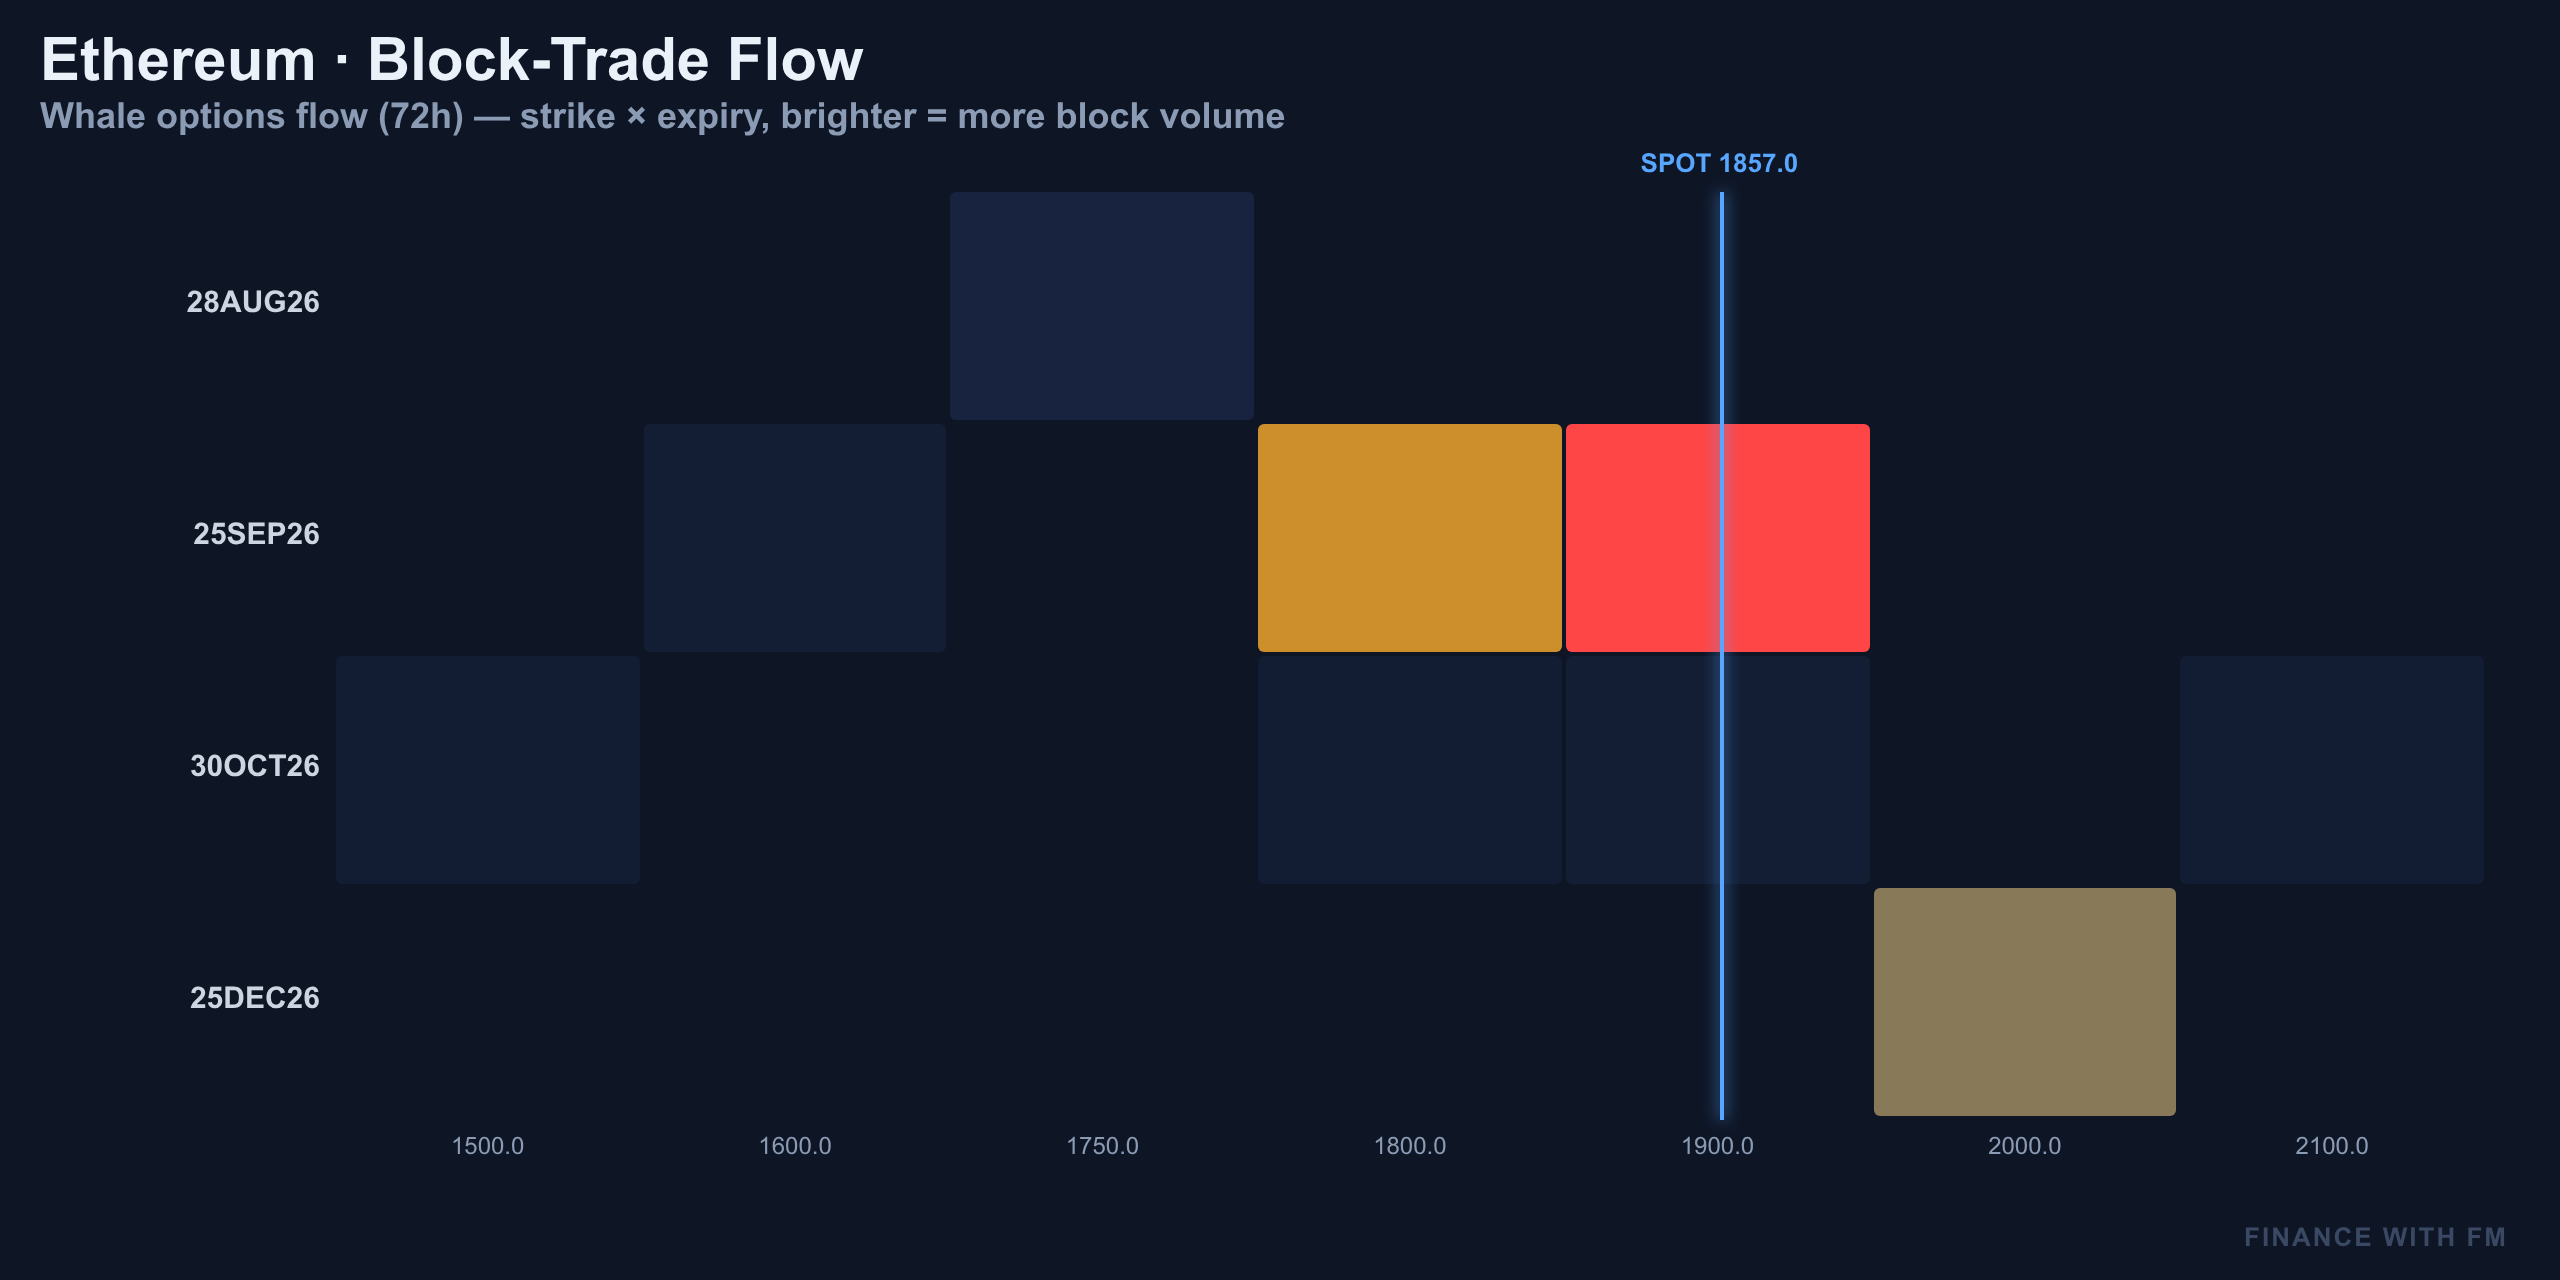
Smart money isn't chasing this range higher — they're paying for protection. That stands in stark contrast to retail's net-long positioning of 2.33 on Binance. When retail leans one way this hard and whales lean the other, it's usually the retail side that ends up disappointed.
| Flow Type | 72h Volume |
|---|---|
| Puts bought (whale) | 16,685 |
| Calls sold (whale) | 16,685 |
| Calls bought | 50 |
| Puts sold | 635 |
The Zero-Gamma Flip: The Level That Wakes This Market Up
This is the number that matters most today. Dealers are currently sitting in positive gamma, which suppresses volatility — dips get bought, rallies get sold, and price acts like it's pinned to a magnet. That stability has a floor, though: the zero-gamma flip sits at $1,851, about -3.9% from spot.
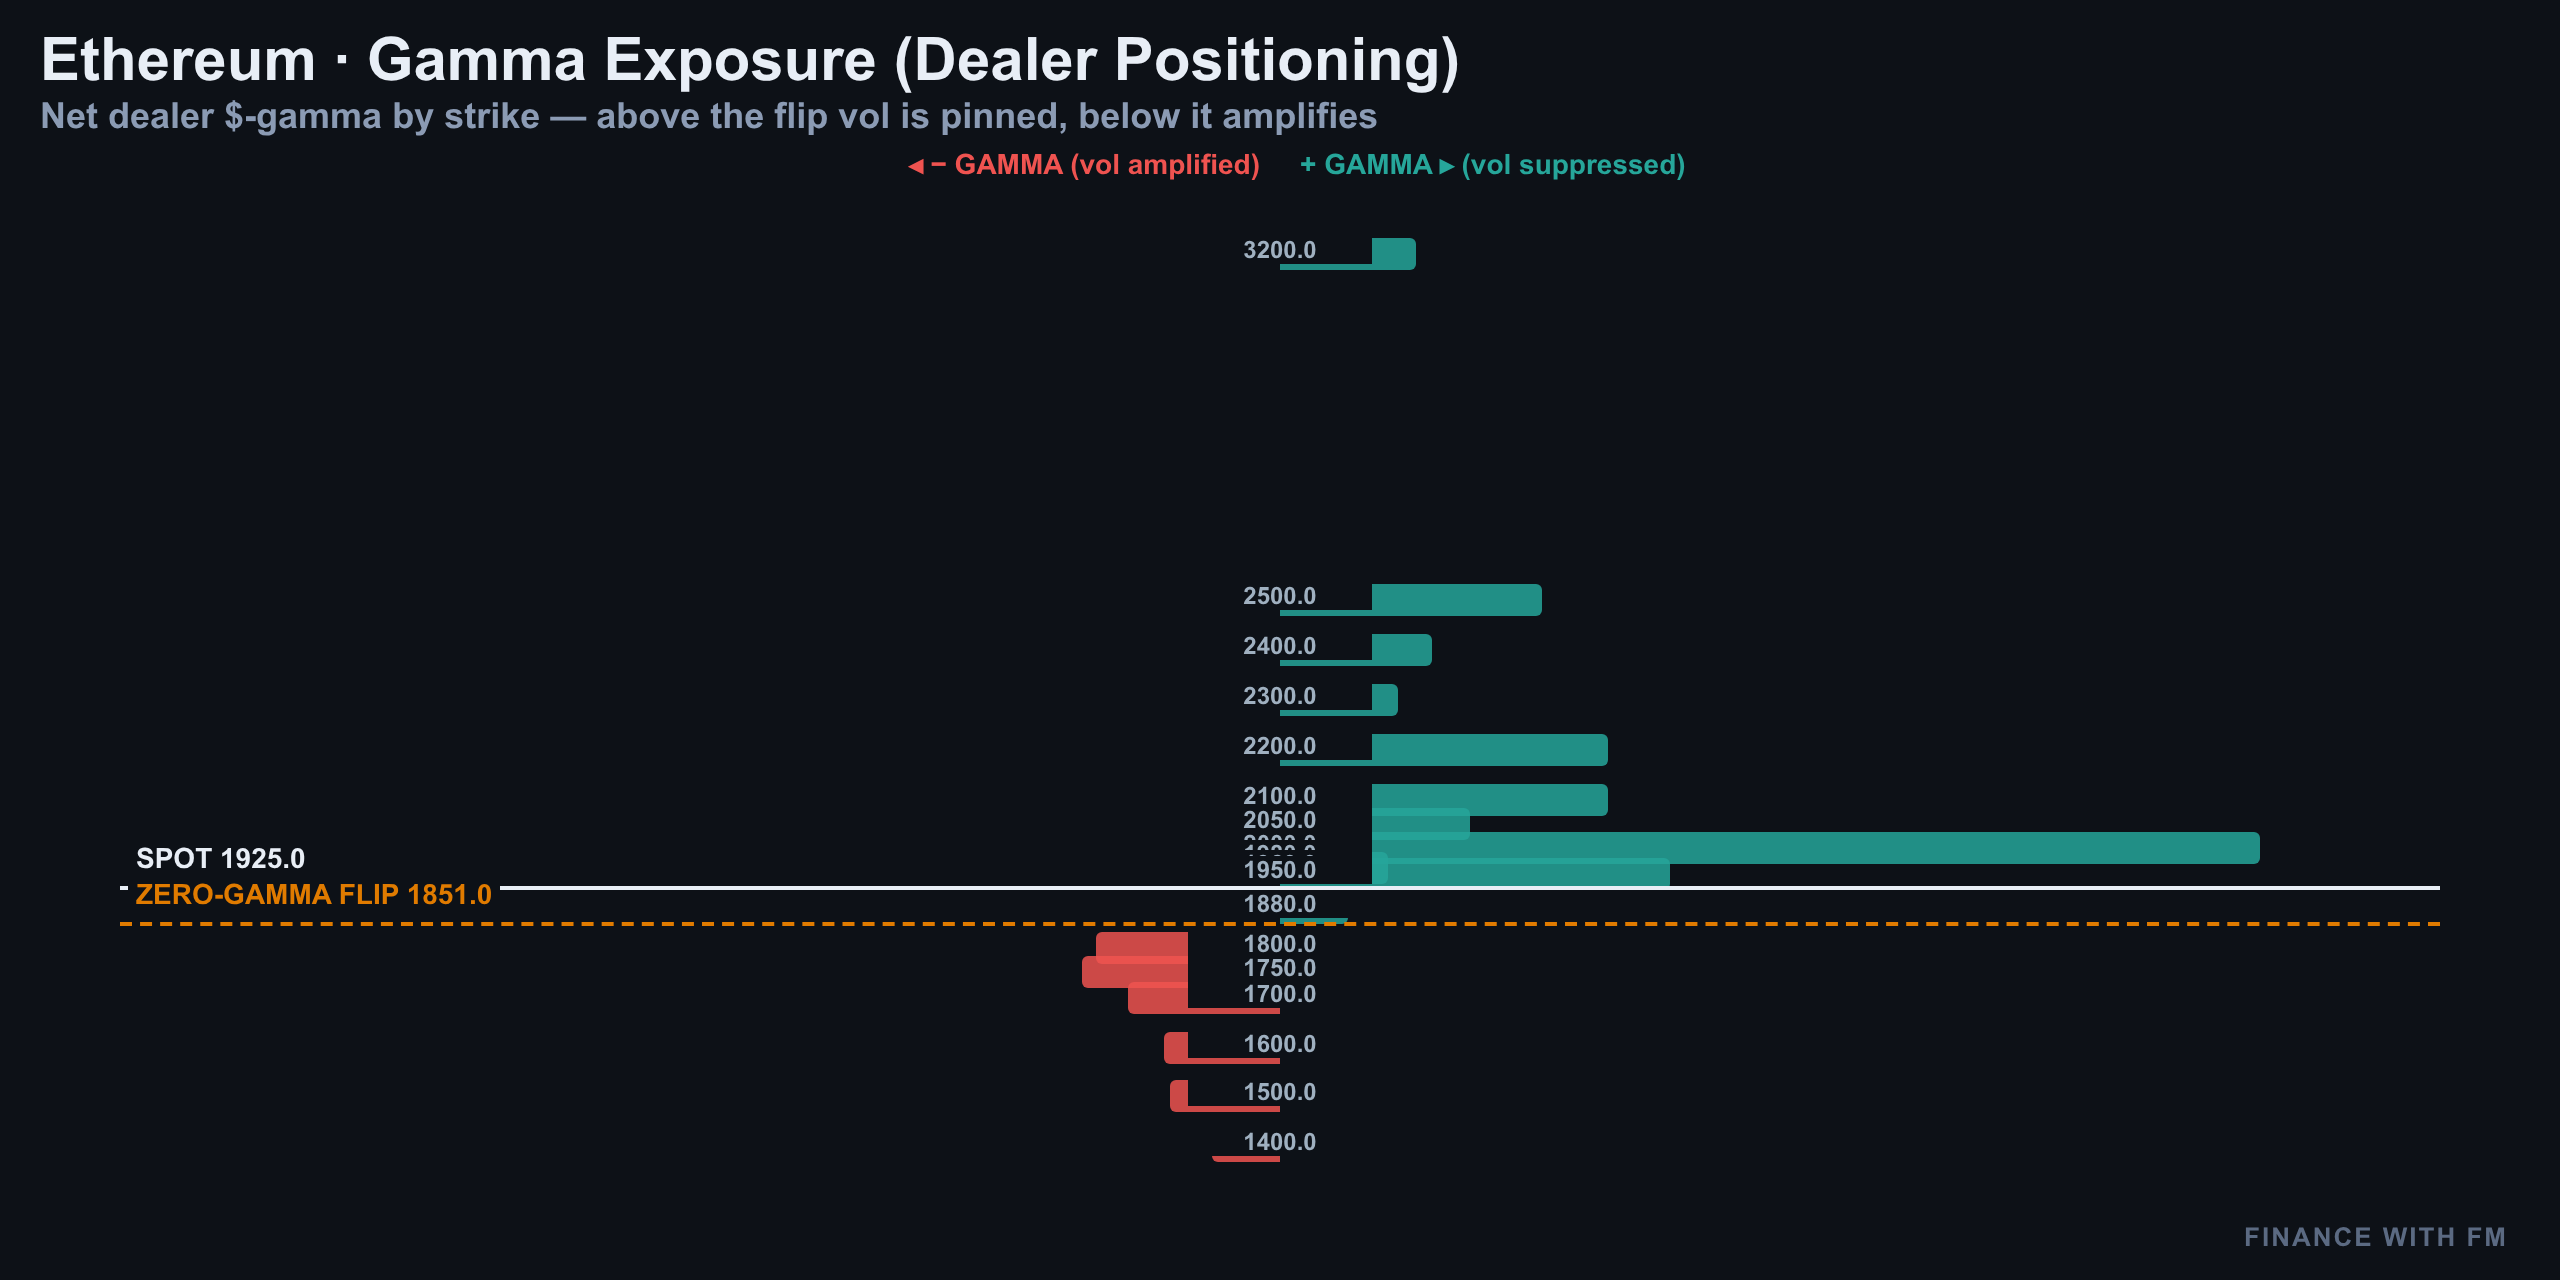
Hold above $1,851 and volatility stays pinned — the coil keeps coiling. Lose it, and dealer hedging flips from stabilizing to destabilizing, meaning moves start feeding on themselves instead of getting absorbed. Net dealer gamma is +$13.3 million per 1% move, with the heaviest gamma wall overhead at $2,000 and the strongest support gamma at $1,750.
| Gamma Level | Price | Notes |
|---|---|---|
| Zero-gamma flip | $1,851 | Vol regime changes below this |
| Gamma wall (resistance) | $2,000 | Heaviest overhead gamma |
| Gamma support | $1,750 | Strongest dealer support |
| Net dealer gamma | +$13.3M / 1% move | Current positive regime |
The Trade Setup: Why the Desk Is Standing Aside
Put all of this together and the honest conclusion is: there's no clean 1:2.5 risk-reward trade on the table today. Price is pinned to max pain at $1,860, dealers are actively suppressing volatility with positive gamma, and the expected-move band for this expiry is tight — only $1,874 to $1,975 on the one-sigma side. Chasing a breakout here means fighting both the gamma structure and the option math simultaneously.
- Options structure is bullish on paper (0.53 put/call OI) but fresh flow is balanced (0.93 volume ratio)
- Whales are net bearish on block flow — 16,685 puts bought vs. 50 calls bought in 72 hours
- Retail is net long 2.33 — the opposite side of the whale trade
- Zero-gamma flip at $1,851 is the real trigger for a volatility regime change
- Expected move for this expiry is contained: $1,824–$2,026 at two-sigma
The smartest move today may genuinely be no move at all. Patience isn't the exciting answer, but it's the one the data supports. Watch $1,851 as the tripwire — a clean break and hold below it is the signal that turns this from a range-bound coil into a real, tradeable move. Until then, this is a market designed to chop out both sides.
More on Ethereum: elliott wave
Analysis and education, not investment advice. See our editorial policy.