Daily market analysis
Ethereum (ETH) elliott wave
Last updated
Ethereum $1,943 Wall: Wave C Stalled or B-Wave Trap?
Yesterday's Call Just Got Tested
Yesterday we flagged wave C loading after Ethereum got rejected at $1,943. Today price did the opposite. ETH rallied roughly 1.1%, climbing from $1,897 up to $1,918, and in the process broke straight through the 1H invalidation at $1,917 that was supposed to confirm the C-wave decline.
So the near-term bearish trigger didn't hold. That's a miss on timing, and full accountability matters here — a wave count is only as good as the level that invalidates it. The good news is that the bigger 4H invalidation at $1,943 is still untouched. The larger corrective bias isn't dead, it just needs a fresh trigger instead of the one we had.
The 4H Chart: Corrective, Not Trending
Zooming out first. The automatic count on the 4H tags a clean-looking five-wave impulse: wave 1 at $1,947, wave 2 down at $1,803, wave 3 up at $1,956, wave 4 at $1,848, and wave 5 topping at $1,981. On paper, that's textbook. In practice, it breaks the rules.
| Wave | Price | Note |
|---|---|---|
| Wave 1 | $1,947 | Start of the move |
| Wave 2 | $1,803 | Deep retrace |
| Wave 3 | $1,956 | Barely bigger than wave 1 — unextended |
| Wave 4 | $1,848 | Overlaps wave 1 territory — rule violation |
| Wave 5 | $1,981 | Final top, but structurally suspect |
- Wave 4 drops back into wave 1's price territory — a hard rule violation for a simple impulse
- Wave 3 is unextended, barely larger than wave 1
- Wave 4 retraces more than 70% of wave 3, far beyond what a healthy impulse allows
Stack those three flags together and this stops looking like a trend leg. It starts looking like a diagonal, or more likely, a larger corrective structure wearing an impulse costume. After that suspect top at $1,981, price dropped to an A-wave low near $1,822, then rallied hard into a B-wave that stalled exactly at $1,943 — yesterday's rejection, still the level that matters most.
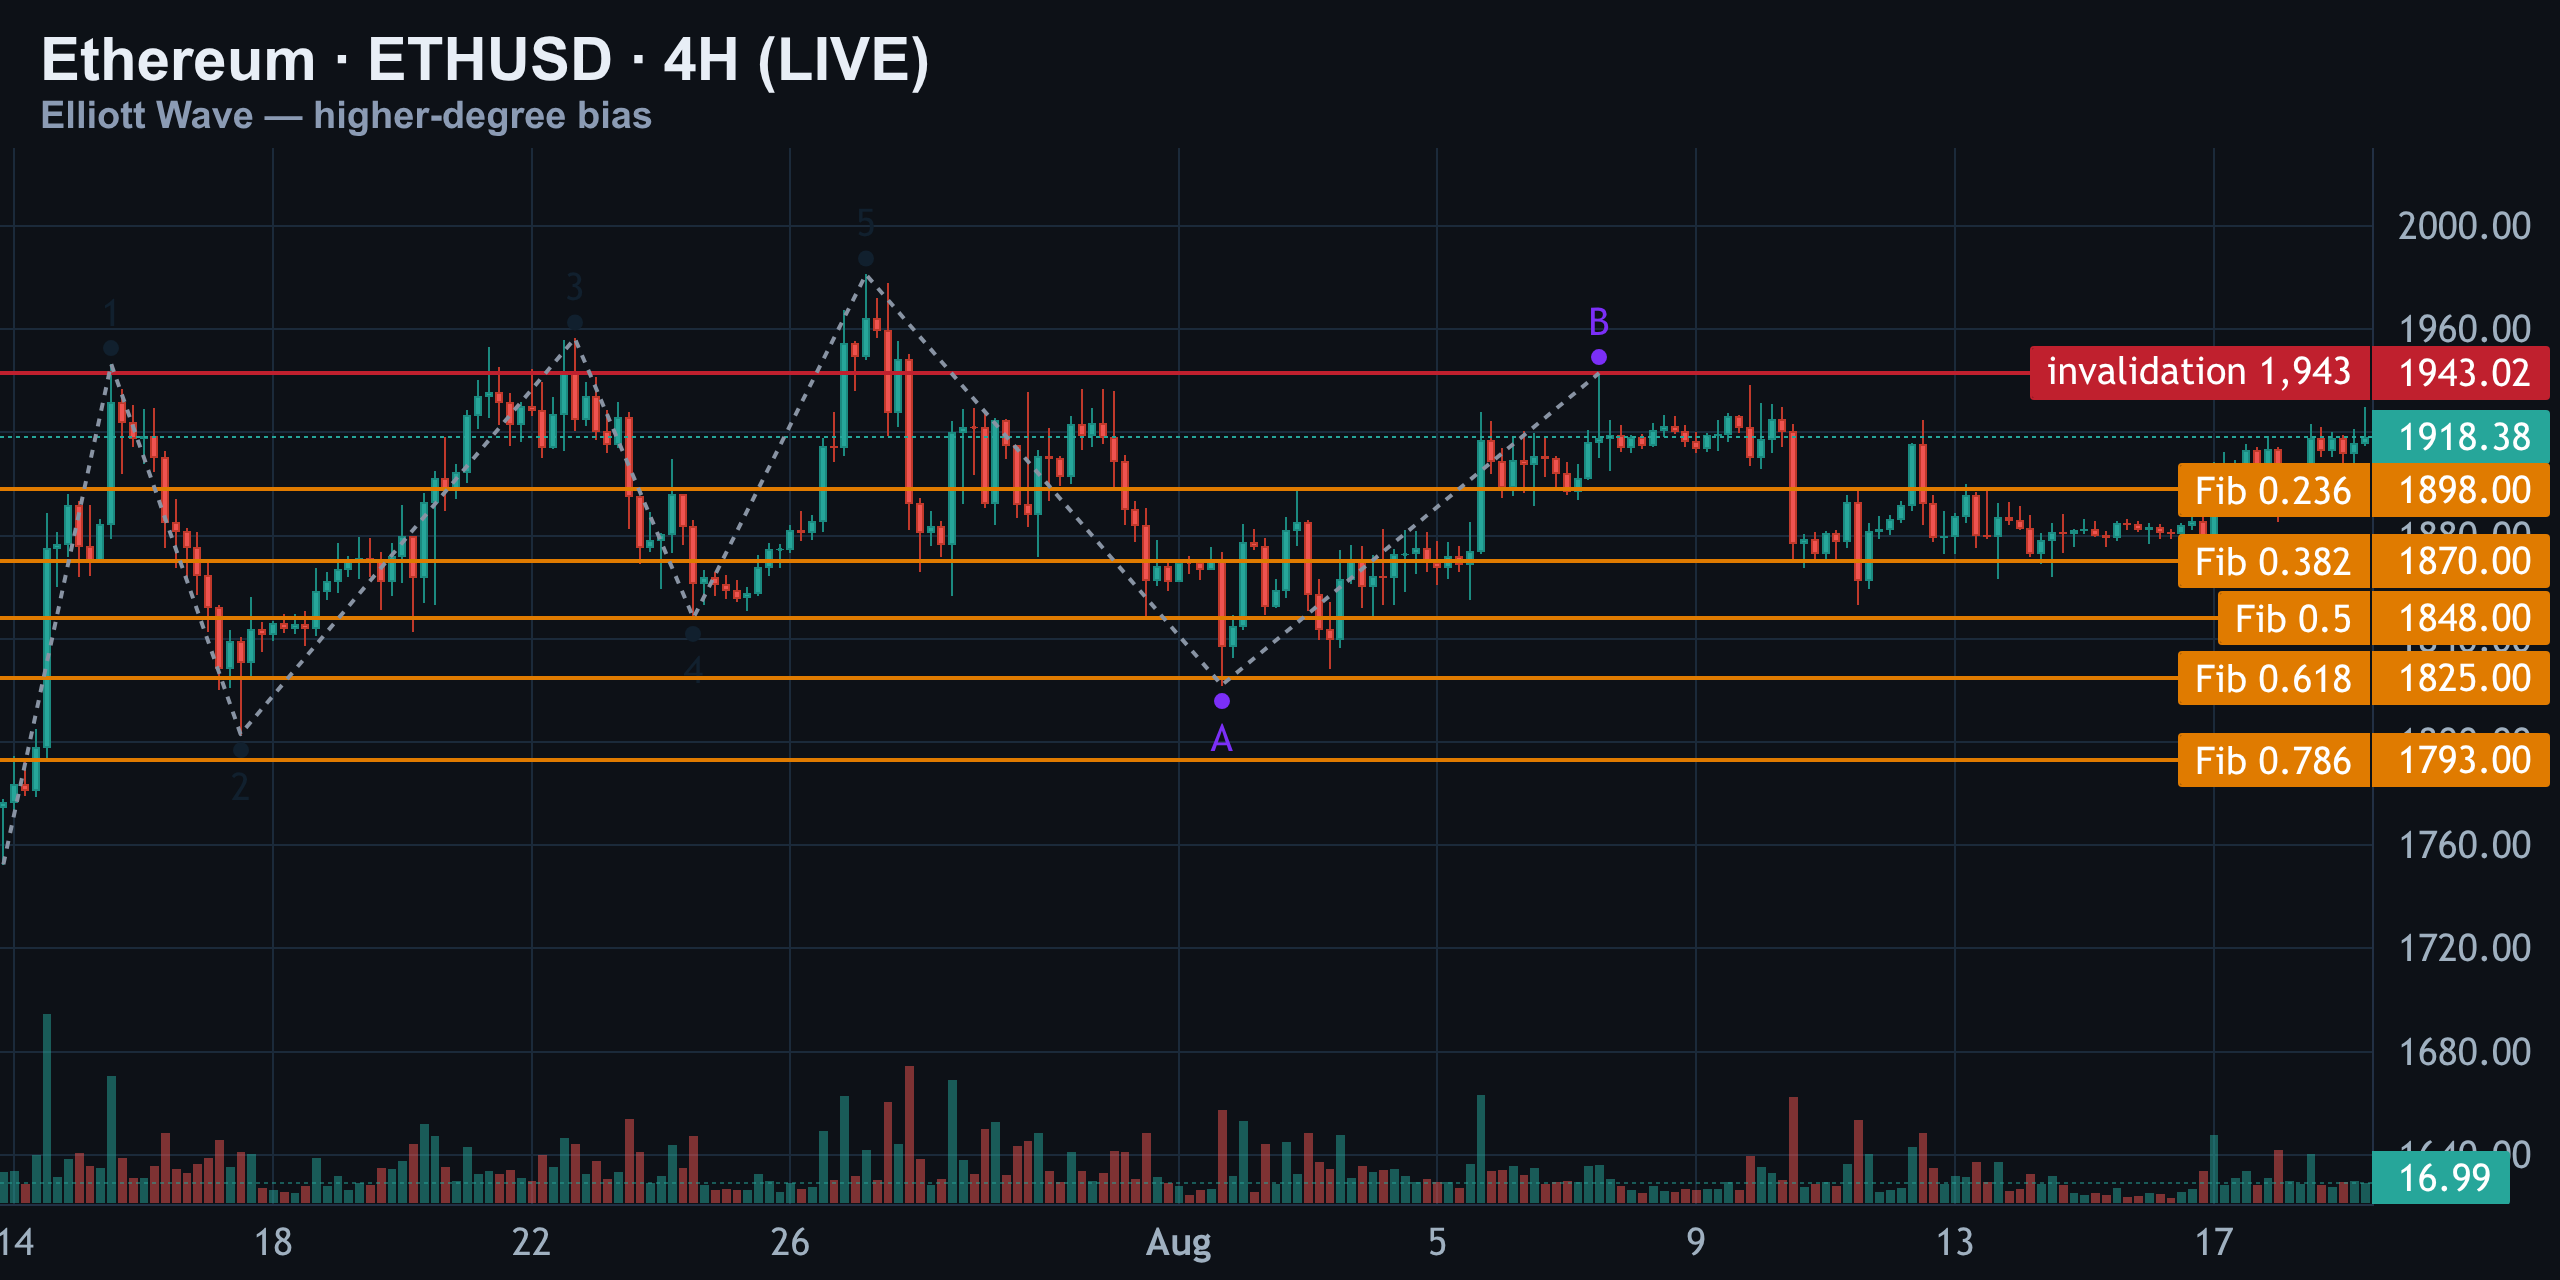
That B-wave high at $1,943 is now the tentative invalidation for the entire bearish reading. Price currently sits around $1,918 — above the 23.6% retracement at $1,898, meaning the supposed C-wave down hasn't even tagged its shallowest fib level yet. The higher-degree bias stays corrective, cautiously bearish, but only as long as $1,943 holds. Break it, and the story flips completely.
The 1H Battle: Where the Real Fight Is
The 1H is where near-term price action is actually being decided. The primary count builds a small five-wave move — wave 1 at $1,918, wave 2 at $1,911, wave 3 at $1,920, wave 4 at $1,912, wave 5 back at $1,918 — followed by a corrective A-wave down to $1,906, a B-wave up to $1,930, and a C-wave low at $1,917.
That C-wave low at $1,917 was our tentative invalidation. Price already traded back above it, up to $1,918. So that clean canvas gets wiped, and two alternates take its place.
| Scenario | What it says | Key trigger |
|---|---|---|
| Alternate 1: Expanded flat | Not a finished C-wave — the $1,930 B-leg measured roughly 2x the A-leg, a classic irregular-flat fingerprint | Grind higher to retest $1,943 before real decline starts |
| Alternate 2: Bullish flip | Corrective idea dies entirely if buyers close a 1H candle above $1,943 | 1H close above $1,943 |
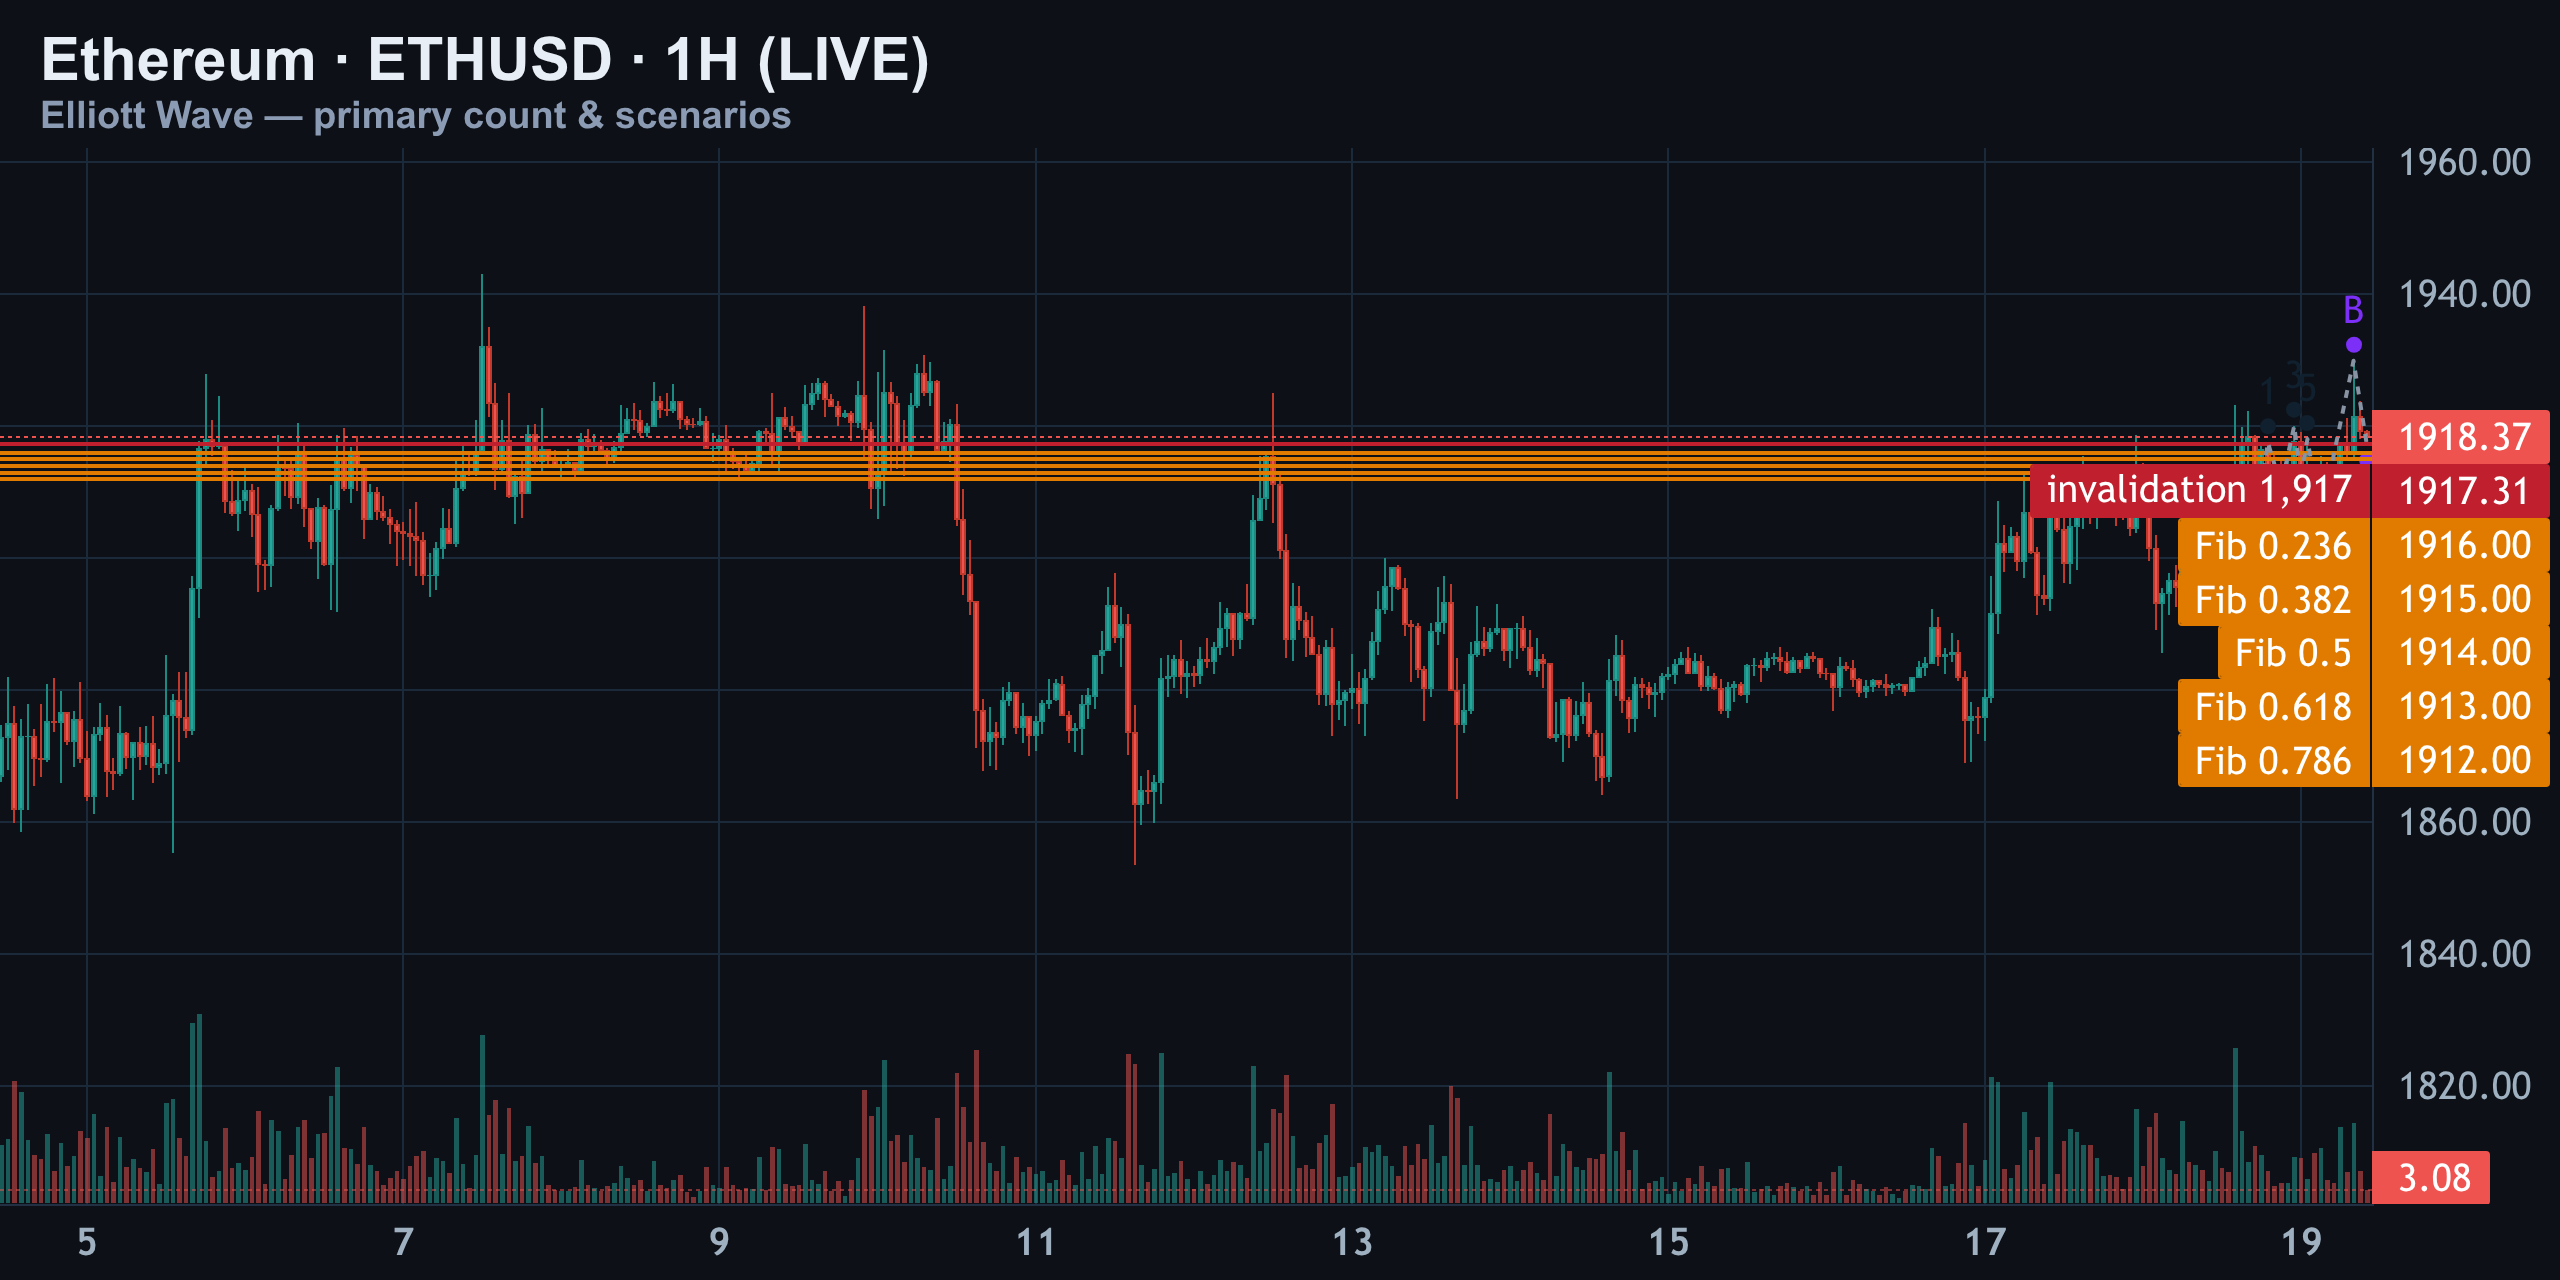
The tell that separates these two paths is simple. Hold below $1,943 and eventually lose $1,918, and you're in the bearish grind. Clear $1,943 with conviction, and you're in the bullish flip. Right now price is stuck in the no-man's-land between the two, which is exactly why patience matters more than prediction on this chart.
The 15M Chart: Timing the Trigger
Down to the 15M for actual entry timing. This automatic count has wave 1 at $1,892, wave 2 diving to $1,869, wave 3 up to $1,913, wave 4 back to $1,892, and wave 5 stretching to $1,919. Notice wave 2 retraced more than 100% of wave 1 — a hard rule break, so this isn't a clean five-wave impulse. Treat it instead as a choppy corrective ladder climbing into resistance.
| Wave | Price |
|---|---|
| Wave 1 | $1,892 |
| Wave 2 | $1,869 (over 100% retrace — rule break) |
| Wave 3 | $1,913 |
| Wave 4 | $1,892 |
| Wave 5 | $1,919 |
| A-wave low | $1,886 |
| B-wave invalidation | $1,930 |
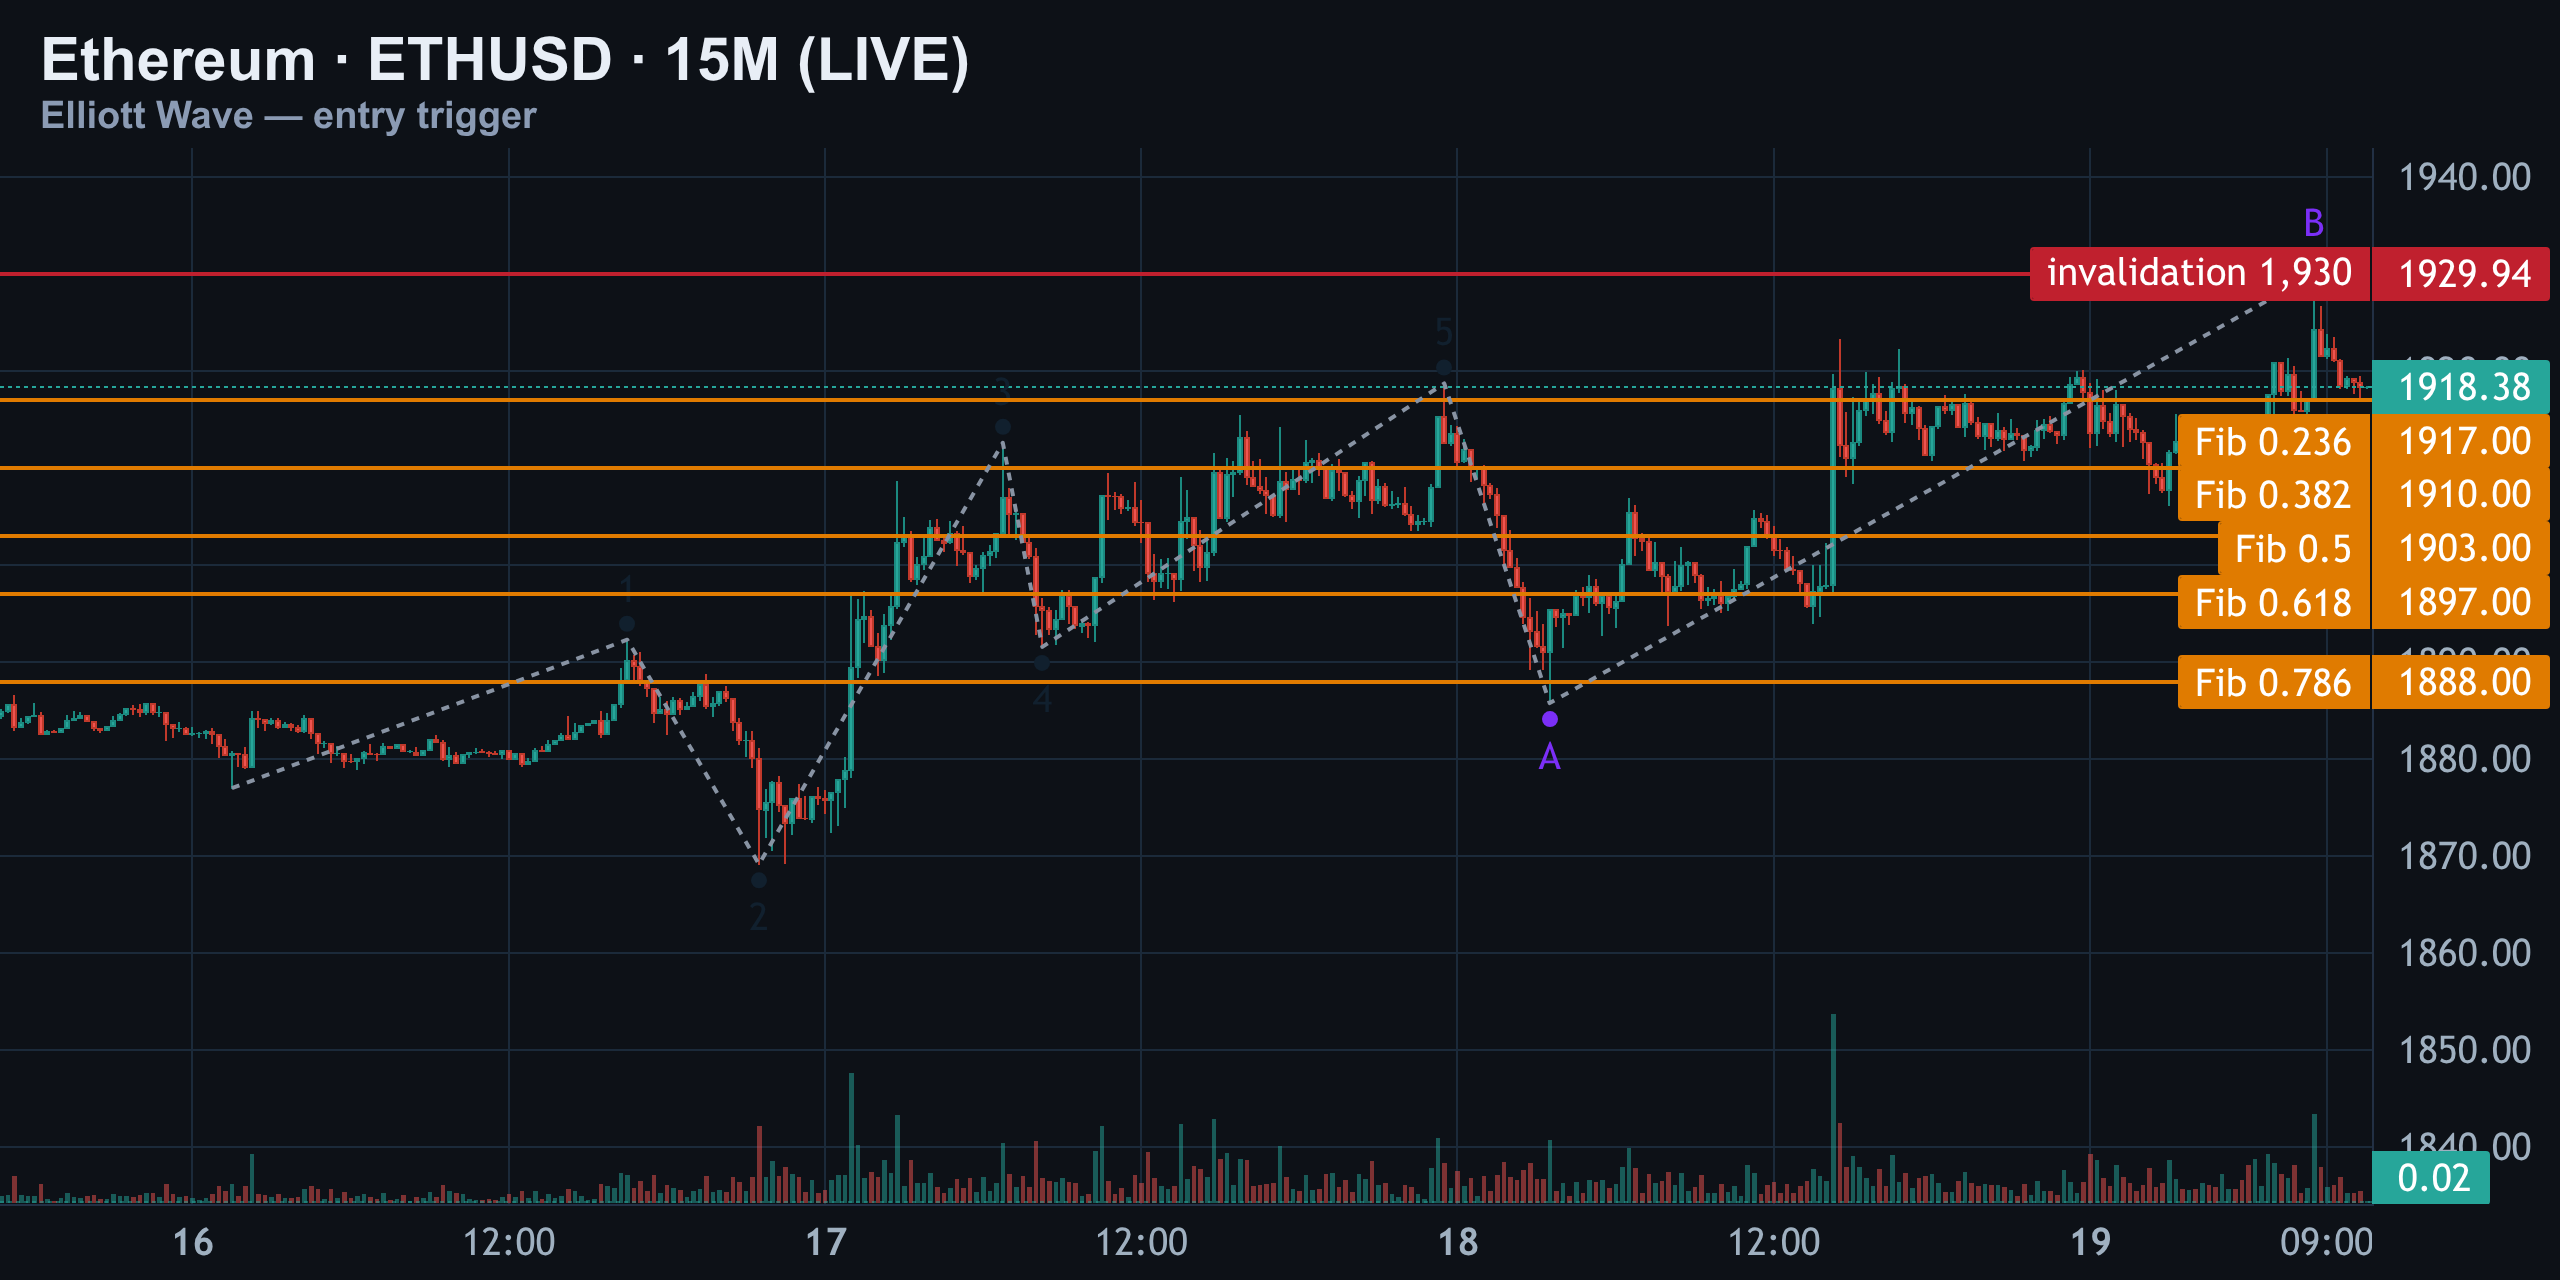
Price is currently pinned just under $1,918–$1,919 — right at the flat top of this whole climb, and right under the 23.6% fib at $1,917. That makes this the chart to actually time an entry off, not to build conviction on.
- A sharp rejection candle under $1,918 with volume is the first short trigger, using $1,910, $1,903 and $1,897 as bail-out zones if it fails
- A clean grind through $1,930 means stand aside completely — that confirms the bigger 1H B-wave is still alive and any short is premature
The Scenarios, Ranked
Putting the three timeframes together, here's how the paths stack up from most to least likely given current structure.
| Rank | Scenario | Trigger | Implication |
|---|---|---|---|
| 1 | Expanded flat, C-wave still ahead | Rejection under $1,918–$1,919 with volume | Retest of $1,943, then the real decline toward $1,822 and below |
| 2 | Bearish grind continues | Loss of $1,918 without ever tagging $1,943 | Slow bleed toward the 23.6%–38.2% fib band ($1,898–$1,870) |
| 3 | Full bullish flip | 1H close above $1,943 | Corrective count is invalidated; fresh leg higher, not a pullback |
Structure vs. Positioning — Do They Agree?
Structure alone says corrective: an unextended wave 3, an overlapping wave 4, and a B-wave that's already stretched to twice its A-leg. That's the profile of a market working off a larger advance, not building a fresh one.
But price behavior is telling a slightly different story. Buyers have twice pushed straight through a tentative invalidation in the last two sessions — first at $1,943 itself getting revisited, now at $1,917 on the 1H. That kind of repeated absorption of supply is exactly what you'd expect from an expanding B-wave, not from a market that's ready to roll over. The two views agree on one thing only: nothing gets resolved until $1,943 either holds as resistance or gets taken out cleanly.
Levels to Watch
| Level | Price | Why it matters |
|---|---|---|
| 4H invalidation (B-wave high) | $1,943 | Breaks the entire corrective bias if closed above |
| 1H broken C-wave low | $1,917 | Already reclaimed — old bearish trigger, now resistance-turned-support test |
| 1H expanded-flat cap | $1,930 | Alternate B-wave invalidation; grinding through this favors more upside first |
| Current price | ~$1,918 | Sitting right at the flat top of the 15M climb |
| 23.6% retracement | $1,898 | C-wave hasn't even tagged this yet |
| A-wave low (4H) | $1,822 | First real downside target if C-wave resumes |
| 15M bail-out zone | $1,910 / $1,903 / $1,897 | Fib levels to manage a failed short |
The Setup, Per the Count (Not Advice)
For anyone tracking this purely through the Elliott Wave lens, the setup is straightforward, not a recommendation to trade it blindly.
- Watch $1,918–$1,919 for a sharp rejection candle with volume — that's the first short trigger
- If triggered, use $1,910, $1,903 and $1,897 as staged bail-out/management zones
- If price instead clears $1,930 cleanly, stand aside — the bigger 1H B-wave is still alive and the short is premature
- A 1H close above $1,943 invalidates the bearish case entirely, regardless of what the 15M is doing
Summary: One Level Decides Everything
Ethereum's bigger structure still looks corrective, not trending, but the near-term bearish trigger already broke once today. That's not a disaster — it's a reminder that the 4H bias and the 1H timing don't move in lockstep. Right now, ETH sits in the gap between a $1,918 pivot and a $1,943 ceiling, and every one of the three ranked scenarios funnels back through that same $1,943 level.
Until that ceiling either holds firm or breaks with conviction, the honest answer to the headline question is: both are still on the table. The market just hasn't picked one yet.
Previous days
08/18/2026 — Ethereum's $1,943 Ceiling: Is Wave C Loading Now?
Ethereum's $1,943 Ceiling: Is Wave C Loading Now?
Ethereum Just Got Rejected at $1,943 — Here's Why It Matters
One-thousand-nine-hundred-forty-three. That's the ceiling Ethereum keeps slamming into and failing to clear. Yesterday we flagged the invalidation at $1,913 — it held, but only after price poked higher and got rejected right at this new wall.
As of today, August 18, 2026, ETH is trading in the $1,895–$1,912 zone, according to real-time data from Yahoo Finance and MetaMask's price tracker, which pegs spot ETH at roughly $1,895 with a market cap near $28.7 billion in circulating value context. That puts price squarely inside the battle zone this analysis is built around.
4H — The Big Picture: Five Waves Up, Then What?
Zoom out to the four-hour chart, because this is where the real story lives. Back in mid-July, Ethereum kicked off what looked like a clean five-wave impulse. But the internal structure was messy from the start, and that matters a lot for what comes next.
| Wave | Price Level | Note |
|---|---|---|
| Wave 1 high | $1,947 | Impulse leg begins |
| Wave 2 low | $1,803 | 73% retrace — deep but survivable |
| Wave 3 high | $1,956 | Only 0.78x Wave 1 — unextended |
| Wave 4 low | $1,848 | 70% retrace, overlaps Wave 1 — rule violation |
| Wave 5 high | $1,981 | Only 0.68x Wave 1 — undersized |
| Wave A low | $1,822 | Sharp decline |
| Wave B high | $1,943 | Rejected — tentative invalidation |
Here's the first red flag: wave three is only 0.78 times the length of wave one — an unextended third wave, atypical for a healthy impulse. Wave four then dragged price down to $1,848, retracing 70% of wave three. That's deep, and worse, it overlaps into wave-one territory. Under strict impulse rules, wave four can never overlap wave one — that's a hard rule broken.
So what we're likely looking at instead of a textbook impulse is either a diagonal, or — more probable given how corrective this whole move feels — a larger corrective structure disguised as a five. Wave five stretched to $1,981, only 0.68 times wave one — another undersized wave.
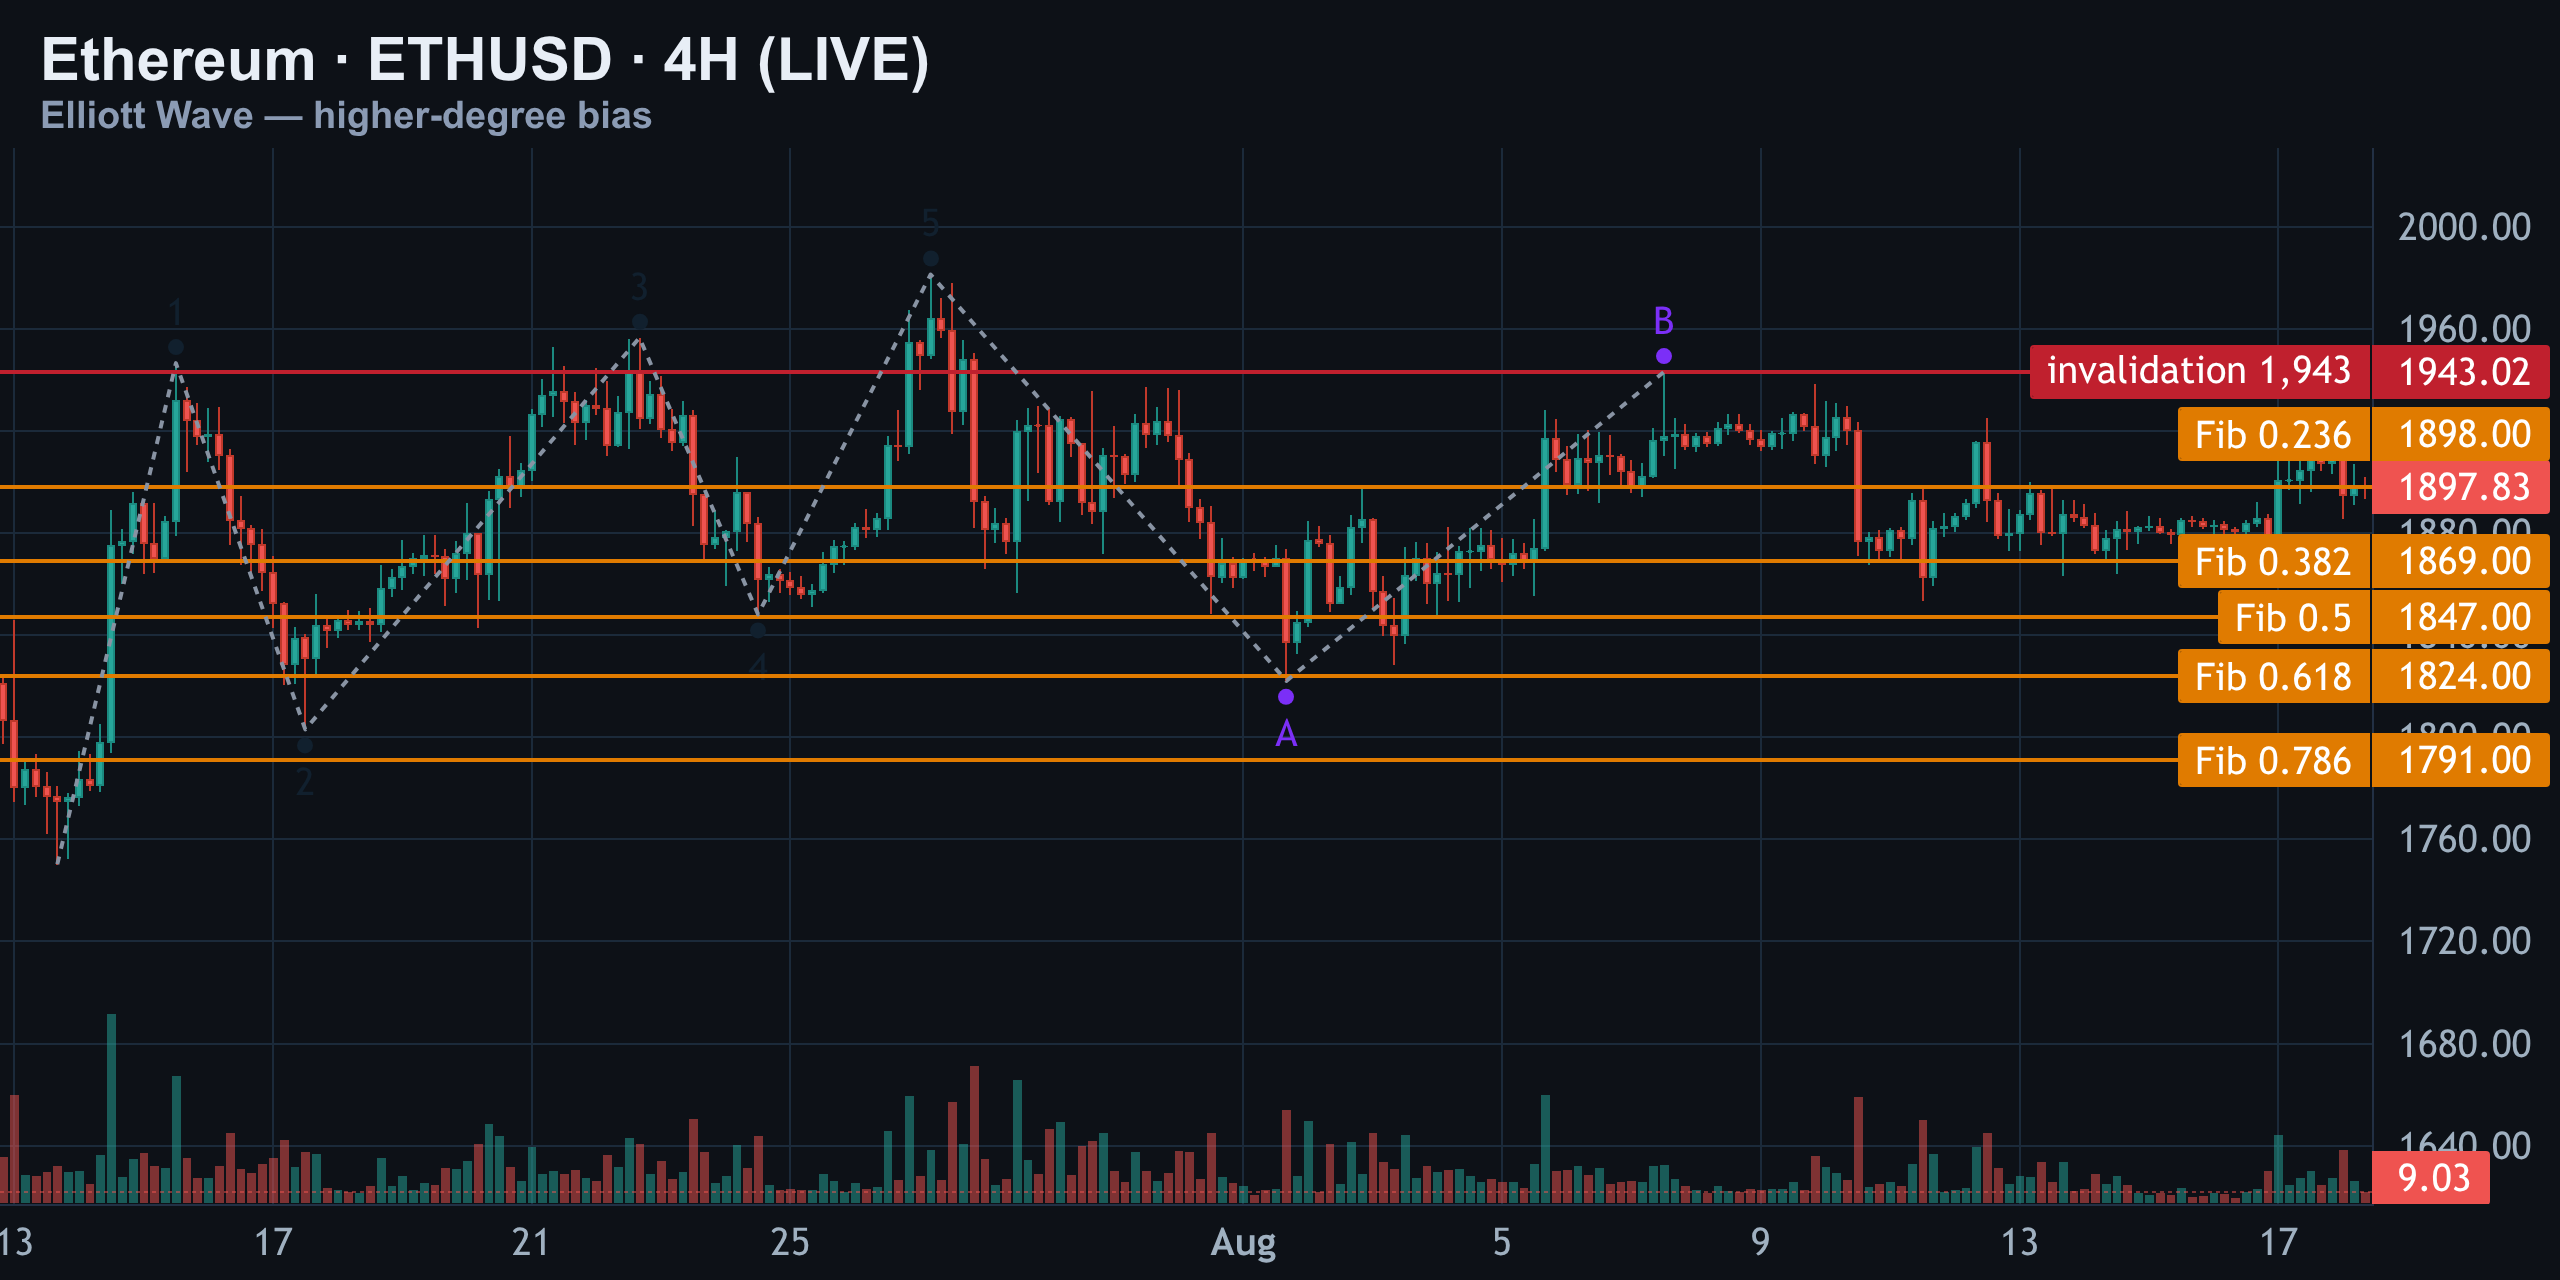
Since that high, price carved a sharp A-wave down to $1,822, then a B-wave rally that stalled right at $1,943. That B-wave high is now our tentative invalidation for the bearish path — close above it, and the corrective-C thesis is dead. Until then, this whole four-hour structure reads like a wave B sitting on top of a larger decline.
The Fibonacci Roadmap Lower
| Fib Level | Price |
|---|---|
| 0.50 | $1,847 |
| 0.618 | $1,824 |
| 0.786 | $1,791 |
The Fibonacci grid drawn from $1,750 to $1,943 gives our roadmap lower if wave C confirms. Big trend rallied, now pulling back — $1,943 decides if bulls or bears win.
1H — Primary Count vs Alternates: The Battle at $1,895–$1,919
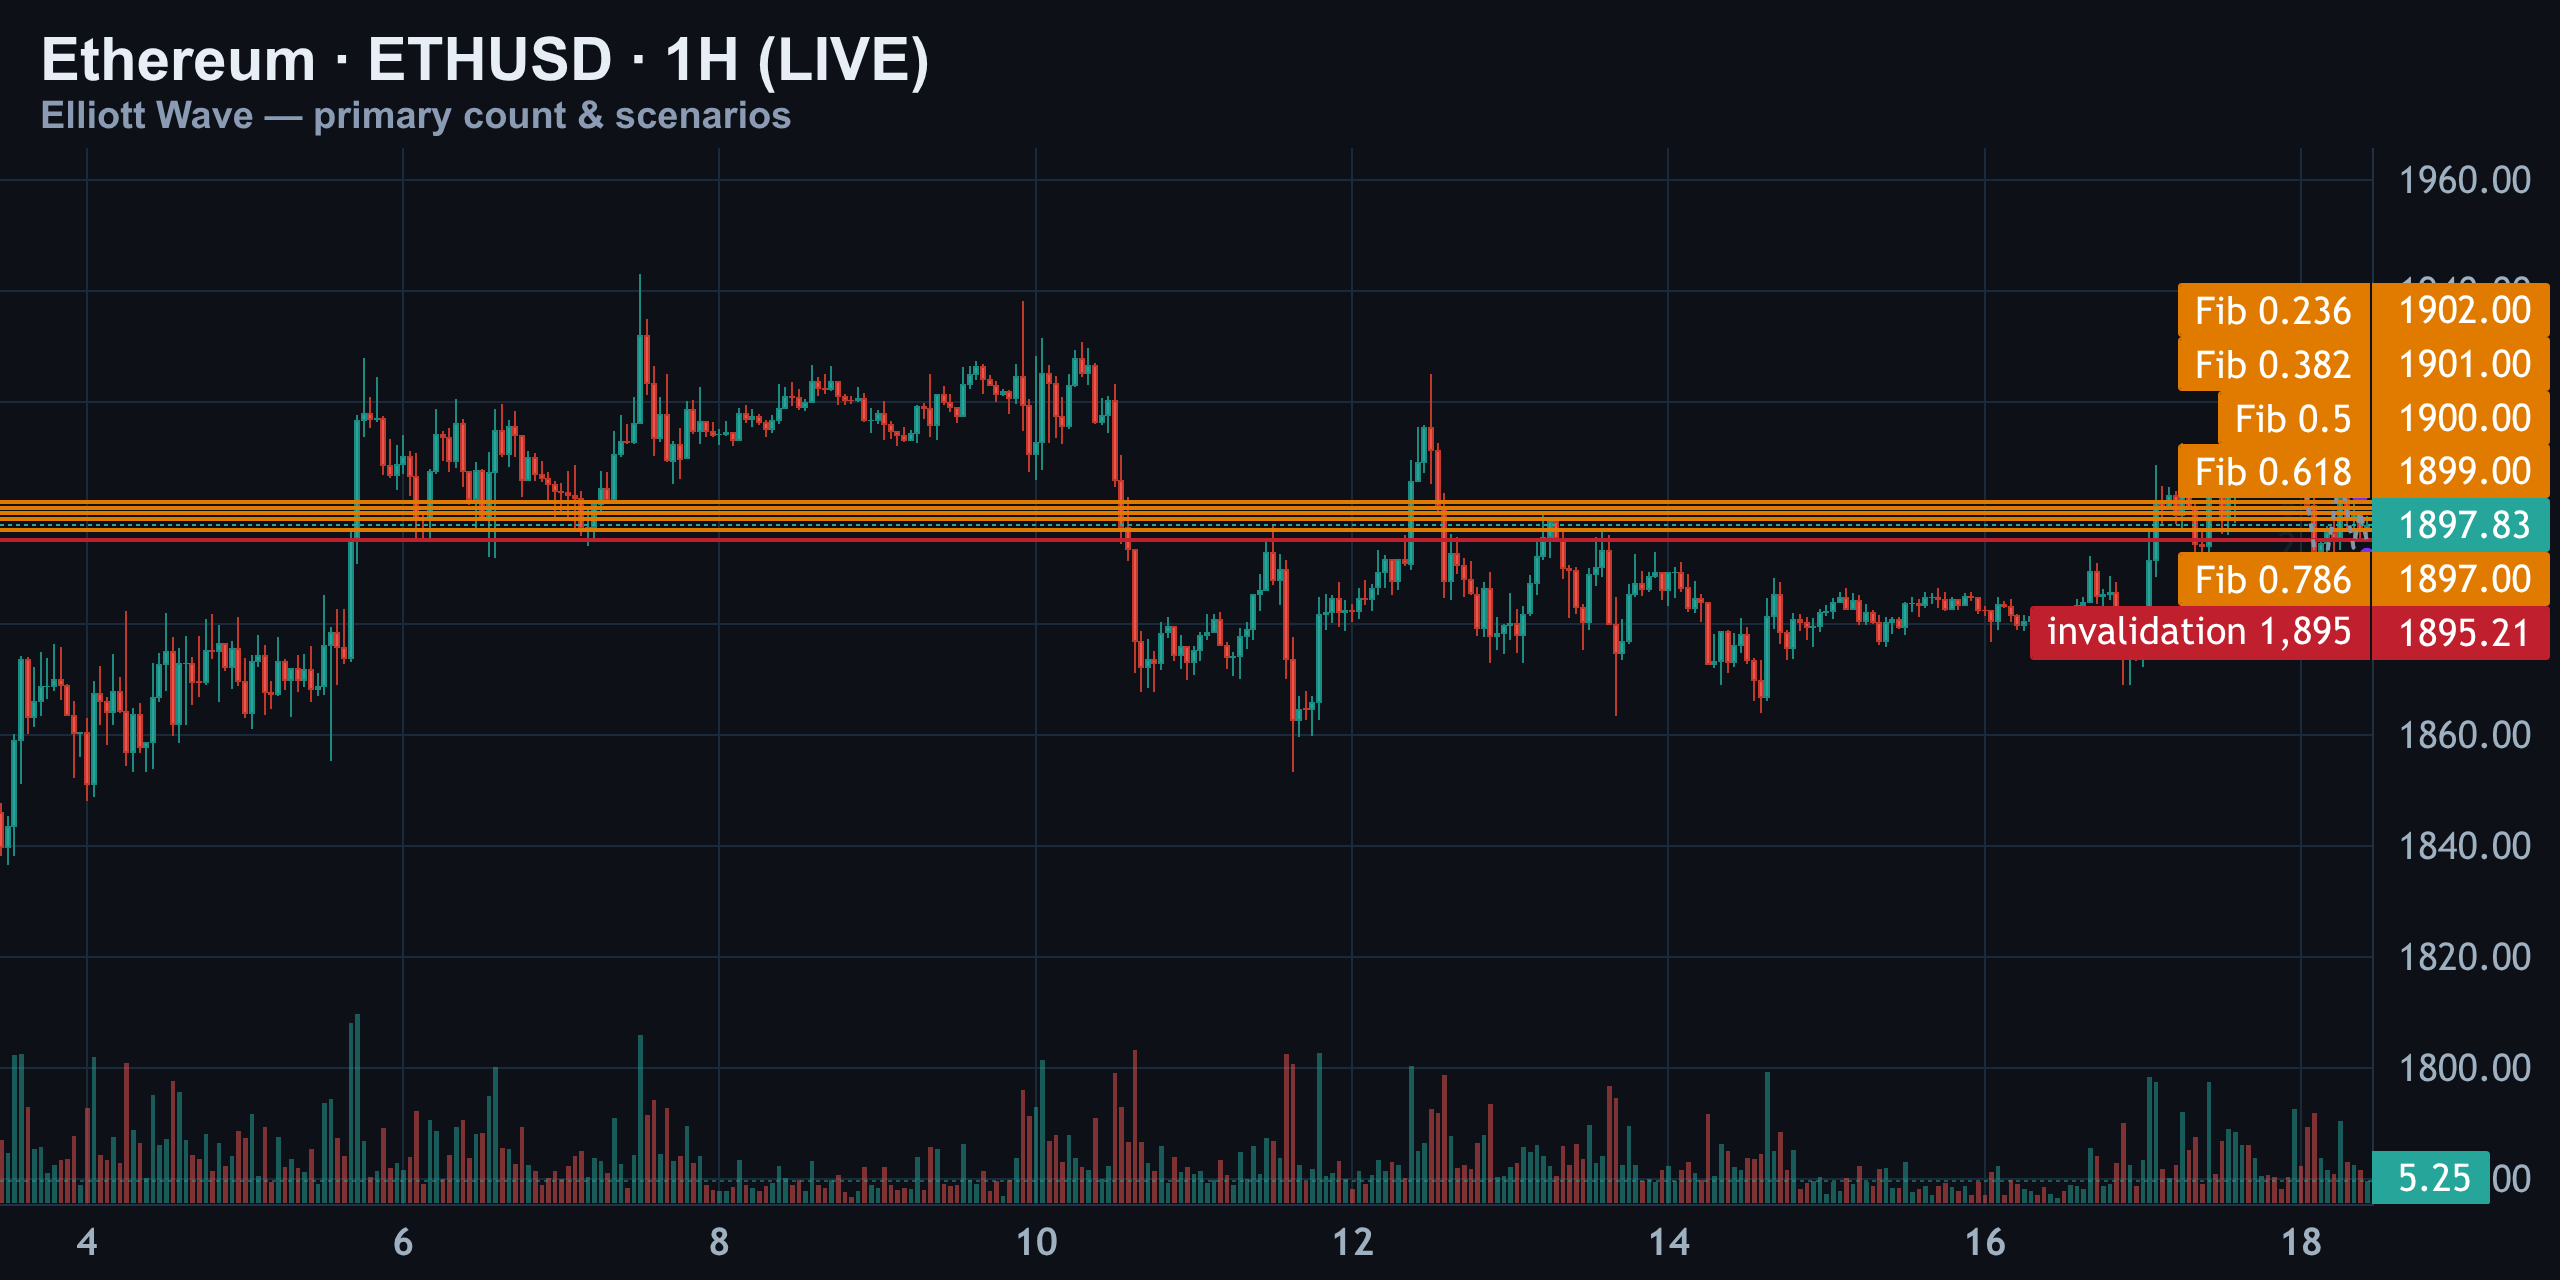
Drop to the one-hour chart and the auto-count immediately breaks a rule: wave two at $1,904 retraces more than 100% of wave one. That's not allowed in a real impulse, so we throw the five-wave label out and re-read this as a correction.
Primary Count — A-B-C Flat
An A-B-C flat living inside the four-hour B-wave. The A-wave bottomed near $1,894, wave B rallied to $1,900, and wave C pushed to $1,895 before the bounce we're trading now. Wave B is only 0.50 times wave A — shallow, typical of a running or regular flat, not a zigzag.
Confirmation comes if price rejects the $1,904–$1,919 zone and rolls back under $1,895, reopening the door to a bigger C-wave toward $1,822.
Alternate 1 — Chop Before the Real Move
If price grinds sideways and holds above $1,895 without a clean breakdown, we could be building a triangle or expanded flat at this smaller degree — more chop before the real move. Confirmation is simply time: repeated tags of the $1,895–$1,919 range without resolution.
Alternate 2 — The Bullish Case
If Ethereum closes above $1,919 and then above the four-hour invalidation at $1,943, the corrective reading fails entirely, and we're likely in a fresh impulsive leg targeting a retest of $1,981 and beyond. That's the level that flips this whole script bullish.
| Scenario | Trigger | Target |
|---|---|---|
| Bearish (primary) | Reject $1,904–$1,919, break under $1,895 | $1,822 → $1,791 |
| Chop/triangle (alt 1) | Repeated tags of $1,895–$1,919 range | No resolution yet |
| Bullish (alt 2) | Close above $1,919, then $1,943 | $1,981+ |
15M — Entry Trigger: Timing the Next Move
Now the fifteen-minute chart, purely for timing. Same problem shows up again — the auto wave two at $1,869 retraces well over 100% of wave one, again ruling out a clean impulse and pointing to a corrective wave or diagonal instead.
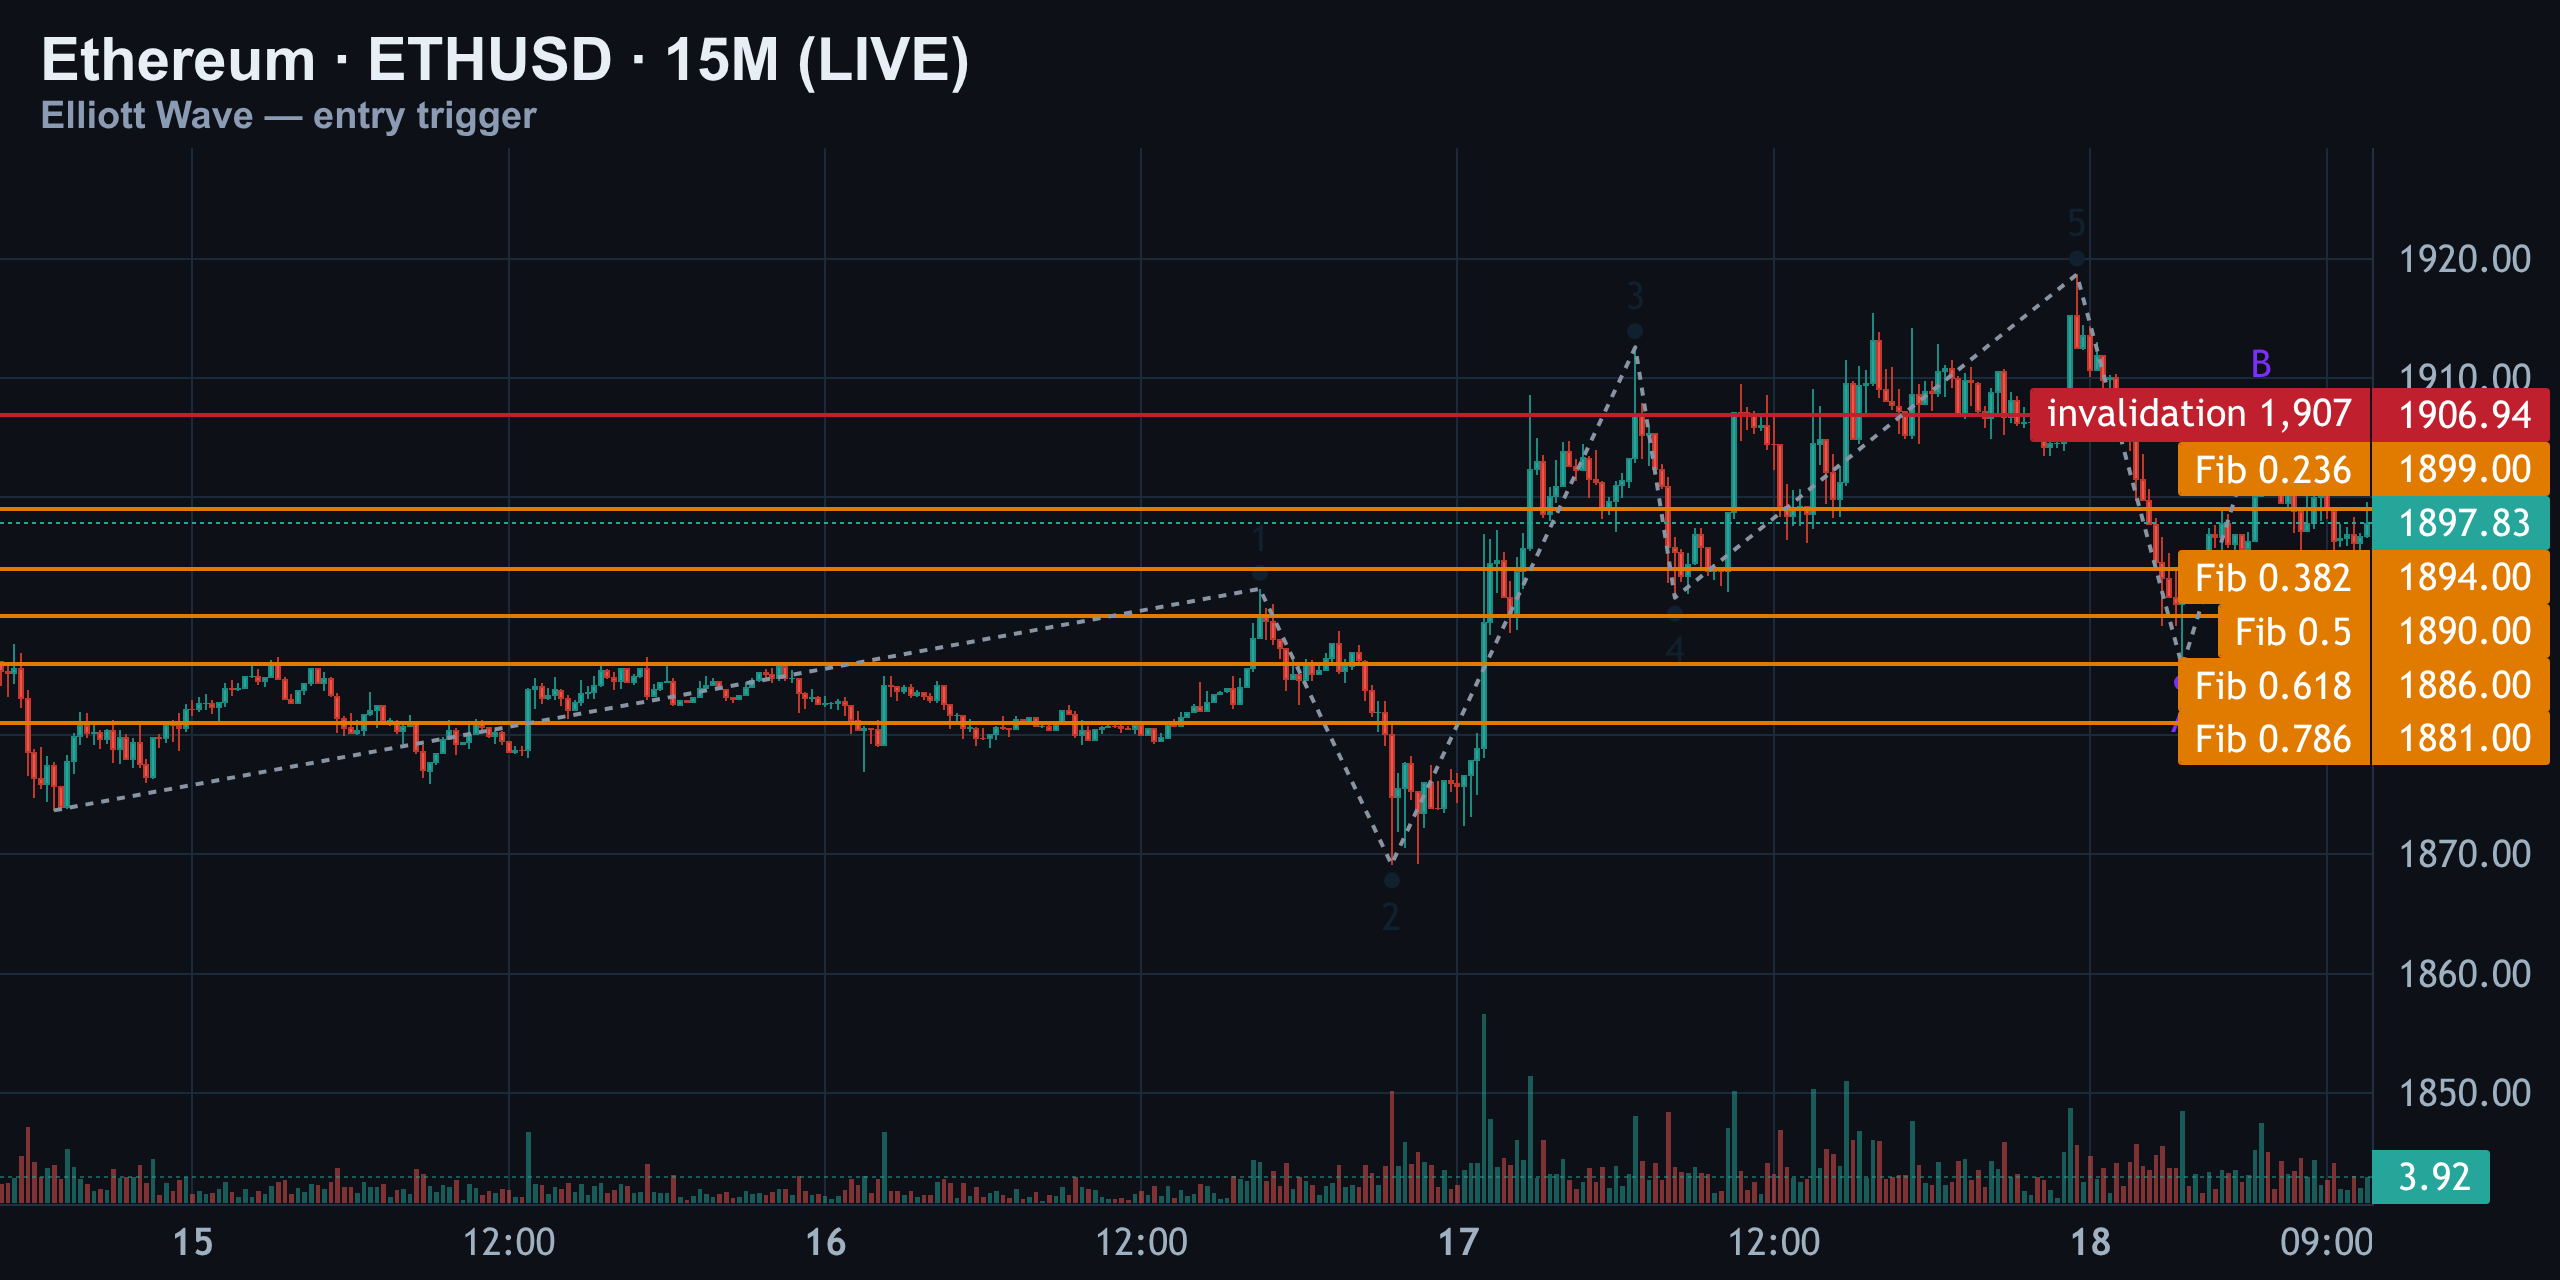
What matters for entry is simpler: price rallied from around $1,874 up to a high near $1,919, tagged a B-wave at $1,907, and has since pulled back into the Fibonacci pocket between the 0.50 level at $1,890 and the 0.618 level at $1,886. That pocket lines up neatly with the order-book bid wall at $1,892 — real resting demand, not just a Fibonacci number on a screen.
| Level | Price | Meaning |
|---|---|---|
| 15M swing high | $1,919 | B-wave high |
| Fib 0.50 | $1,890 | Pullback pocket top |
| Bid wall | $1,892 | Real order-book demand |
| Fib 0.618 | $1,886 | Pullback pocket bottom |
| Invalidation | $1,907 | Bounce confirms above here |
The tentative invalidation here is $1,907; a clean break and hold above it says the bounce has real legs and the bearish one-hour count is losing ground fast. But if price stalls in this pocket and turns down, especially with rejection candles near $1,897–$1,900, that's the trigger to lean short in line with the bigger C-wave thesis.
Positioning & Order Flow: What the Liquidation Map Says
Structure is only half the picture. Where leveraged money is stacked matters just as much, and right now the liquidation clusters tell a story that largely agrees with the bearish 1H/4H read.
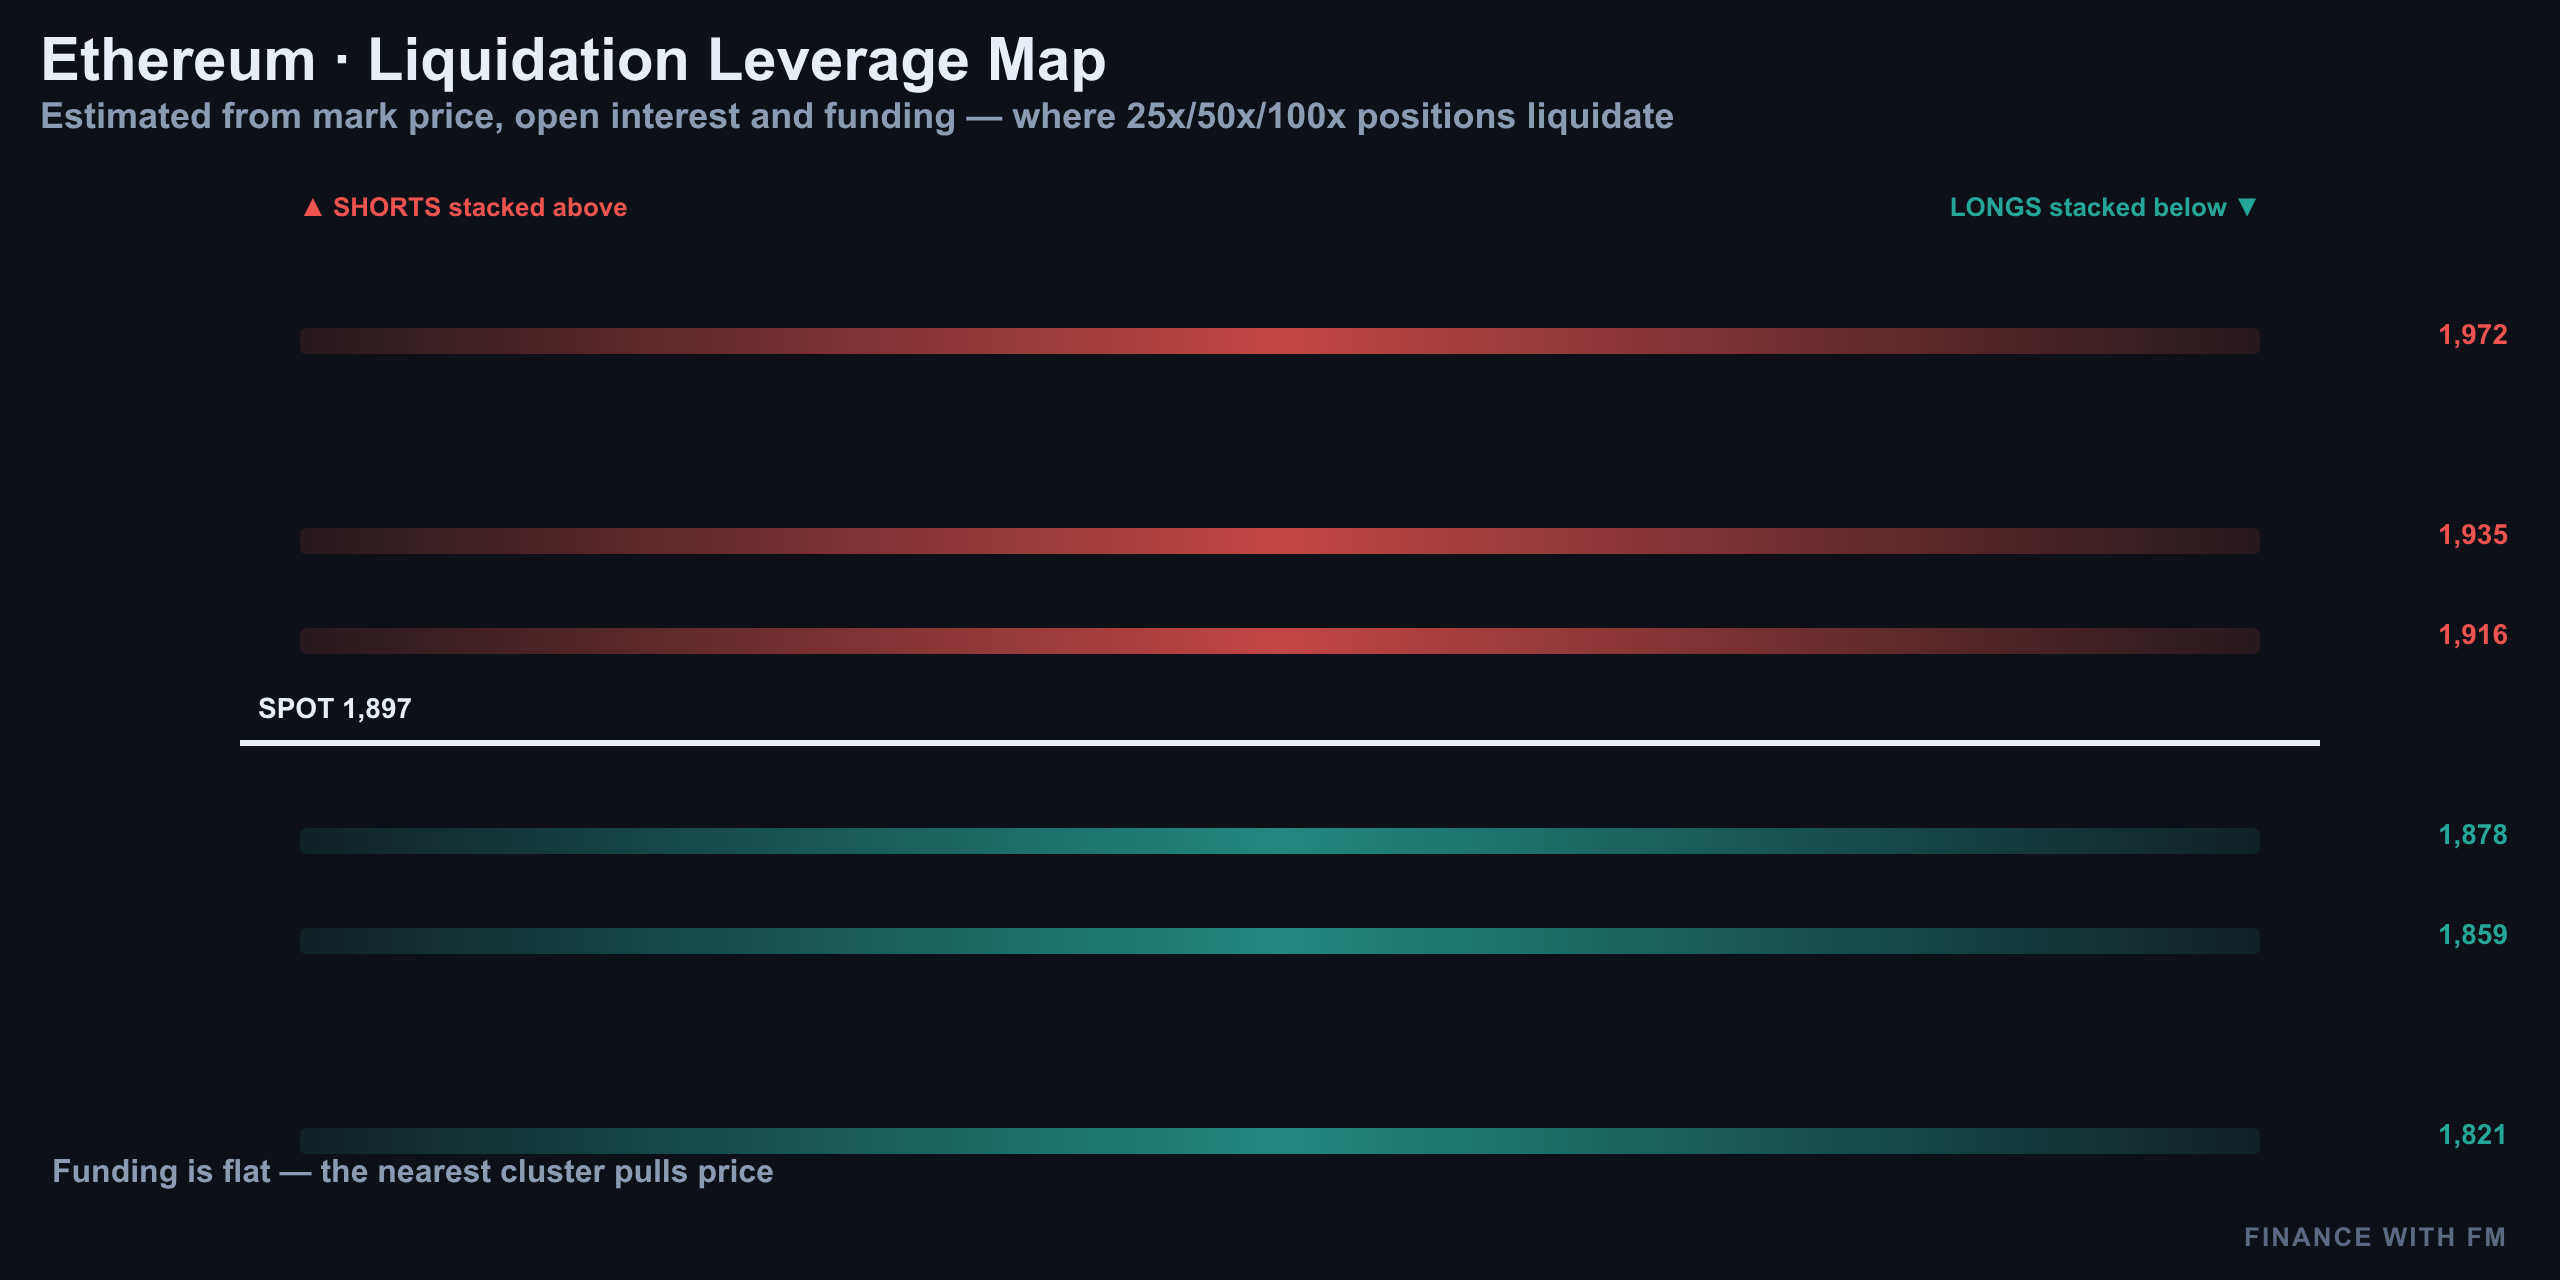
Live liquidation tracking from platforms like CoinGlass and Tapesurf's real-time heatmap shows dense long-side liquidation clusters stacking up just below current spot price, with a thinner air pocket above $1,919–$1,943 where short liquidations sit. That asymmetry is exactly what you'd expect if retail piled into longs on the B-wave bounce — and it's a classic setup for a stop-run lower before any real reversal, echoing the broader 24-hour liquidation flow data tracked by aggregators like Gate.com, which recorded tens of millions in forced closures across the market in the most recent 24-hour window.
Structure vs Positioning — Do They Agree?
Yes, mostly. The Elliott Wave count leans toward a wave-C waterfall below $1,895, and the liquidation map shows the fuel for exactly that move sitting just beneath price. When structure and order flow point the same direction, it's not proof — but it raises the conviction on the primary bearish count considerably.
Levels to Watch and the Setup (Not Advice)
| Level Type | Price | Why It Matters |
|---|---|---|
| Bull invalidation (4H) | $1,943 | B-wave high — close above kills the C-wave thesis |
| Key resistance (1H) | $1,919 | Must break to flip bullish |
| Current price | ≈$1,895–$1,912 | Battle zone per Yahoo Finance & MetaMask data |
| 15M invalidation | $1,907 | Bounce confirms above here |
| Bid wall / Fib pocket | $1,886–$1,892 | Where the next reaction likely happens |
| Downside target 1 | $1,847 | Fib 0.50 from $1,750–$1,943 range |
| Downside target 2 | $1,822 | Fib 0.618, matches prior A-wave low |
| Downside target 3 | $1,791 | Fib 0.786 — deep C-wave target |
Per the count — not advice — the trade only makes sense on confirmation, not anticipation. A rejection candle forming in the $1,897–$1,900 zone on the 15-minute chart, followed by a break of $1,895 on the hourly, is what turns this from a thesis into a live setup targeting $1,822 and then $1,791. On the flip side, a clean hourly close above $1,919 followed by a push through $1,943 flips the whole board bullish, with $1,981 as the next magnet.
Where Ethereum's Count Fits the Bigger Crypto Picture
Price prediction models are split on where ETH lands by month-end. Changelly's forecasting data pegs an August 2026 range with a floor near $1,860.50 and a ceiling around $1,952.86 — a band that fits almost perfectly around the $1,943 wave-B ceiling and the $1,822–$1,847 downside Fibonacci cluster this count is built on. That kind of alignment between independent price-model ranges and wave-based Fibonacci targets is worth noting, even though the methodologies are completely different.
It's a reminder that Ethereum isn't trading in a vacuum at $1,943 — it's sitting at a level multiple independent frameworks flag as decisive. Whether you're reading candles, waves, order flow, or model outputs, the same few hundred dollars of range keeps showing up as the fork in the road.
Summary: One Level Decides Everything
- Ethereum's 4H structure shows a completed five-wave rally with multiple rule violations (unextended wave 3, overlapping wave 4), suggesting a corrective A-B-C rather than a clean impulse.
- Price is currently rejected at the $1,943 B-wave high — the level that decides whether this is a bullish reclaim or the top before a wave-C drop.
- The 1H chart shows a completed A-B-C flat; a break under $1,895 opens the door to $1,822 and $1,791 targets.
- Liquidation clusters below current price largely agree with the bearish structural read, adding confidence to the primary count.
- A clean break above $1,919 and then $1,943 flips the entire script bullish, targeting a retest of $1,981.
Watch the reaction in the $1,886–$1,900 zone over the next few hours — it's the tell for which scenario is winning, and it's the level this entire analysis hinges on.
08/17/2026 — ETH's 1,913 Wall: Wave B Top or Bull Reclaim?
ETH's 1,913 Wall: Wave B Top or Bull Reclaim?
The Setup: 1,925 Held, But the Rally That Followed Is Suspicious
Yesterday, Ethereum's entire bearish case rested on one number: 1,925. It held. Price ripped roughly 1.4% off the floor near $1,880, tagged $1,906, and punched straight into a resistance shelf at 1,913 — where it has stalled as of this writing, with ETH trading around $1,901–$1,908 on August 17.
That sounds bullish on the surface. But here's the twist: the very rally that produced this bounce breaks two hard Elliott Wave rules on its own chart. In wave theory, that's not confirmation of a new uptrend — it's a warning label. Rule-breaking rallies are the fingerprint of *corrective* B-waves, not the start of fresh bull impulses.
What's changed since yesterday isn't the bias — it's the resolution. The primary bearish count is intact, but invalidation has tightened from 1,925 down to 1,913, because the bounce structure itself reinforces the B-wave read rather than flipping it. Bias stays bearish. The lines just got sharper.
4H — Is This Even a Real Impulse?
Zoom out to the 4-hour chart and the skeleton of this move looks shaky from the start. Wave 1 tops near 1,947. Wave 2 dumps all the way to 1,803 — a 73% retracement, already unusually deep for a healthy impulse. Wave 3 pushes to 1,956, but it's only 0.78x the size of wave 1. In a textbook impulse, wave 3 is supposed to be the largest leg. It isn't.
| Wave | Price Level | Flag |
|---|---|---|
| Wave 1 top | $1,947 | — |
| Wave 2 low | $1,803 | 73% retrace — deep |
| Wave 3 top | $1,956 | Only 0.78x Wave 1 — undersized |
| Wave 4 low | $1,848 | 70% retrace — overlaps Wave 1 zone |
| Wave 5 top | $1,981 | Only 0.68x Wave 1 — undersized |
Wave 4 then drops to 1,848, a 70% retracement that drags price right back into wave 1's price territory — a hard rule violation for any clean motive impulse. Wave 5 stretches to 1,981, but at just 0.68x wave 1, it's undersized too.
- Unextended wave 3 (should be the largest, isn't)
- Oversized wave 4 (overlaps wave 1's territory)
- Undersized wave 5 (weak follow-through)
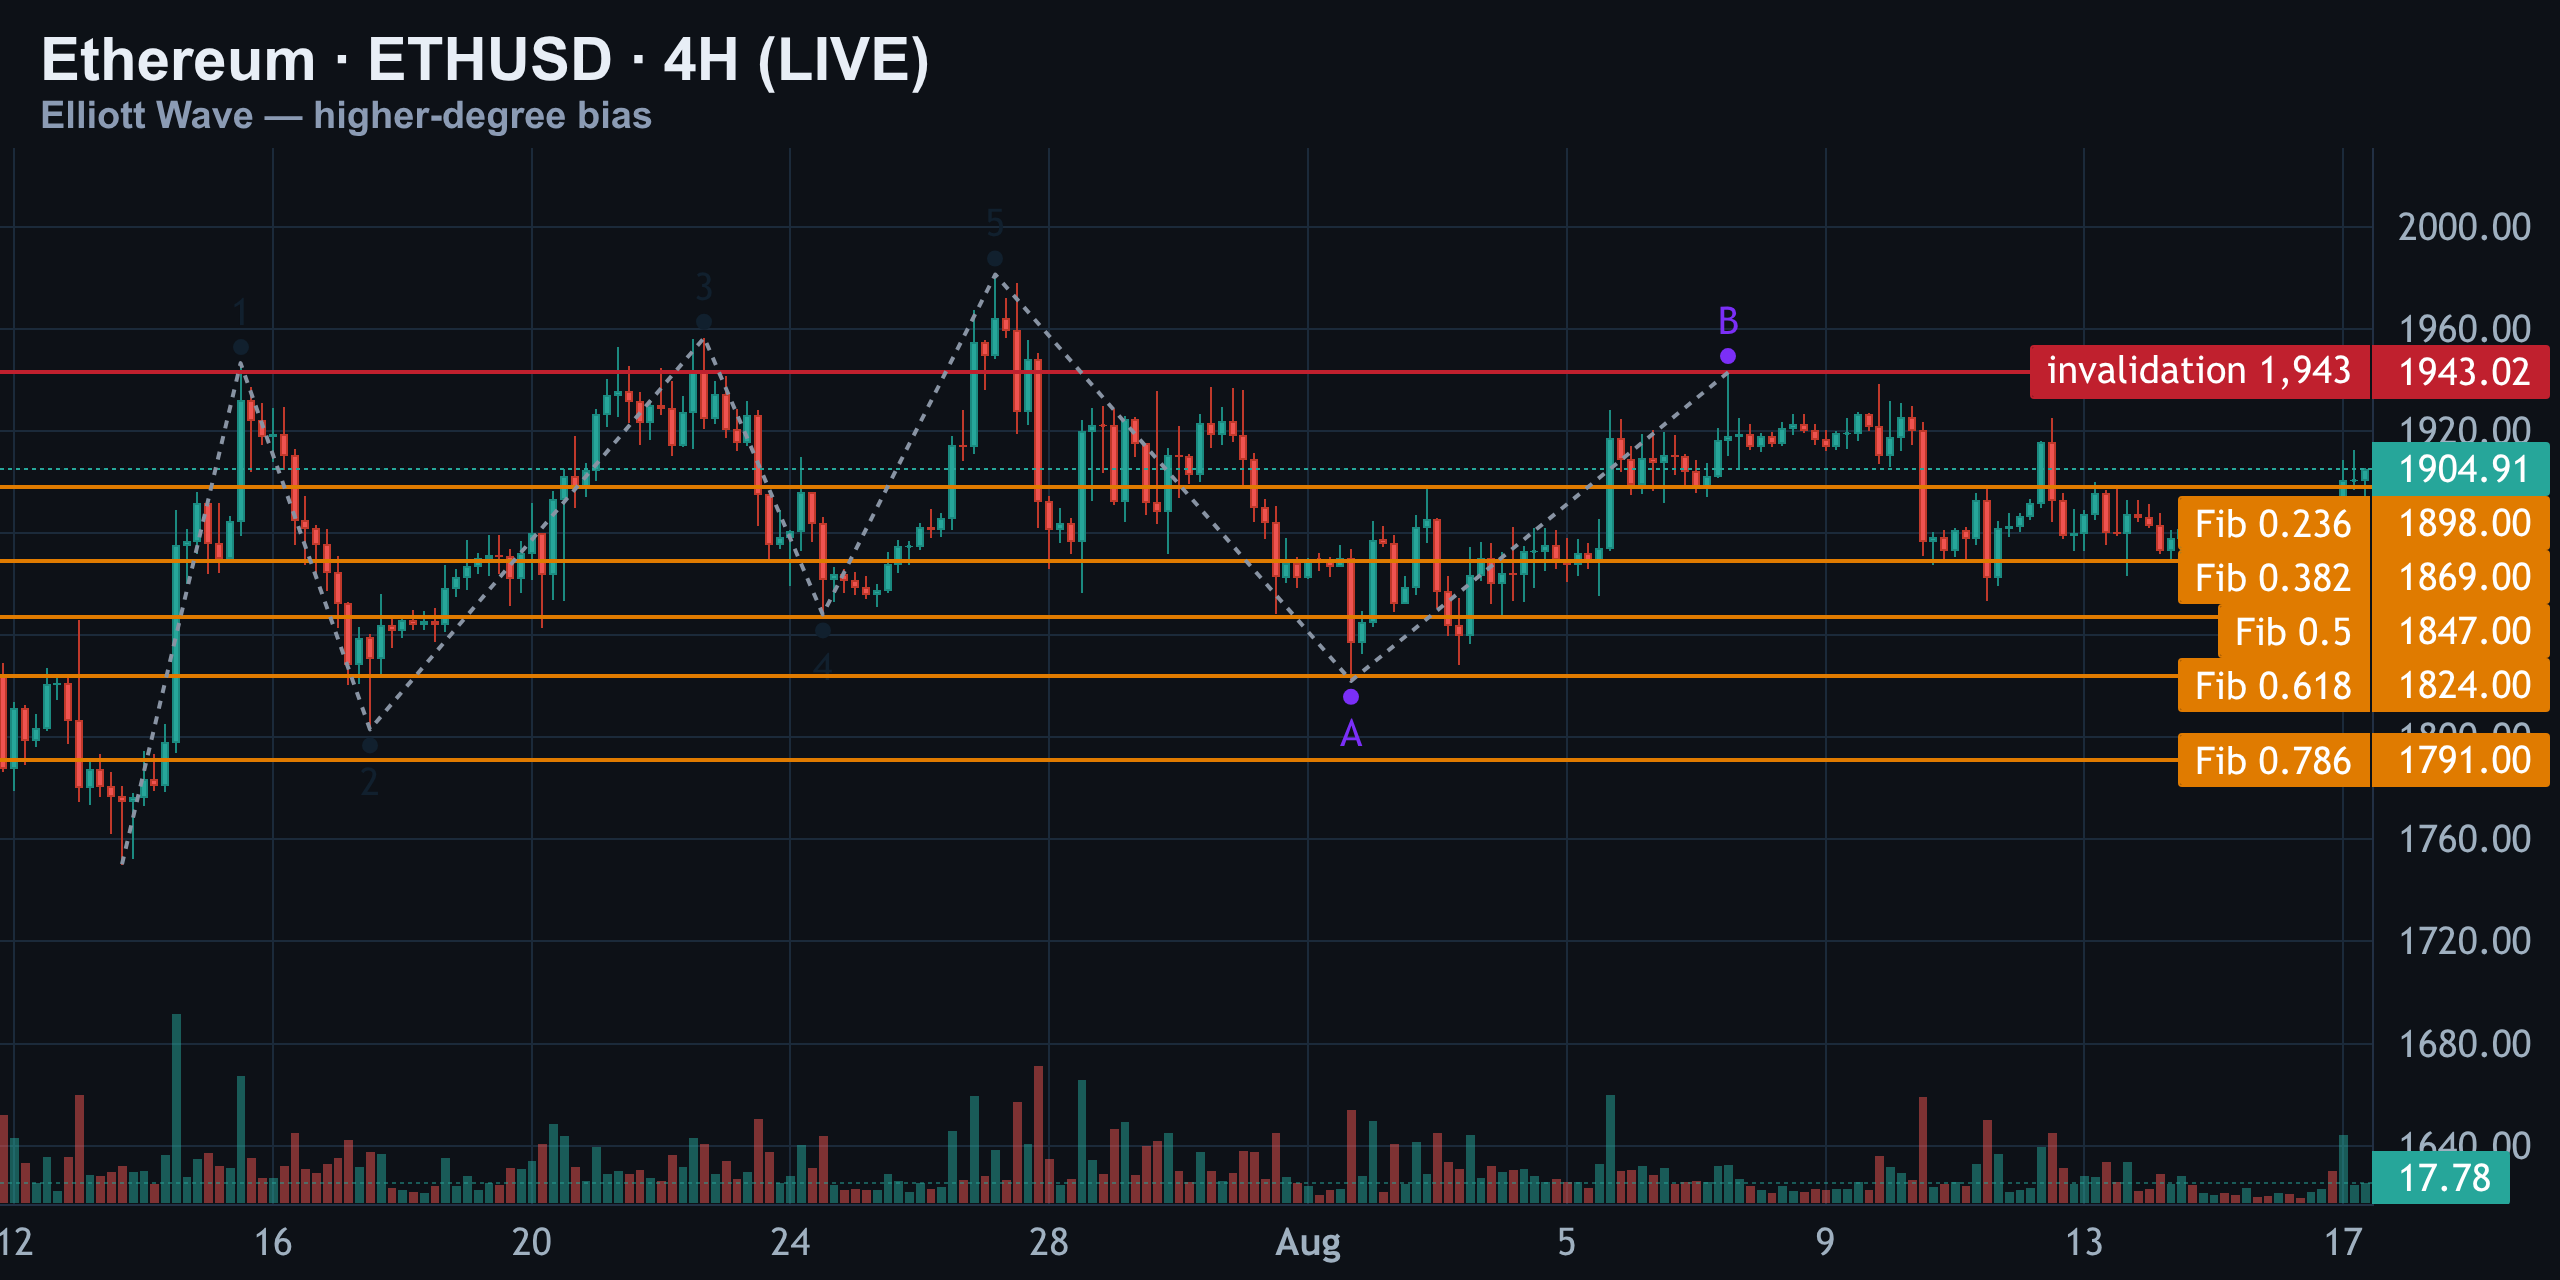
Stack those three flags together and the entire run from $1,803 to $1,981 looks less like a clean five-wave impulse and more like a diagonal — or even a large corrective structure dressed up as one. After that high, the A-wave drops to 1,822, and the B-wave rally has now stalled almost exactly at 1,943 — the same shelf that, if broken decisively to the upside, would invalidate the entire bearish reading from the top.
1H — Wave B or Wave 5? The Scenarios
On the 1-hour chart, auto-pivots label a fresh sequence: 1 at 1,898, 2 at 1,829, 3 at 1,943, 4 at 1,854, 5 at 1,925. Run the math and wave 2 retraces 142% of wave 1. That's not a deep pullback — it's a full rule violation, since wave 2 is never allowed to erase all of wave 1.
| Pivot | Price | Rule Check |
|---|---|---|
| Wave 1 | $1,898 | Baseline |
| Wave 2 | $1,829 | 142% retrace of Wave 1 — VIOLATION |
| Wave 3 | $1,943 | New high |
| Wave 4 | $1,854 | Overlaps Wave 1 — VIOLATION |
| Wave 5 | $1,925 | Failed impulse close |
On top of that, wave 4 at 1,854 overlaps wave 1's territory again. Two broken rules in one sequence means this isn't a real impulse at all — the labels have to be wiped and reassigned.
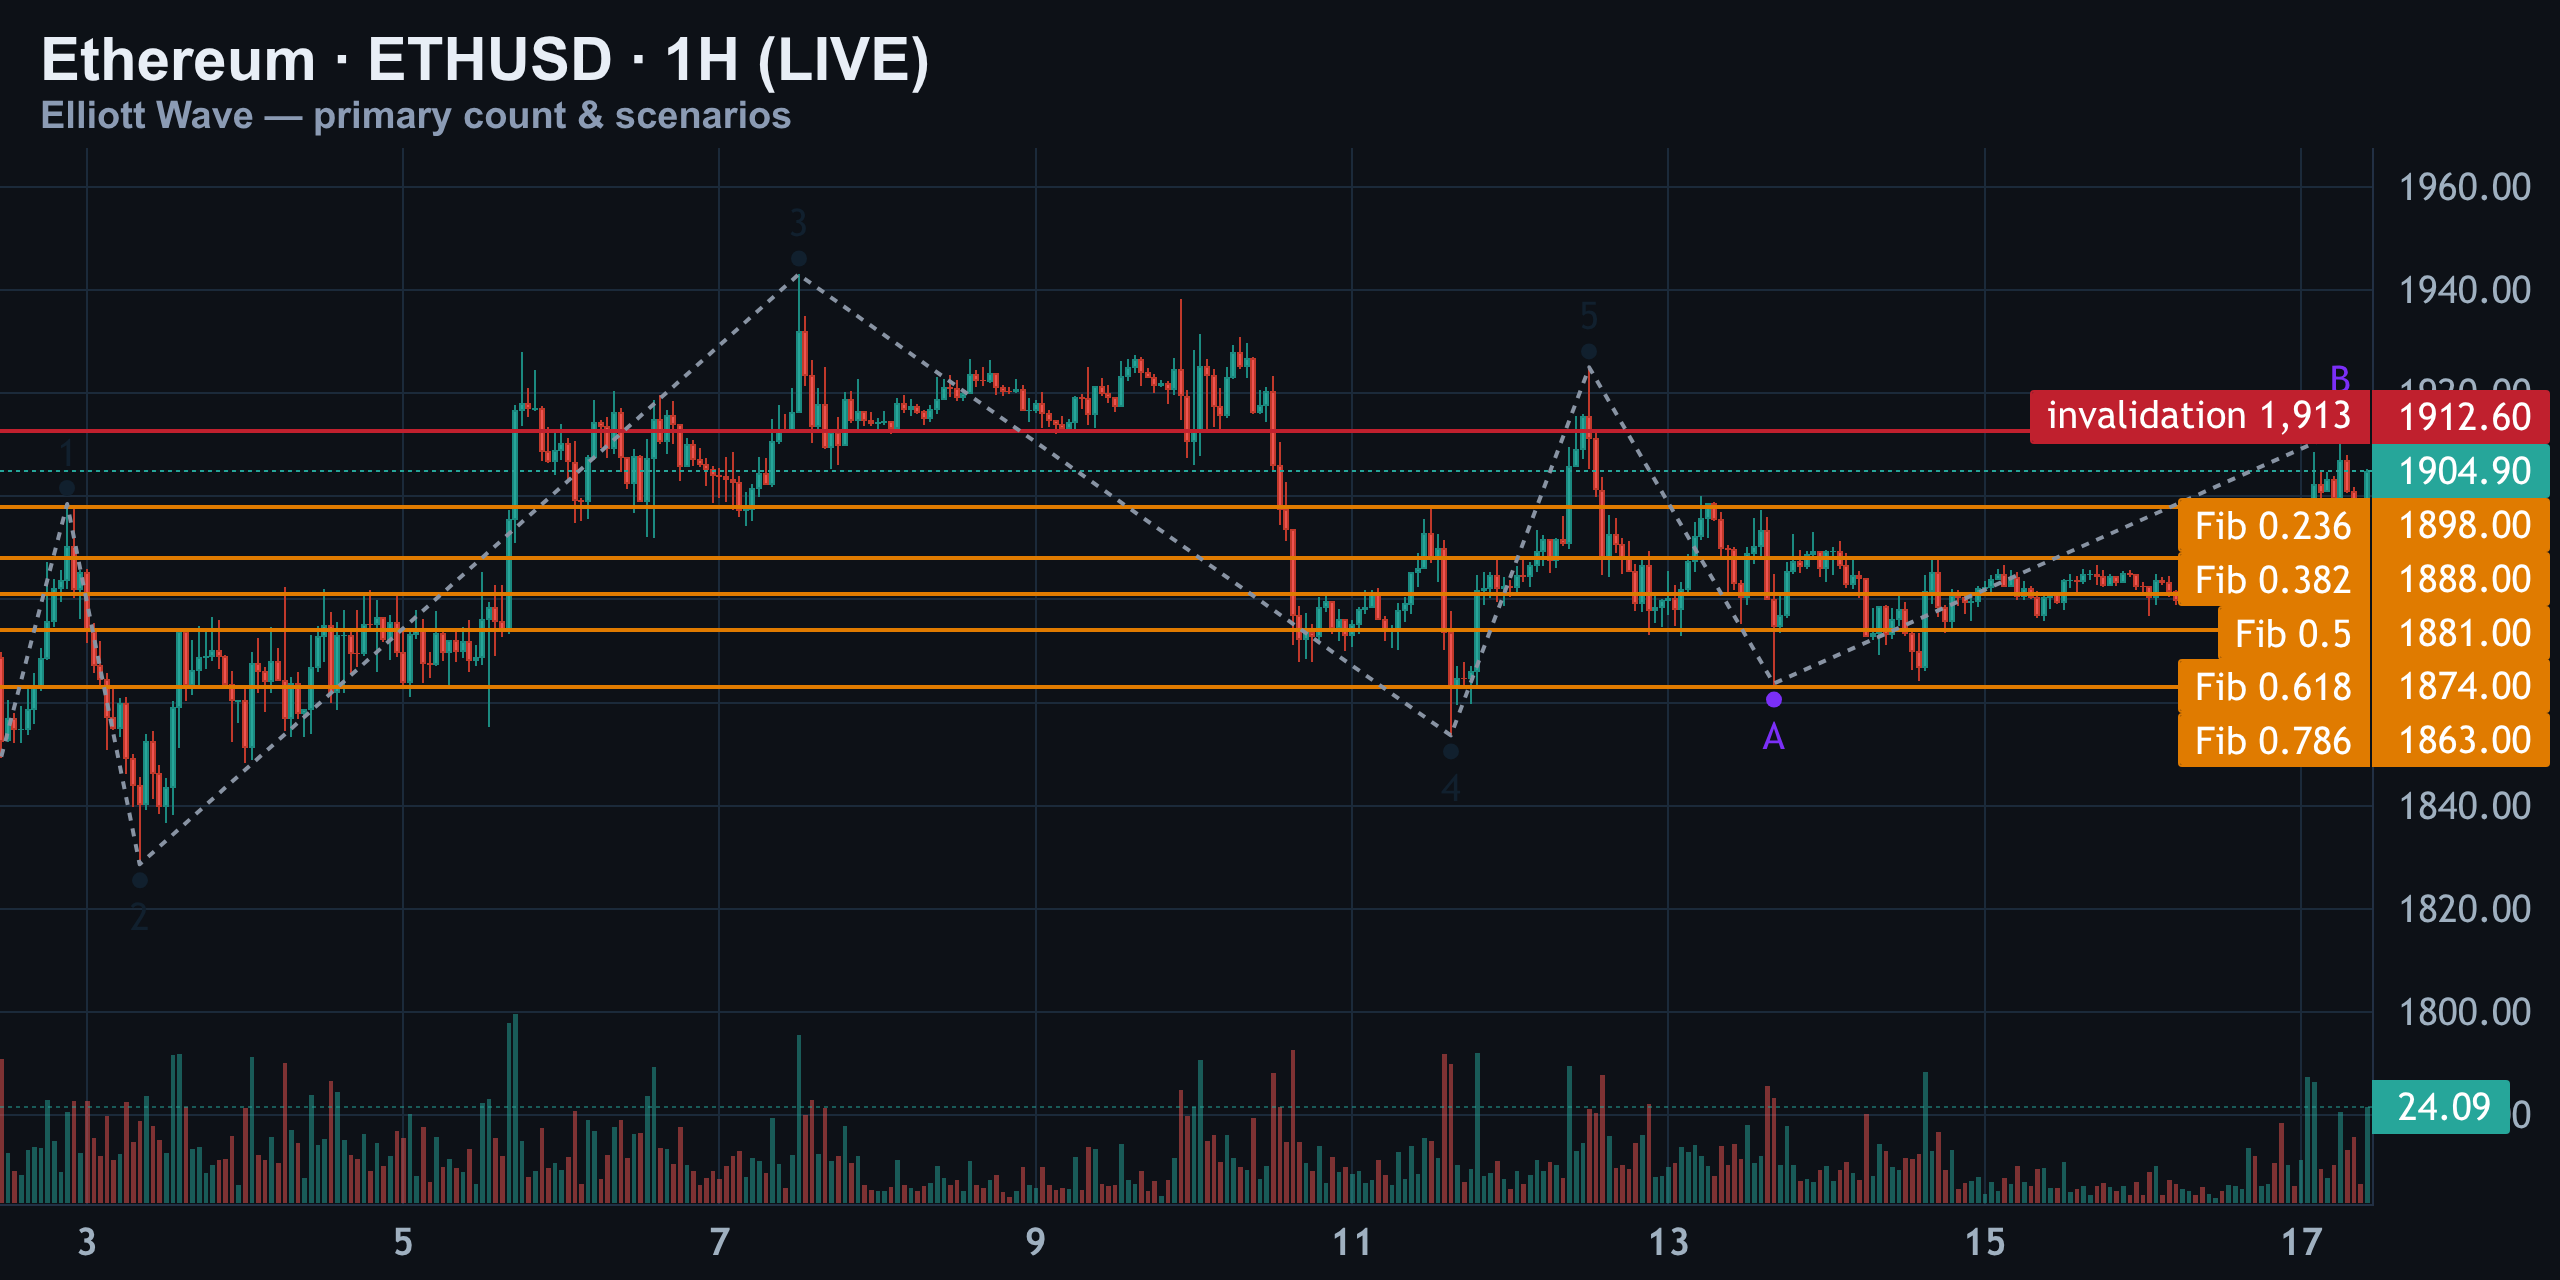
Scenario 1 (Primary): This Is the B-Wave
The whole move from $1,829 up through $1,925, down to $1,864, and back up to $1,913 is the B-wave of the larger 4H correction. Wave C is still ahead, aiming back down through the 0.382 and 0.5 Fibonacci retracements near $1,888 and $1,881, toward the 0.786 extension near $1,863.
Scenario 2 (Alternate): Bull Reclaim
If price reclaims 1,913 and holds above it, then pushes through 1,925 and 1,943, the corrective B-wave label breaks down entirely. That would open the door to an expanded flat resolving bullish, or genuine trend resumption back toward the 1,956 and 1,981 highs.
Scenario 3 (Minor): Ending Diagonal B-Top
A smaller possibility: this overlapping, rule-breaking rally is itself an ending diagonal forming the B-wave top — which still resolves lower, just with one more fake-out spike above 1,913 before it fails.
15M — The Exact Entry Trigger
Dropping to the 15-minute chart for timing: price chopped from 1,898 down to 1,905, back to 1,897, up to 1,913, then 1,892, before grinding back to 1,905 as of now. Wave 3 here is the shortest leg — another broken rule — and wave 4 overlaps wave 1 again. This is local chop, not a clean impulse, sitting directly under the 1-hour's 1,913 ceiling.
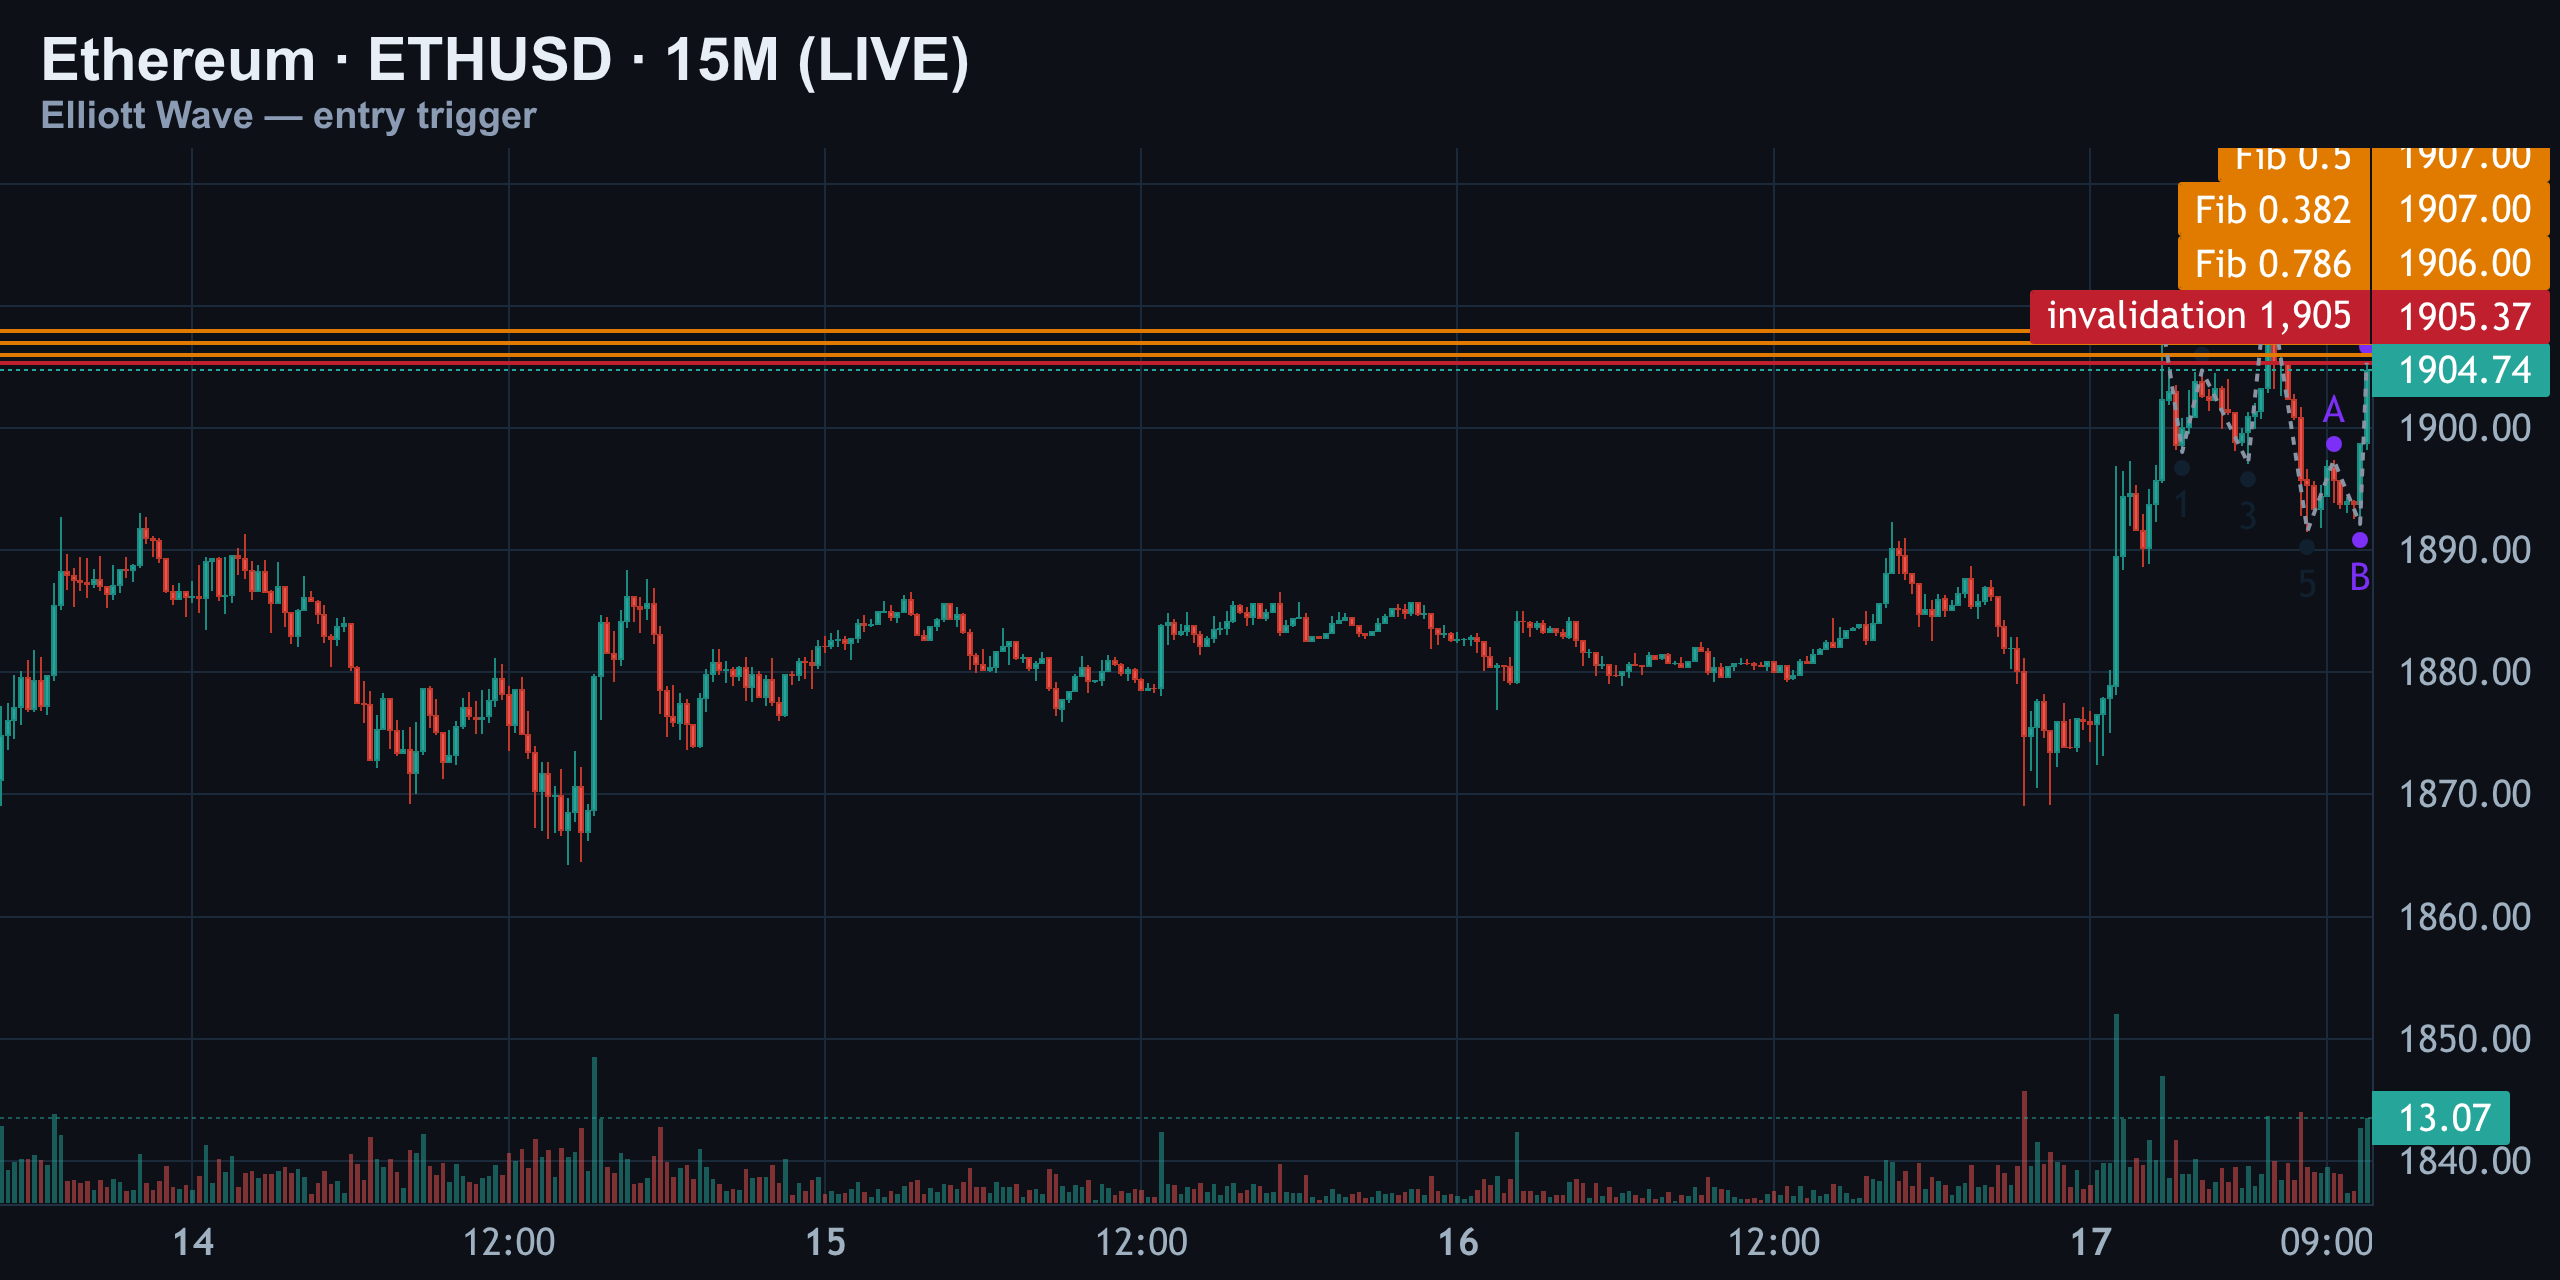
| Fib Level | Price | Note |
|---|---|---|
| 0.382 | ~$1,906 | Cluster zone |
| 0.5 | ~$1,906.5 | Cluster zone |
| 0.786 | ~$1,907 | Cluster zone |
| Tentative invalidation | $1,905.40 | Tight risk |
The Fibonacci swing from $1,905 to $1,909 stacks three levels almost on top of each other — the 0.382, the 0.5, and the 0.786 all cluster between $1,906 and $1,907. That tight cluster is the trigger zone to watch.
The correction into this B-to-C leg shows C running 2.27x the size of A — a stretched, over-extended bounce, the kind that often marks exhaustion rather than a fresh breakout.
- Bearish trigger: rejection wick into $1,906–$1,907 with a failed close above — signals wave C is taking over
- Bullish trigger: 15M candles close and hold above $1,907 with rising volume — first hint the alternate bull scenario is forcing through
Positioning & Order Flow: Does the Market Agree?
Structure is only half the picture. Liquidation clusters show where leveraged positions are stacked, and that tells you where price is likely to get pulled toward — or repelled from — regardless of what the wave count says.
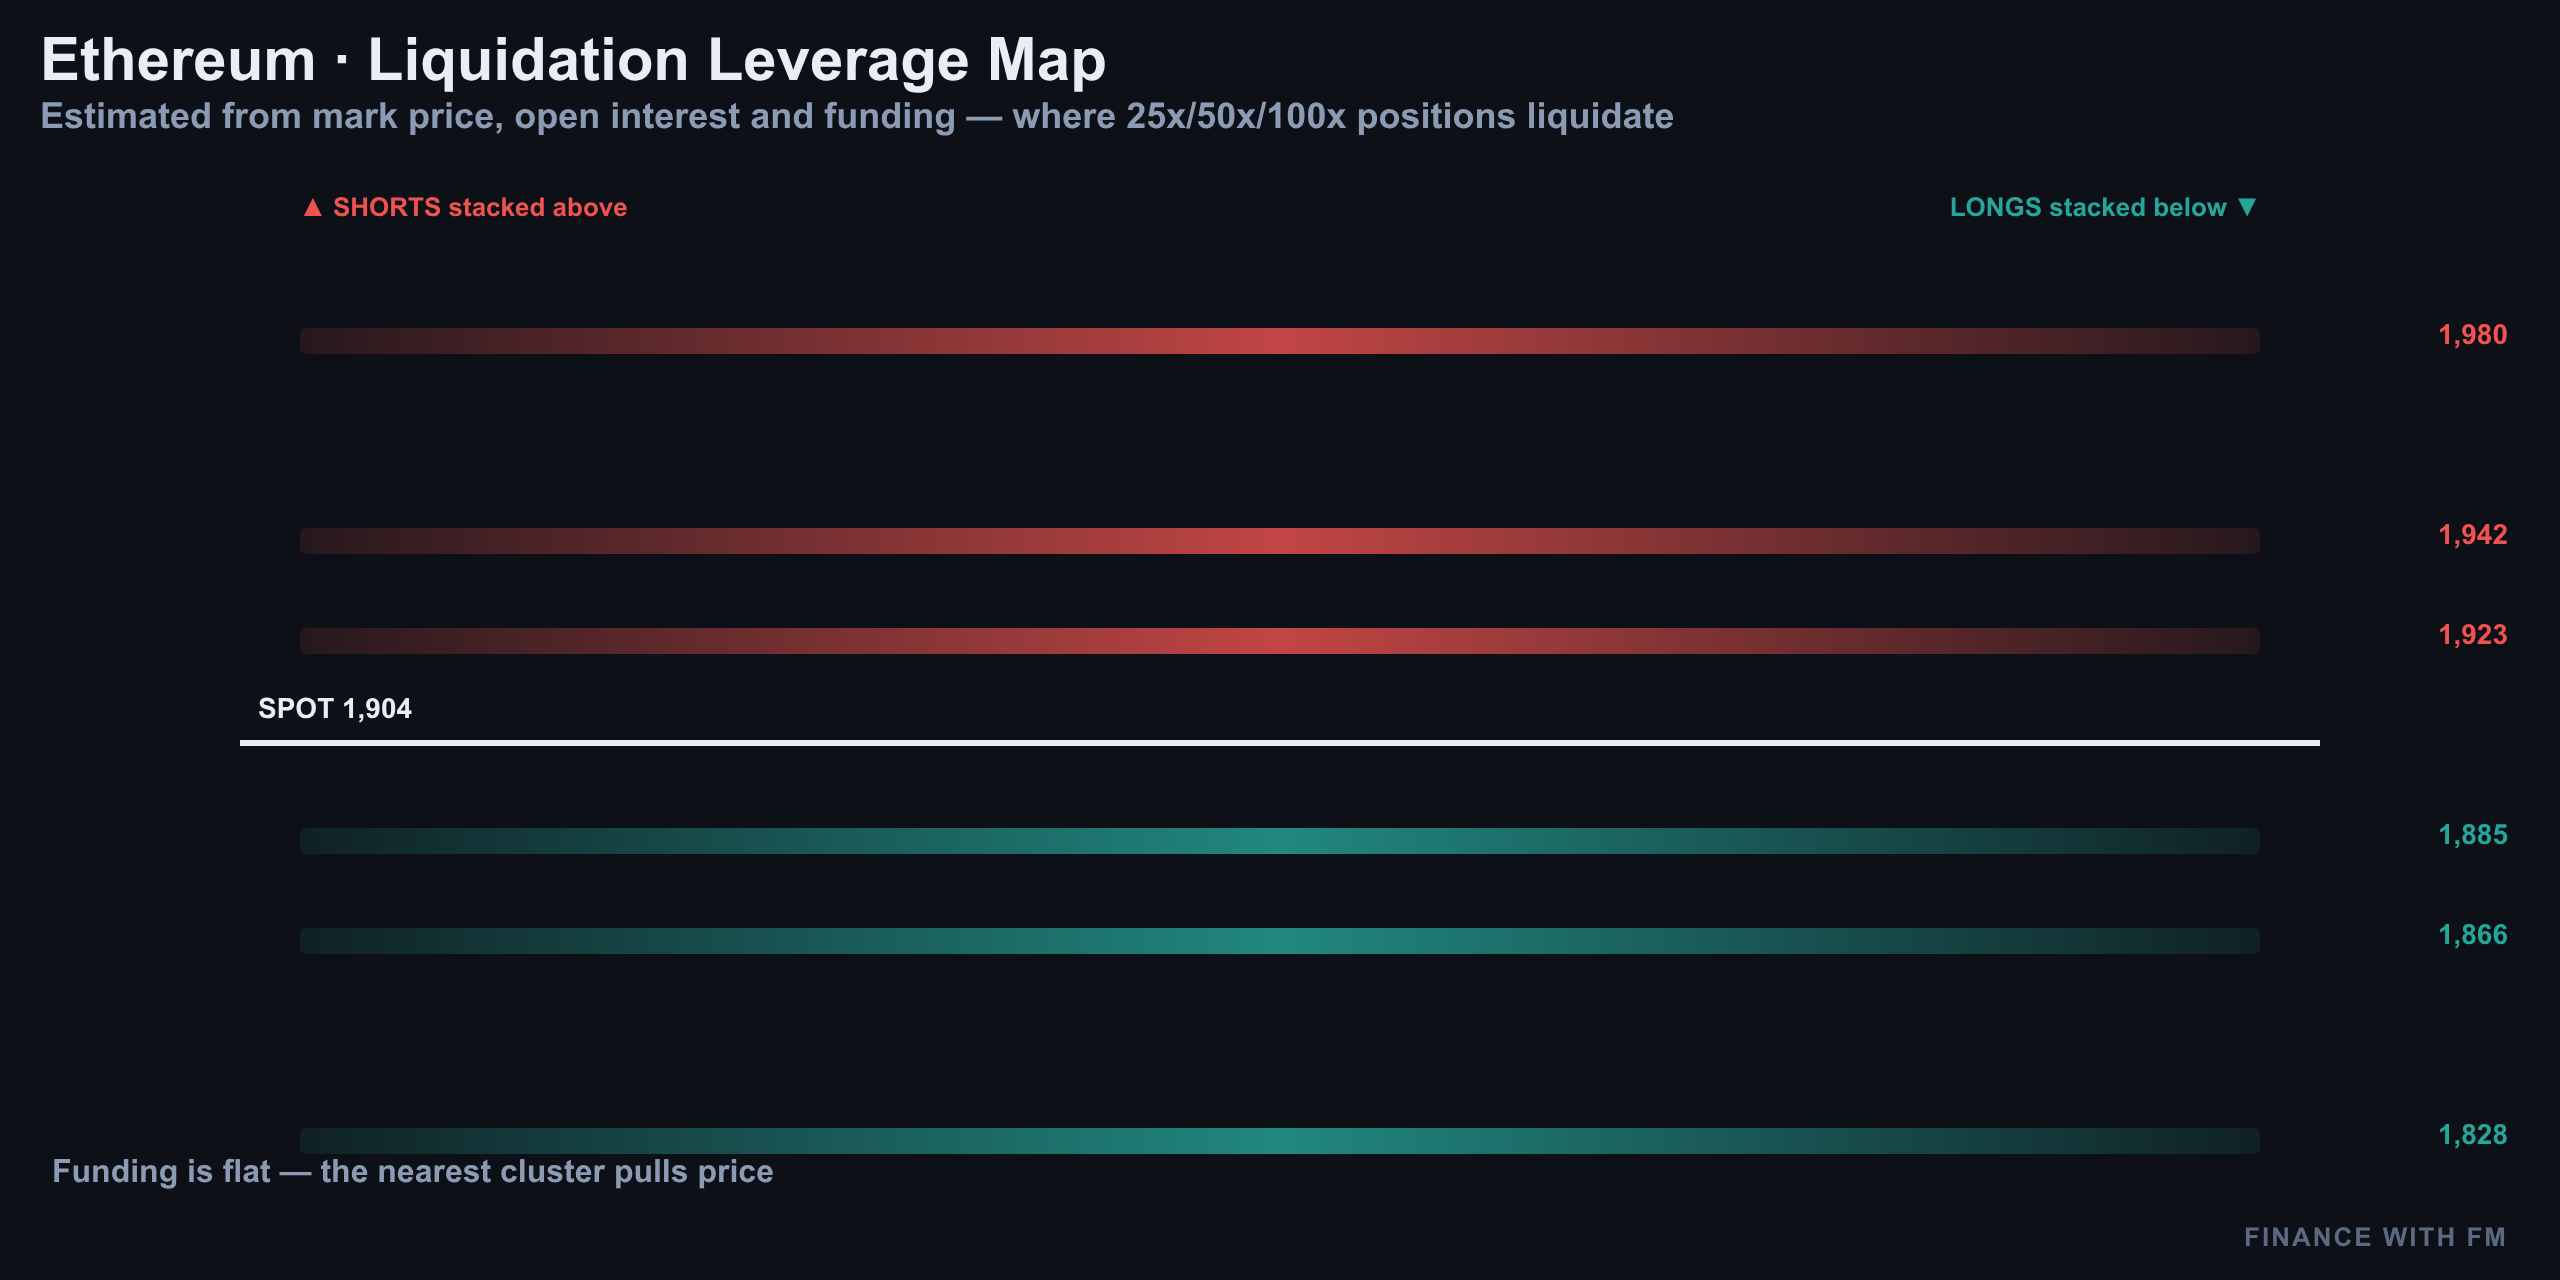
When liquidation density sits heavier above current price than below, it hints that a short squeeze toward the resistance shelf (1,913–1,943) is the path of least resistance before any real reversal — which would actually align with the ending diagonal minor scenario: one more spike up to clear stops before sellers regain control. Conversely, if downside liquidations dominate, that favors the primary B-wave-into-C count playing out with less friction.
Structure vs. Positioning — Do They Agree?
Right now, the structural read (rule-breaking rally, tightened invalidation at 1,913) and the positioning read both lean toward caution on chasing the bounce. Neither is screaming an all-clear for bulls. That alignment is what keeps the bearish bias intact even after a green candle back to $1,906.
Key Levels to Watch
| Level | Price | Significance |
|---|---|---|
| Hard invalidation (bearish count) | $1,943 | Breaks 4H bearish structure entirely |
| Tightened invalidation | $1,913 | Refined ceiling — the wall in play now |
| Secondary resistance | $1,925 | Old line-in-the-sand, now secondary |
| Entry trigger zone | $1,906–$1,907 | 15M Fib confluence — decision point |
| First downside target | $1,888 / $1,881 | 0.382 / 0.5 Fib of B-wave |
| Deeper downside target | $1,863 | 0.786 Fib — wave C objective |
| Untouched lower targets | $1,864 / $1,854 / $1,822 | Still live from prior count |
Watch $1,906–$1,907 first — that's the local trigger. Then watch $1,913 — that's the wall. A clean close and hold above it changes the entire conversation.
Setup Per the Count (Not Advice)
This is the primary path, laid out mechanically — not a trade recommendation. Educational context only.
- Watch for a rejection wick into the $1,906–$1,907 pocket with a failed close above it
- That rejection is the local confirmation that the B-wave bounce is exhausted and wave C can take over
- Downside path: $1,888 → $1,881 → $1,863, with $1,864/$1,854/$1,822 remaining as the larger untouched targets
- Invalidation for the short thesis: a 15M close and hold above $1,913, followed by a push through $1,925 and $1,943
- If that invalidation triggers, shift focus toward an expanded flat resolving bullish or a resumption toward $1,956 and $1,981
Where Every Coin Sits in Its Count — And the Bottom Line
Ethereum isn't trading in isolation. Broader crypto majors have been chopping through similar corrective structures in recent weeks as the market digests the mid-summer pullback from cycle highs. For ETH specifically, the story right now is simple: a rule-breaking bounce has pushed price into a wall at 1,913, and until that wall breaks with conviction, the path of least resistance according to the count is still down toward the wave C targets.
| Scenario | Trigger | Target |
|---|---|---|
| Primary — B-wave top | Rejection at $1,906–$1,913 | $1,888 → $1,863 → $1,822 |
| Alternate — Bull reclaim | Close & hold above $1,913, then $1,925/$1,943 | $1,956 → $1,981 |
| Minor — Ending diagonal fake-out | Brief spike above $1,913 that fails | Resolves lower after the spike |
The bias stays bearish for now, but the lines are sharper than they were yesterday. Ethereum's near-term fate comes down to a tight band of price — roughly $1,906 to $1,913 — and how it behaves there over the next several candles will likely decide which of these three paths plays out.
More on Ethereum: elliott wave · technical analysis
Analysis and education, not investment advice. See our editorial policy.