Daily market analysis
Plian (PI) technical analysis today
Last updated
PI Price Today: Wedge Snaps, Short Still Loaded (Aug 10)
Where We Left It: Yesterday's Short Is Still Alive
Before diving into today's chart, let's settle the scorecard. Yesterday's short call from the $0.0929 zone hasn't hit its stop and hasn't hit its target — it's simply doing what a well-placed trade is supposed to do. Price has drifted roughly 1.7% lower over the past day, from around $0.0899 down to today's spot near $0.0885, according to current market data from CoinMarketCap and CoinGecko.
| Item | Level | Status |
|---|---|---|
| Entry | $0.0929 | Filled |
| Stop-Loss | $0.0951 | Not hit |
| Target | $0.0864 | Not hit |
| Current Price | ~$0.0885 | In favor, -1.7% (24h) |
PI Price Today: The Big Picture
PI is trading around $0.0885 as of this update, down roughly 1.5–2% on the day depending on the exchange feed — Crypto.com has it at $0.08801 (-1.87%), while Kraken shows $0.088 (-1.50%). The spread between venues is small, which tells you liquidity is thin but not chaotic — this is a token trading on technical structure right now, not on panic.
Structure is still a falling wedge on both the intraday and the 4-hour timeframes. Price is compressing directly under the $0.089 shelf, and momentum is turning neutral-to-improving even as price keeps grinding lower. That tension — softer momentum inside a still-lower structure — is the entire story of today's session.
- Bias: Bearish while price holds below resistance
- Structure: Falling wedge, both 15-min and 4H
- Momentum: Neutral RSI, mildly positive MACD
- Active trade: Yesterday's short still live, still in profit
15-Minute Intraday: Wedge Compression
Zoom into the 15-minute chart and PI has been carving a textbook falling wedge since the overnight session. Price rallied into the $0.091 zone twice and got rejected both times, then slid back toward $0.0885. The tell is in the volume: the sharpest spikes are sitting on red candles, meaning sellers are stepping in on strength, not buyers stepping in on weakness.
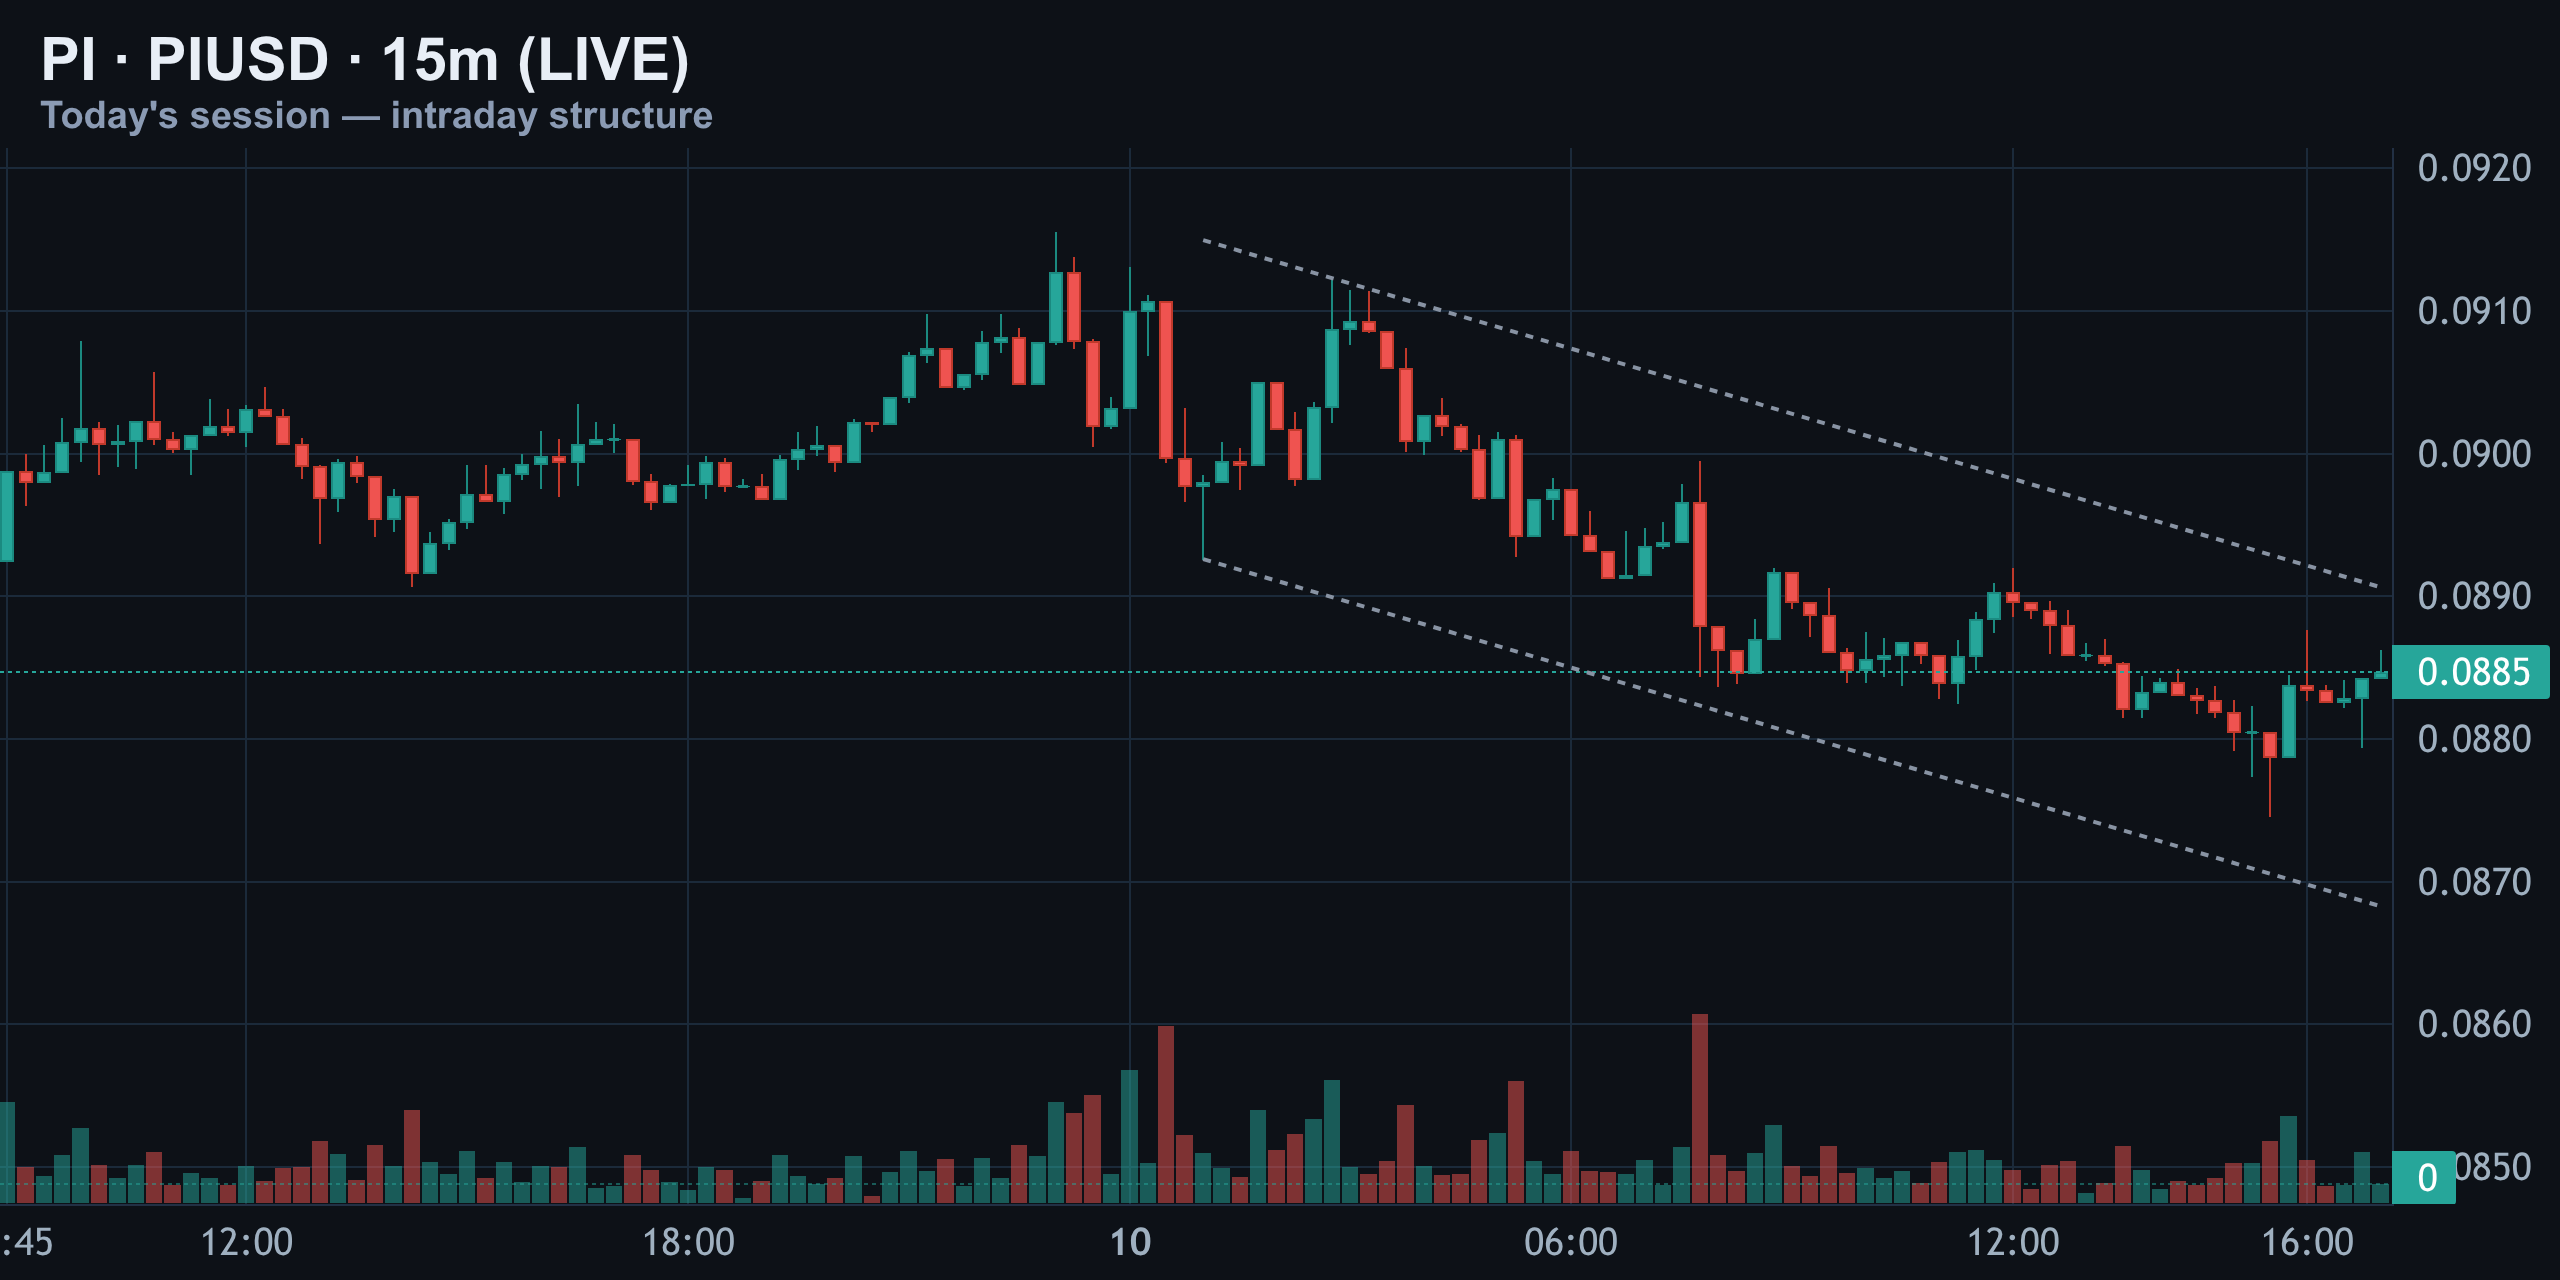
This is classic distribution behavior inside a shrinking range — the kind of setup that tends to resolve with a sharp move once the wedge apex is reached. In plain terms: PI keeps bouncing between shrinking highs and lows, waiting to break one way, and the volume signature currently favors the downside break.
4-Hour Structure: Rising Channel Meets Reality
Pull back to the 4-hour chart and the bigger picture is a rising channel that carried PI from a low near $0.070 in late July up toward the $0.095 spike just a few days back. That spike got sold hard, and price is now back-testing the channel's midline around $0.0885.
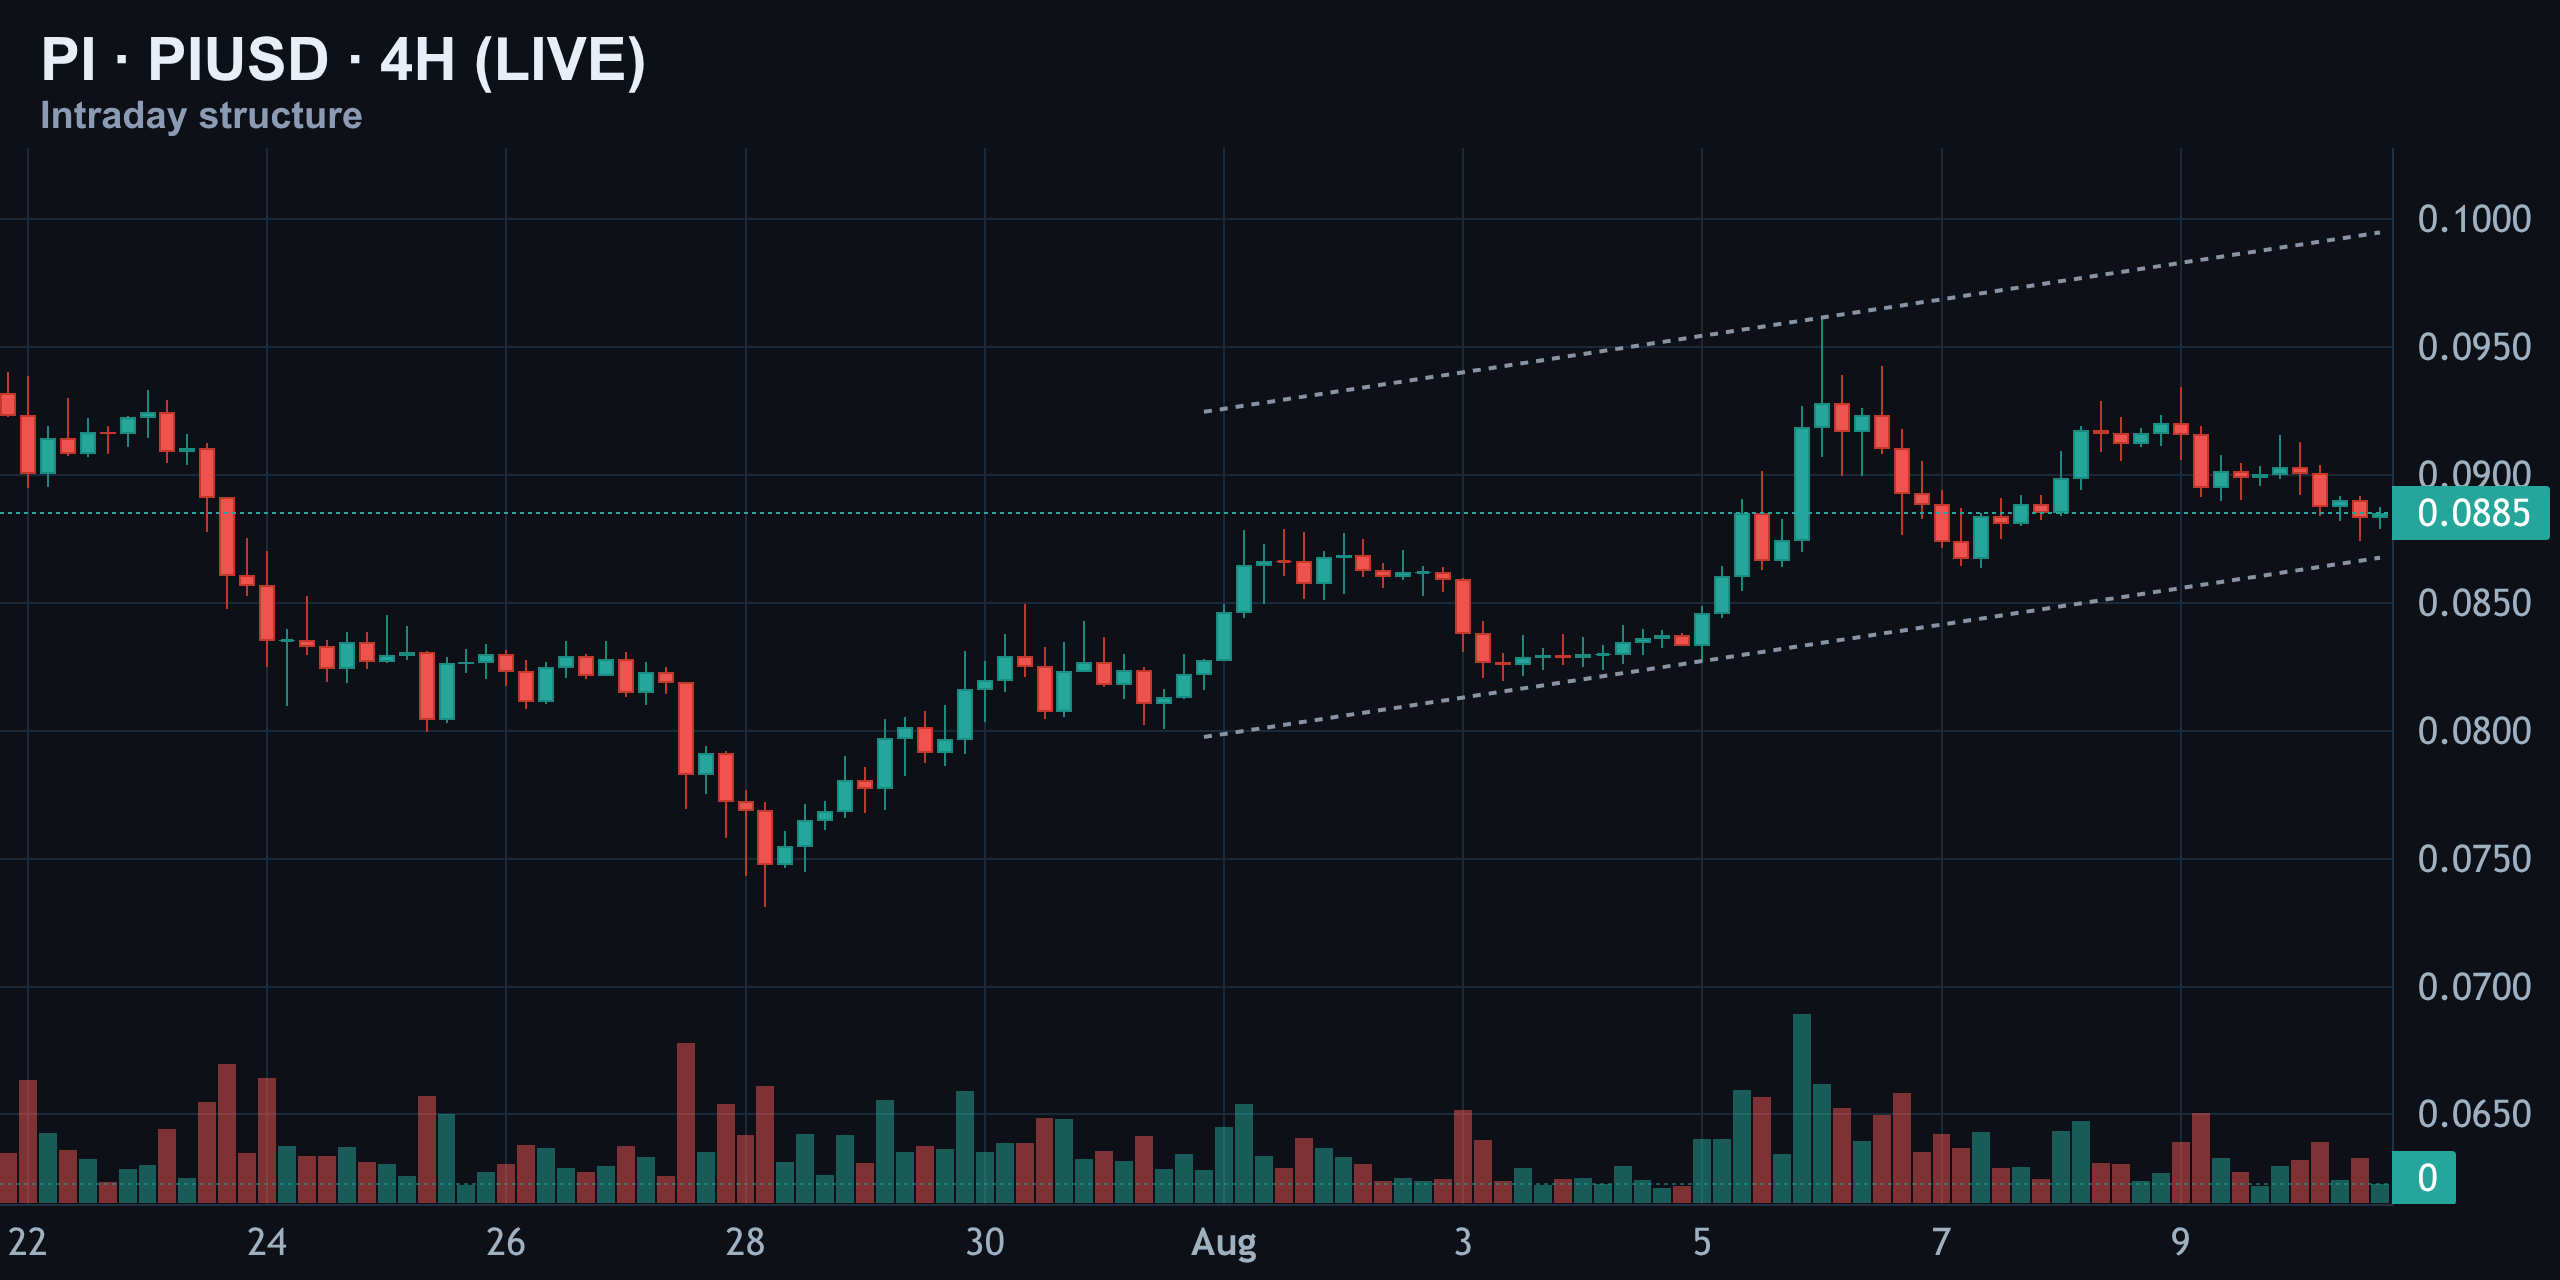
The channel itself is still technically intact, but every swing high since early August has gotten weaker. If the lower rail of this channel gives way, that's the 4-hour timeframe confirming exactly what the 15-minute wedge is already hinting at. Translation: the medium-term uptrend is alive but losing steam fast.
Daily Chart: Trapped Between Two Walls
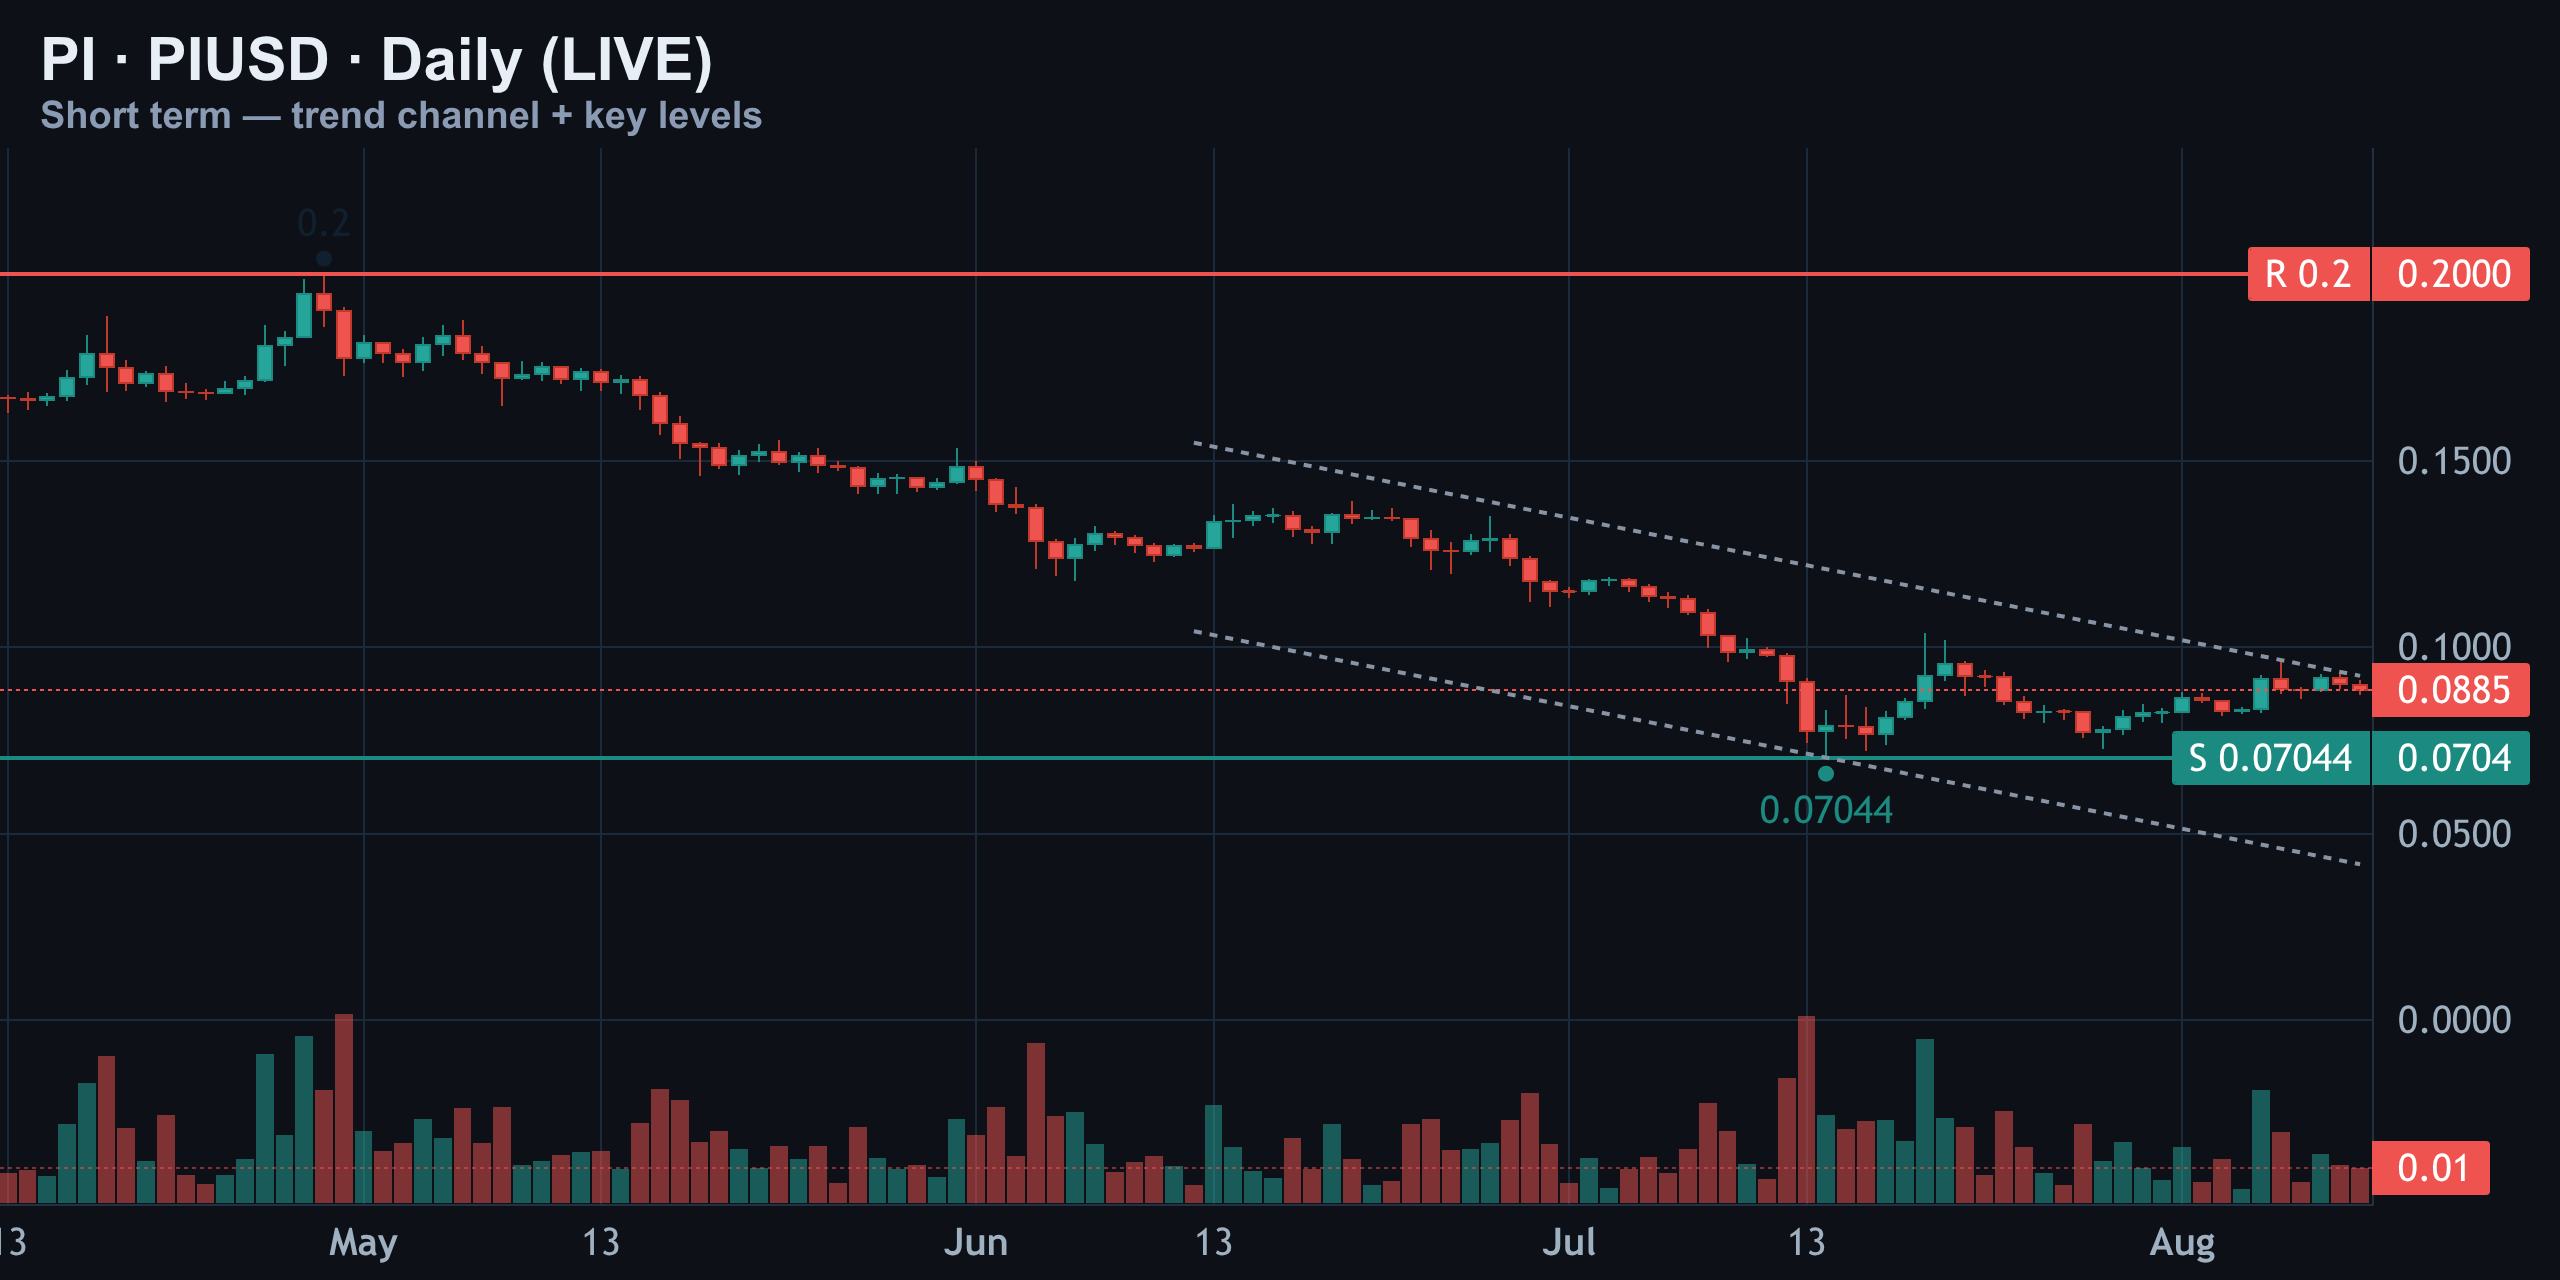
Step back further to the daily chart and PI is still trapped inside a much larger descending channel that's been in force since May. The token bounced hard off the $0.07044 low in mid-July, but that bounce has now stalled right against the channel's upper boundary.
| Level Type | Price | Relevance |
|---|---|---|
| Macro Floor | $0.07044 (mid-July low) | Bounce origin |
| Current Battle Zone | $0.08 – $0.09 | Where price is stuck now |
| Macro Ceiling | $0.20 (April high) | Distant, not relevant today |
That $0.20 level hasn't been touched since April and isn't relevant to today's move — the real fight is happening right here, in the eight-to-nine-cent zone. In plain terms: PI is stuck fighting the top of a months-long falling channel.
Momentum Check: RSI Divergence and a Fading MACD
RSI (14): Neutral, But Watch The Divergence
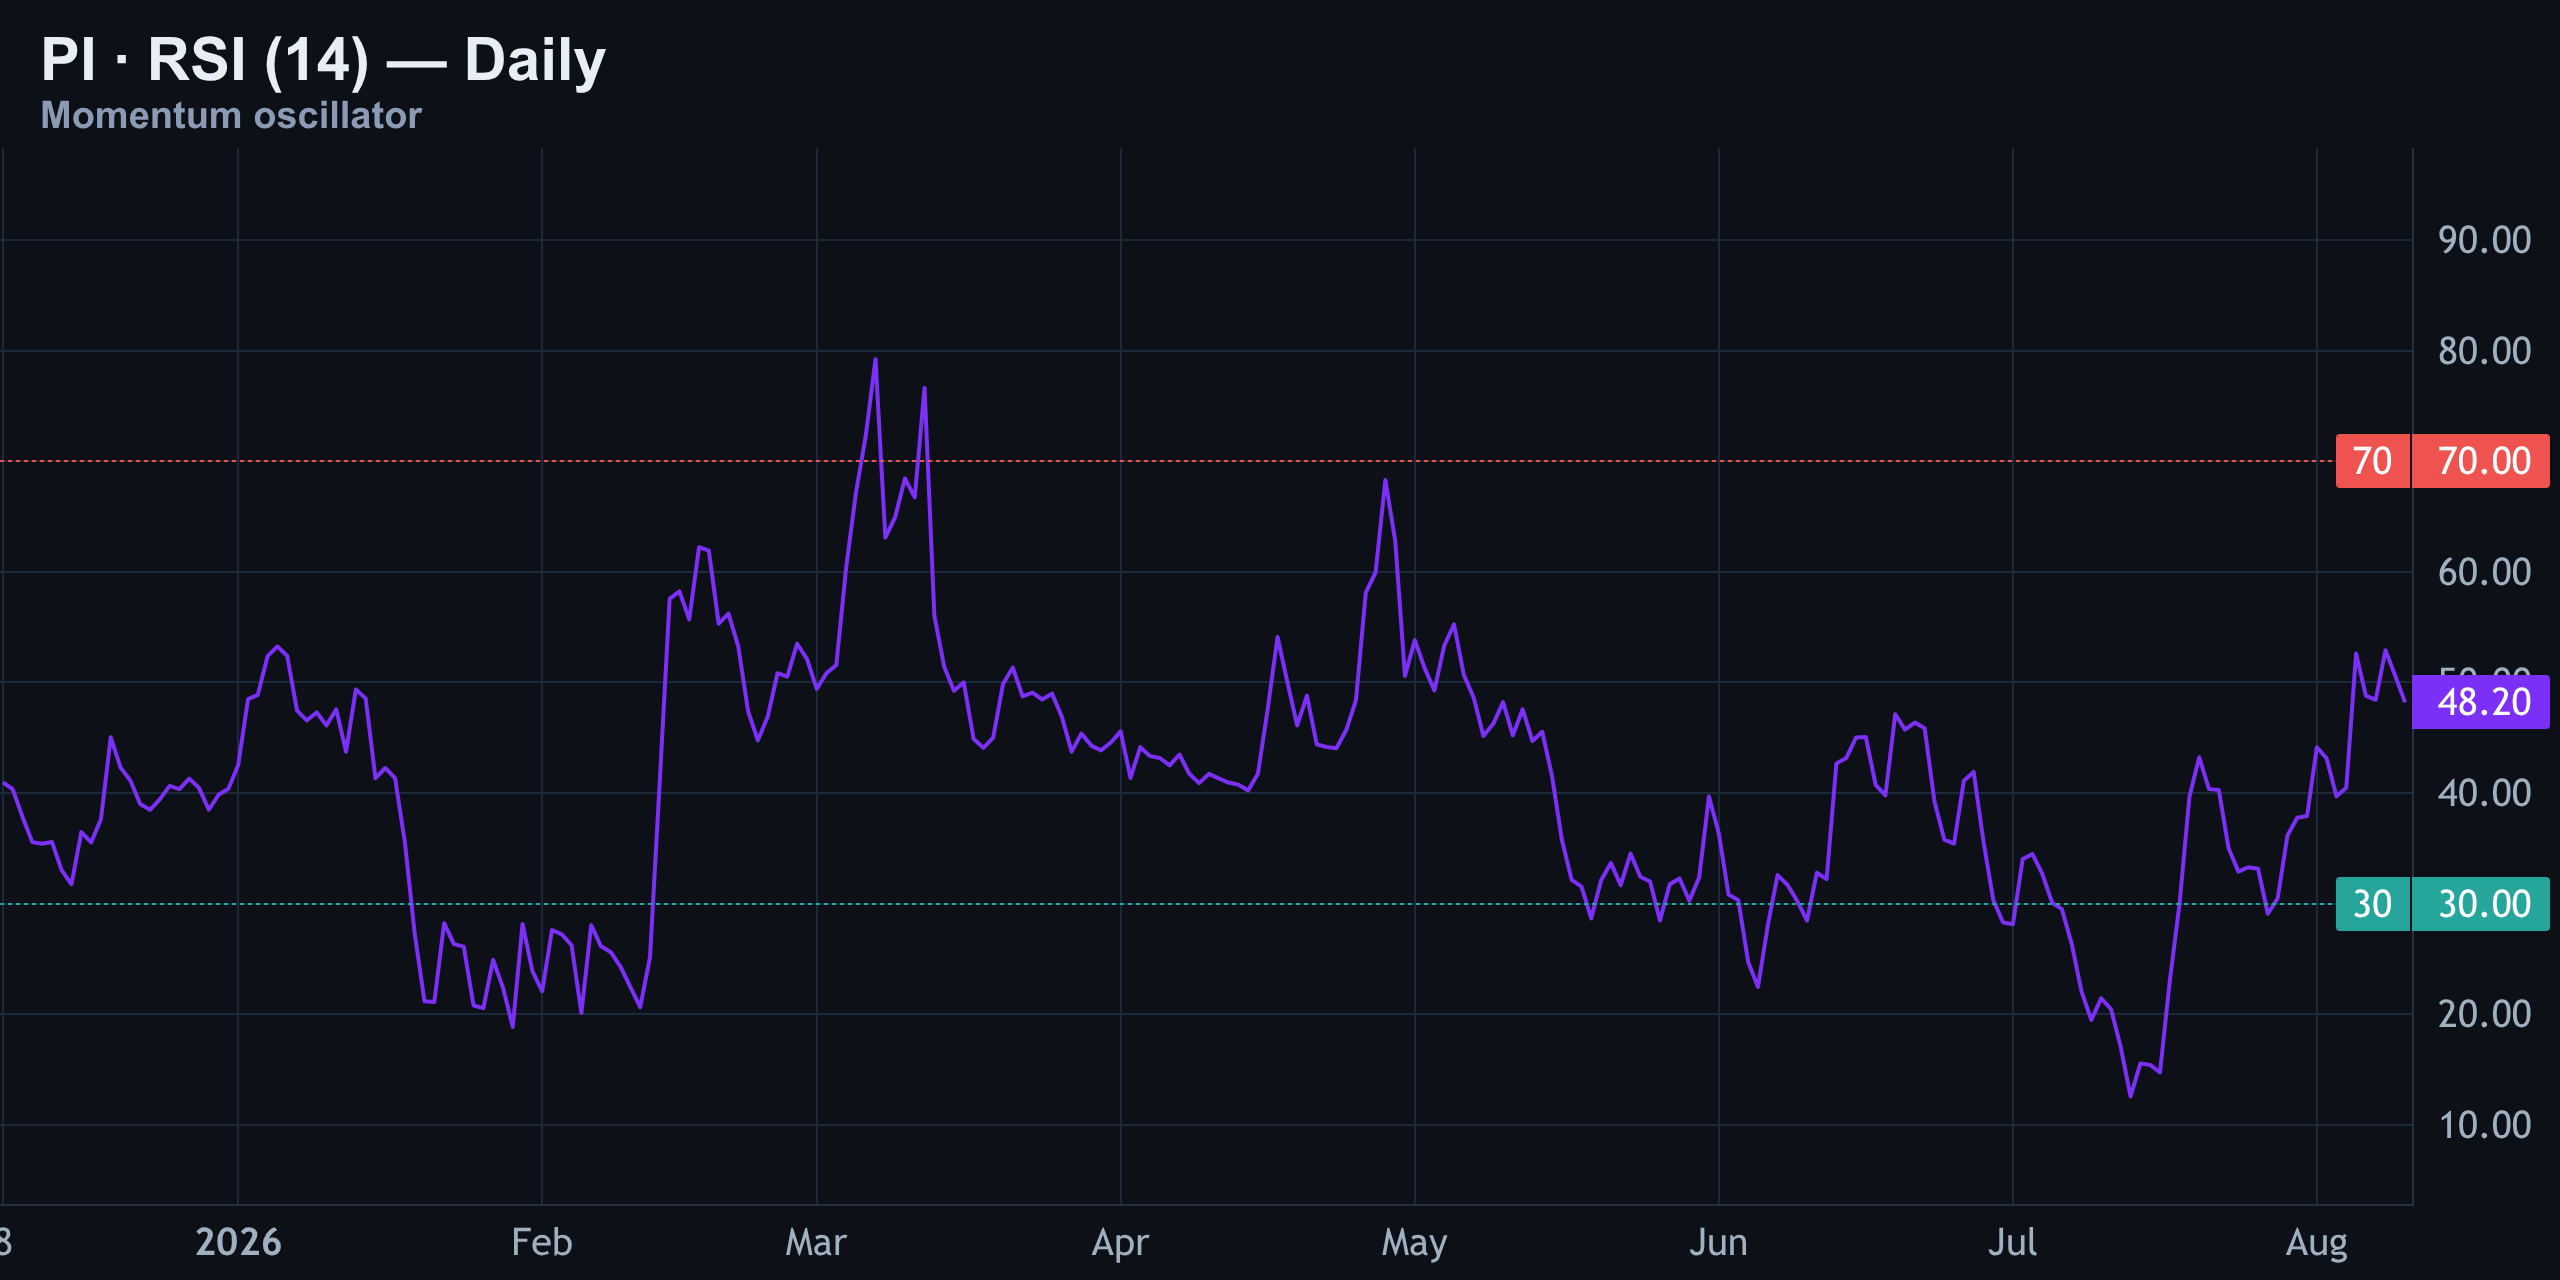
The daily RSI reads 48 right now — about as neutral as this indicator gets. No oversold bounce case, no overbought exhaustion case. What's worth flagging is that RSI ticked up slightly even as price made a fresh lower low this session. That's a mild divergence, but not the bullish kind traders usually cheer — in a downtrend, this pattern often just means selling is losing speed, not that buyers are taking control.
MACD: Bulls Have The Edge For Now
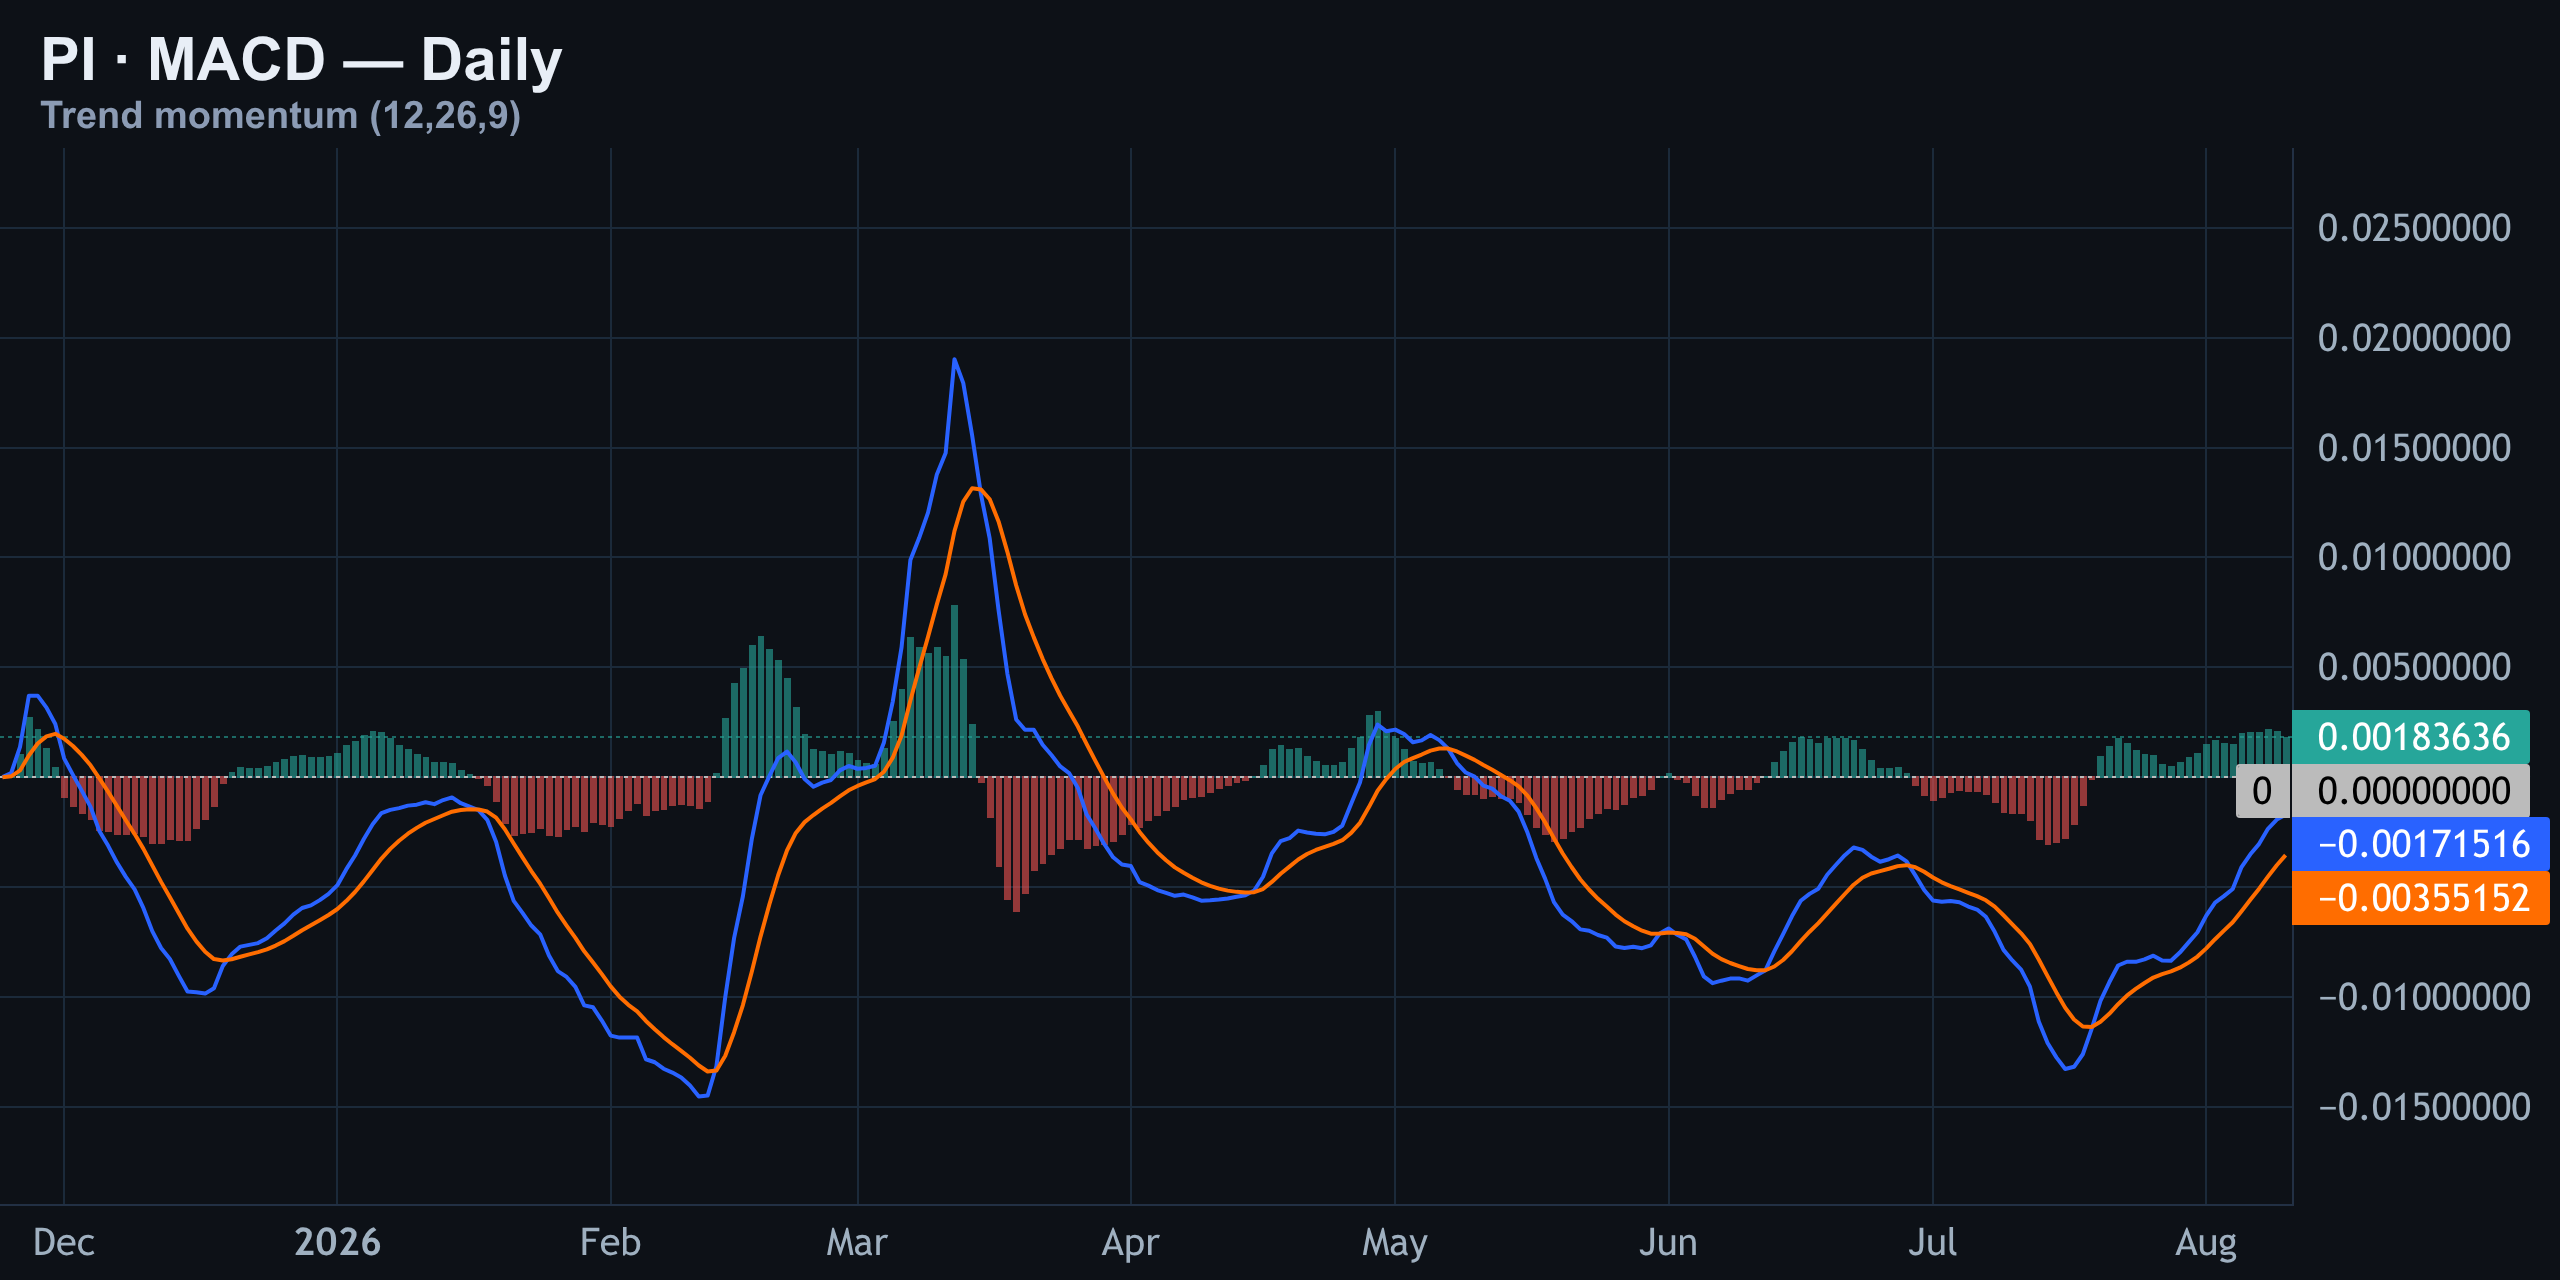
The MACD is technically bullish right now — the MACD line sits above the signal line and the histogram is positive. On paper, that's a green light. But look at the size of that bar: it's tiny compared to the surges seen back in March and May. Every positive cross since June has faded within a handful of days once price hit resistance.
Today's Drivers: Why It's All Technical, No Headlines
There's no PI-specific headline driving today's move. The news flow is dominated by Bitcoin stories — Strategy selling over 1,600 BTC to raise capital, and a large whale opening a $14 million long on Monero through Hyperliquid — none of which touch PI directly.
That likely means today's PI price action is almost entirely technical and flow-driven rather than news-driven, which actually makes the chart levels covered above more reliable than usual — there's no headline noise to override the structure.
The Trade Plan: Short Setup, 1:2.5 Risk-Reward
Here's the computed setup based on everything above. This is a short, built off the wedge-rejection-plus-channel-resistance confluence.
| Parameter | Level |
|---|---|
| Current Price | ~$0.0885 |
| Entry Trigger | $0.0895 |
| Invalidation (4H close above) | $0.0923 |
| Target | $0.0824 |
| Risk:Reward | ~1:2.5 |
Entry triggers on a move back up to $0.0895. The setup is invalidated on a 4-hour close above $0.0923 — that's the single level that kills the trade completely. Target sits at $0.0824. Zoomed way out, the $0.0704 zone from mid-July remains the macro floor, while $0.20 up near April's high is the distant ceiling — not relevant to today's trade, just context for the bigger picture.
Previous days
08/09/2026 — PI Daily Pulse Aug 9: Wedge Loaded, Short Still Alive
PI Daily Pulse Aug 9: Wedge Loaded, Short Still Alive
Where We Left It: Yesterday's Short Is Still Live
Quick scorecard before we dive into the charts. Since yesterday's call, PI has slipped roughly 1.9%, moving from about 9.2 cents down to roughly 8.99 cents. Right now PI is changing hands around $0.0897–$0.0901 depending on the exchange, with 24-hour volume sitting in the $6–9 million range across major venues.
The short from yesterday's Daily Pulse — entered near 9.29 cents, targeting 8.64 cents — is still open and still tracking in the right direction. It hasn't hit target yet, and it hasn't been stopped out. No change to the thesis here: price is simply grinding closer to the target zone, one candle at a time.
PI Right Now: The Big Picture
PI is trading right around 9 cents, printing about $0.0901 on the daily reference line after a roughly 1.99% pullback over the last 24 hours, according to live pricing from Kraken and Crypto.com. Momentum is flat-out neutral — RSI sitting at 50, MACD only just flipping positive.
Structurally, price is boxed inside a falling wedge on both the 15-minute and 4-hour charts. Until PI reclaims the top of that wedge, the path of least resistance still points down. That's the core tension driving today's Pulse: is this coiling action a springboard for a bounce, or just a pause before the next leg lower?
| Metric | Value |
|---|---|
| Current Price | ~$0.0897 – $0.0901 |
| 24h Change | -1.9% to -2.0% |
| 24h Volume | $6M – $9M |
| RSI (14, Daily) | ~50 (neutral) |
| MACD | Barely bullish cross |
15-Minute Chart: The Wedge Is Squeezing
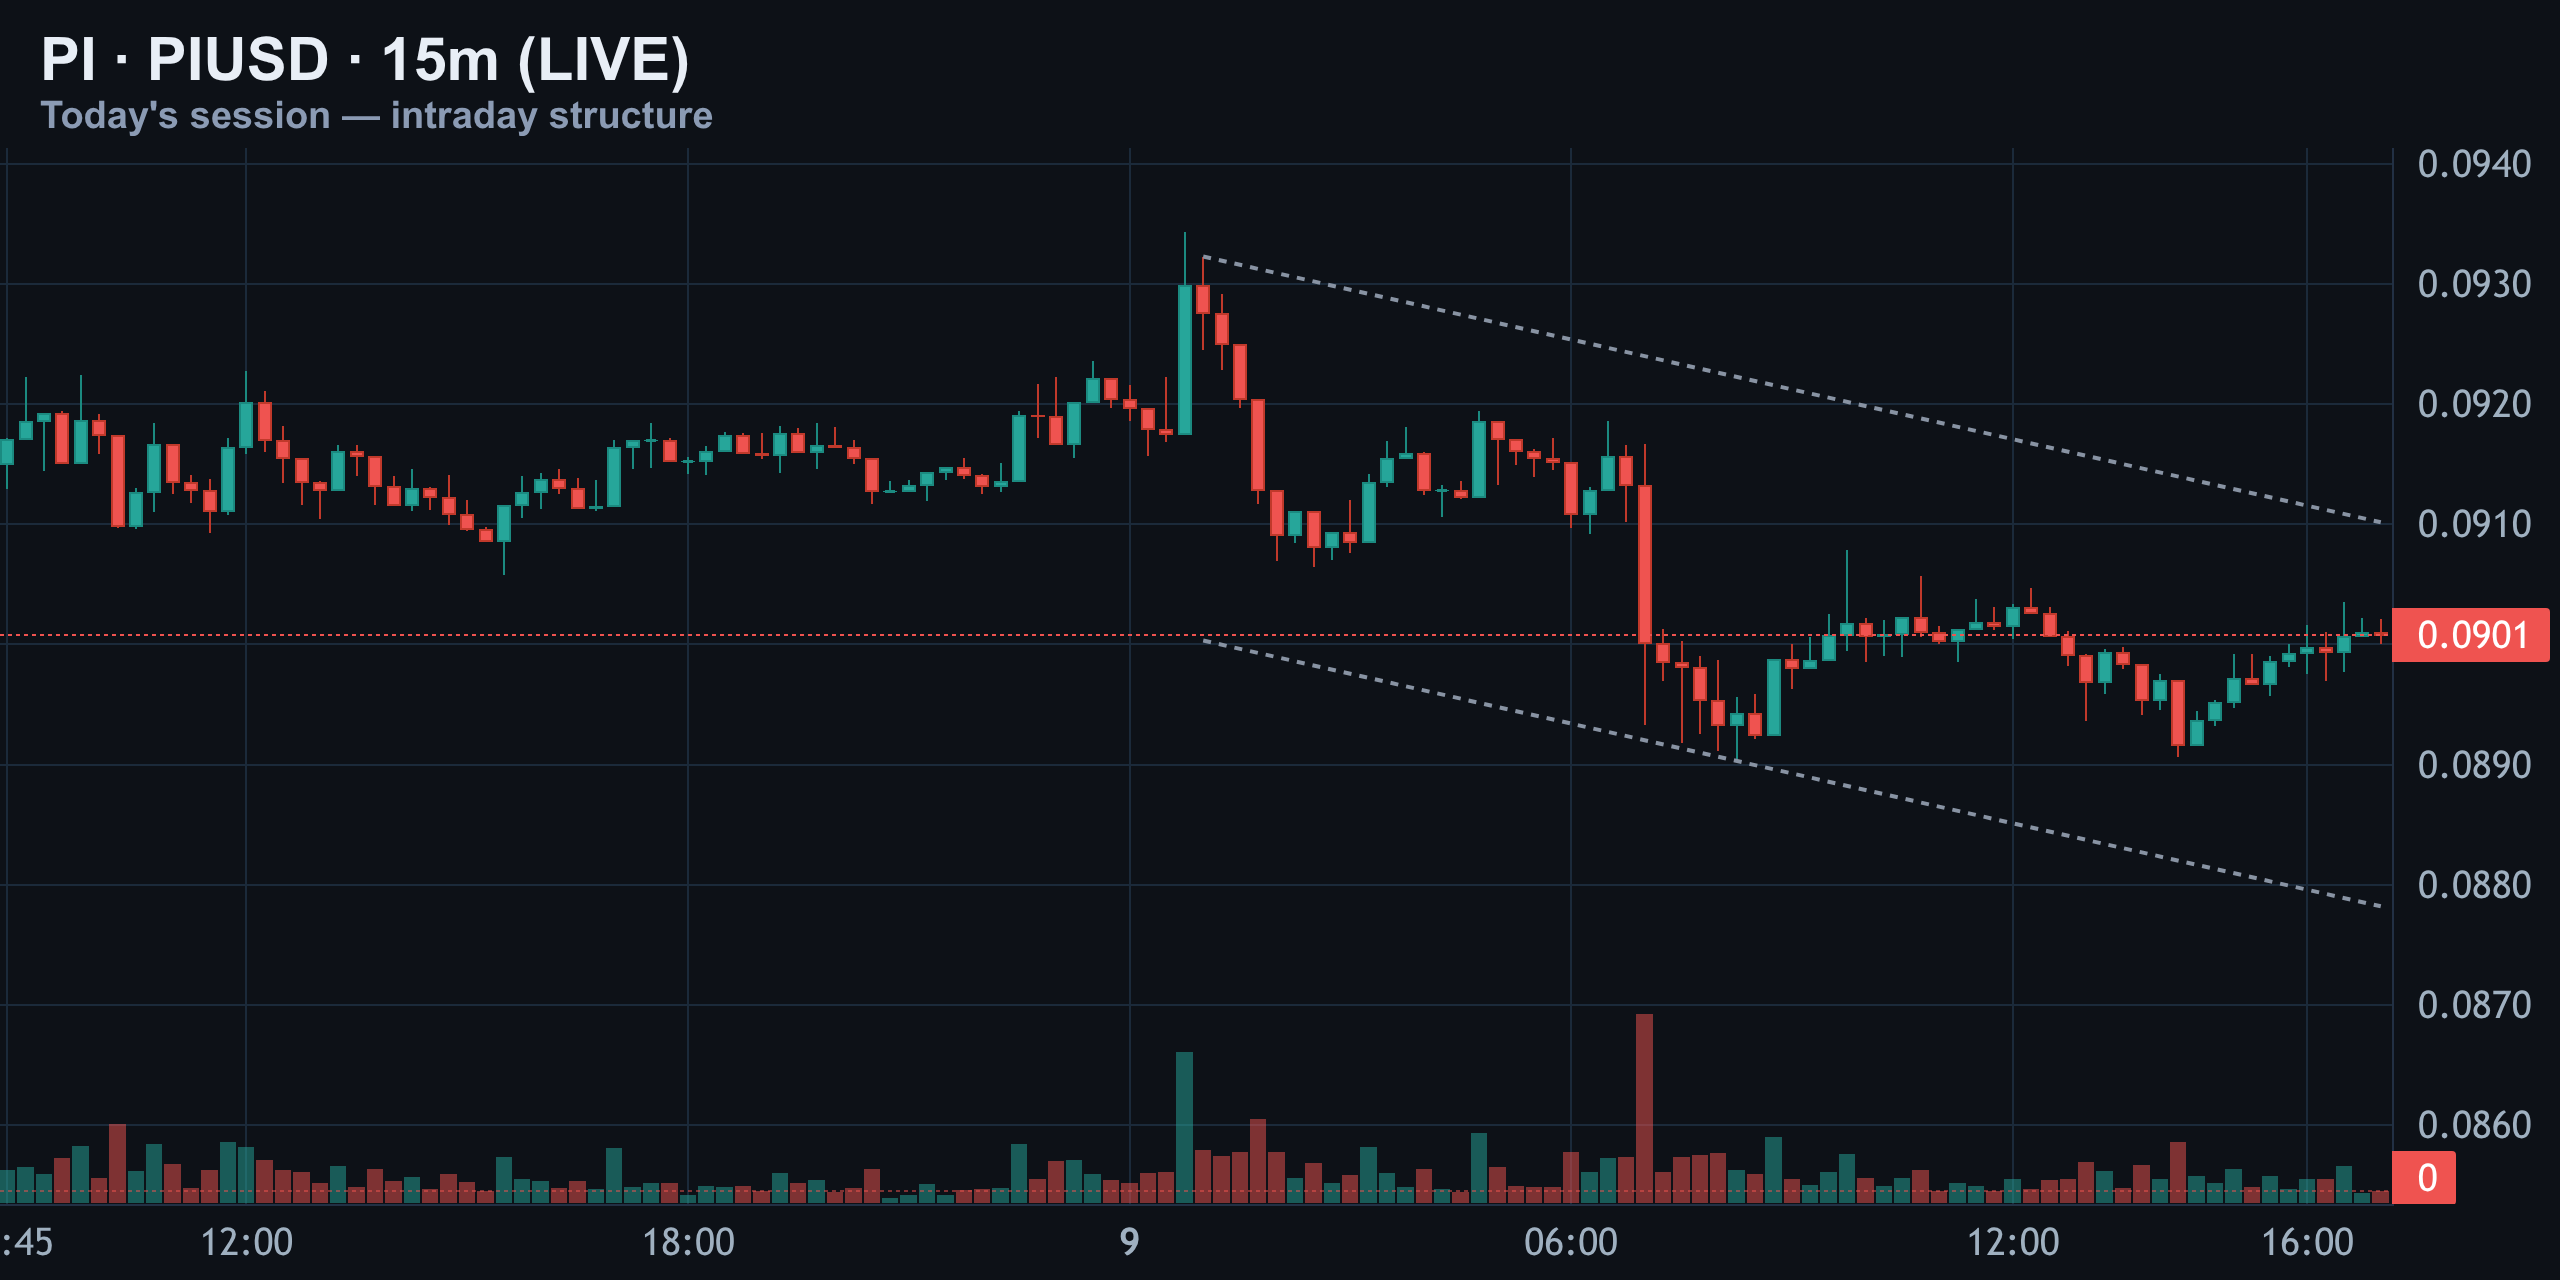
Zoom into the 15-minute chart and you can see PI got rejected twice near the $0.0930 area, right where the descending wedge top sits. That rejection triggered a sharp flush down to around 9 cents, and it came on a real volume spike — not just noise.
Since then, price has been chopping sideways just under the 9-cent mark, coiling between the two dashed wedge lines. The range is getting tighter by the hour, which usually signals a decisive move is close — in either direction.
4-Hour Chart: Rising Channel Meets Resistance
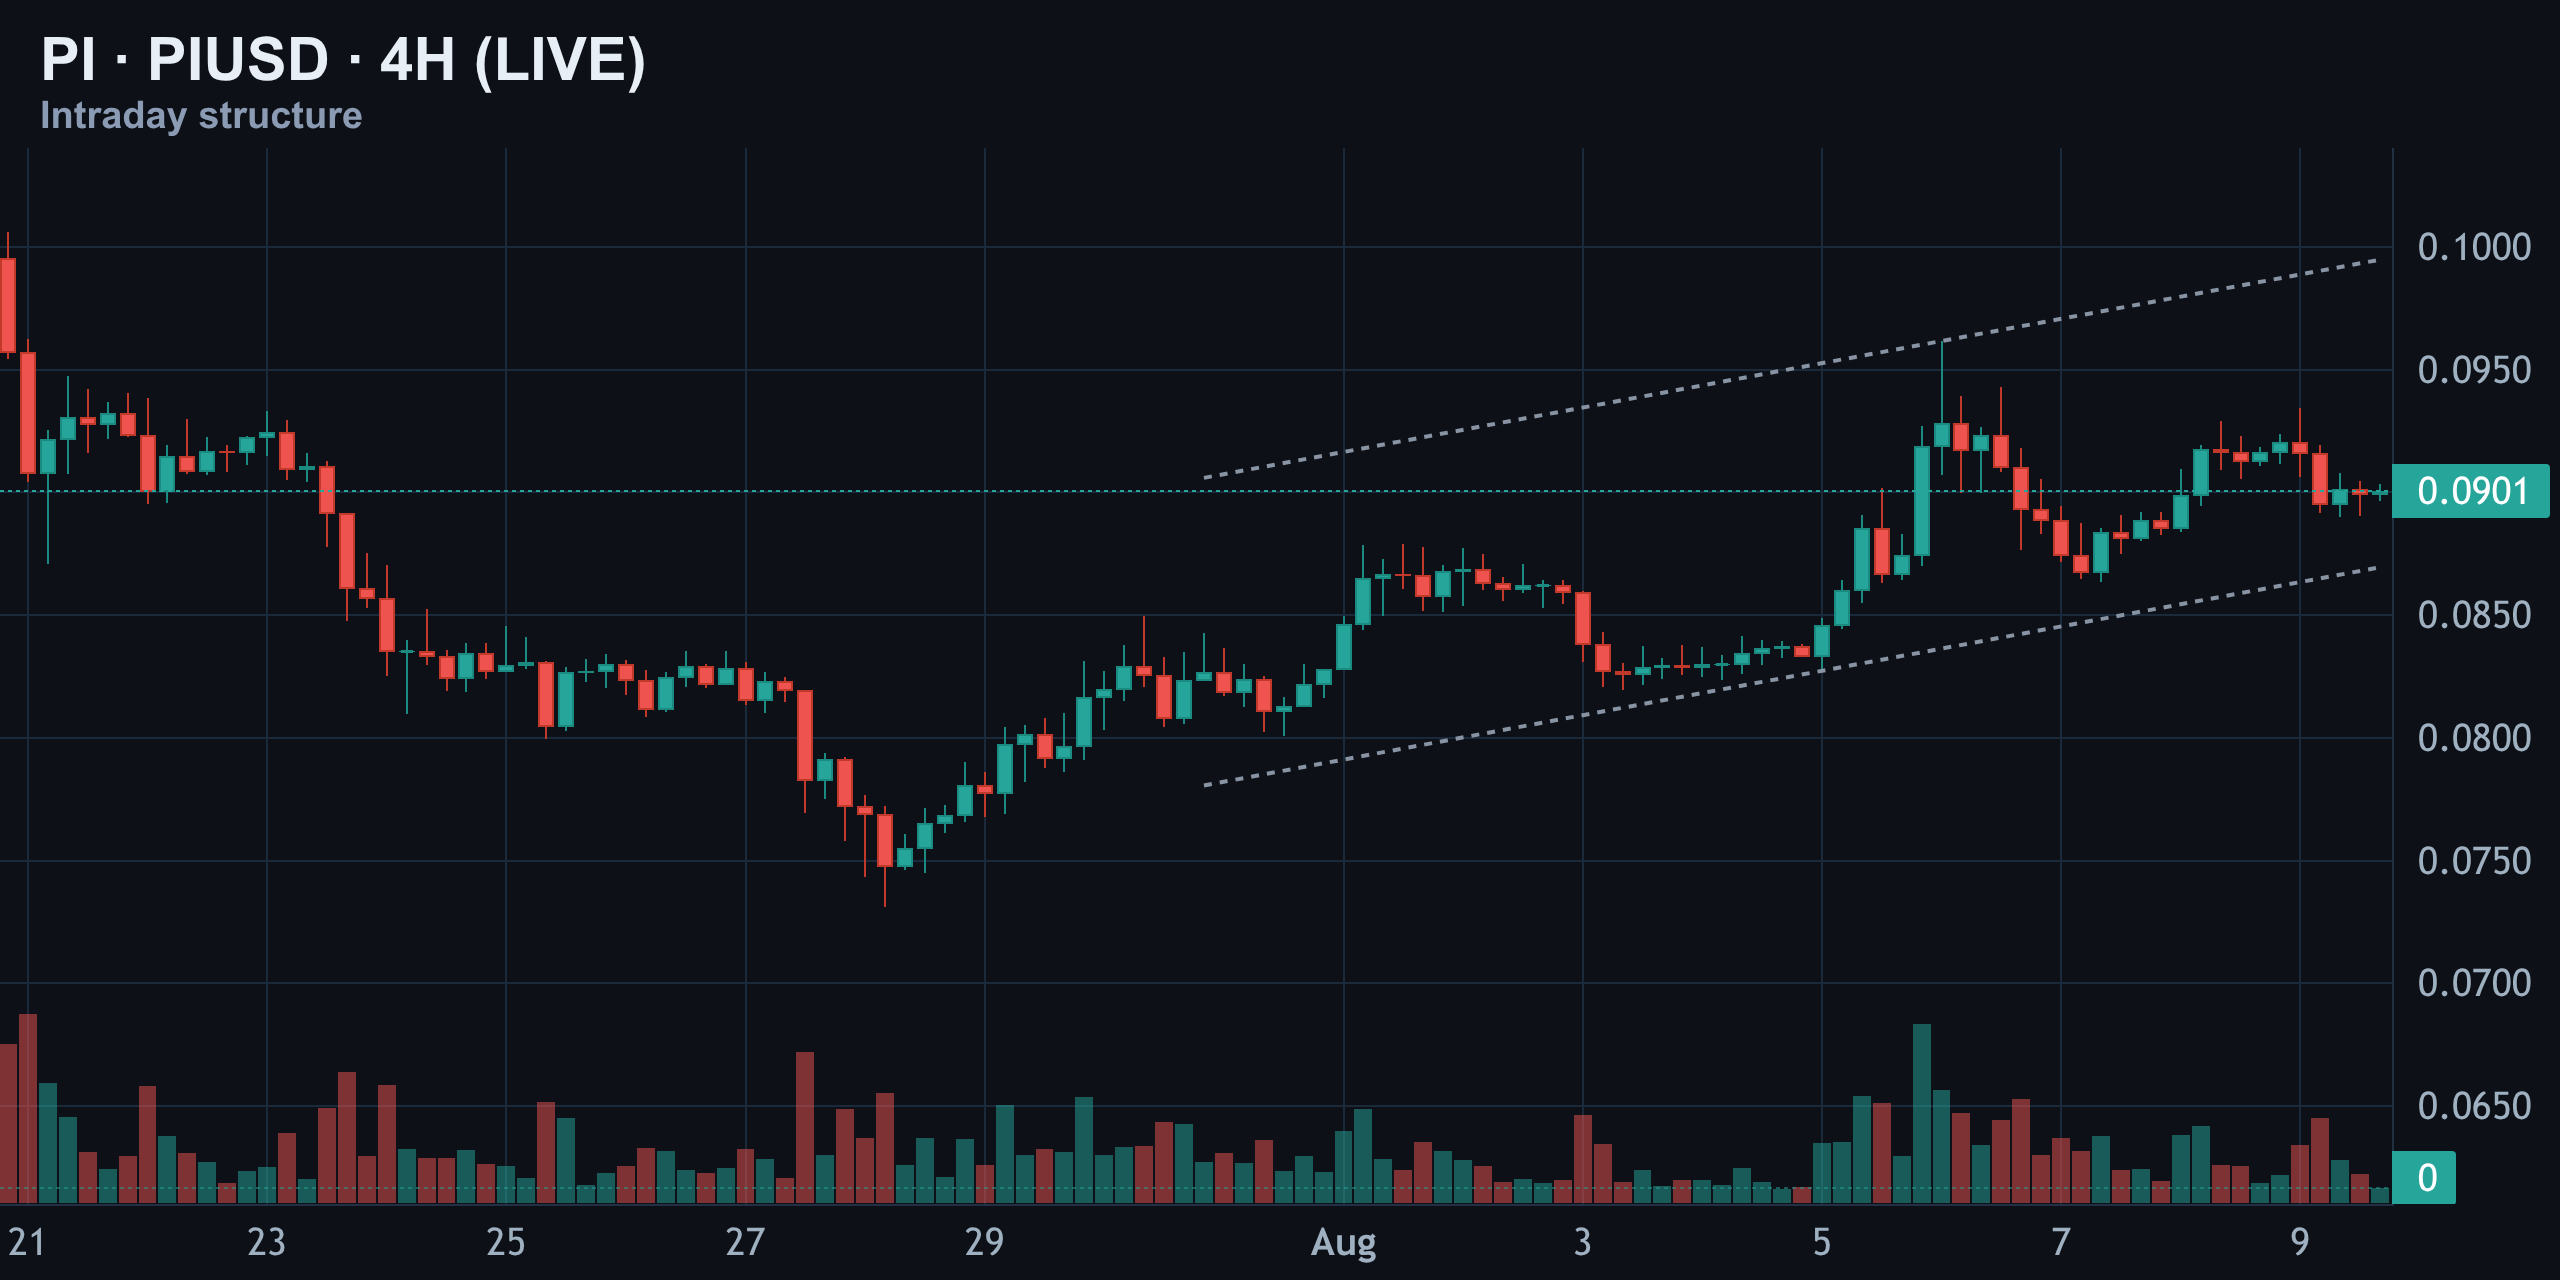
Step back to the 4-hour chart and the bigger picture shows PI climbing inside a rising channel since the late-July low near 7 cents. That channel top got tagged earlier this week just under 10 cents, and price has since pulled back toward the channel's midline.
Right now PI is hovering close to 9 cents, sitting right in the middle of that channel. Whether it holds the middle or slides toward the lower rail near 8.5 cents is the key 4-hour question for today's session.
In plain terms: PI is stuck in the middle of a multi-day rising price channel, with neither buyers nor sellers fully in control yet.
Daily Chart: Wedge Inside the Range
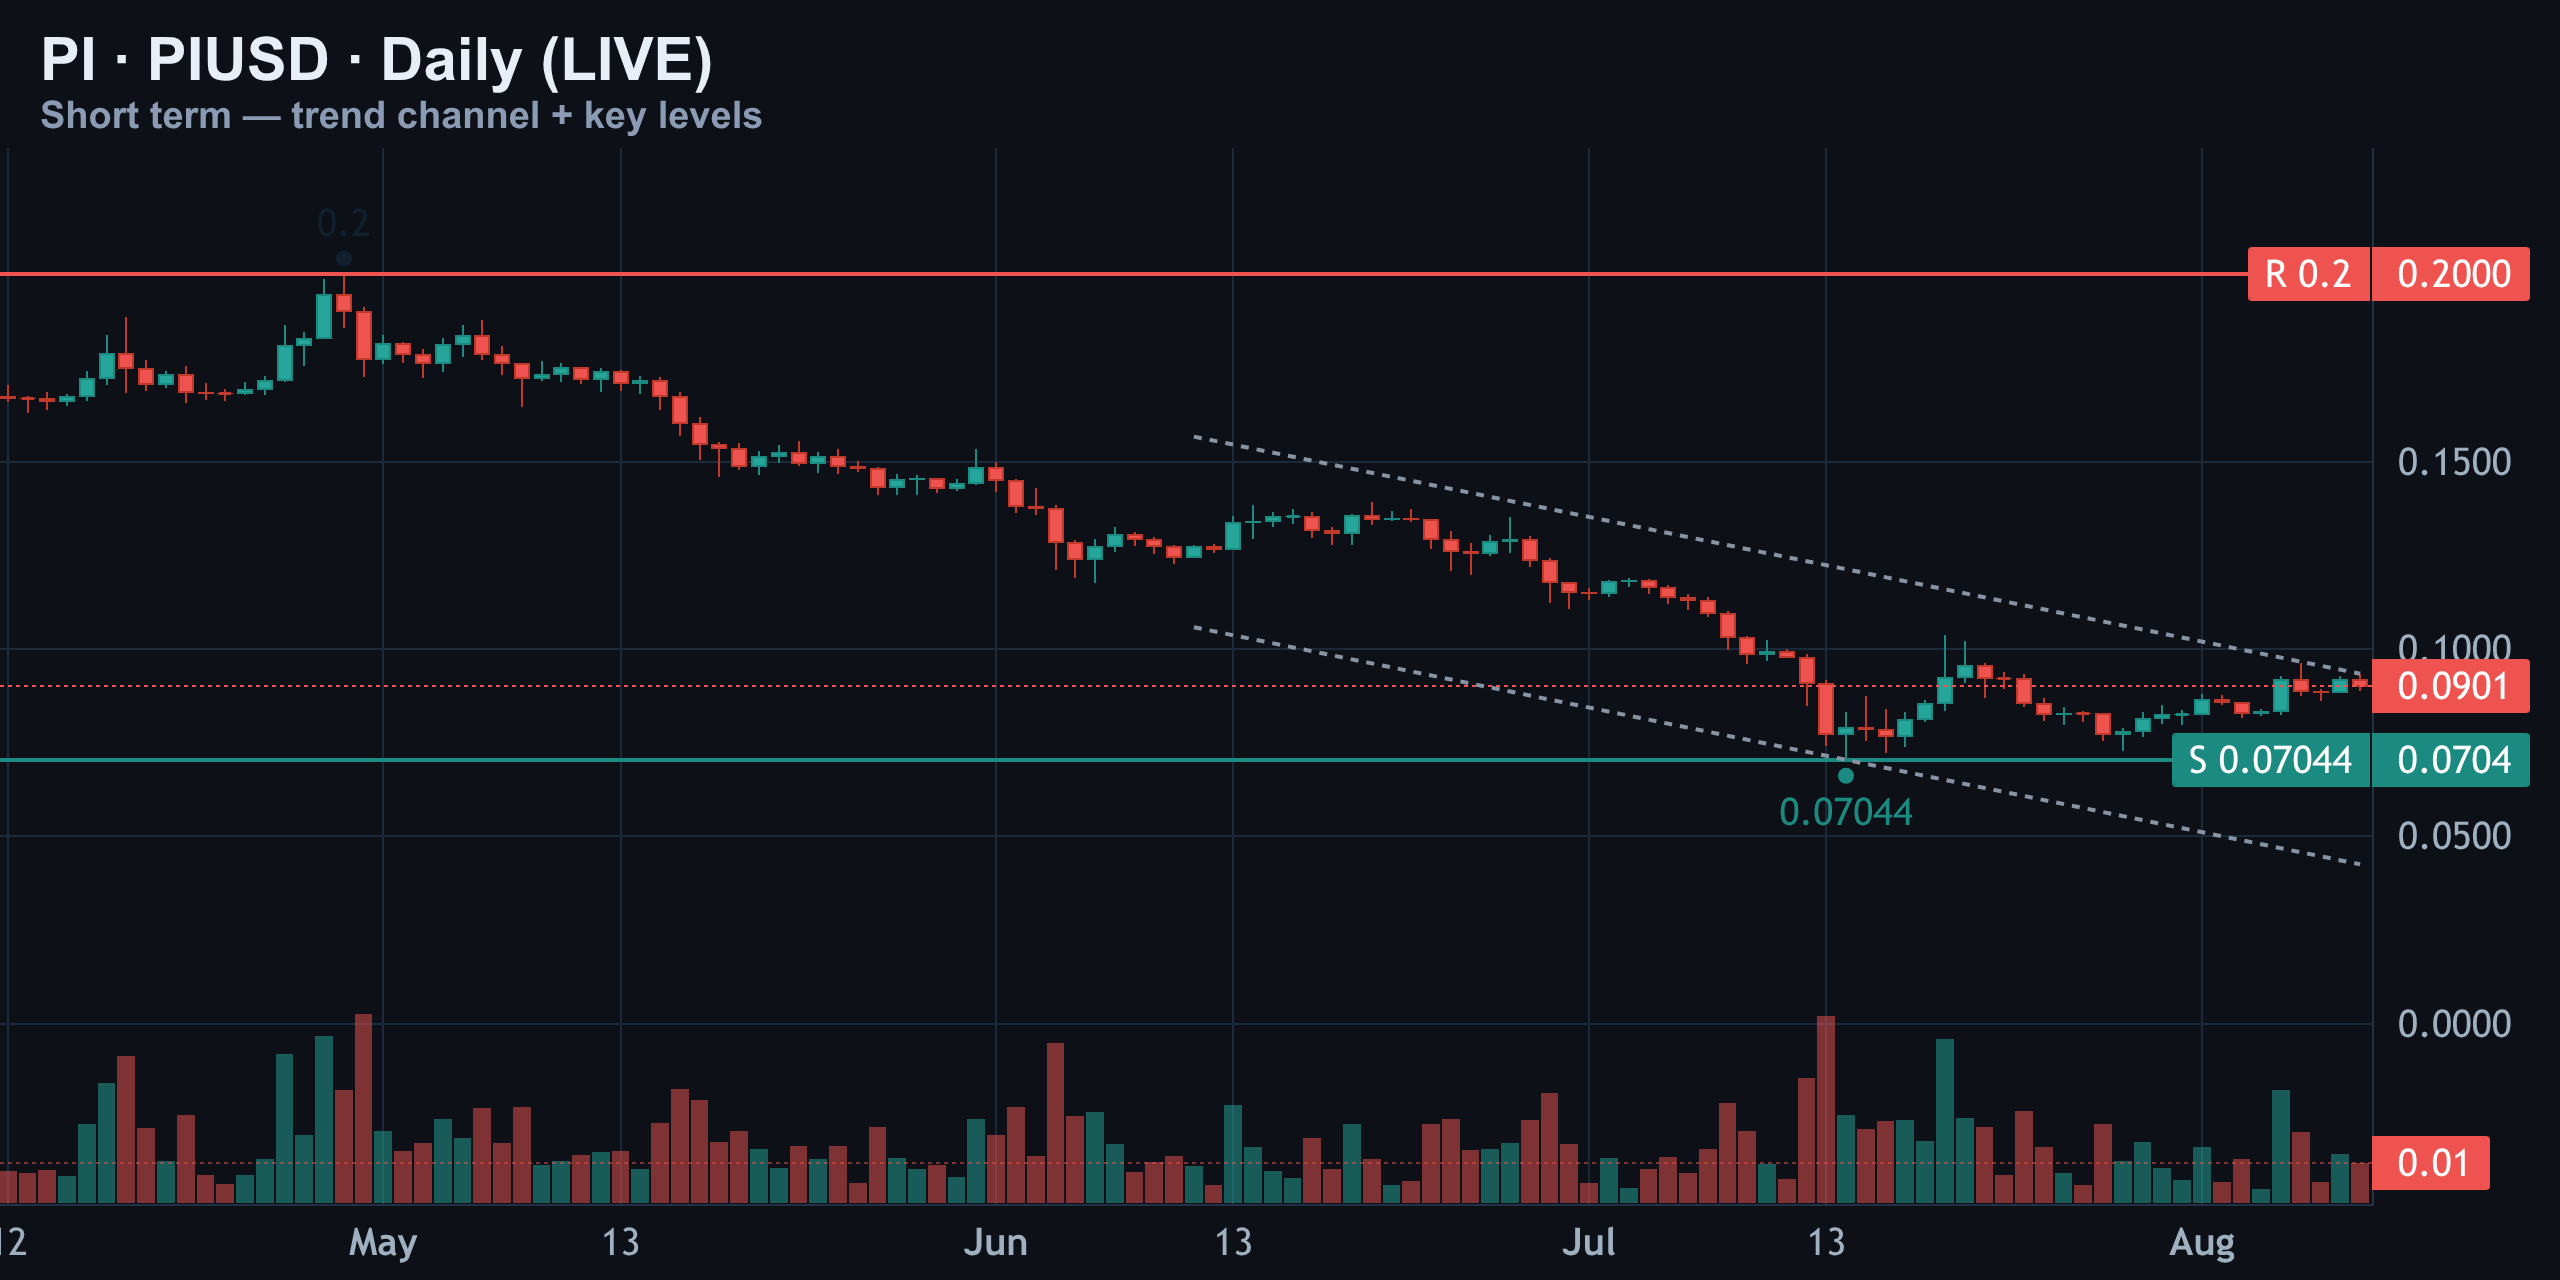
On the daily, PI is still working inside a longer descending channel that traces back to the March top. The key support underneath is the $0.07044 low from mid-July — that's the floor buyers defended hard. Above, the old $0.20 level is so far away it's basically background noise for this week's trading.
Right now price is pinned near 9 cents, roughly midway between that July low and this month's local high, still fighting the descending channel's upper boundary.
| Level | Price | Significance |
|---|---|---|
| Long-term ceiling | $0.2000 | Old high — background noise this week |
| Wedge resistance | $0.0951 | 4H close above flips bias bullish |
| Short trigger zone | $0.0929 | Today's entry area |
| Current price | ~$0.0897–$0.0901 | Sitting mid-range |
| Short target | $0.0864 | Yesterday's call, still tracking |
| Daily floor | $0.07044 | Mid-July low, hard support |
In plain terms: PI sits between a 7-cent floor and a fading long-term ceiling, with today's action confined to a narrow, well-defined band.
Momentum Check: RSI and MACD
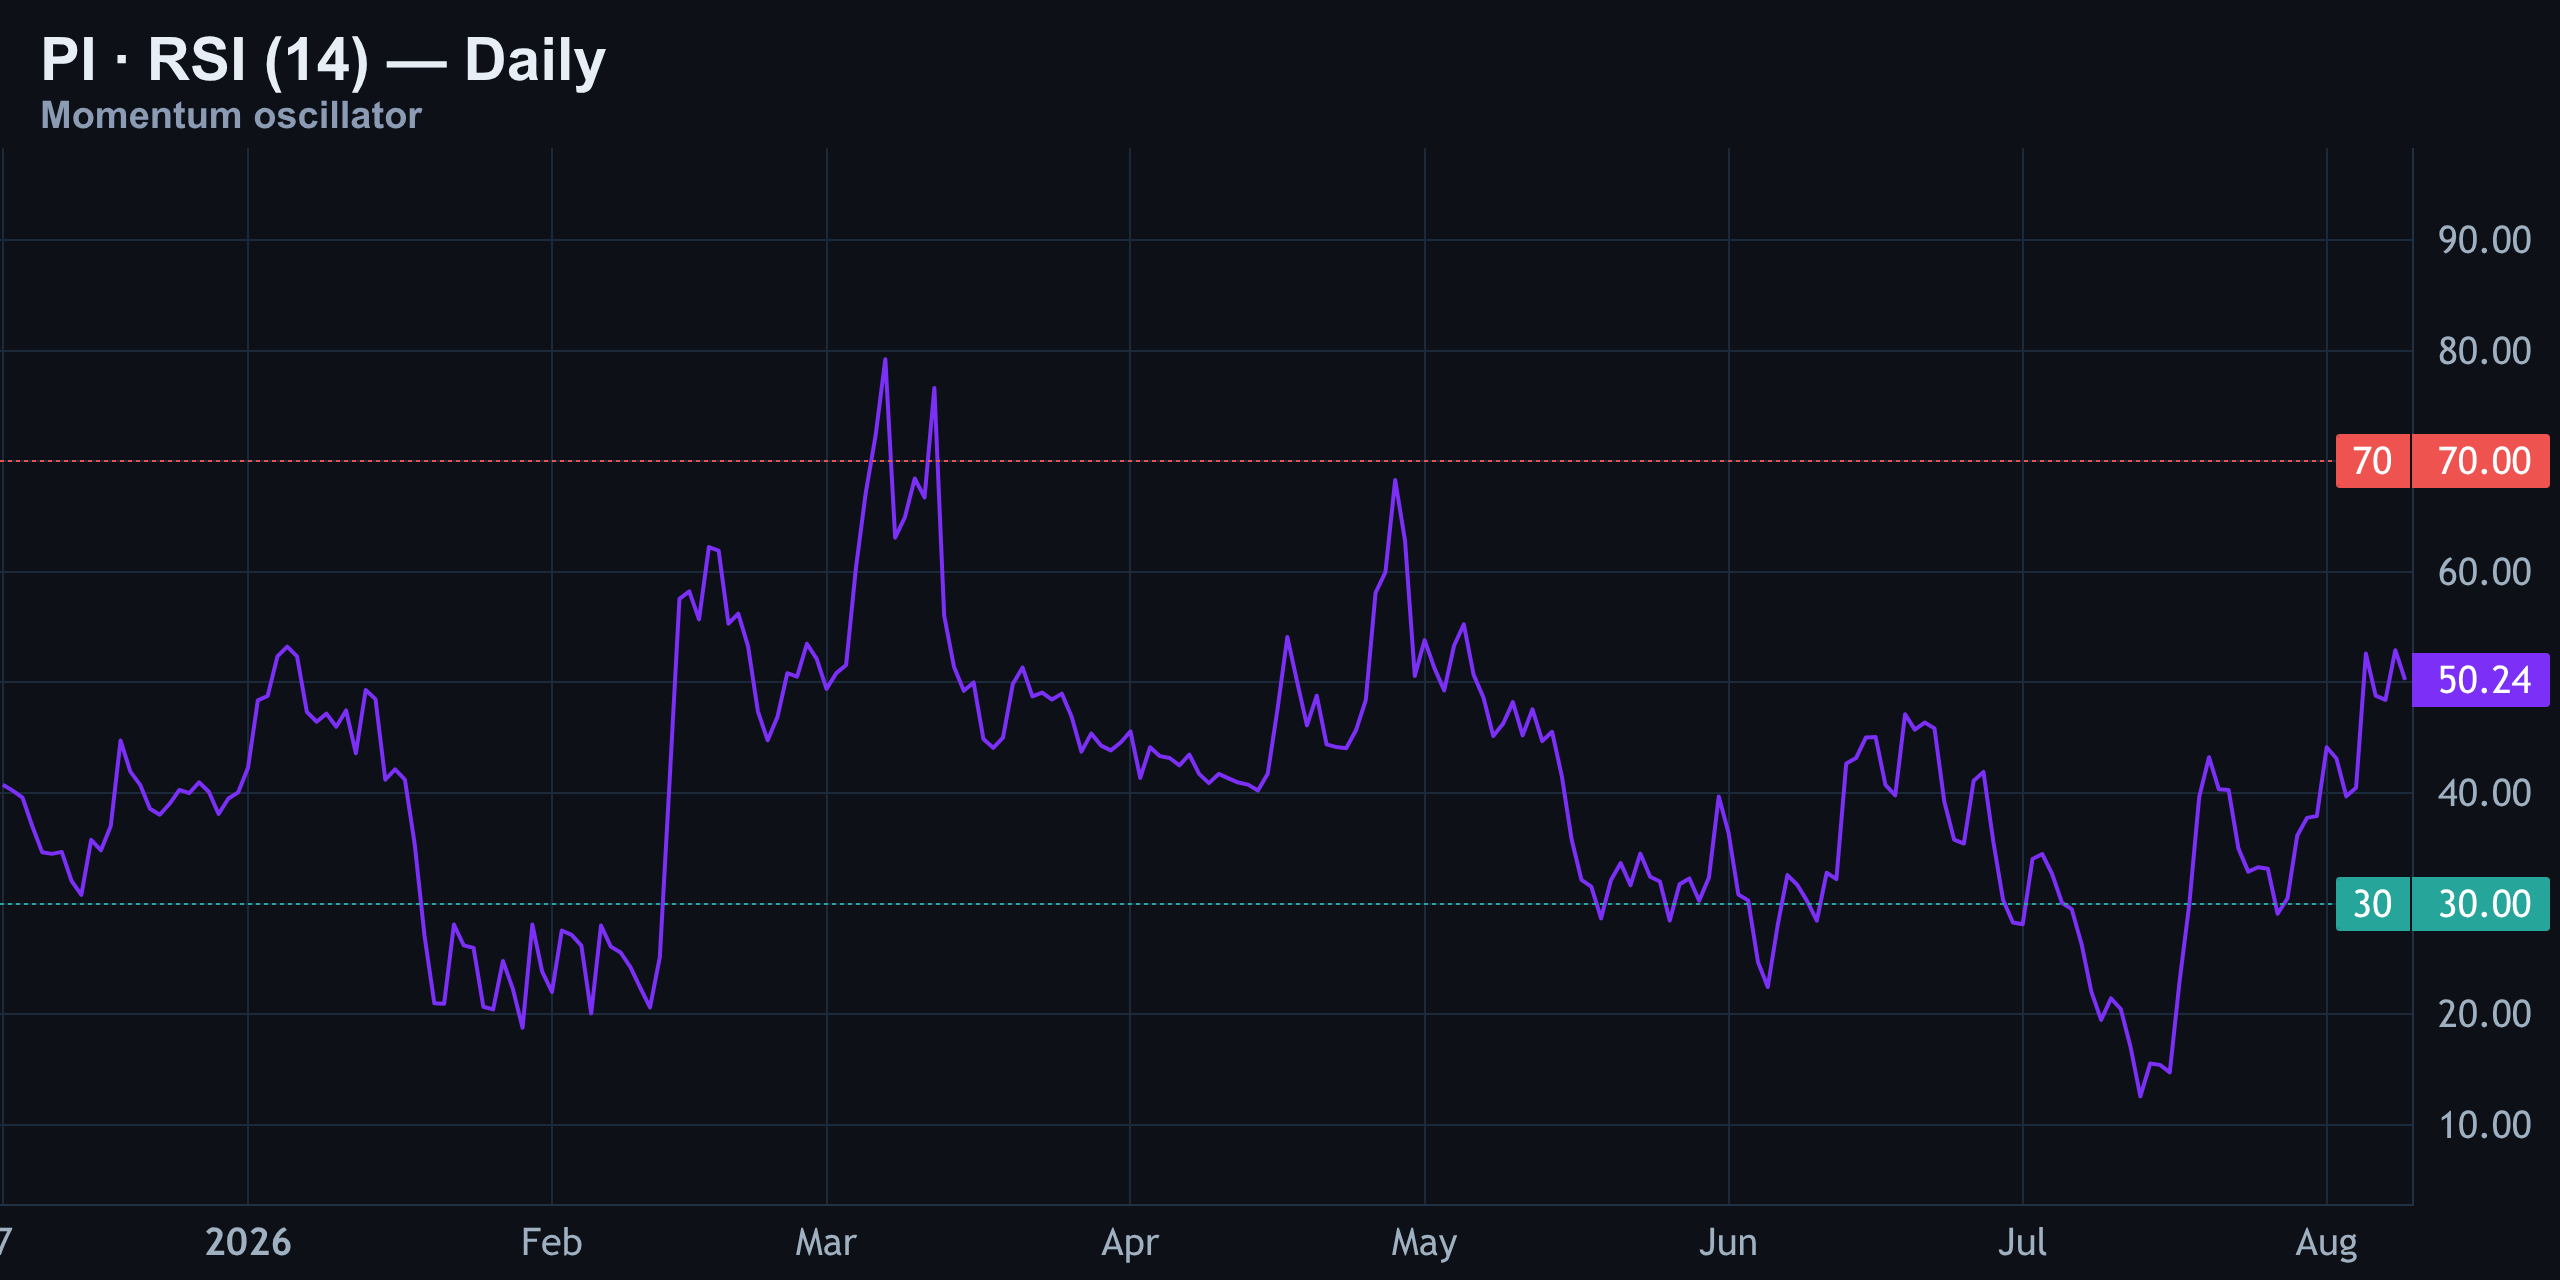
The daily RSI is parked right at 50 — about as neutral as this indicator gets. That means momentum traders have no edge here; PI isn't overbought, it isn't oversold, it's just resting. Compare that to July's dip into the low twenties, or March's spike near eighty, and you can see how flat things are right now.
On its own, RSI is telling you to wait for structure or derivatives data to make the call, not momentum.
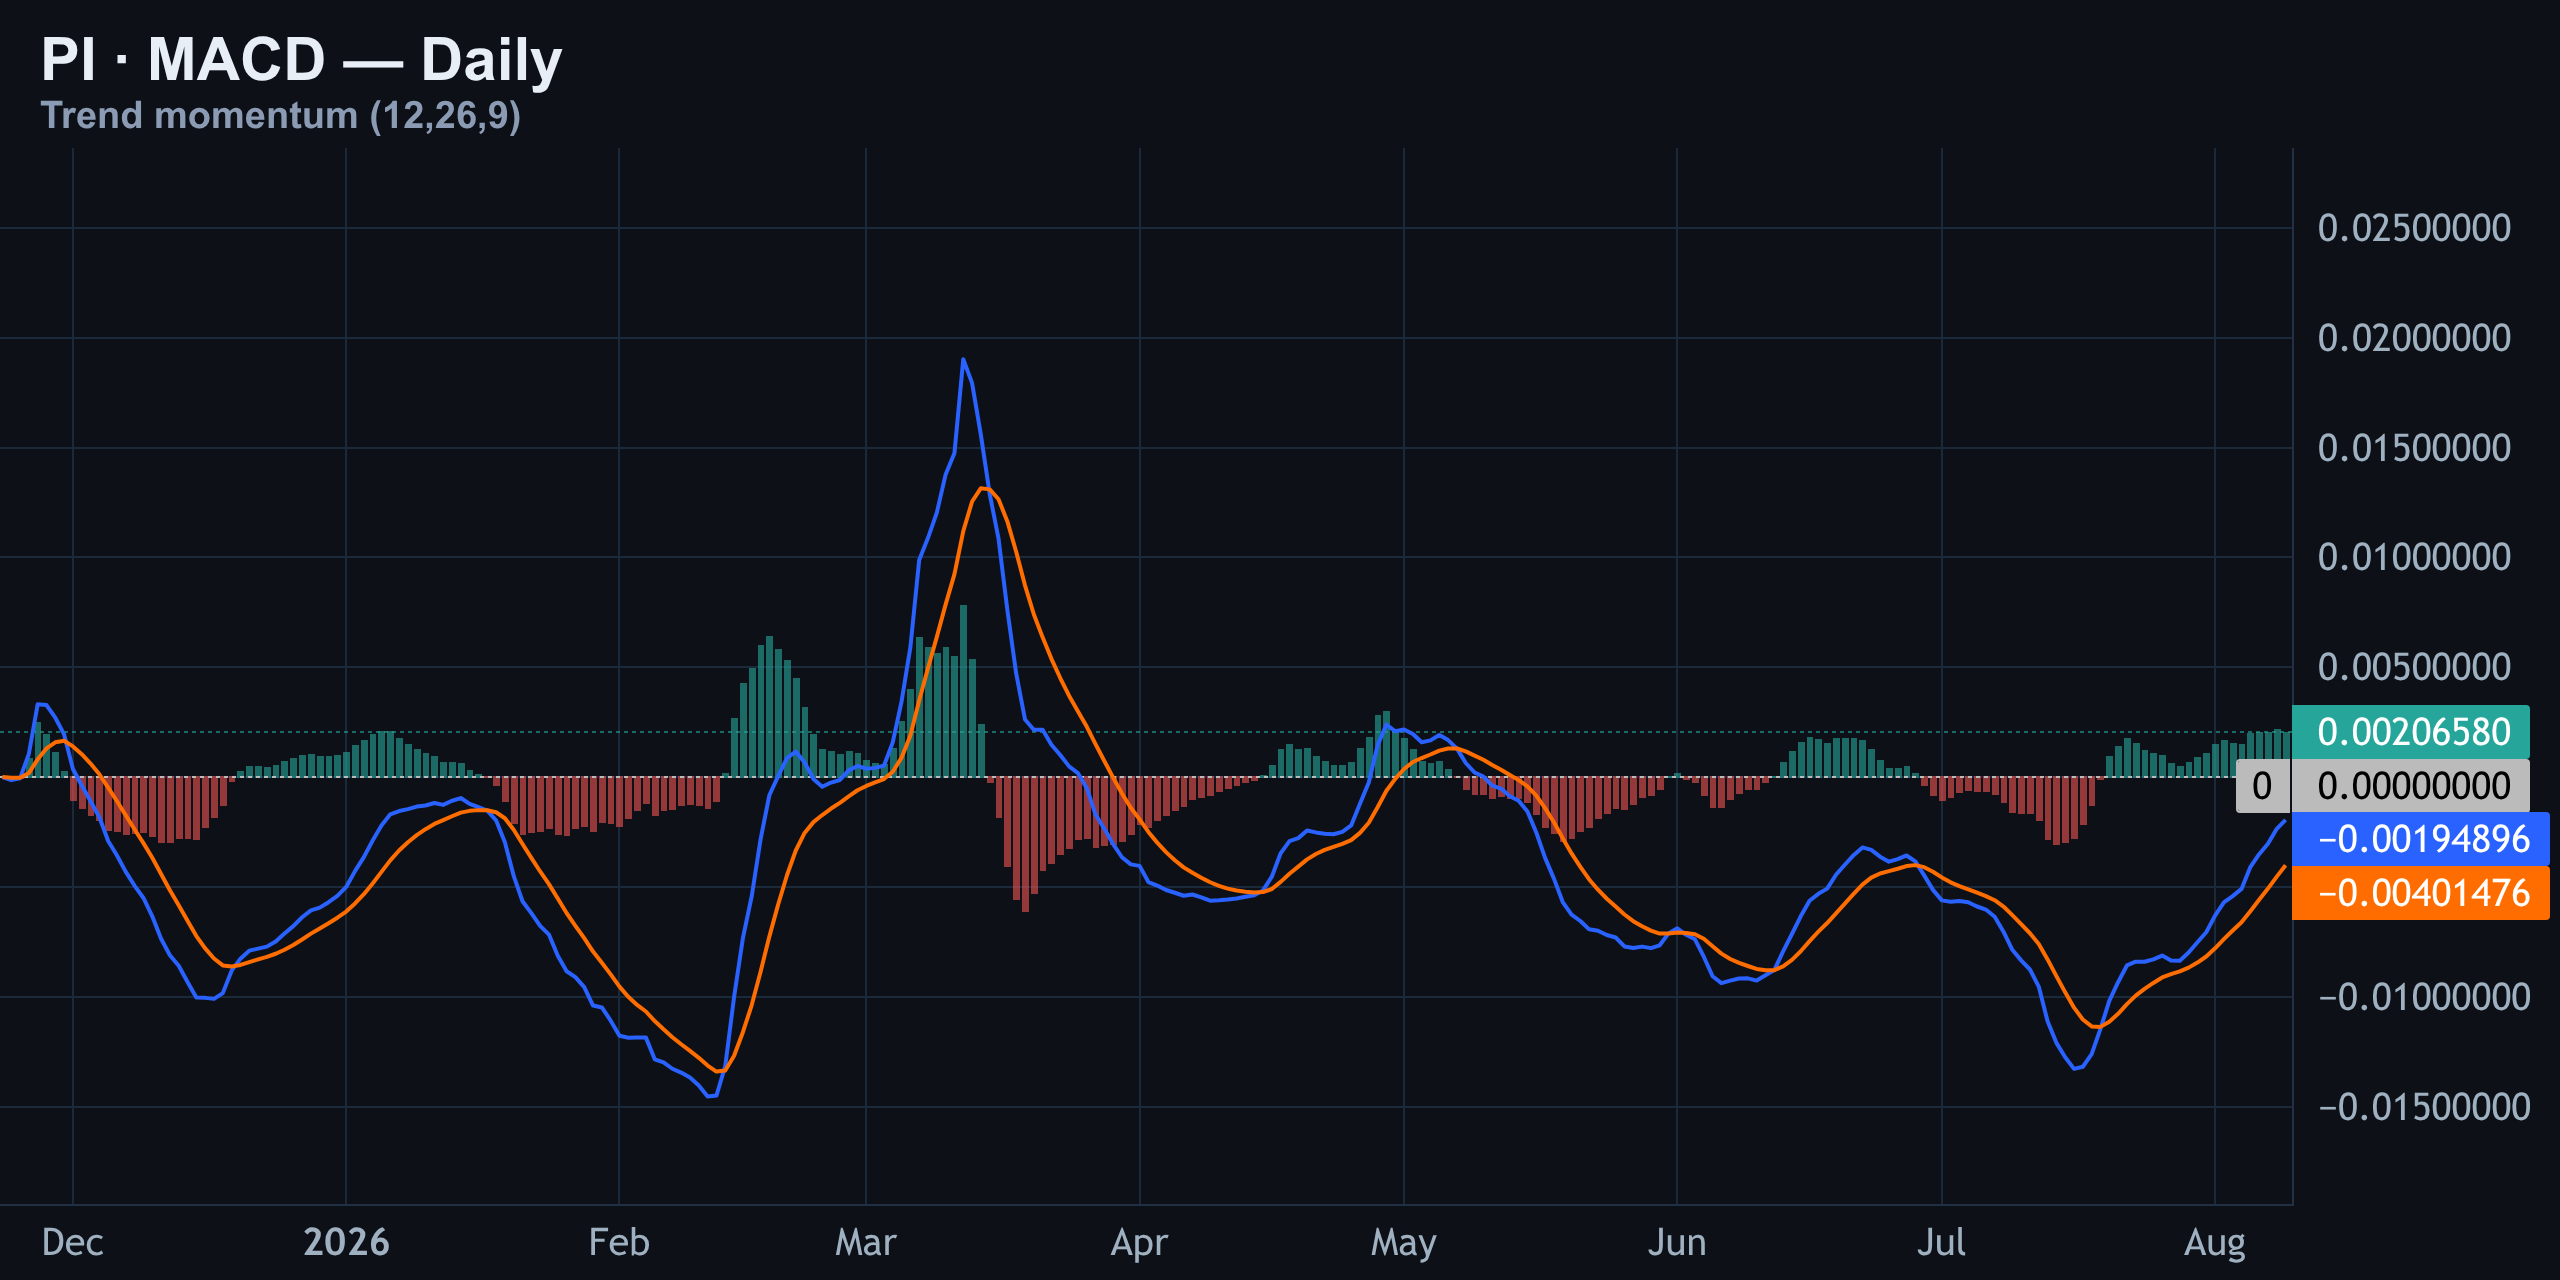
MACD just crossed back above its signal line, and the histogram has flipped green — technically a bullish signal. But look at the size of that cross: it's tiny, nowhere near the sharp thrusts you saw in March or May. The last two times MACD made a cross this shallow — late May and again in July — the bounce fizzled within days.
Today's Drivers: What's Moving the Wider Crypto Tape
The macro tape today is being driven by Bitcoin, not PI directly. Spot Bitcoin ETFs have been clawing back inflows after a rough July — BlackRock's IBIT alone pulled in roughly $478.5 million across a recent three-day stretch, part of a broader $626 million rebound in spot Bitcoin ETF flows. Daily tracking from SoSoValue also shows a run of consecutive positive-flow days feeding into early August, and Bitcoin has firmed back toward the $64,000 area as a result. That modest risk-on tone across majors is filtering down to altcoins, PI included — though at a much smaller scale.
On the policy side, there's a real overhang worth watching: the CLARITY Act, the crypto market-structure bill working through Congress, is now facing a hard deadline. Reports indicate the Senate vote is scheduled for September 15, and the bill needs additional Democratic support to clear the 60-vote threshold. The bill has already stalled once before after a scheduled markup was postponed, so the market isn't fully pricing in a smooth path yet.
That kind of regulatory overhang possibly keeps smaller tokens like PI cautious rather than trending hard in either direction. Meanwhile, PI's own price action shows a pullback of roughly 2% into today's session, tracking the broader risk-off chop rather than moving on any PI-specific news.
The Trade Plan: Levels, Entry, and Invalidation
Here's the plan, carried straight from the computed structure and unchanged from yesterday's call.
| Parameter | Level | Notes |
|---|---|---|
| Short trigger | $0.0929 | About 9.3 cents — today's entry zone |
| Stop-loss | $0.0951 | 4H close above this kills the trade |
| Target | $0.0864 | About 8.6 cents |
| Risk-to-Reward | 1:3.0 | Risking $1 to make roughly $3 |
| Bias flip level | $0.0951 | 4H close above flips bias bullish |
The line in the sand is $0.0951 — a 4-hour close above that level flips the short-term bias bullish and invalidates this setup entirely. Below that, $0.0929 remains today's short trigger zone. Downside, the target sits near $0.0864, with the bigger daily floor way down at $0.07044 from mid-July.
08/08/2026 — PI Daily Pulse Aug 8 2026: Wedge Resistance, Short Still Live
PI Daily Pulse Aug 8 2026: Wedge Resistance, Short Still Live
Where We Left It: Yesterday's Short Is Still Loaded
Before getting into today's move, it's worth revisiting where the last call stands, because it's still very much in play. Yesterday's setup on this channel was a short from $0.0943 toward a target of $0.0852, with a stop parked at $0.0977. Neither level has been touched. Price never ran up to invalidate the stop, and it never dropped far enough to tag the target either.
Since that call went out, PI actually rallied hard — roughly 3.9%, moving from about $0.0882 up to around $0.0916, right back toward the same resistance shelf that's been capping this asset for weeks. That's not a blown trade. That's a patience trade. The setup is technically still alive, and today's price action is essentially a retest of the exact zone that matters most for whether that short thesis plays out or gets invalidated.
Today's Snapshot: Momentum Up, Structure Still Capped
PI is changing hands around $0.0910–$0.0917, up close to 4% on the session, according to live data from CoinGecko and Binance's price tracker. Coinbase's feed shows a slightly lower print near $0.087, a reminder that PI liquidity is thin enough that quotes can vary meaningfully across venues — always worth checking your own exchange before executing.
Momentum indicators have genuinely improved. MACD has flipped positive for the first time in about two weeks, and RSI sits neutral at 52 — no overbought warning, but no confirmed strength either. The catch is structural: price is running straight into the top of a rising wedge on the 4-hour chart, the same ceiling that rejected the last two rally attempts. Until that ceiling breaks with a clean close, the bias stays neutral-to-bearish, and yesterday's short setup remains technically valid.
15-Minute Chart: Breakout Cools Right Under Resistance
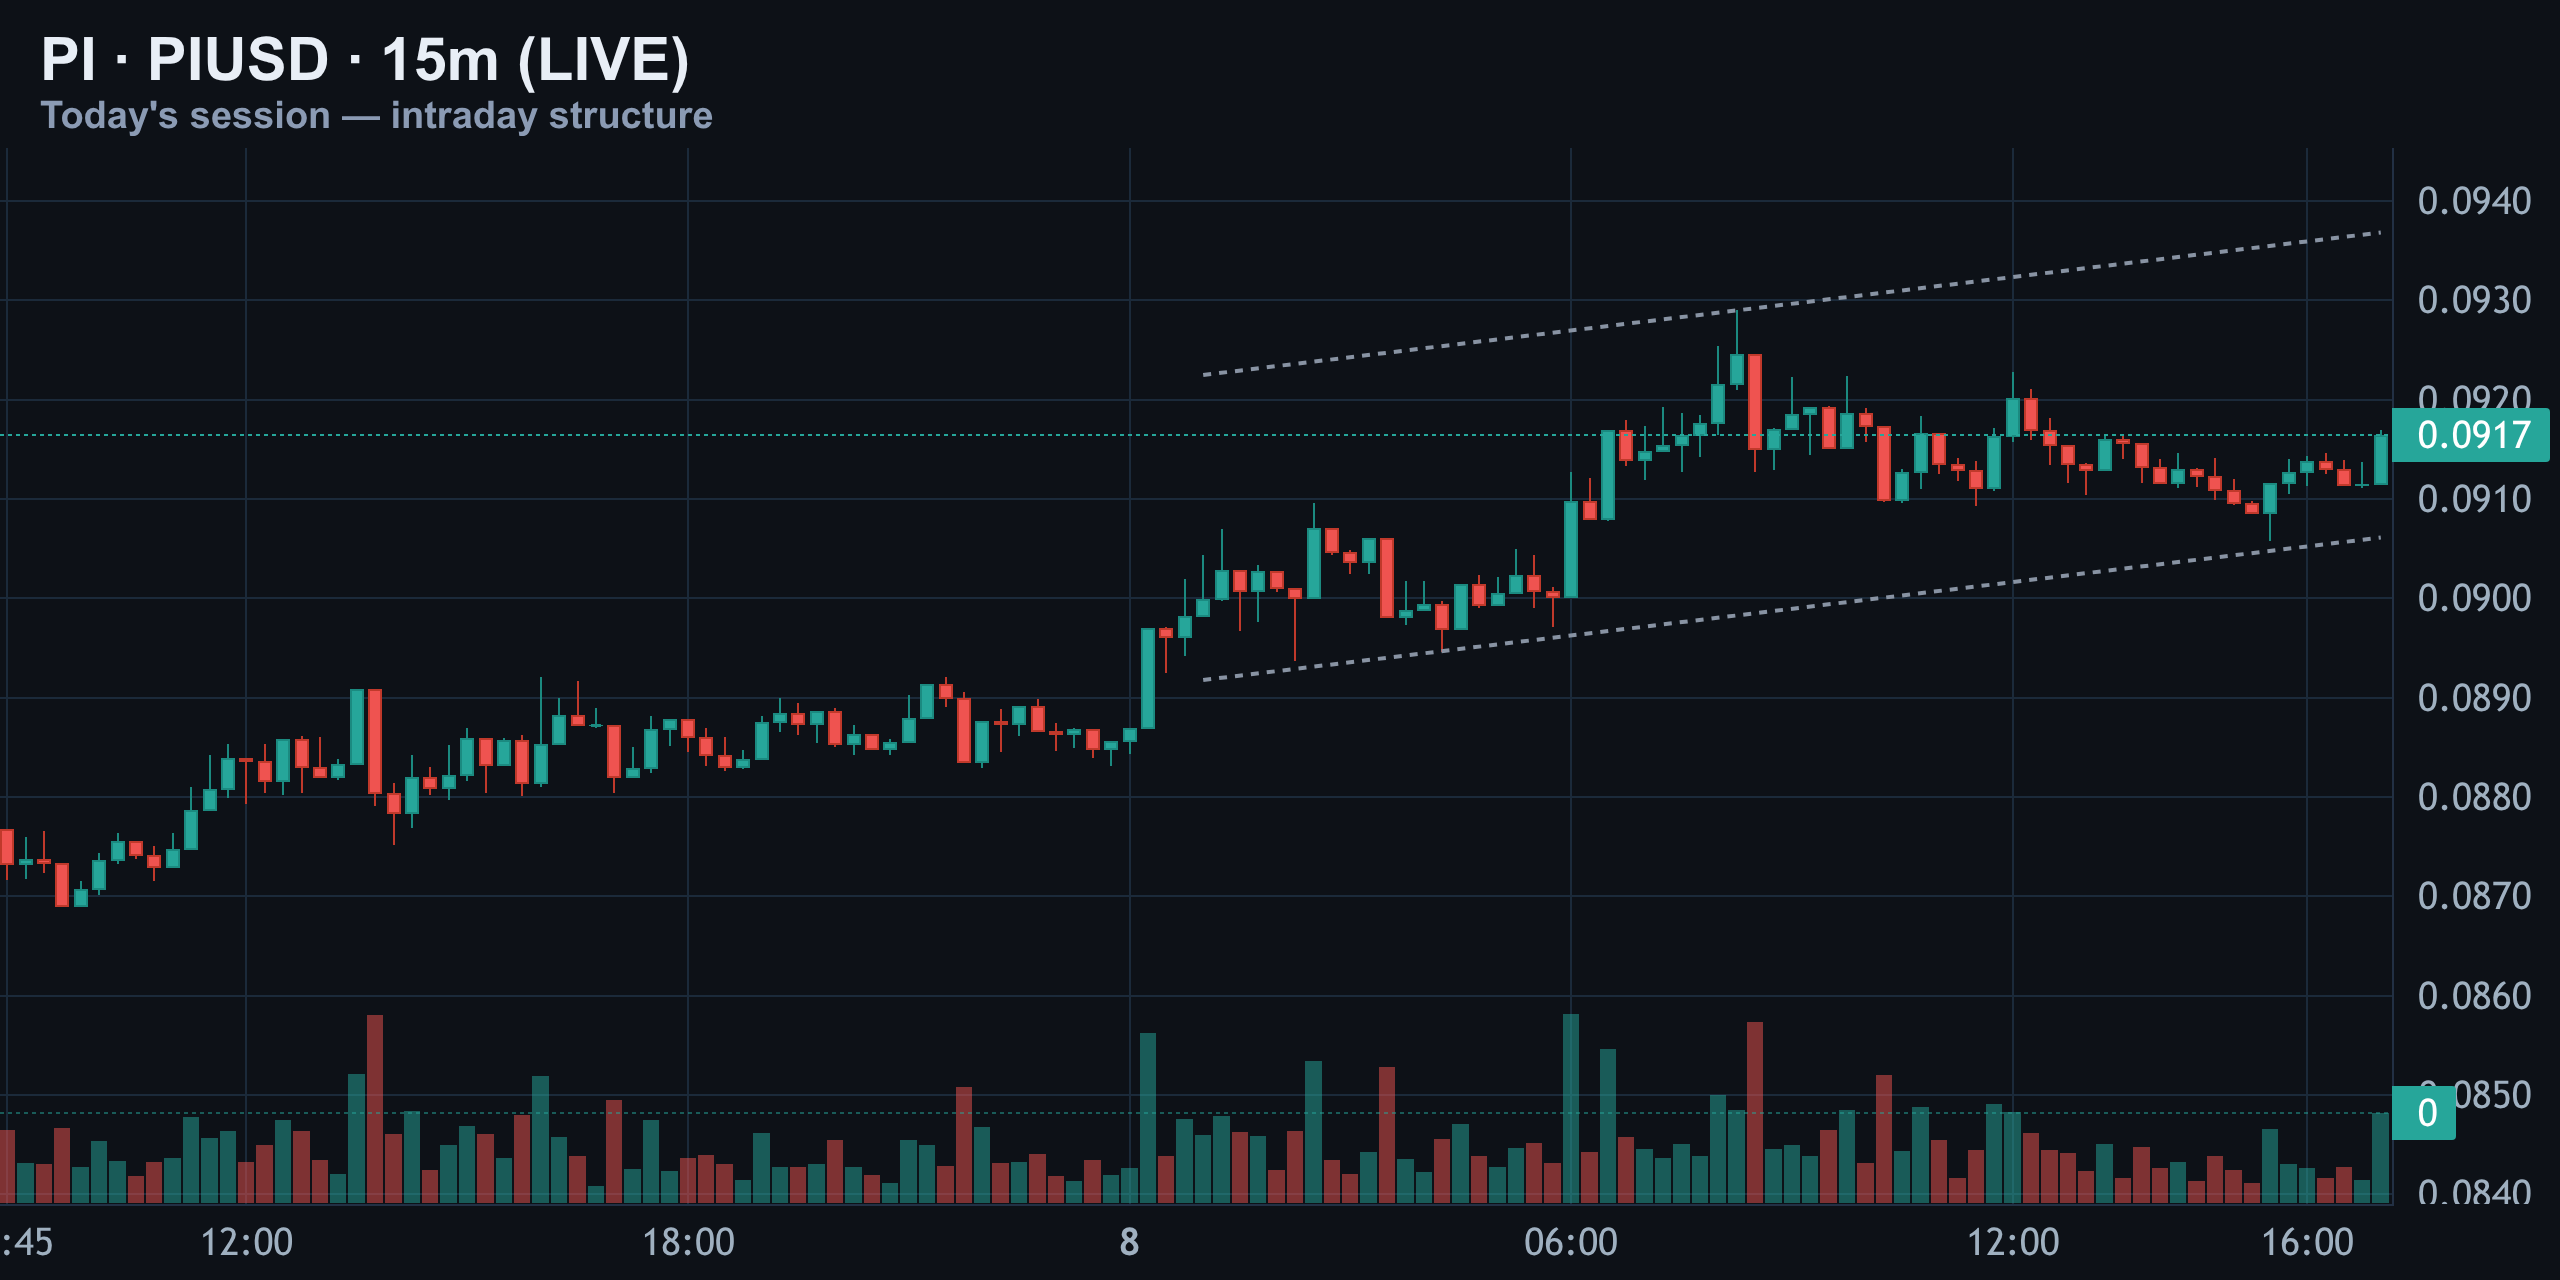
Zooming into the 15-minute timeframe, PI broke out of its overnight base near $0.0890 and pushed into the $0.0920 handle before stalling. The dashed channel on the chart shows price breaking above the top rail, tagging a high, then rolling back toward $0.0917, right on the channel mid-line.
What stands out is volume behavior: it ticked up on the red candles into that fade, which usually signals that late buyers chasing the breakout got trapped near the top. This is classic breakout-then-retest price action. The next handful of candles will decide whether buyers reclaim the highs and force a continuation, or whether this turns into a textbook rejection back into range.
4-Hour Chart: V-Recovery Runs Straight Into the Wedge Top
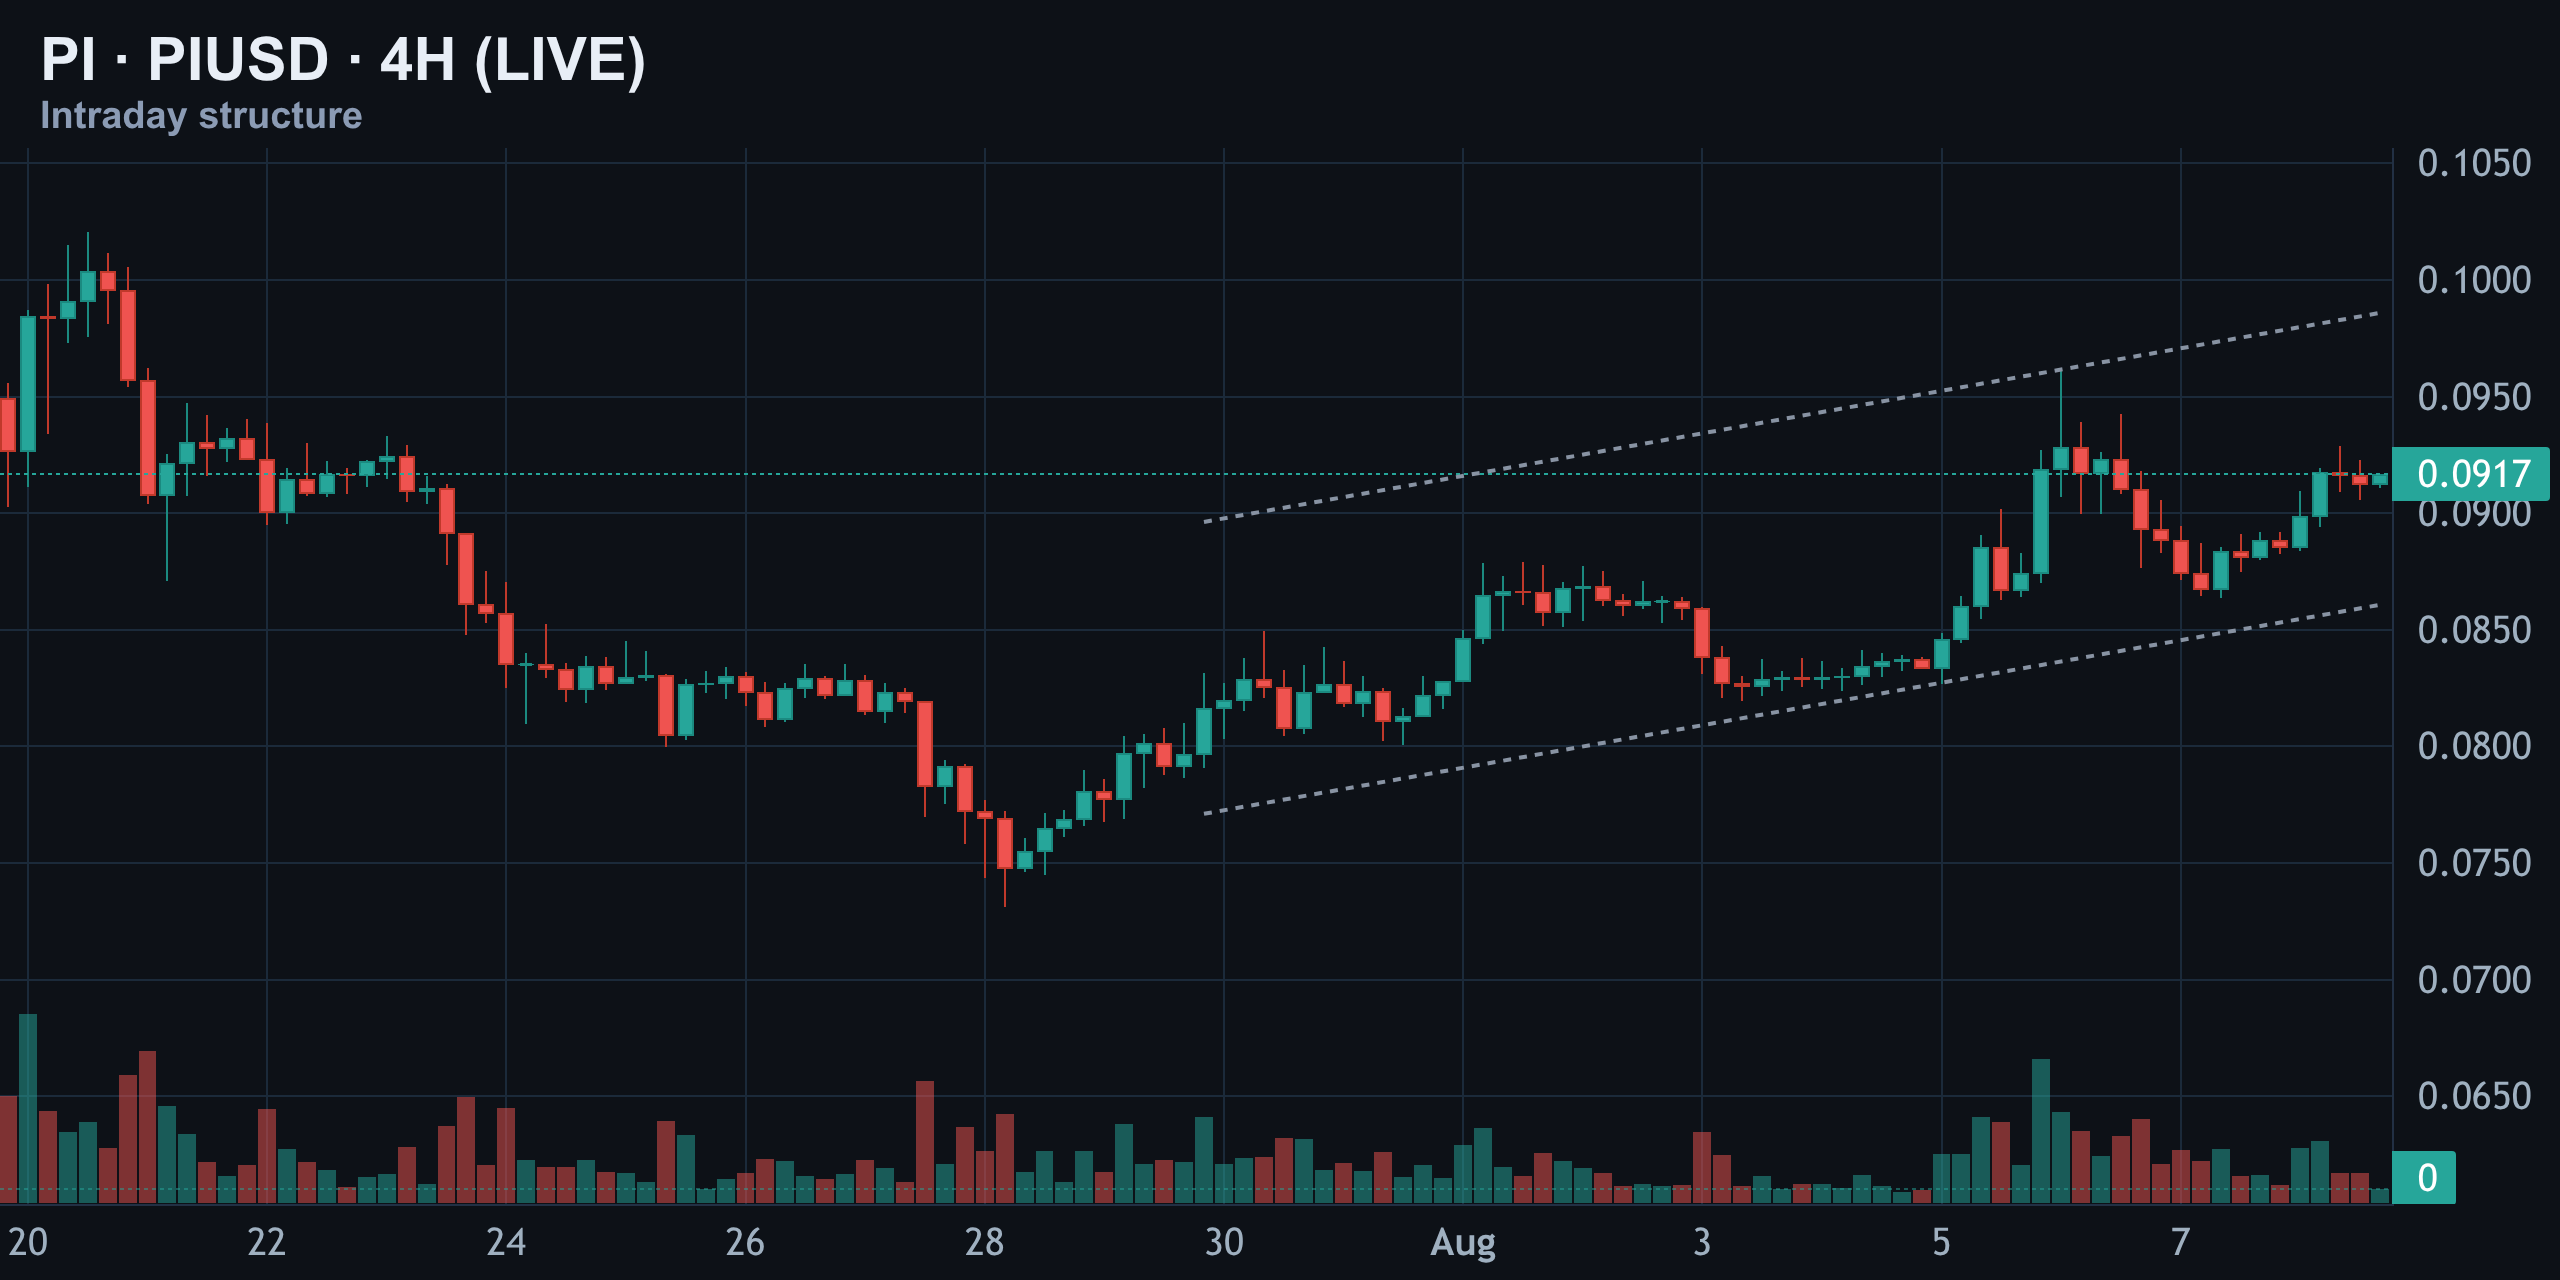
The bigger story on the 4-hour is a sharp V-shaped recovery off the $0.0704 low from late July. Since that bottom, price has climbed inside a rising channel and is now testing the upper rail near $0.0930 — the same ceiling that has capped the last two attempts to push higher.
Volume is fading even as price grinds upward, which is often an early warning sign at a channel top — buyers are pushing price up on decreasing conviction. A clean 4-hour close above that rail would meaningfully change the picture and open the door for a genuine trend shift. A failure here, on the other hand, confirms the wedge is still firmly in control and that this bounce is running out of road.
Daily Chart: A Relief Rally Inside a Longer Downtrend
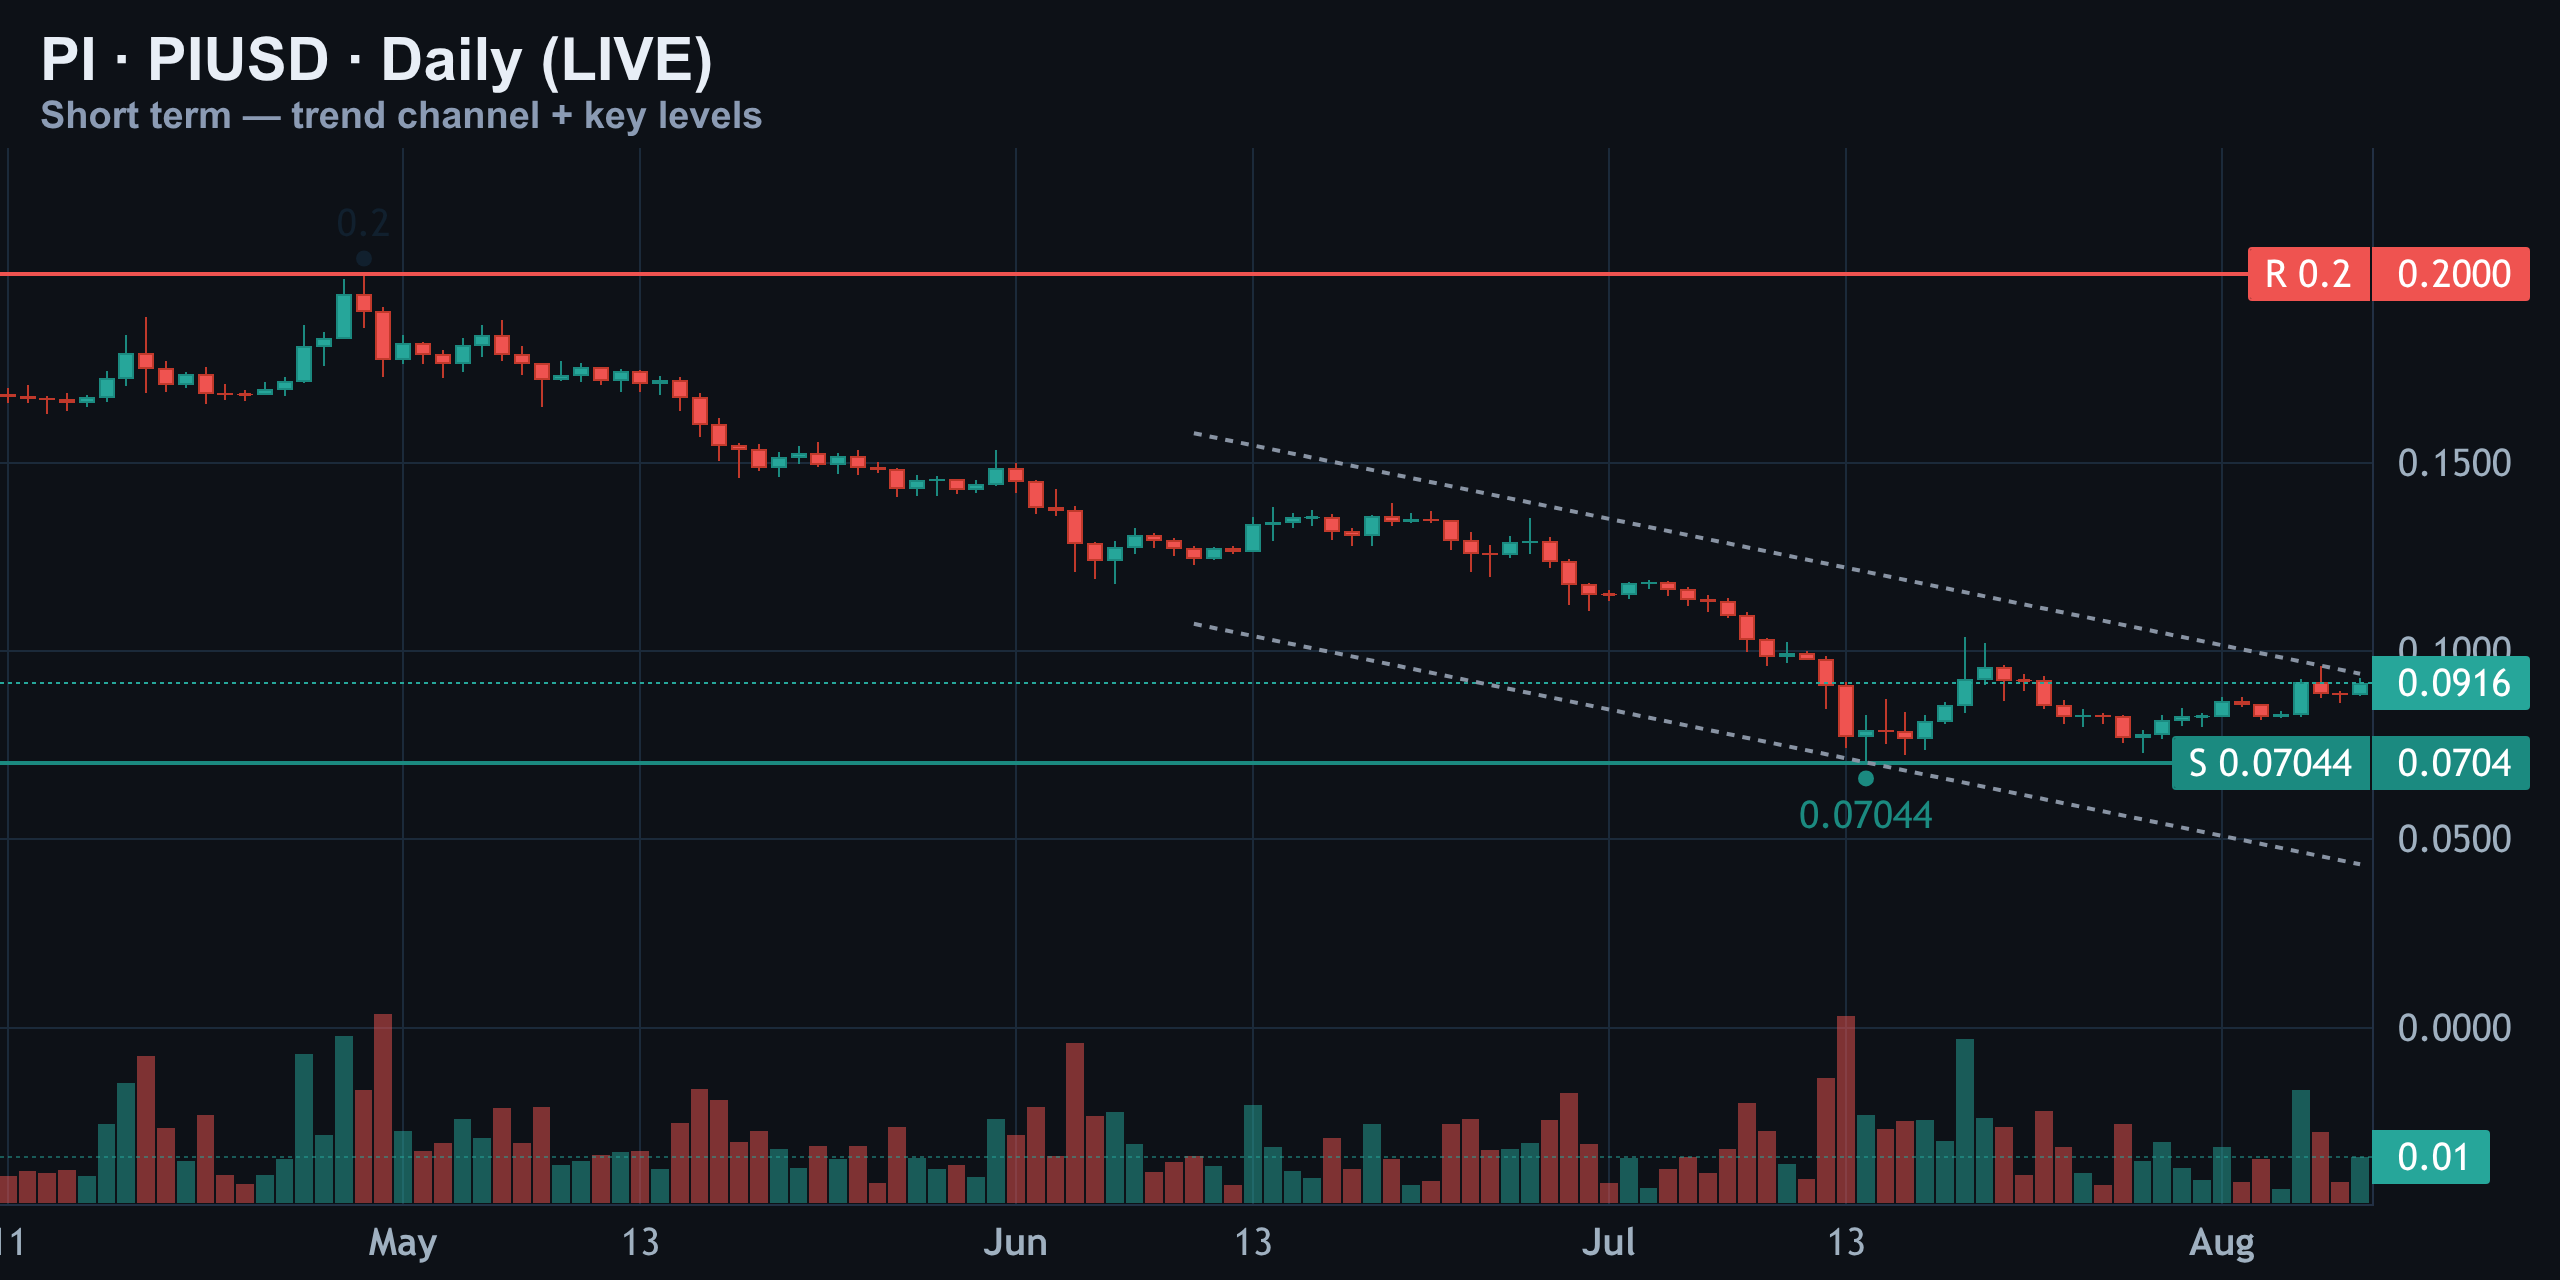
Stepping back to the daily chart tells the real story. PI spiked toward the $0.20 level months back, then ground steadily lower all the way to the $0.0704 support before the current bounce kicked in. That low held cleanly, and price has since clawed its way back to around $0.092.
But there's a descending channel drawn from the earlier highs, and price is now pressing directly into that diagonal resistance line. Until PI closes cleanly above it on a daily basis, this bounce should be read as a relief rally inside a longer downtrend — not a confirmed reversal. Bigger picture: this is happening inside a bigger downtrend, not the start of a new uptrend.
RSI and MACD: Momentum Improved, But Not Confirmed
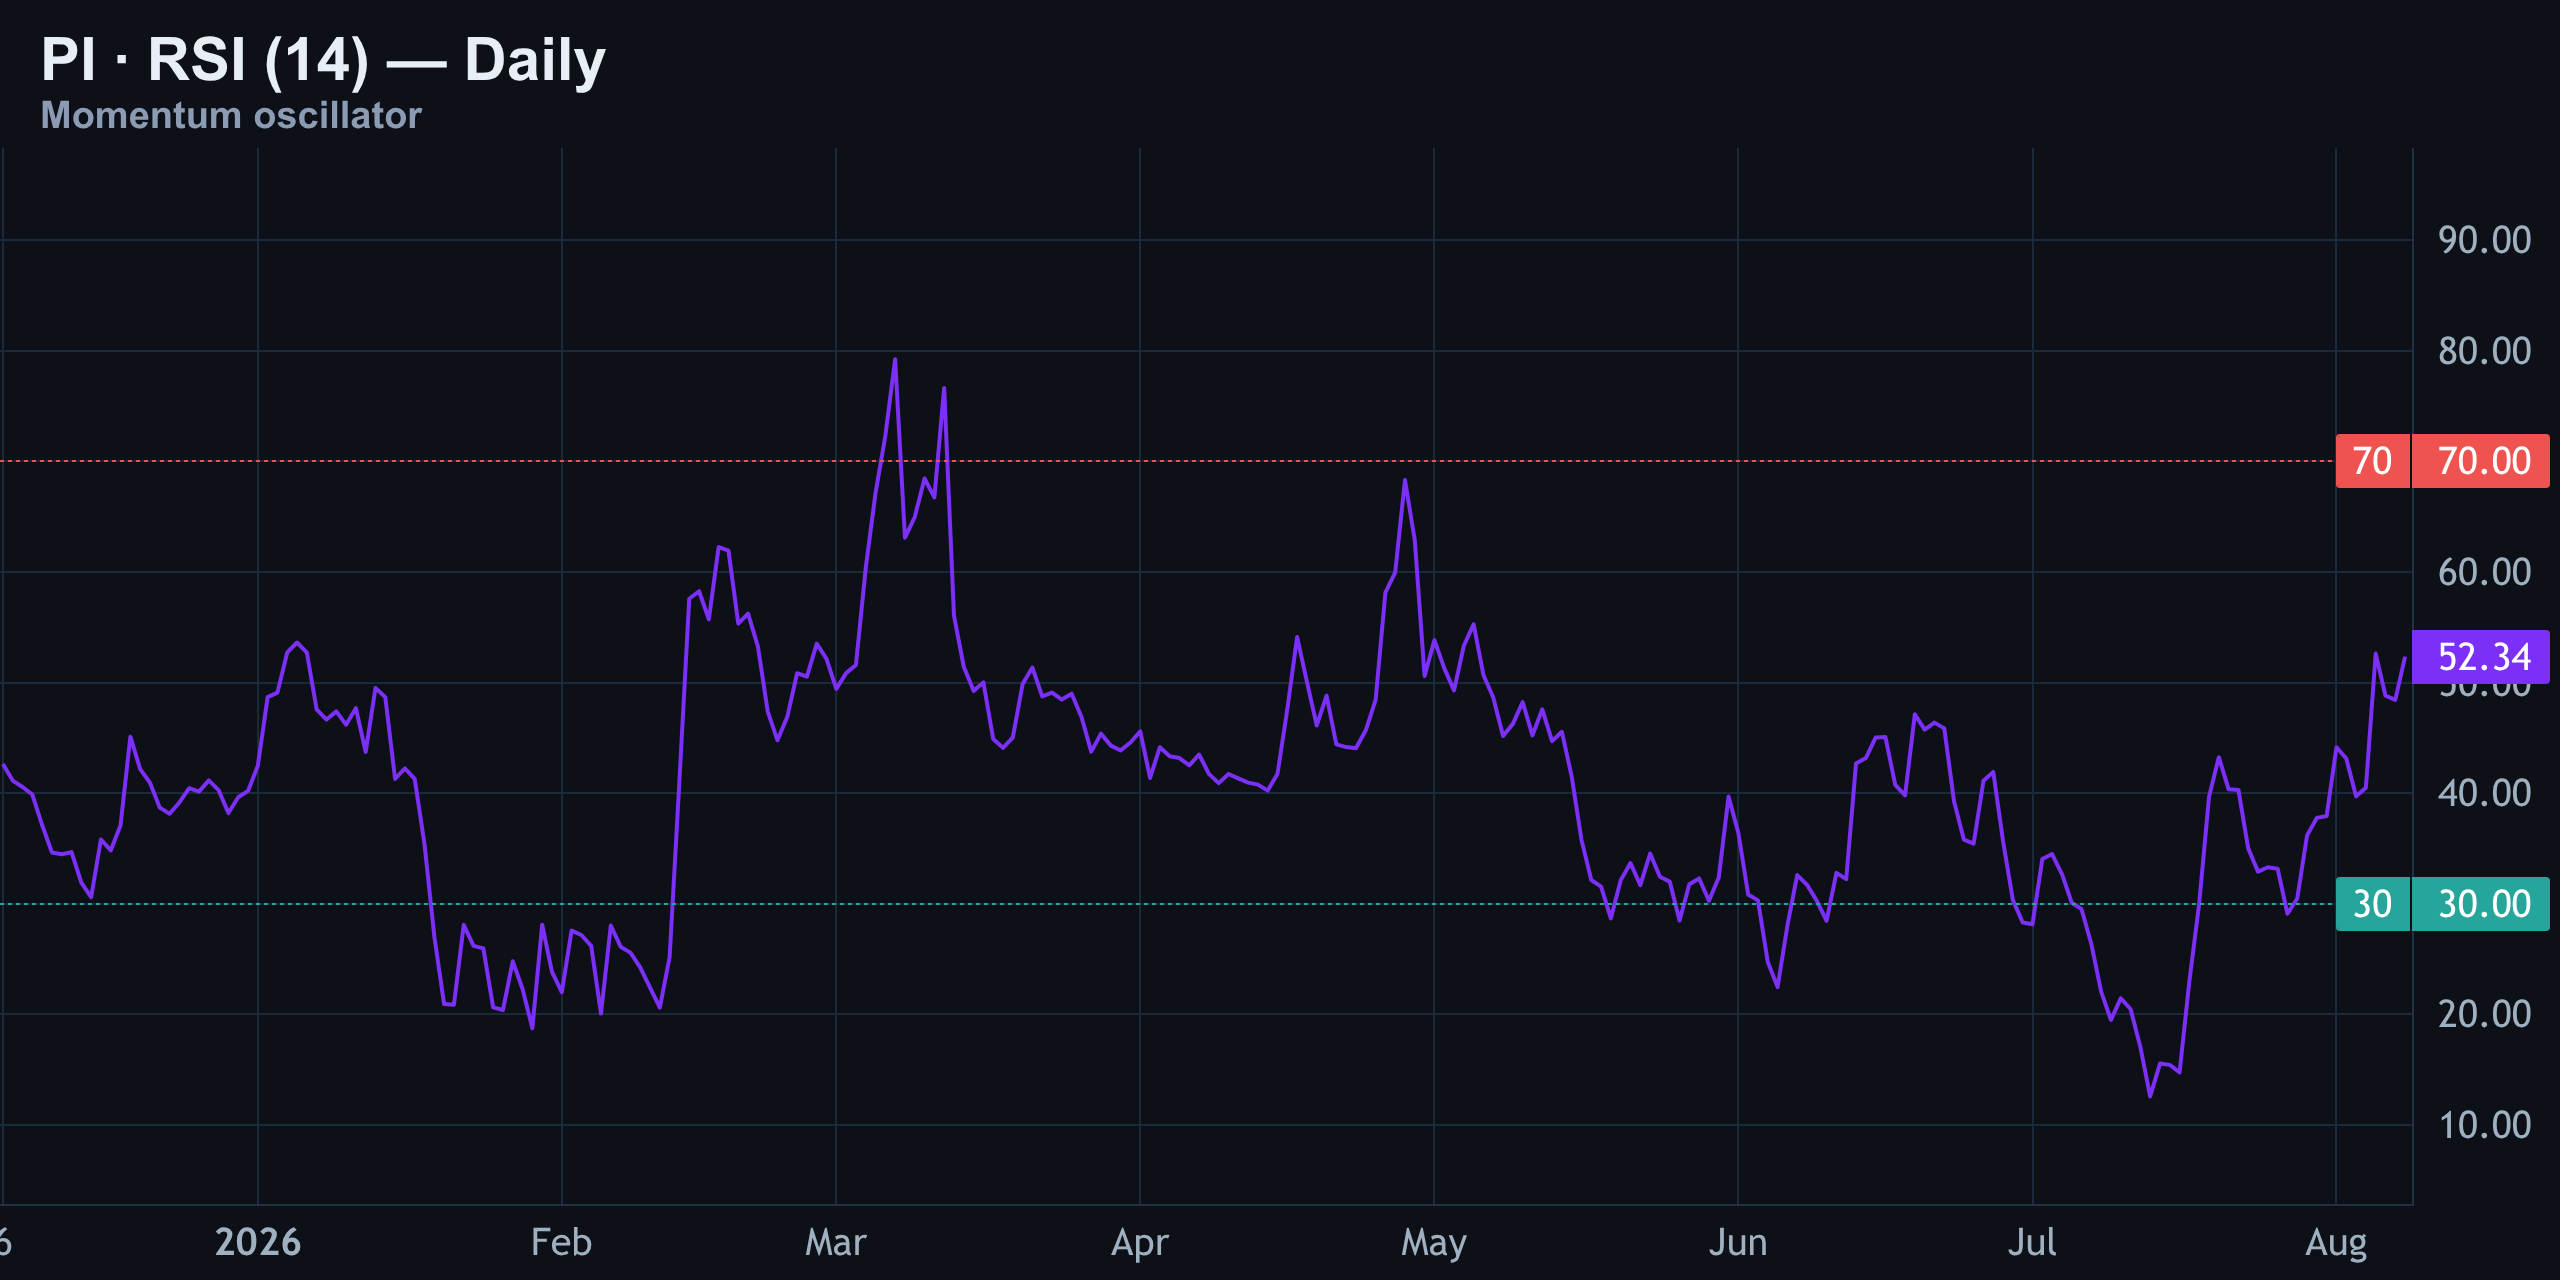
Daily RSI sits at 52 — dead neutral. That's notable given price just ran up close to 4% in a single day. It means momentum hasn't overheated, so there's no immediate overbought signal forcing a snap-back. But it also means bulls haven't proven real strength yet. Compare this to earlier in the year, when RSI spiked into the 70s during genuine momentum runs — today's reading is far more muted, suggesting this bounce leans corrective rather than a fresh impulsive wave.
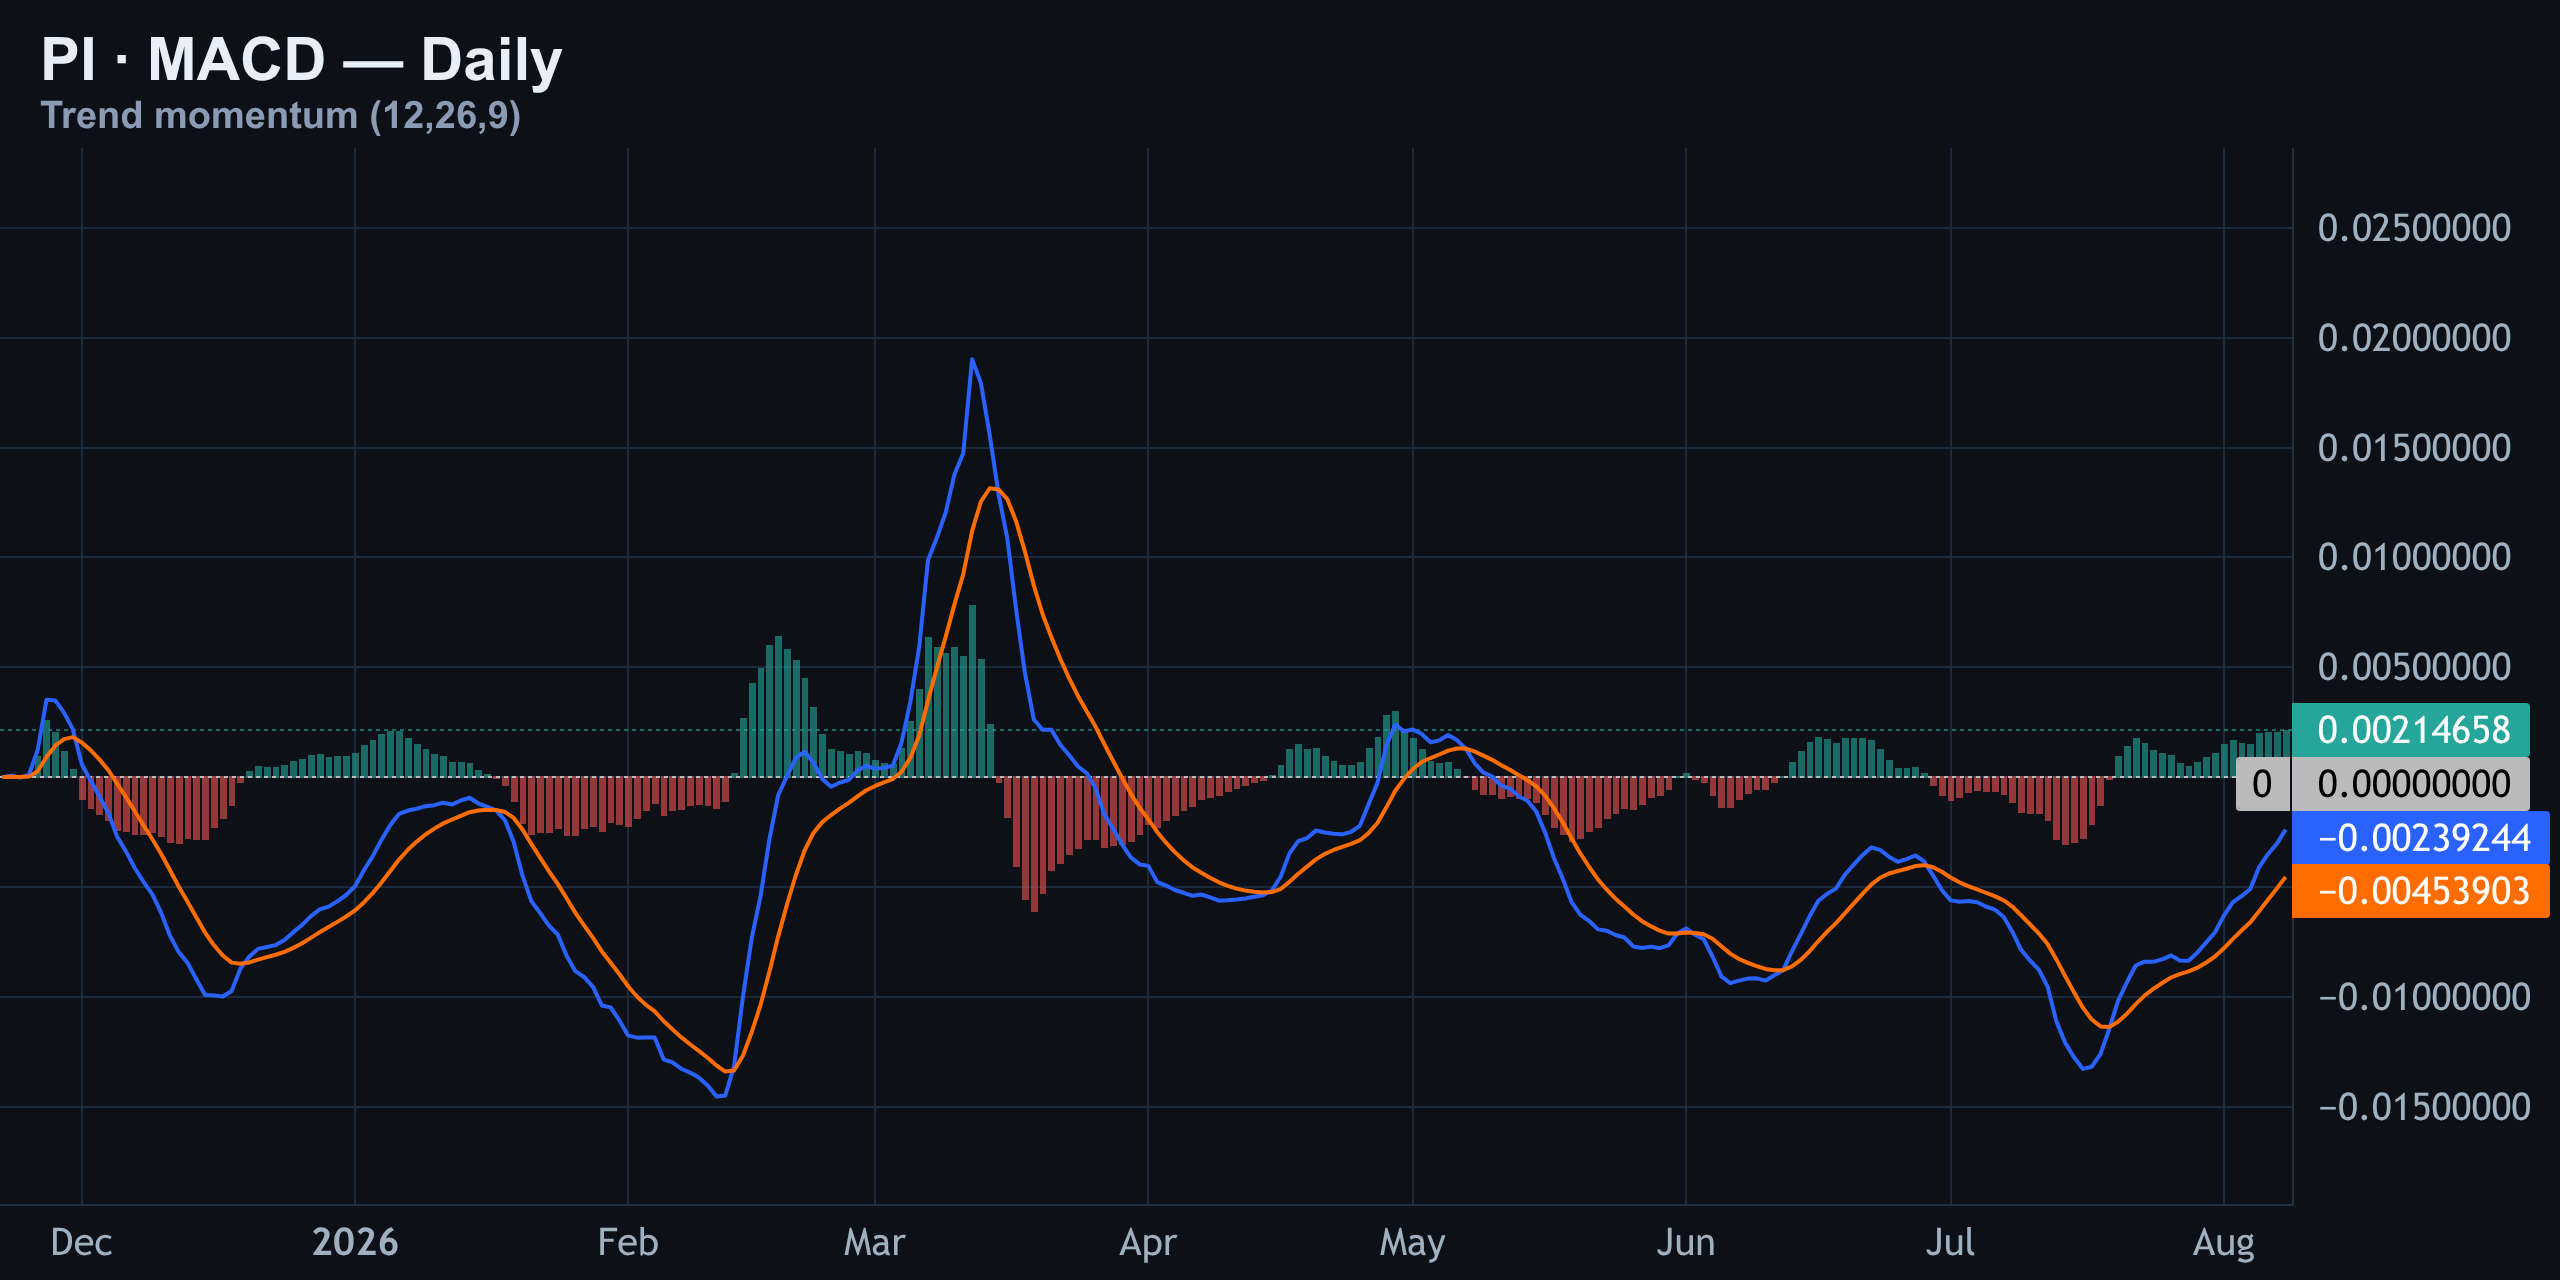
MACD has turned constructive: the MACD line has crossed above its signal line, and the histogram has flipped positive for the first time in roughly two weeks. That's a legitimate short-term bullish cross. The catch is that both lines remain below the zero line, meaning this is early-stage momentum inside a larger down-move — not confirmation of a new uptrend. Traders should treat this as a tactical bounce signal, not a green light to abandon the broader bearish structure.
Key Levels to Watch
Here's the full map of where PI stands right now and the levels that matter most on either side.
| Level | Price | Significance |
|---|---|---|
| Old resistance high | $0.20 | Prior cycle high — currently untouchable |
| 4H wedge ceiling | $0.093 | Key resistance; also short entry zone |
| Current price | ~$0.091–$0.0917 | Spot, up ~4% on the day |
| Short entry trigger | $0.0929 | Computed entry for today's setup |
| Stop loss | $0.0953 | Above wedge; invalidates trade on 4H close |
| Short target | $0.0864 | Roughly 2.7:1 reward-to-risk |
| Major support | $0.0704 | Late-July low that held the entire bounce |
Today's Macro Drivers
PI isn't moving in a vacuum today. The broader crypto tape is genuinely risk-on: Bitcoin ETFs and whale wallets combined pulled in well over a billion dollars this week, with spot ETFs alone attracting around $754 million and whales adding roughly $1.2 billion in BTC, per CoinDesk's latest tracking. Separately, the Senate has moved into the voting stage on the crypto CLARITY Act, with analysts flagging potential multi-billion-dollar inflows into altcoin ETFs if it passes, according to Yahoo Finance's coverage.
- Bitcoin ETF and whale inflows top $1B combined this week — a clear risk-on tailwind
- Senate CLARITY Act voting stage opened, seen as bullish for broader crypto market structure
- OFAC sanctioned Iran-linked crypto exchanges, extending secondary sanctions and tightening enforcement
- Brazil's central bank now imposes up to a 24-hour delay on crypto transfers above $10,000 to curb fraud
Put together, that's a mixed bag: genuine risk appetite returning to majors, offset by fresh regulatory friction in specific corridors. PI's own 4–5% pop today, confirmed across CoinMarketCap-linked data feeds and CoinGecko, looks more like it's riding this broader risk-on wave than reacting to any PI-specific news. That matters for how much weight to put on this bounce — it's sentiment-driven, not fundamentals-driven.
The Trade Setup: 1:2.7 Risk-to-Reward
Putting the technical picture together — 15-minute breakout stalling, 4-hour wedge resistance holding, daily downtrend still structurally intact, RSI neutral, MACD constructive but sub-zero — the computed desk plan for today looks like this:
| Parameter | Level |
|---|---|
| Direction | Short |
| Trigger | $0.0929 |
| Stop loss | $0.0953 |
| Target | $0.0864 |
| Reward-to-risk | ≈ 2.7 : 1 |
The logic is straightforward: the stop sits just above the wedge ceiling, meaning a 4-hour close above it would flip this entire read on its head and the trade is off. The target sits just under current structure support, roughly in line with where the previous short call (from $0.0943) was also aiming. Two setups, same neighborhood — that's not a coincidence, it's the same resistance-driven thesis playing out over consecutive sessions.
Analysis and education, not investment advice. See our editorial policy.