Daily market analysis
Solana (SOL) technical analysis today
Last updated
Solana Daily Pulse Aug 15, 2026: The $75 Pin Tightens
Solana Is Exactly Where It Was a Week Ago — And That's the Story
Solana (SOL) is trading around $75.33–$75.62 as of August 15, 2026, essentially flat on the day and barely moved from where it sat seven days ago at $75.43. Spot data from multiple venues confirms the tight range: Kraken has SOL at $75.17, down just 0.30% intraday, while MetaMask's price feed shows $75.18.
That's not a typo — Solana has gone almost nowhere in a week. Last Saturday's update flagged the coin as stuck between its 50-day and 200-day moving averages with no clean setup, and that range simply never resolved. Seven days later, same fight, same price, no target hit, no stop run — because there was no trade on.
Options Flow: Quietly Bullish-Leaning, Loudly Expensive
Under the flat surface, the options market is telling a more nuanced story. The put-to-call ratio by open interest sits at 0.47, meaning calls dramatically outnumber puts across the open book — a call-heavy positioning skew. But the volume-based put-call ratio has jumped to 0.90 today, signaling traders are actively hedging into tomorrow's expiry.
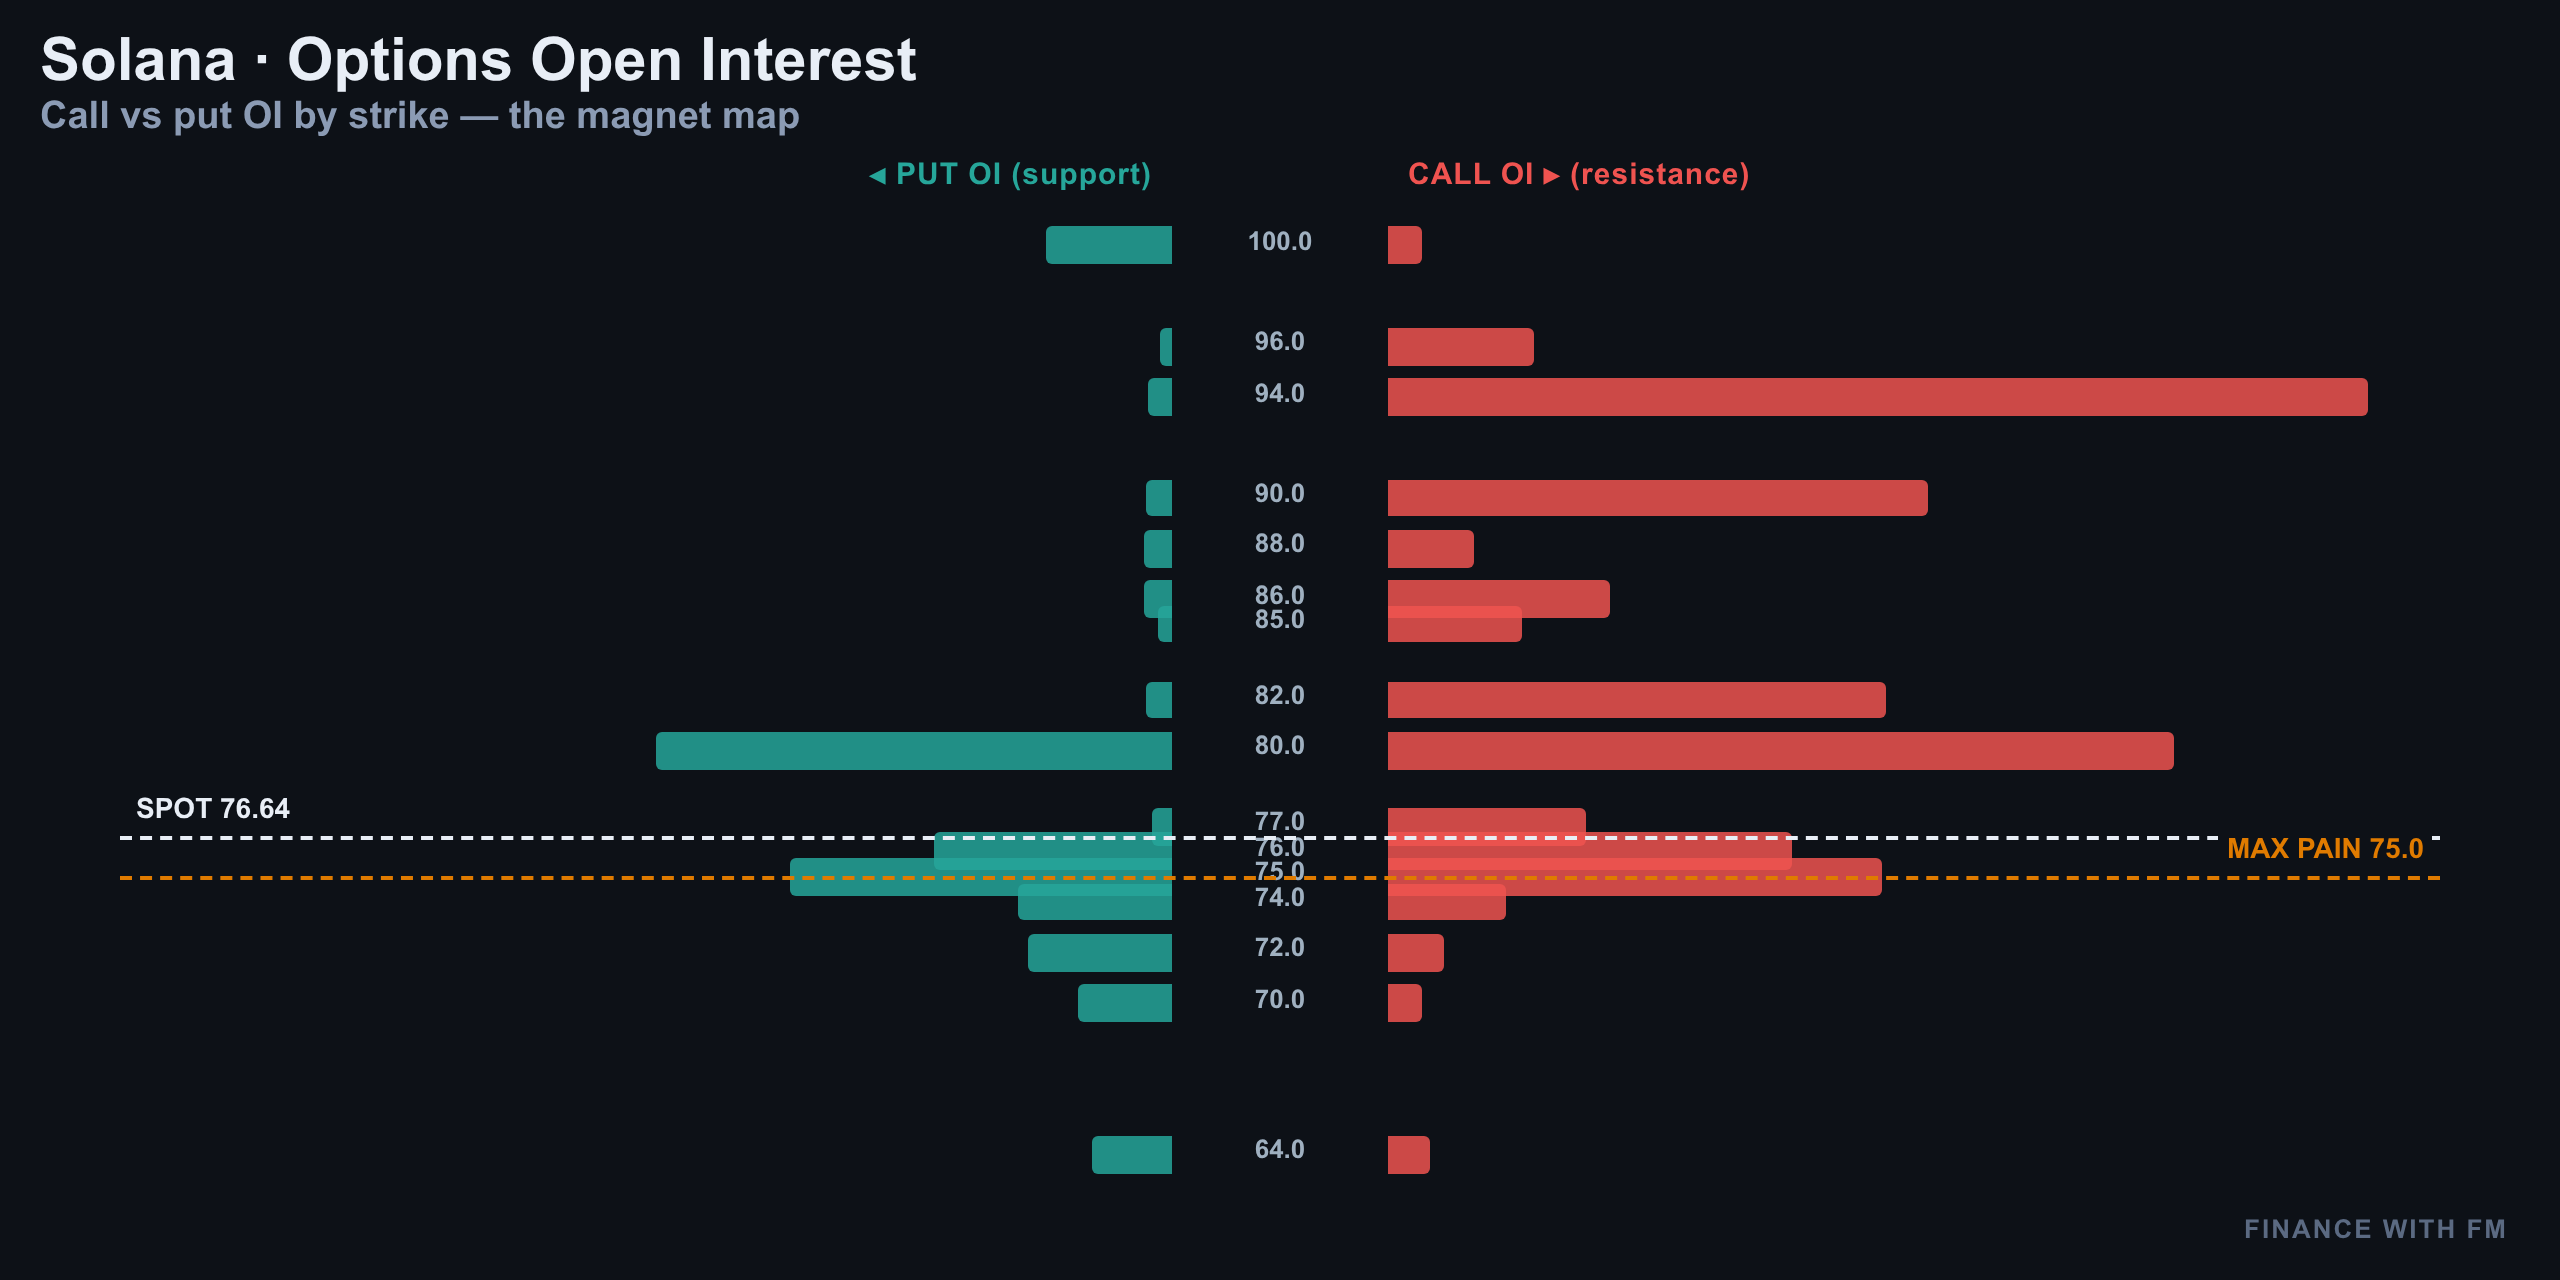
Max pain for the August 16 expiry sits right at $75.00 — a magnet that keeps pulling price back toward it as expiry approaches. The call wall overhead is way up at $94, while the put wall reinforces the floor at $75, effectively boxing price in from both directions.
| Metric | Value |
|---|---|
| Implied Volatility (IV) | 39.6% |
| Realized Volatility (RV) | 31.3% |
| Vol-Risk-Premium | +8.4 pts |
| Put/Call Ratio (Open Interest) | 0.47 |
| Put/Call Ratio (Volume) | 0.90 |
| 25-Delta Skew | -2.0% |
| Max Pain (Aug 16) | $75.00 |
| Call Wall | $94.00 |
| Put Wall | $75.00 |
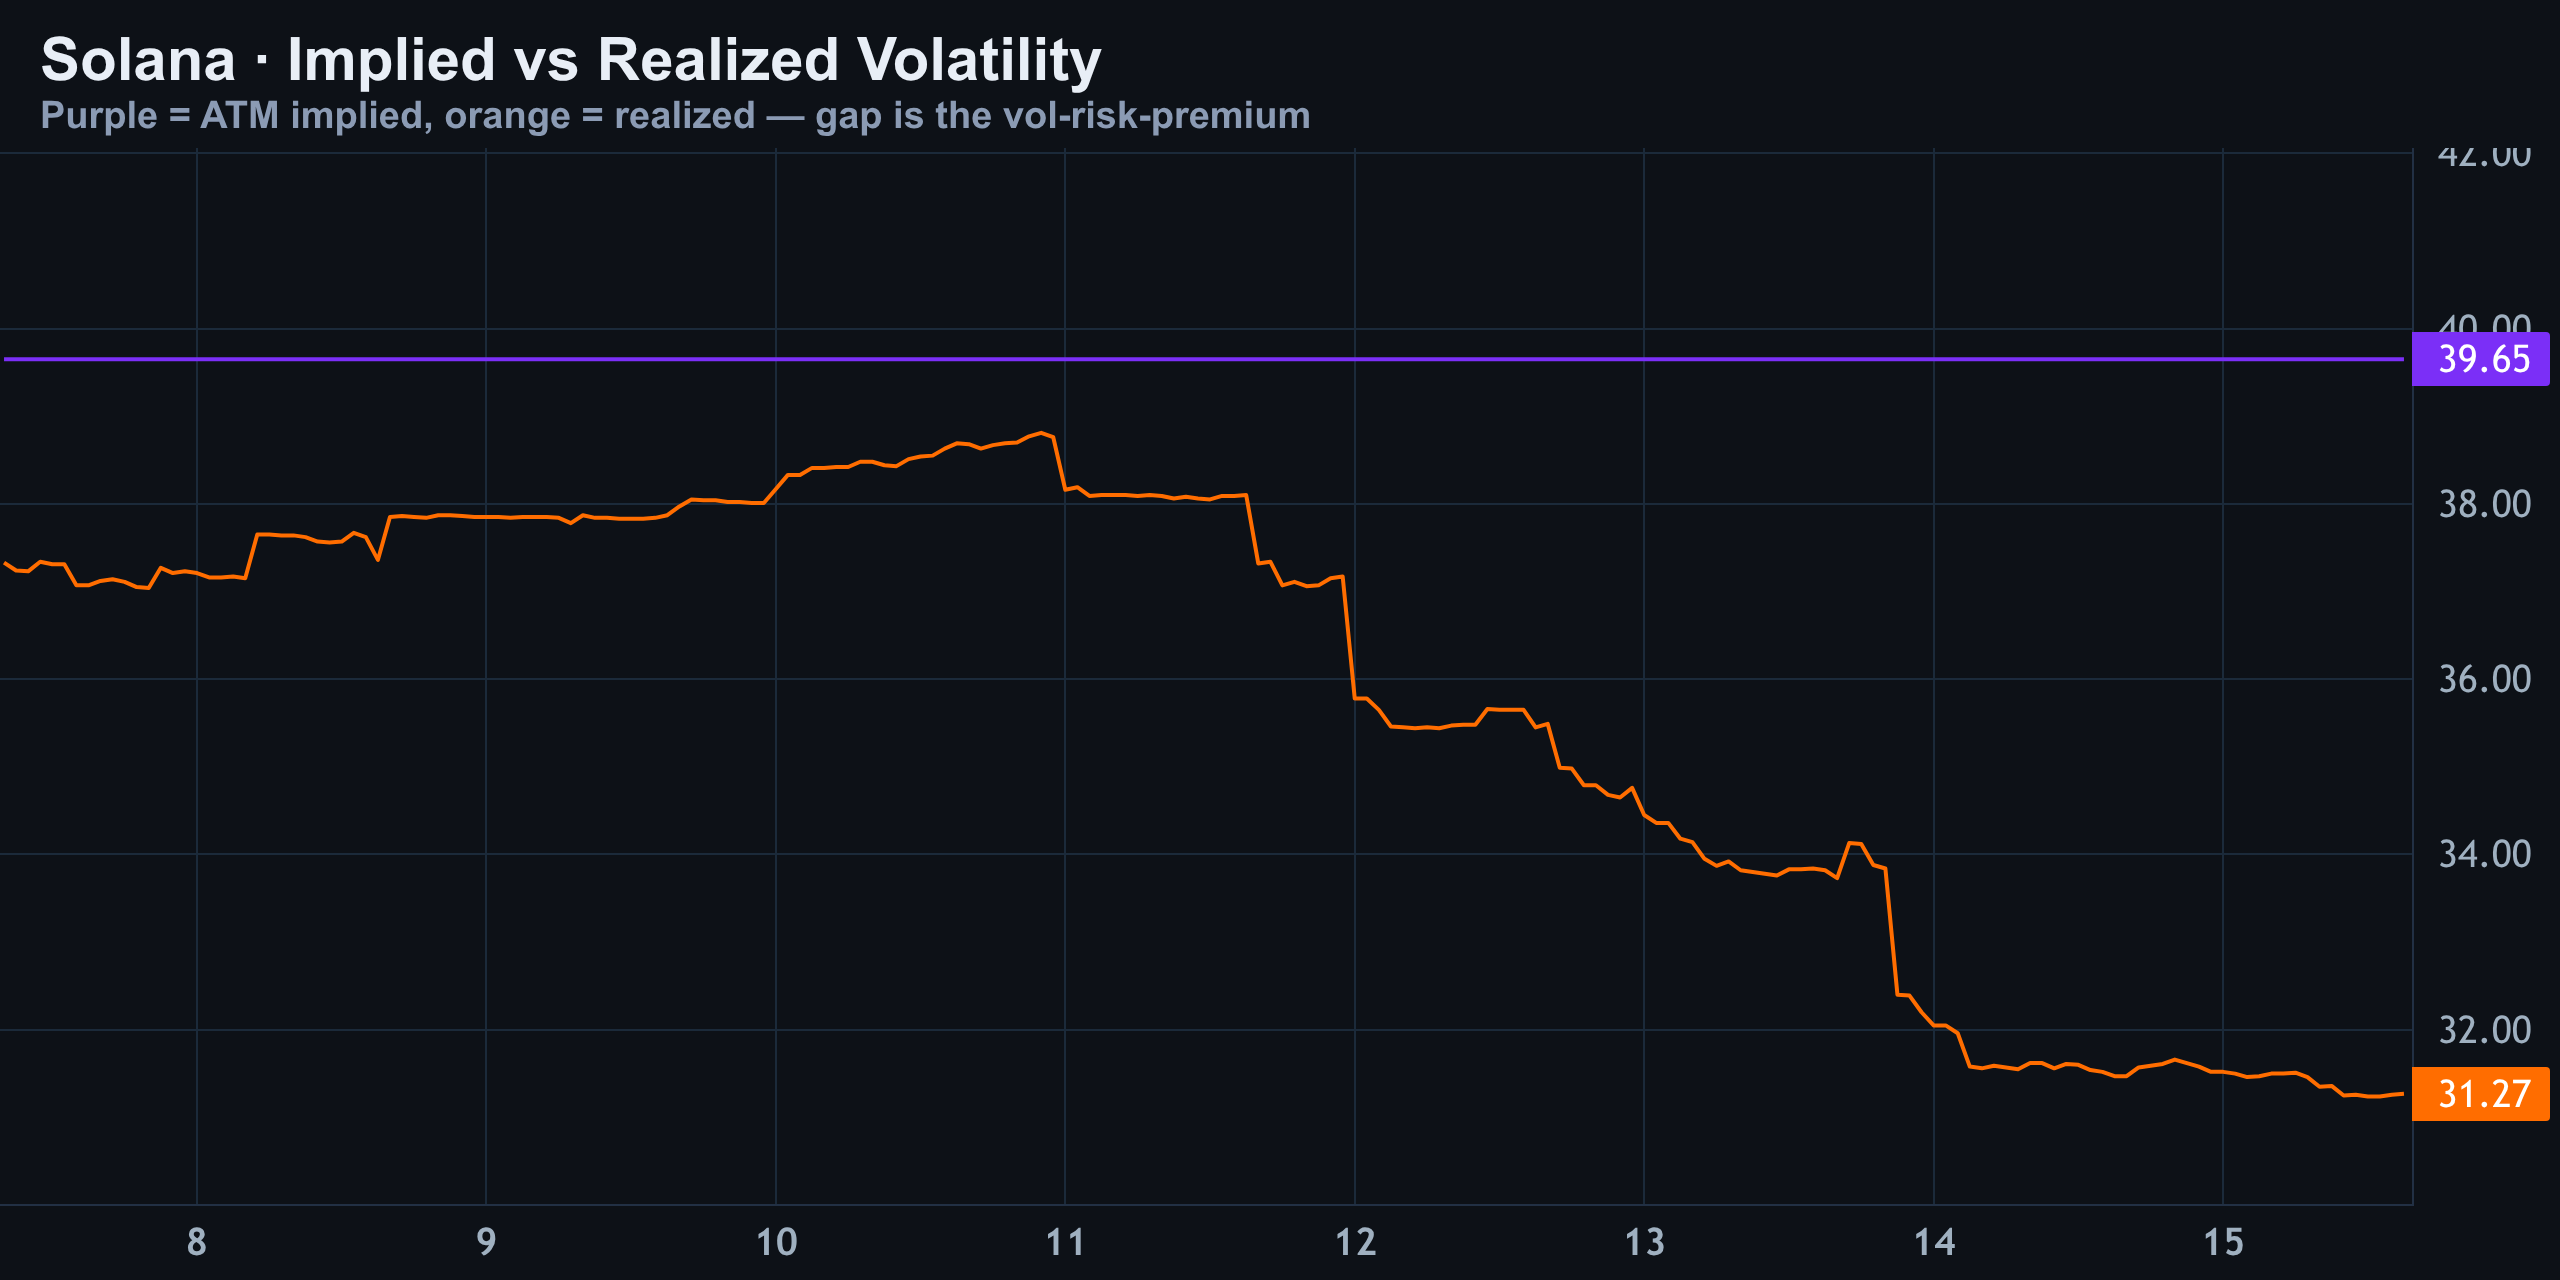
Implied volatility running near 40% against realized volatility closer to 31% means a vol-risk-premium of roughly 8 points — in plain terms, options are pricing in more movement than Solana is actually delivering right now. That makes buying options here a statistically expensive bet.
The Skew Tells a Different Story Than the Chop
The 25-delta skew reads negative 2%, meaning calls are bid richer than puts. Traders are paying up for upside exposure, not downside protection — a quiet bullish tell hiding underneath an otherwise calm tape.
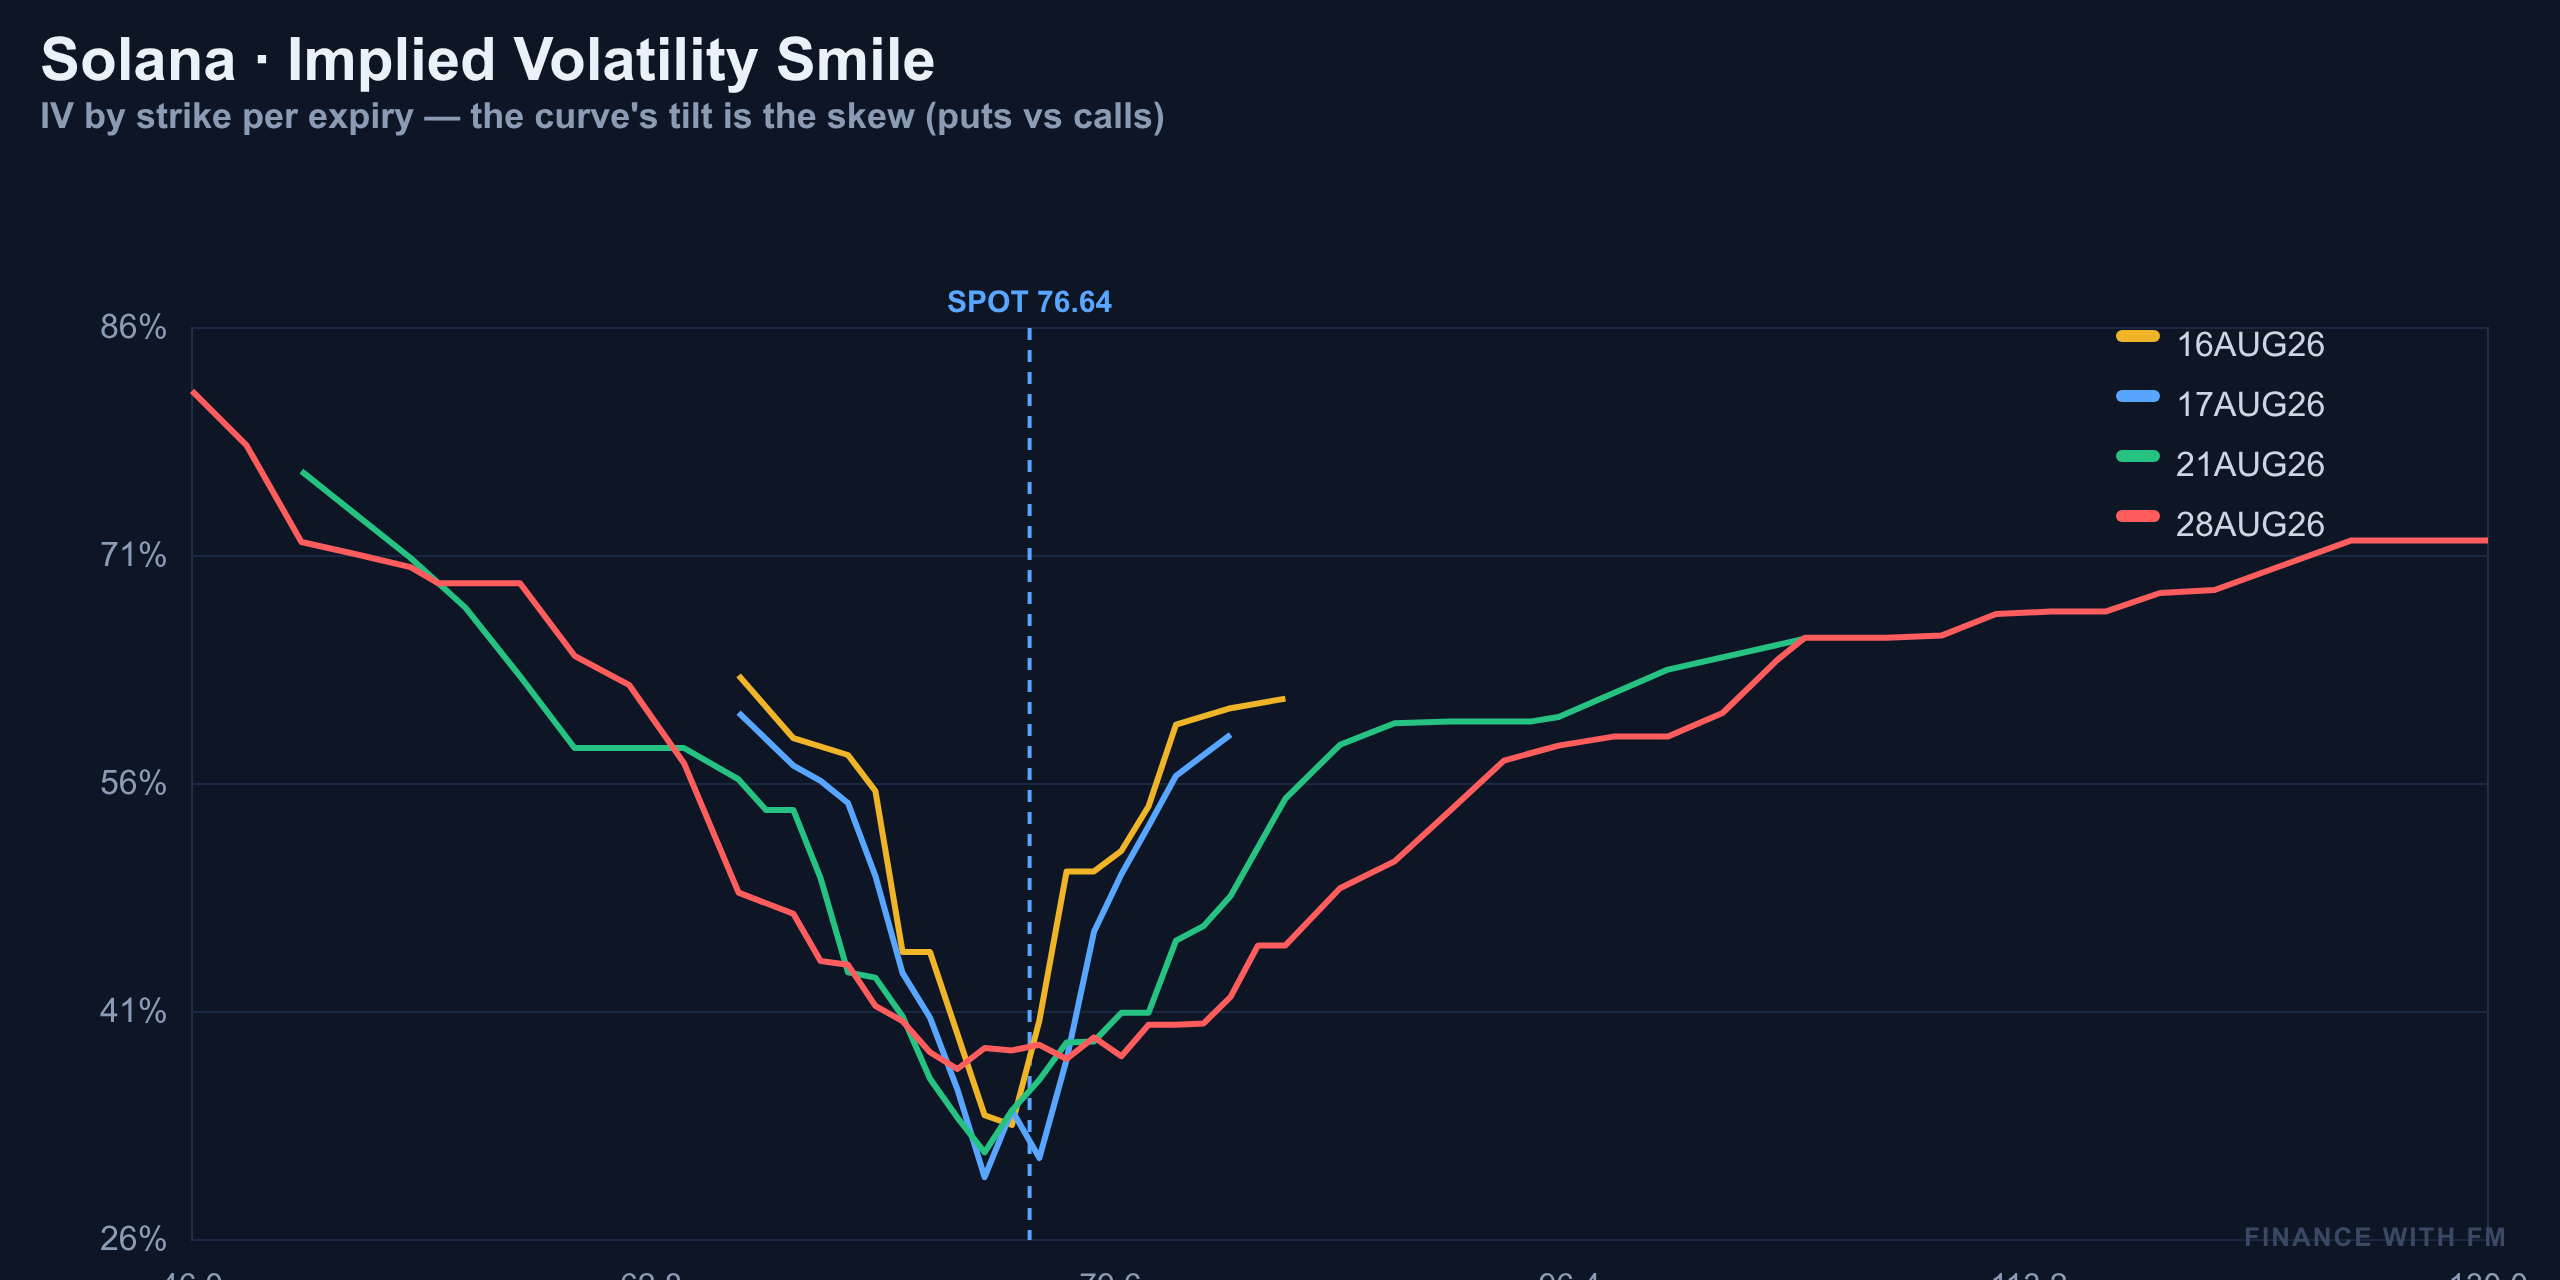
This is unusual for crypto. Normally, fear of downside keeps puts bid richer than calls. A negative skew here tells you dealers and traders see more asymmetric upside risk building over the next stretch — even while spot itself just chops sideways in the mid-$70s.
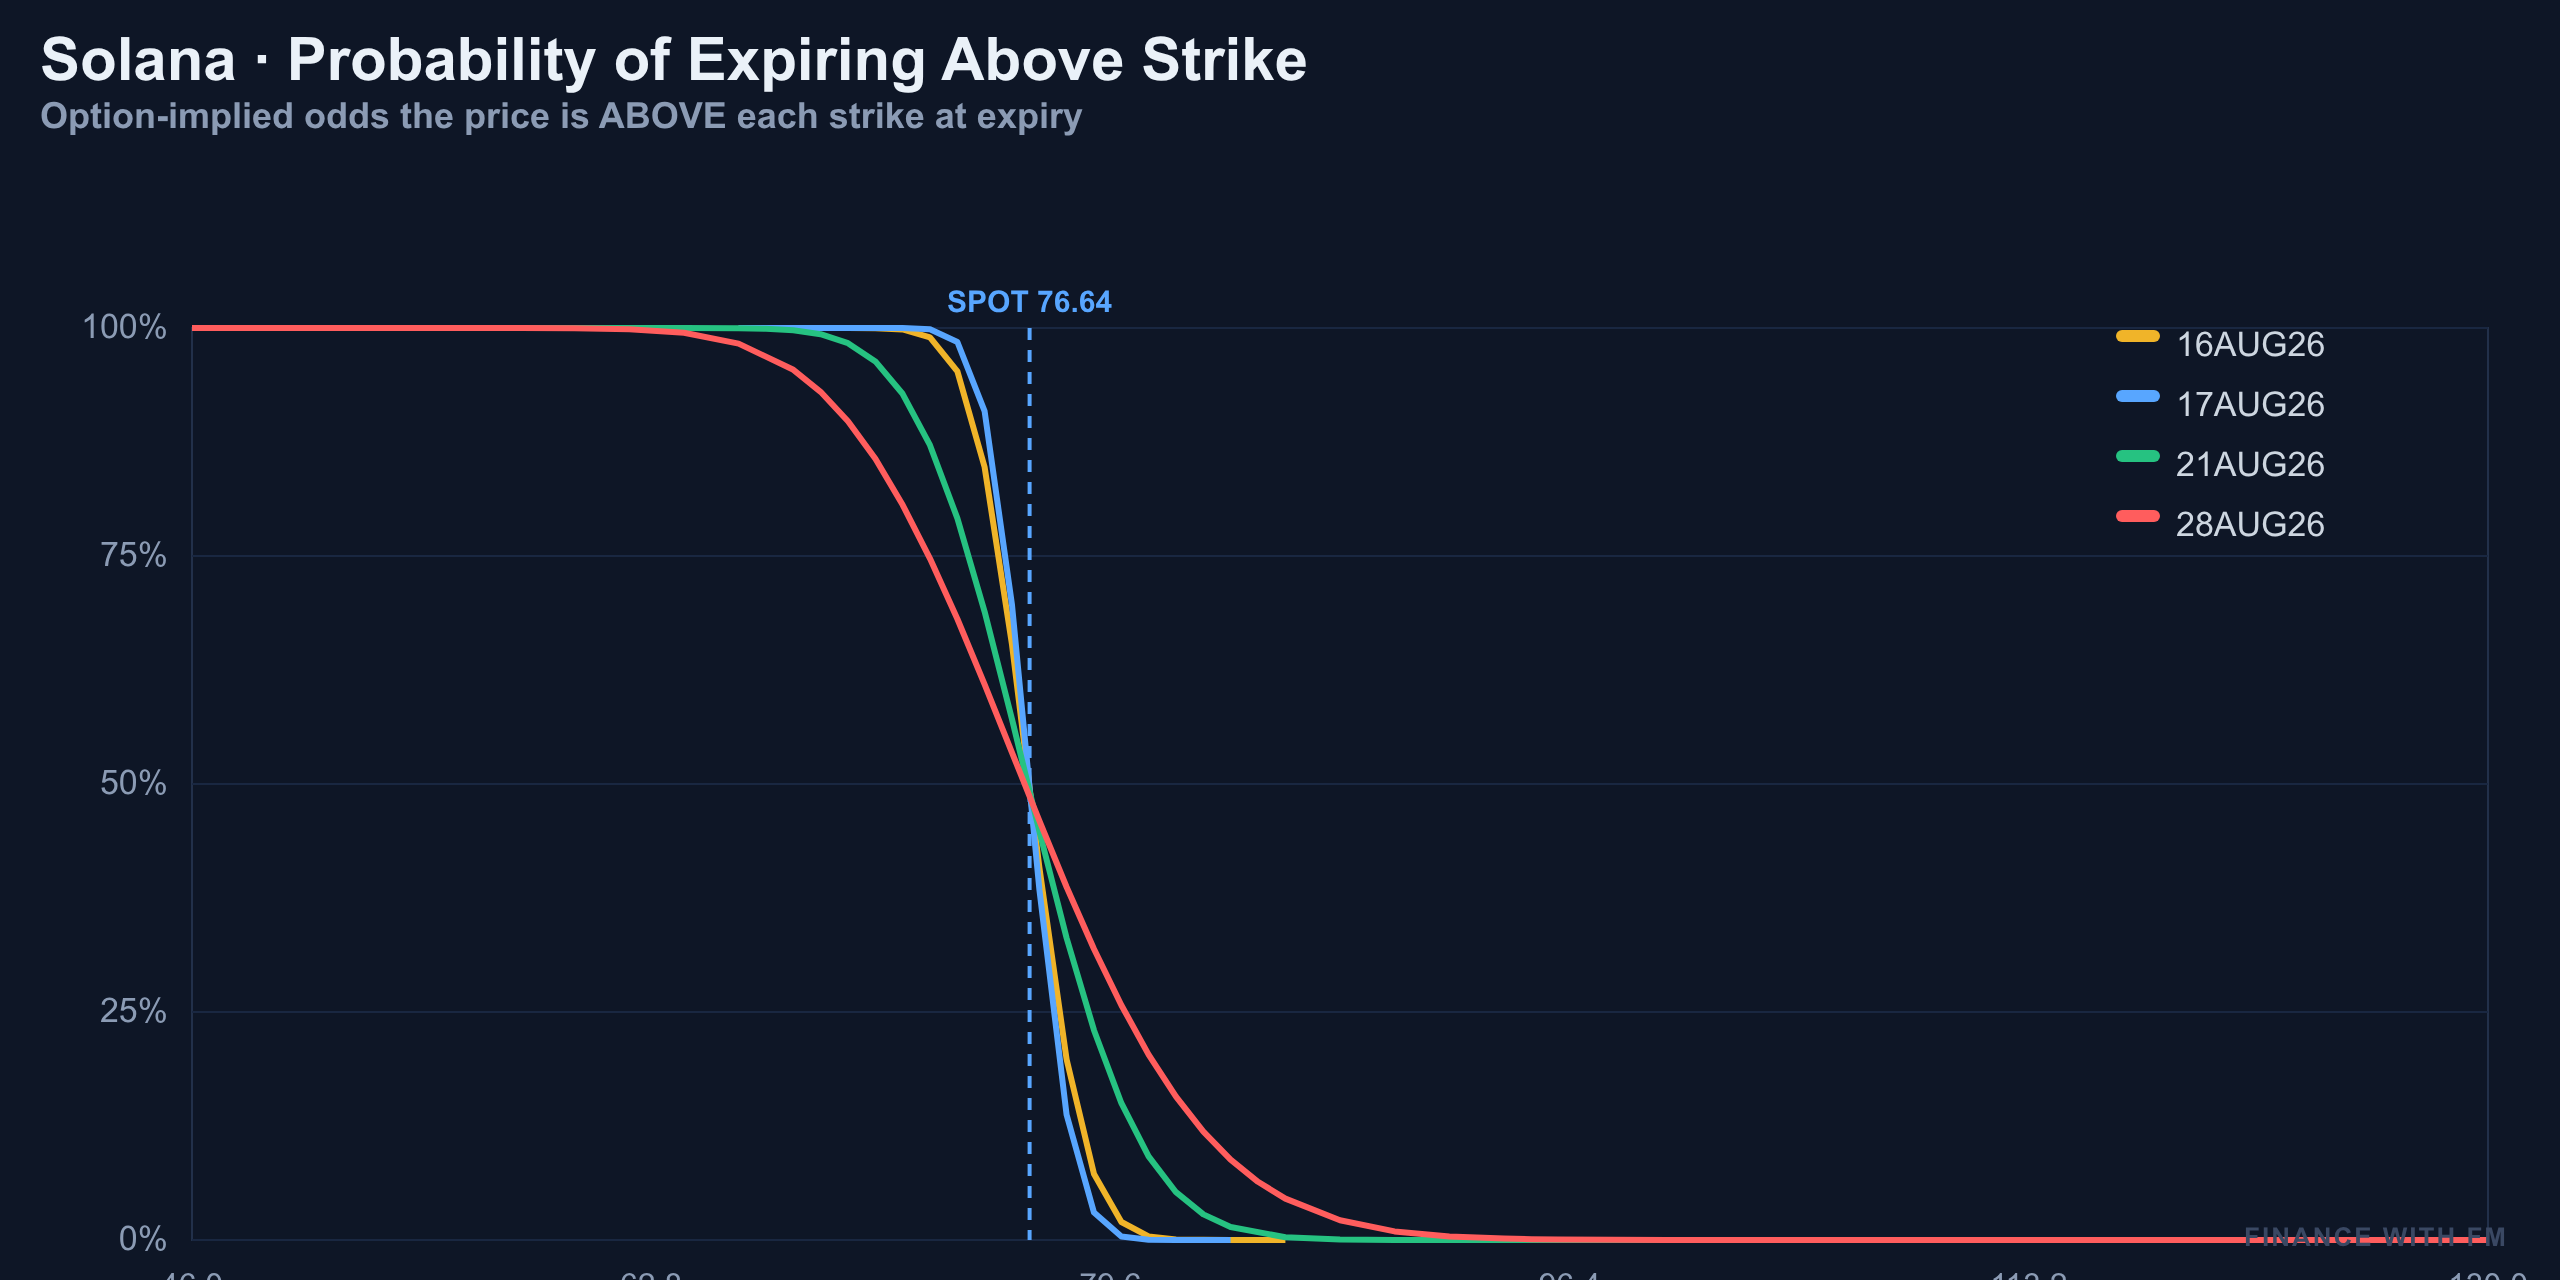
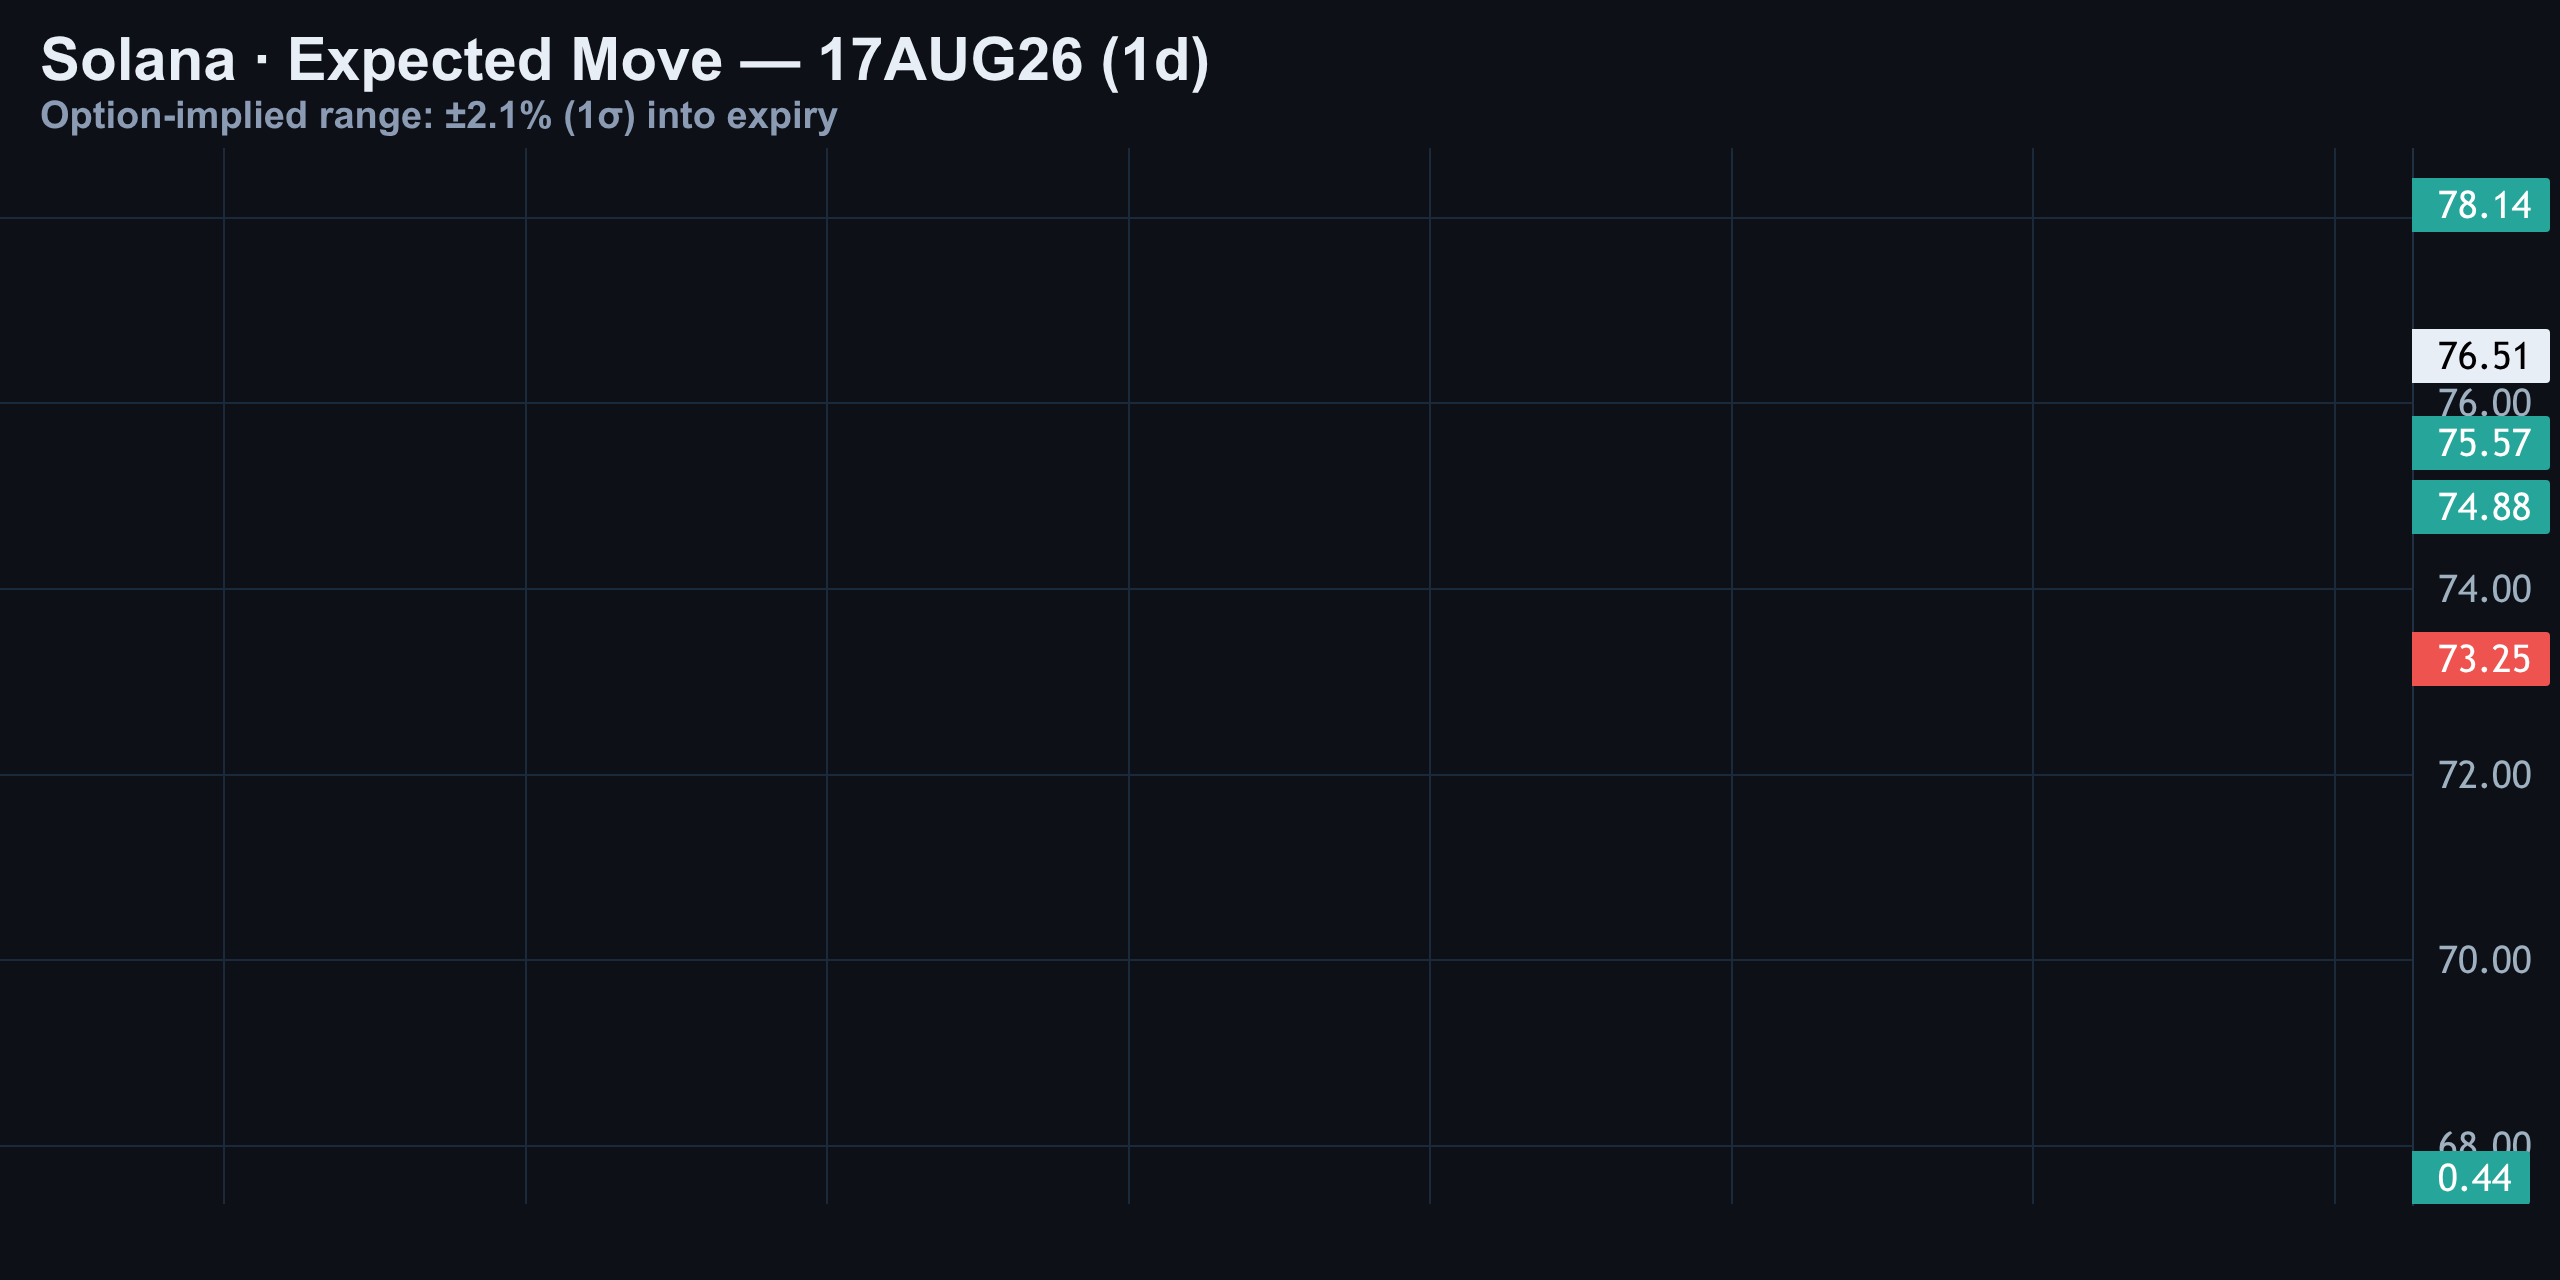
Zoom out to the August 28 expiry and the options market gives Solana only about a 9% chance of trading above $84 — a low-probability tail bet. Closer in, tomorrow's expected move is plus or minus roughly 2.1%, putting a one-sigma range around $75–$78.
Expected Move: The Band Where the Real Trade Isn't
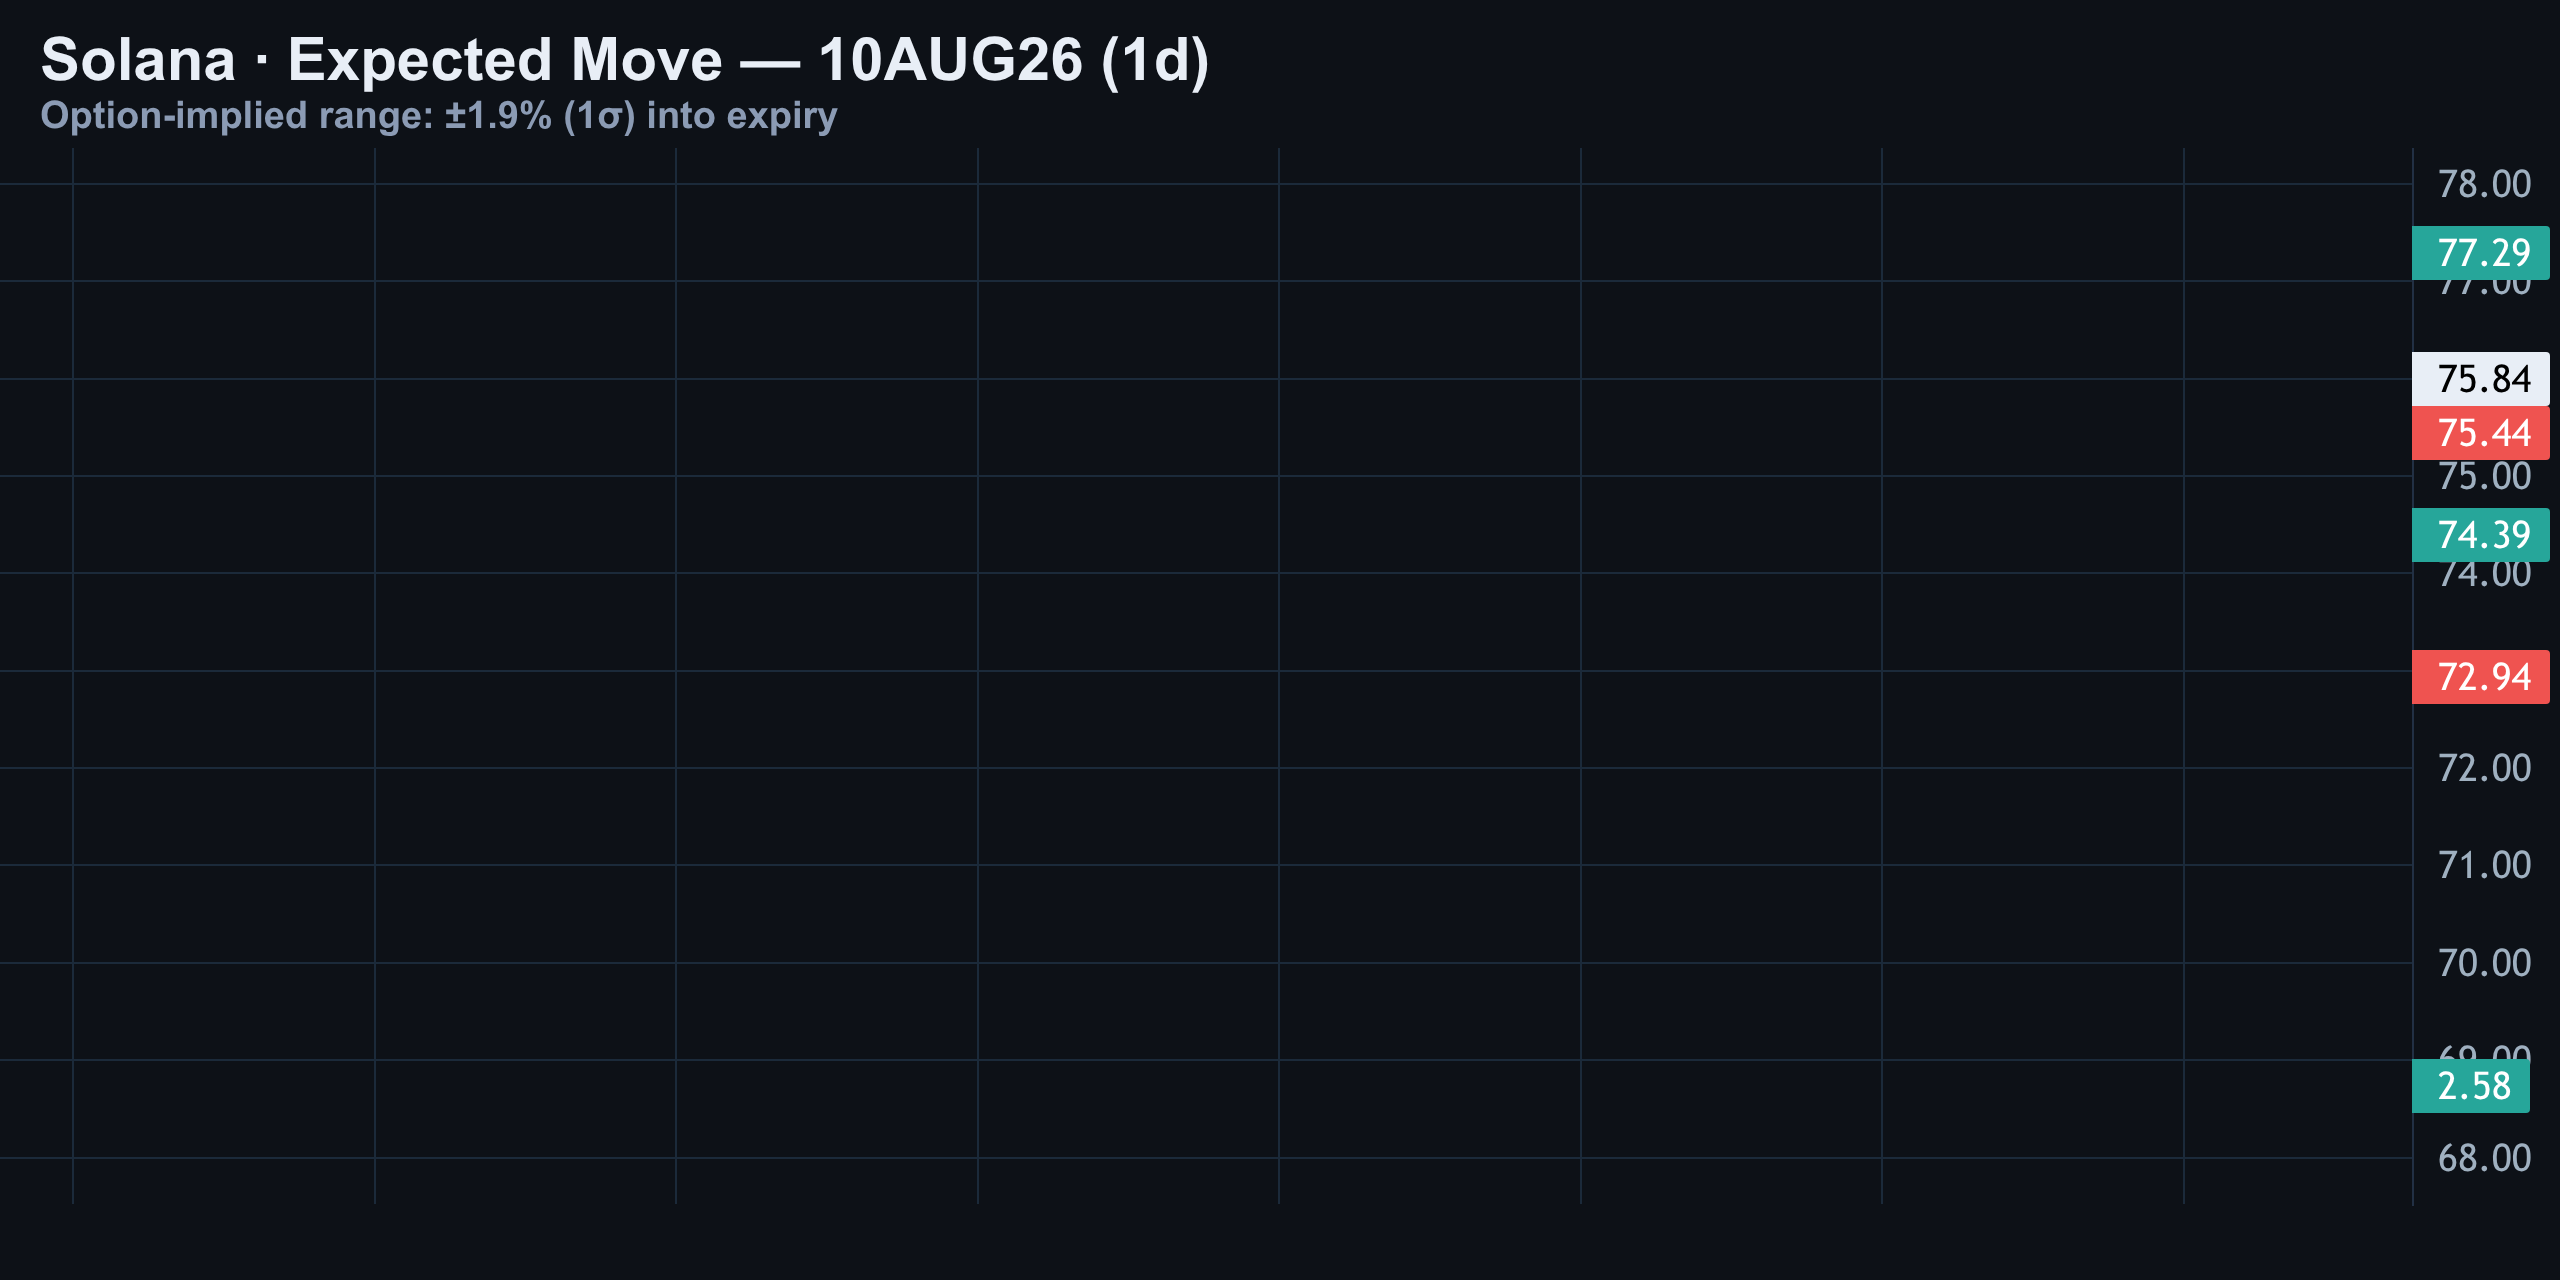
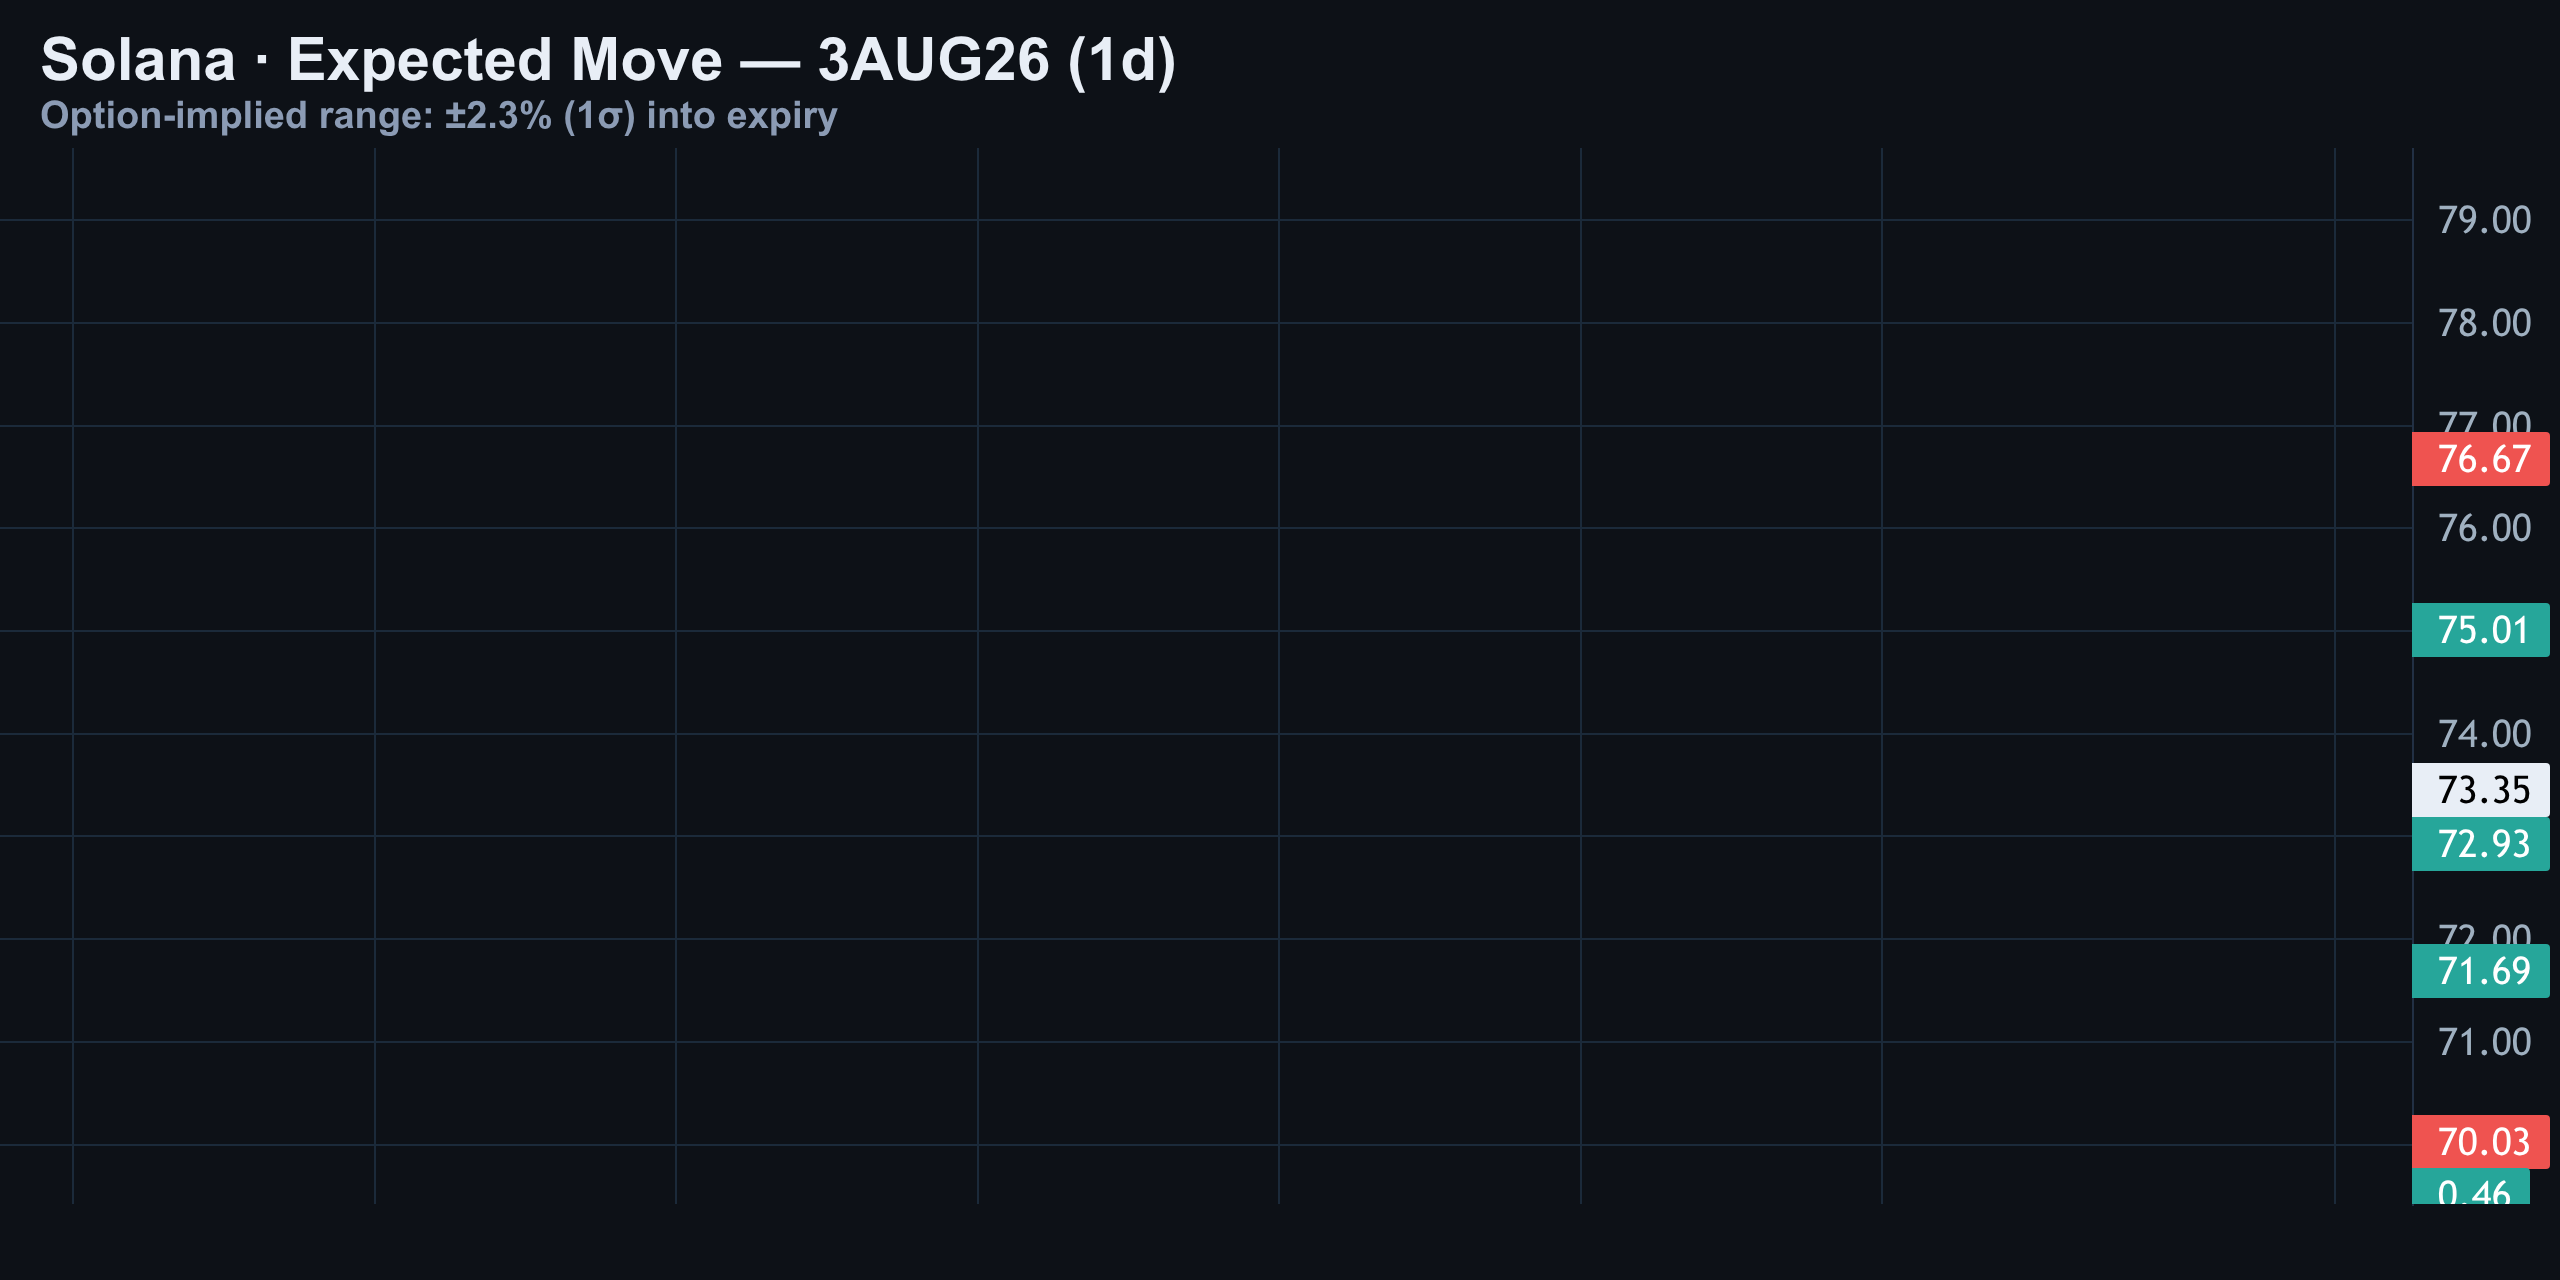
Options pricing gives us a statistical fence around tomorrow's action. The one-sigma range (roughly 68% probability) spans $75 to $78. The two-sigma range — about a 95% probability zone — spans $73 to $80.
| Range | Probability | Price Band |
|---|---|---|
| 1-sigma (expected move) | ~68% | $75.00 – $78.00 |
| 2-sigma | ~95% | $73.00 – $80.00 |
| Above $84 (Aug 28 exp.) | ~9% | Tail bet |
Price Action: Chop on Every Timeframe
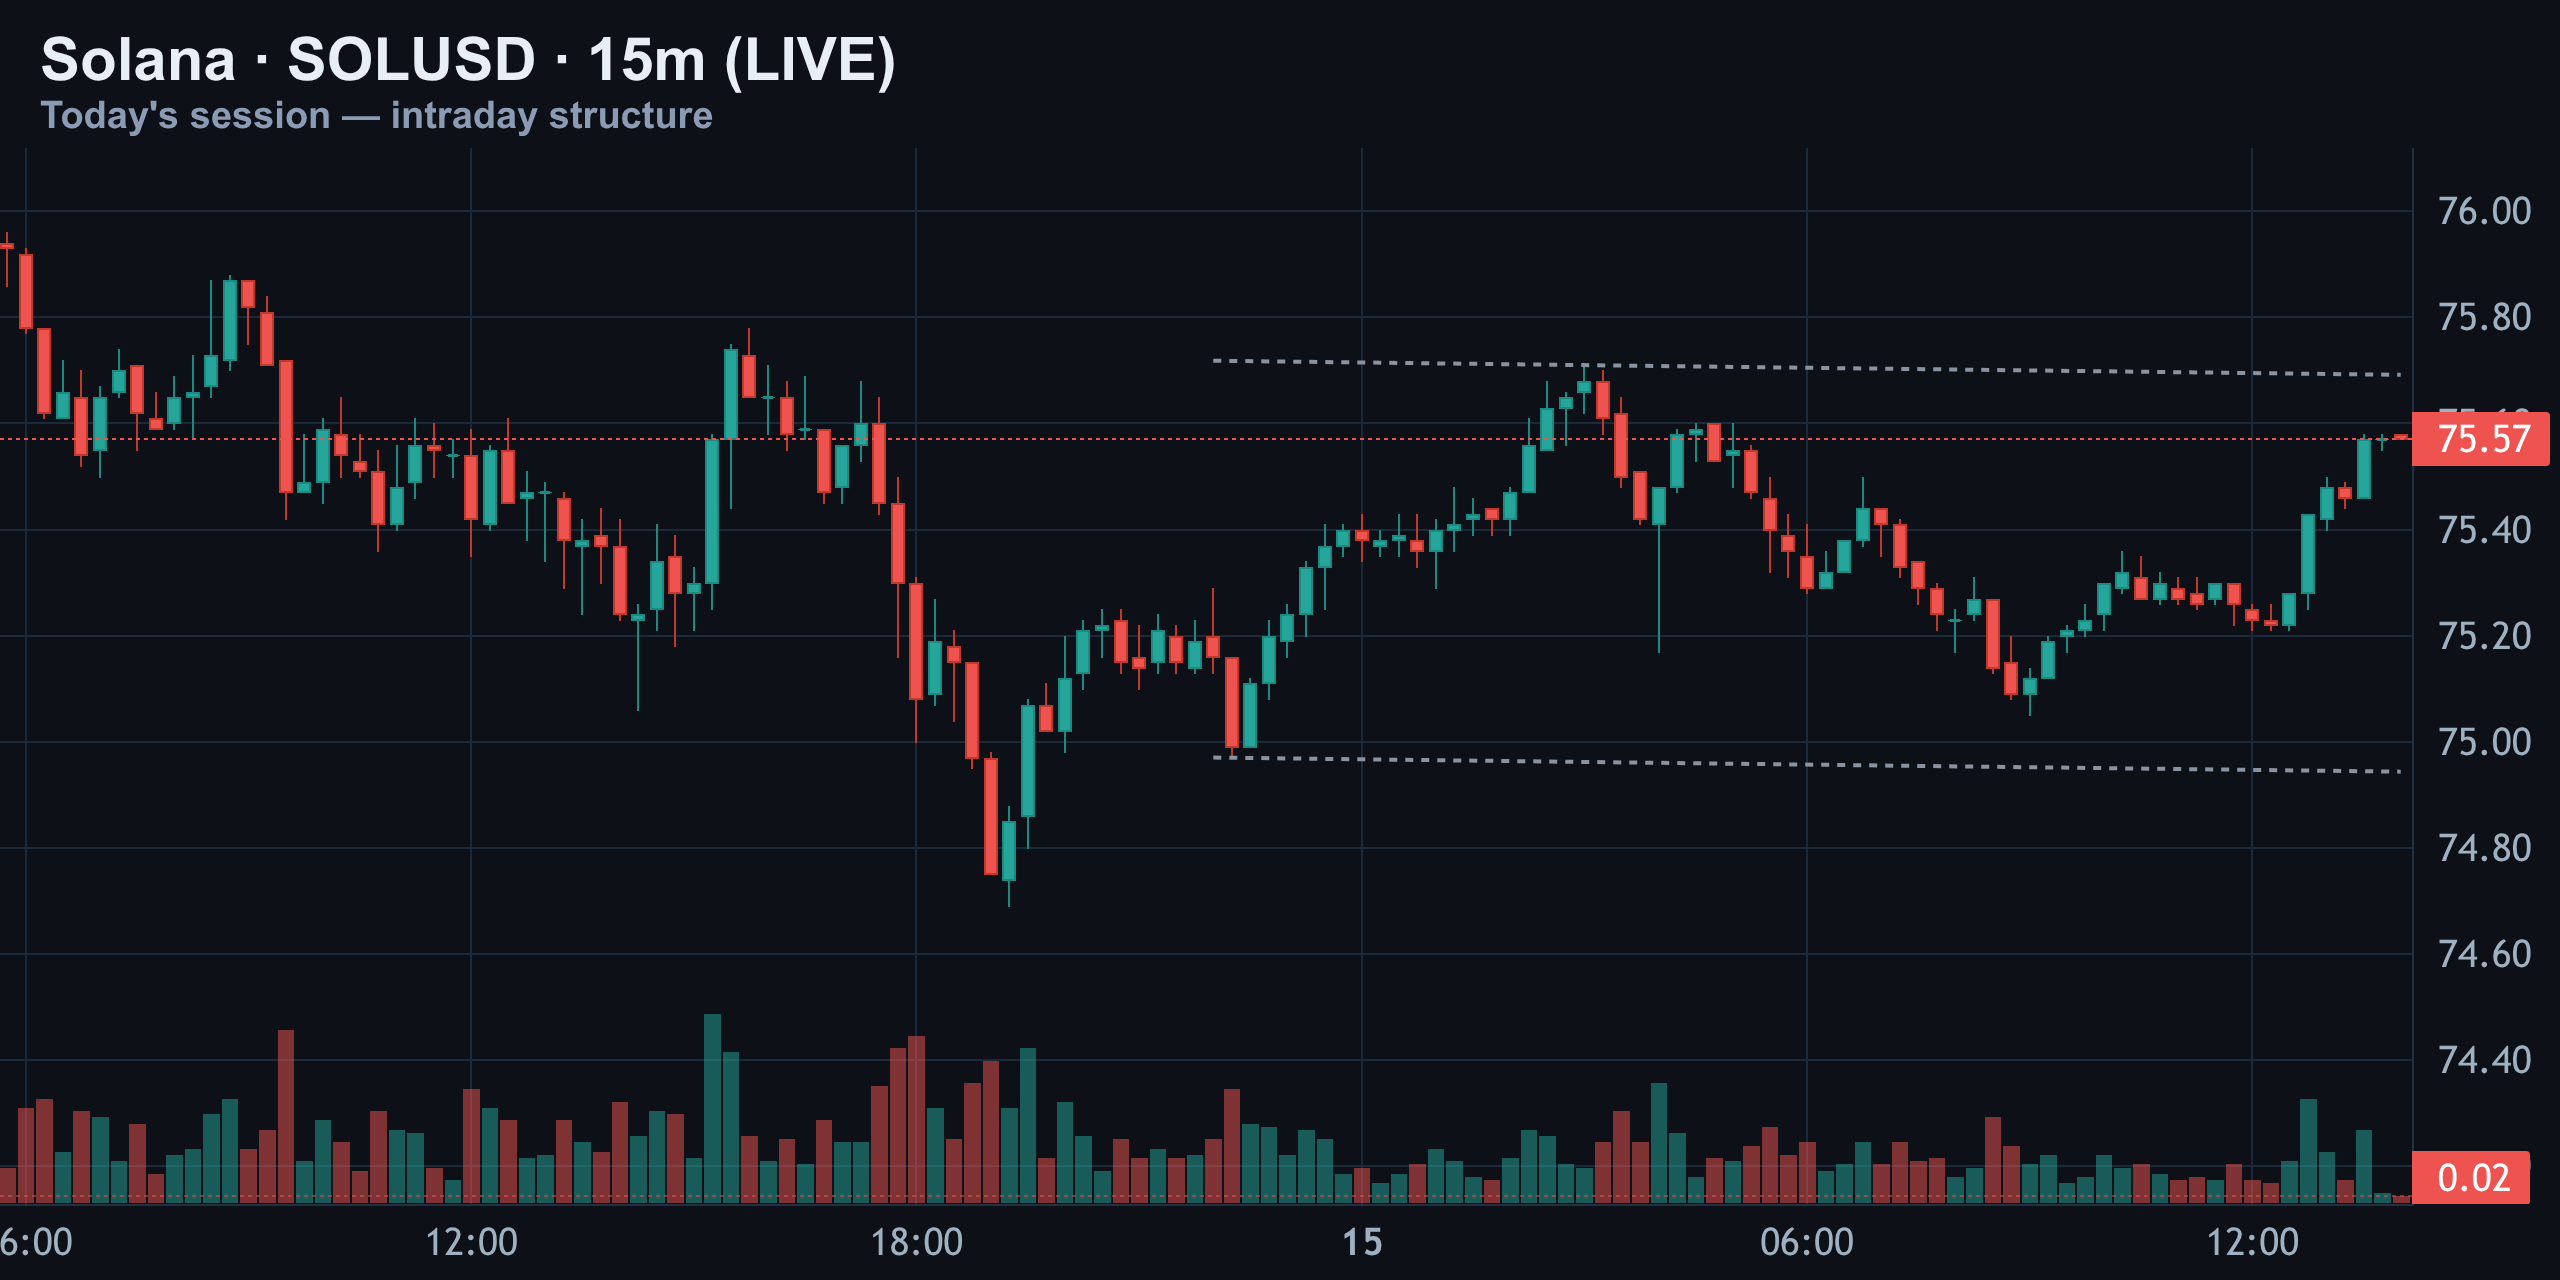
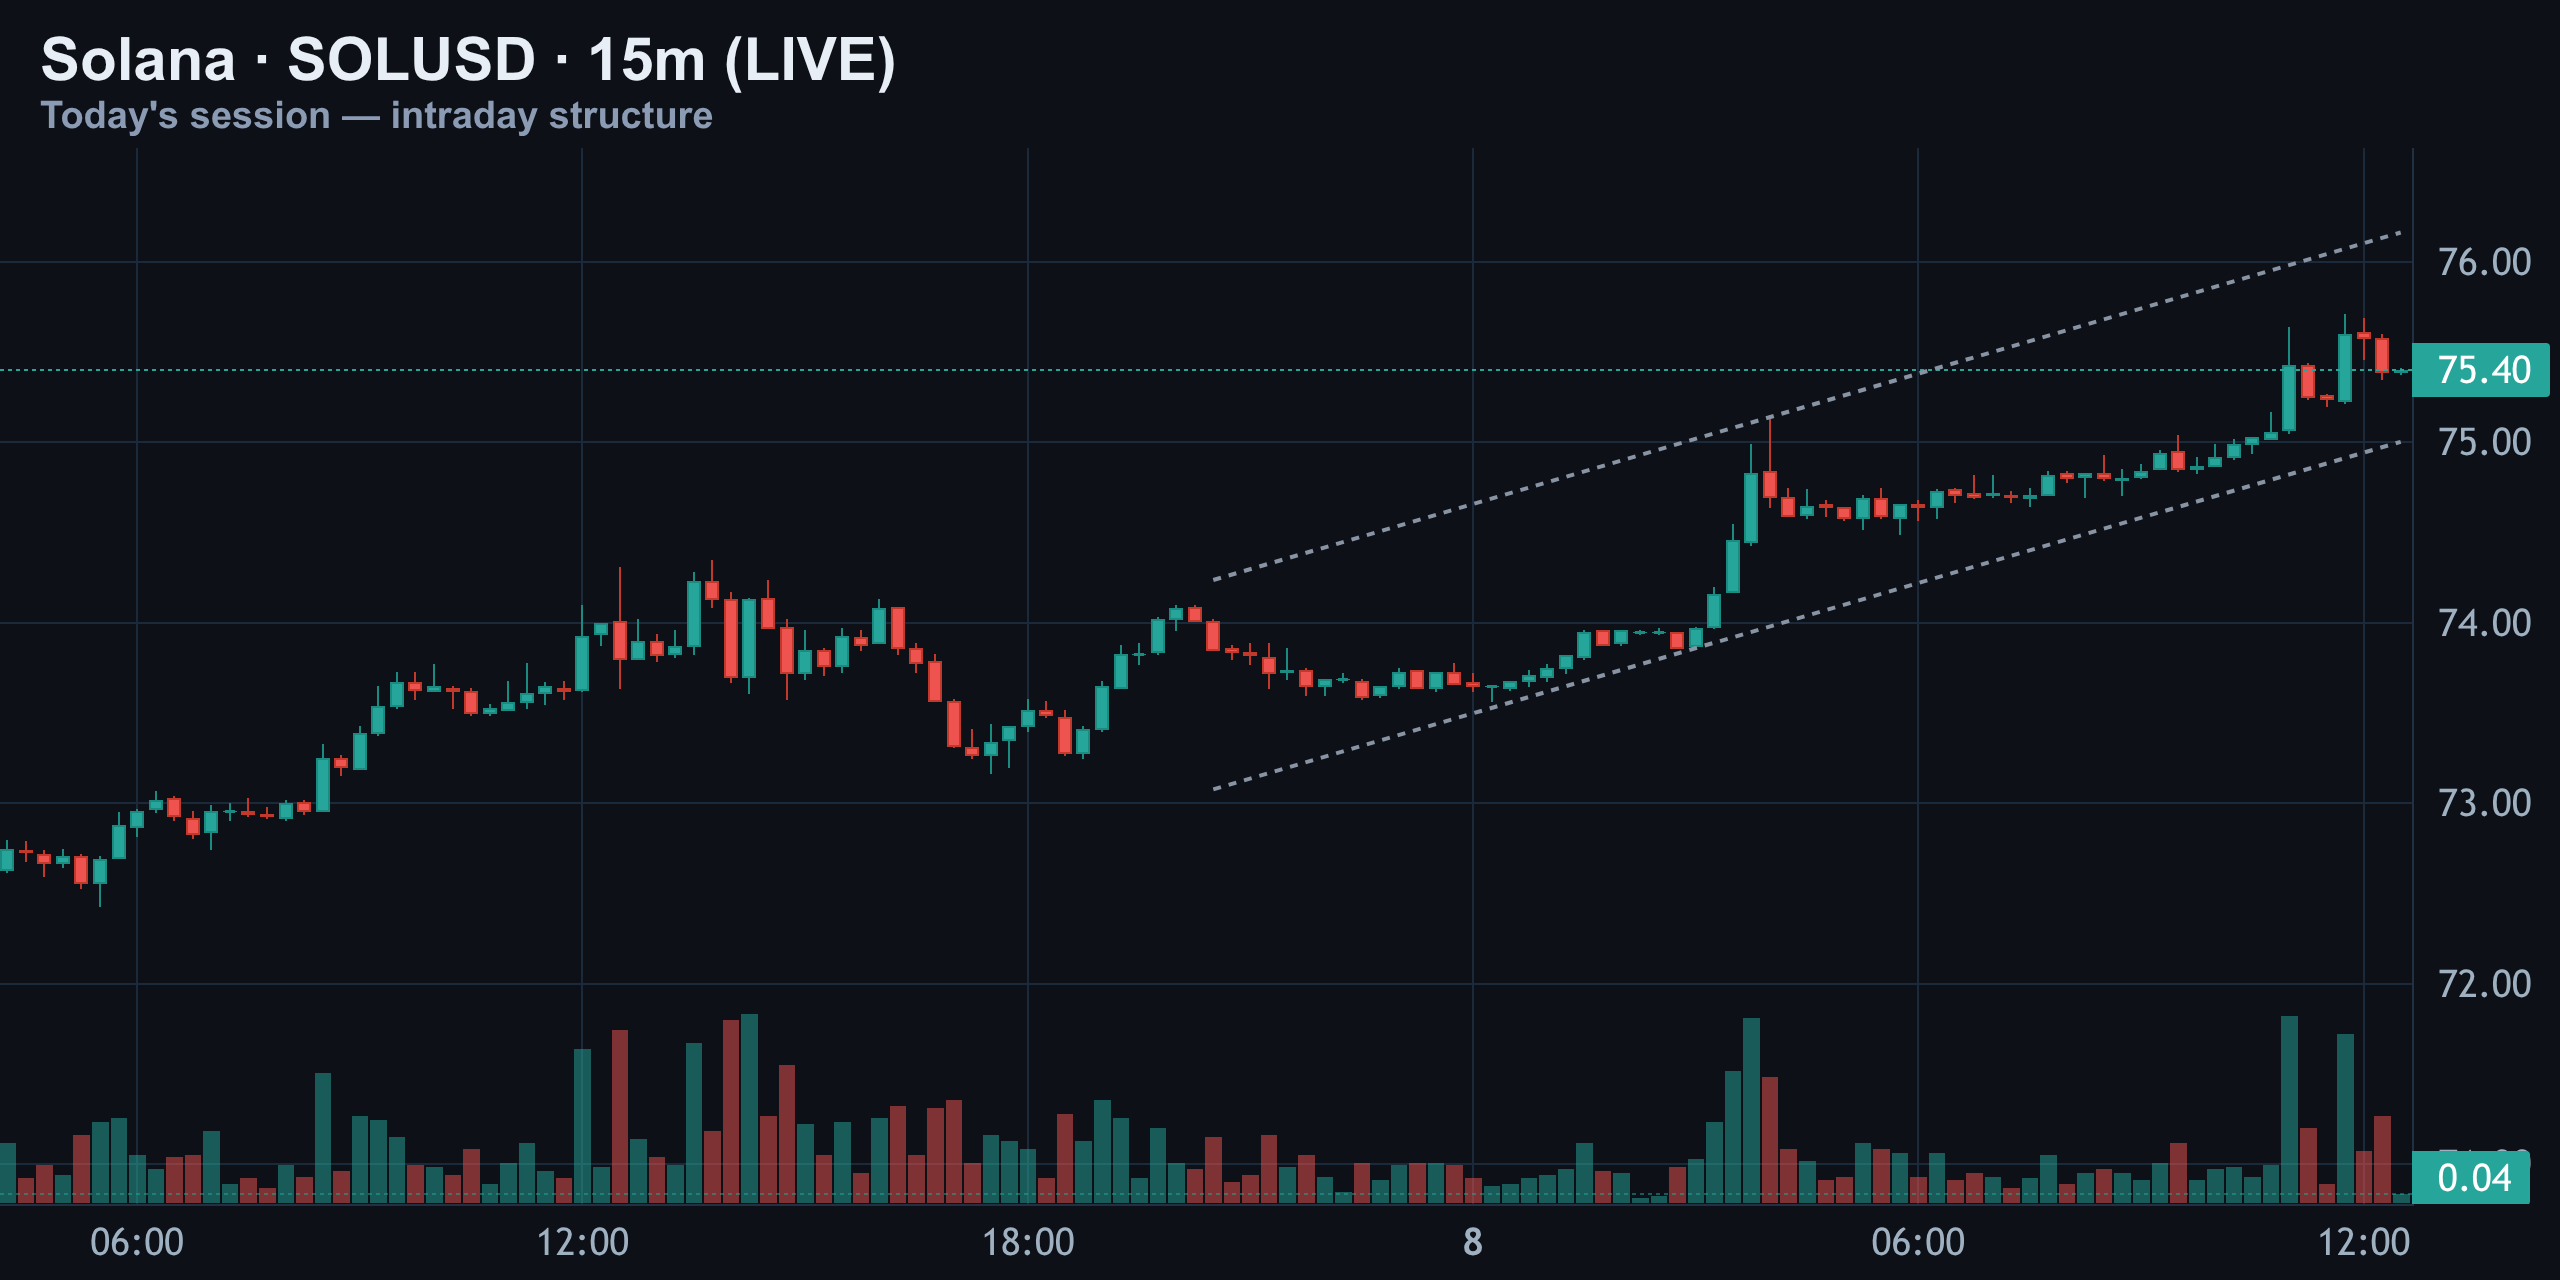
On the 15-minute chart, today was choppy, not directional. SOL opened near $75.70, wicked down hard to $74.75, then clawed back through $75.20, tagged resistance near $75.75 twice, pulled back to test support near $75.00, and is now grinding back to $75.57 — right at today's reference price. No clean breakout either way, just liquidity swept on both sides.
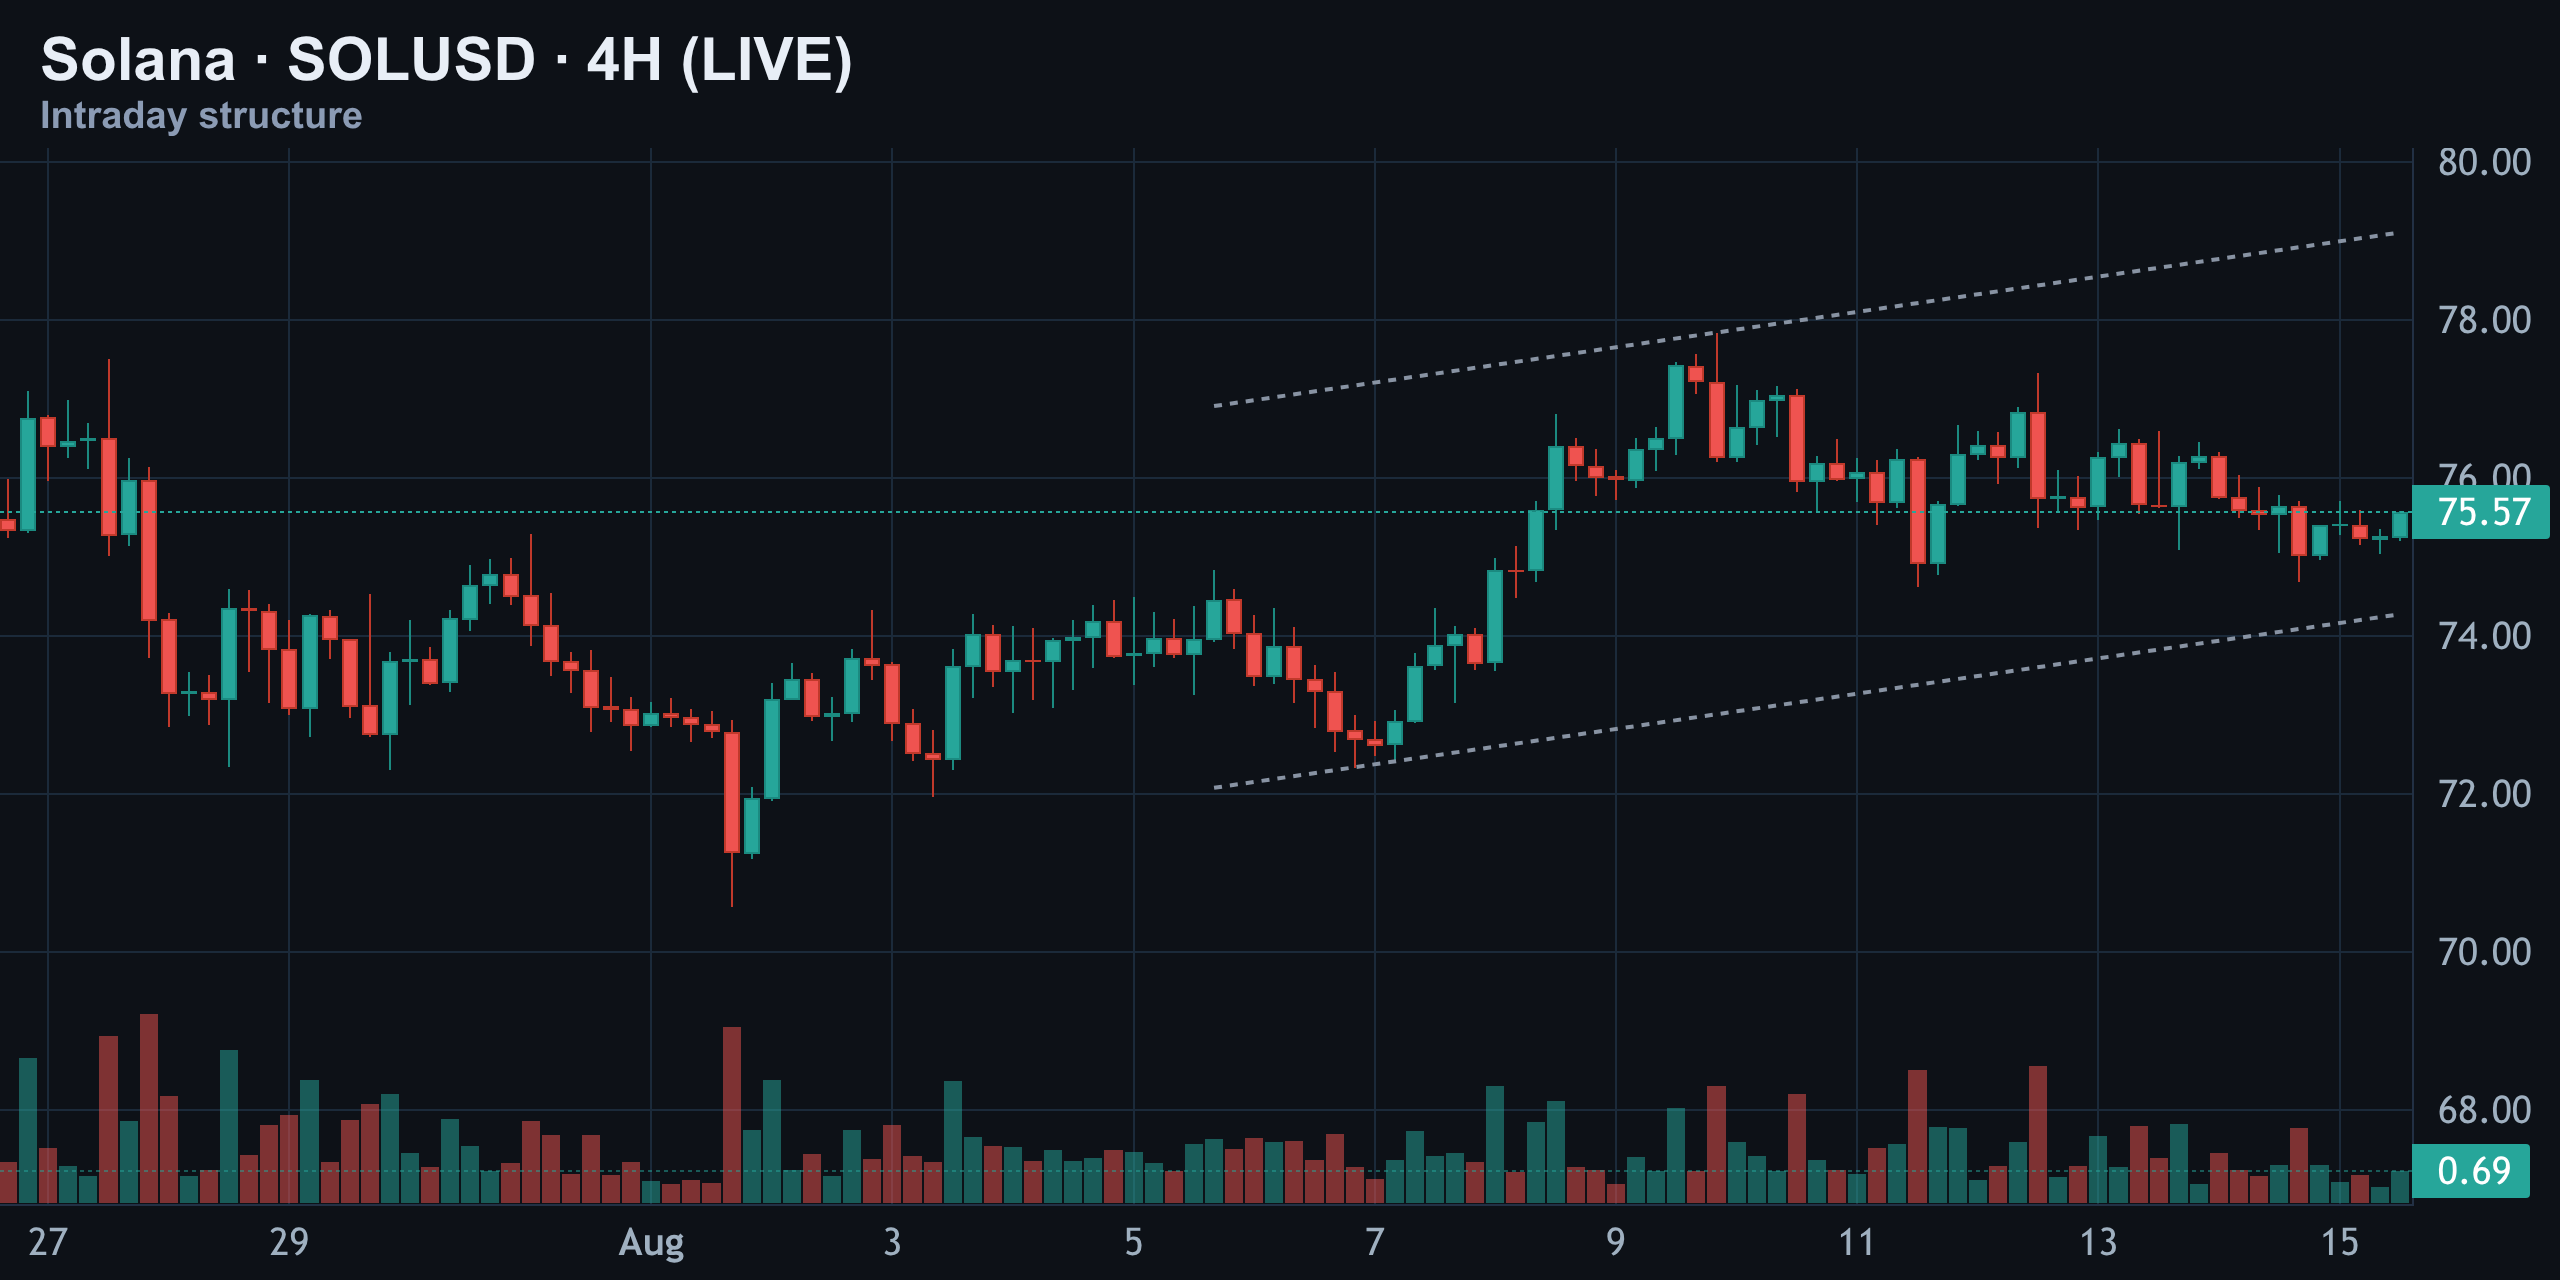
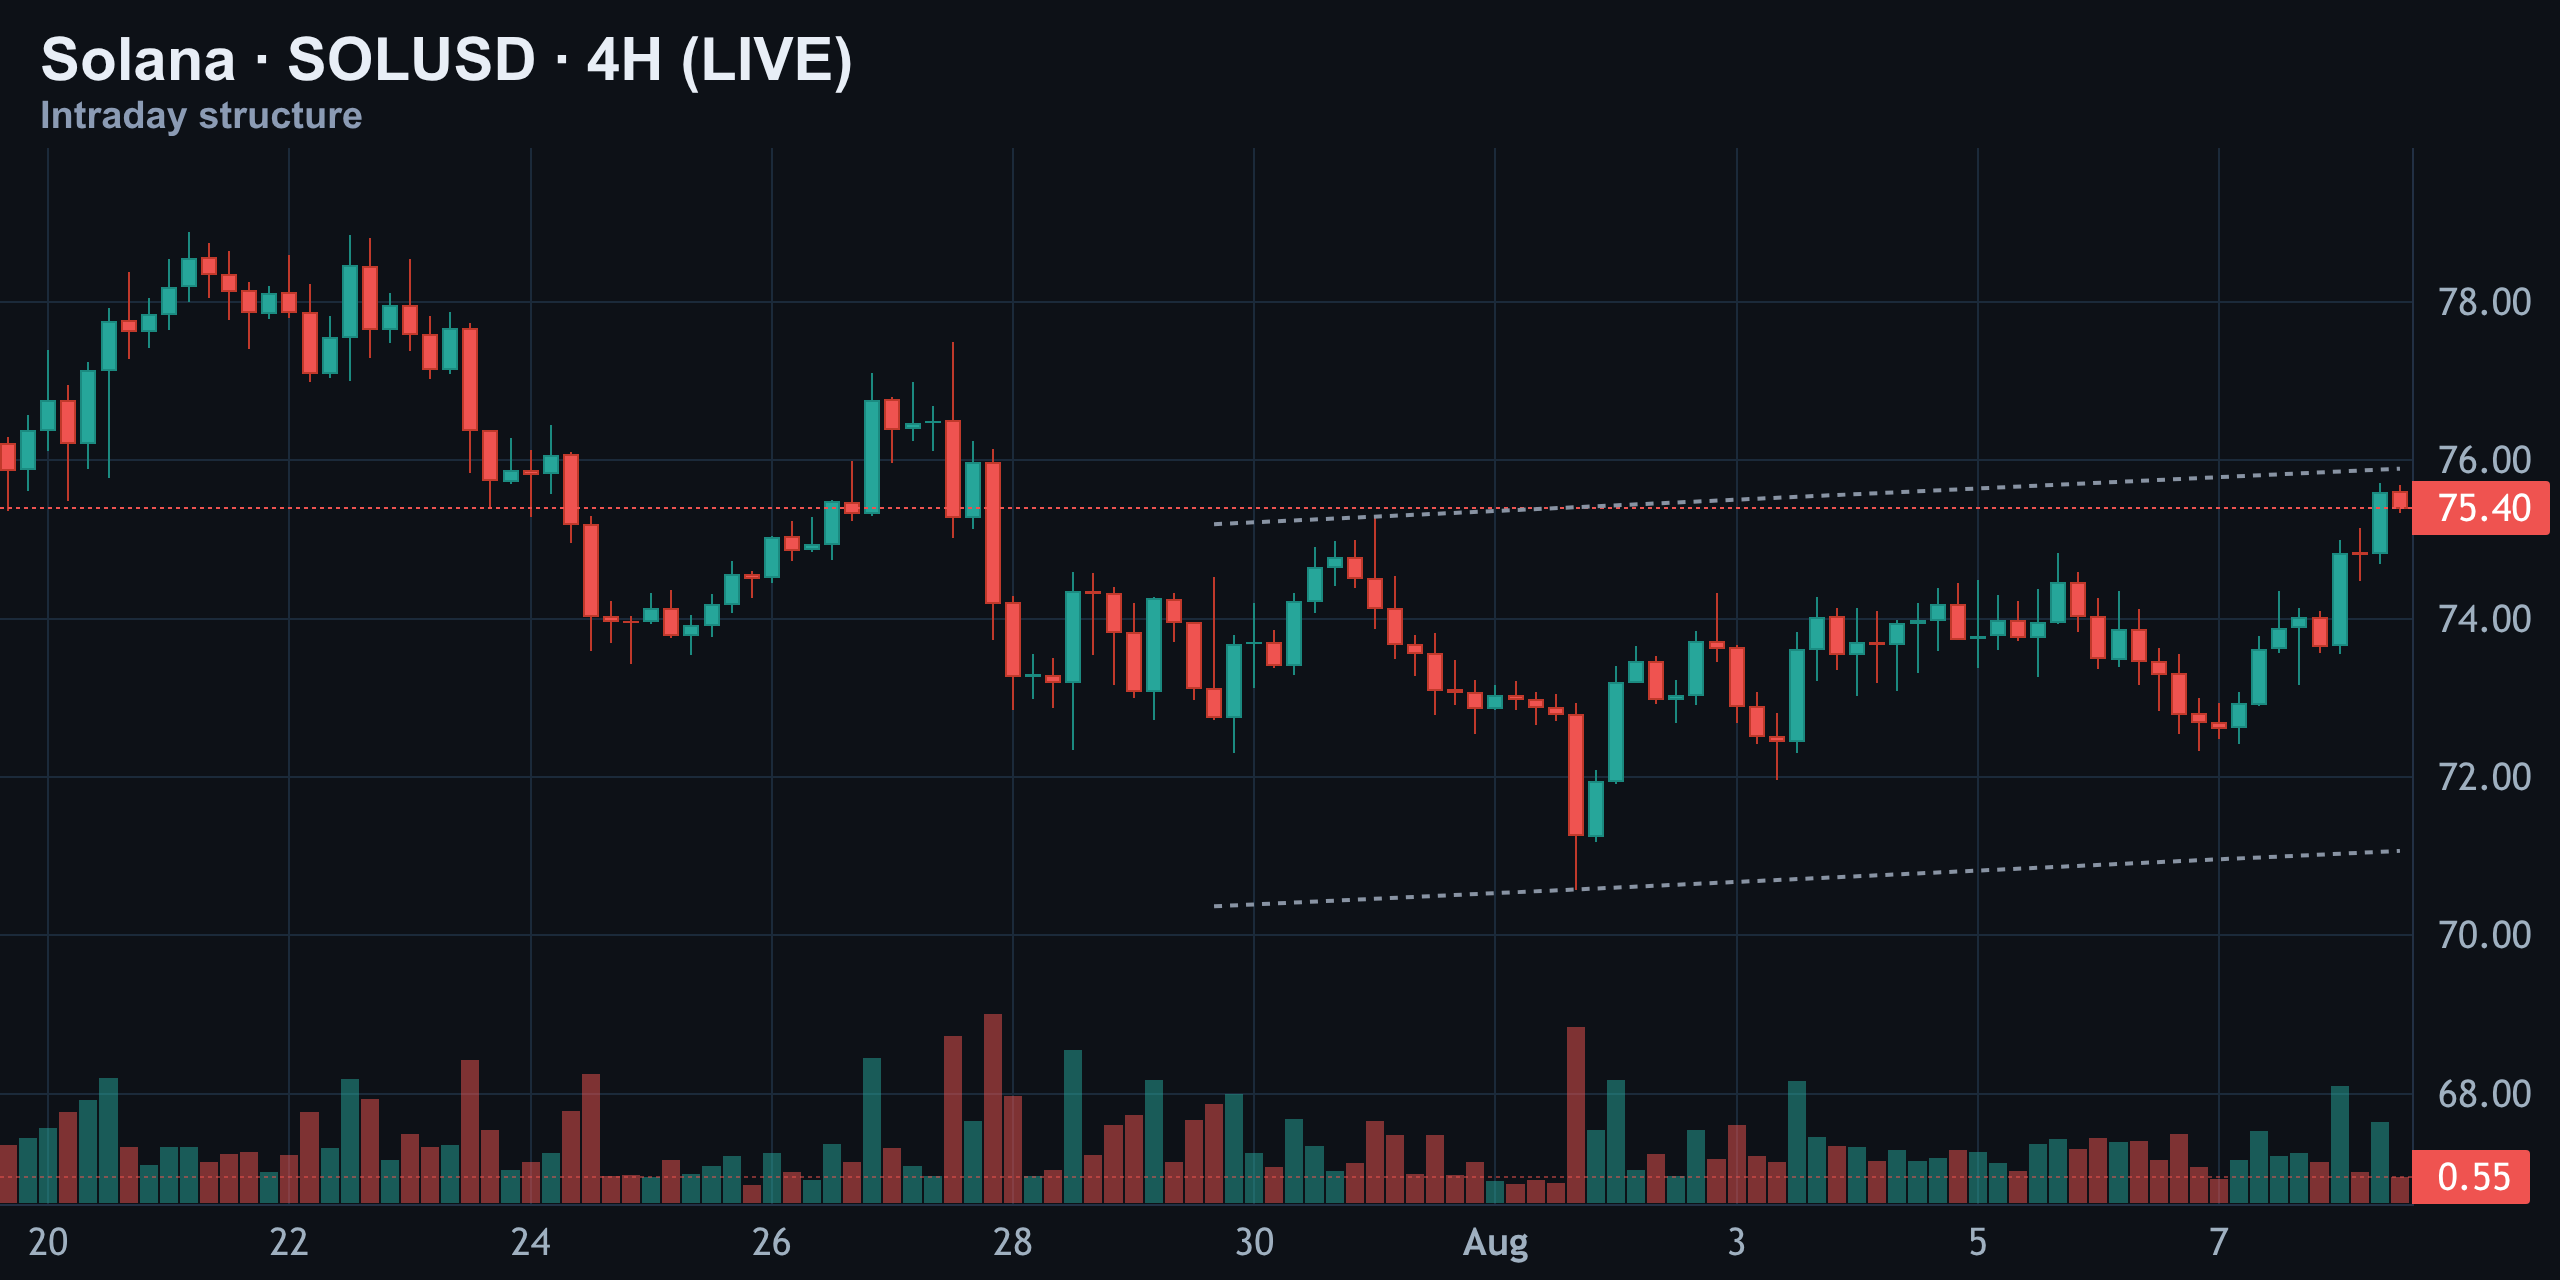
Zooming out to 4-hour candles, Solana has been climbing inside a rising channel since the August 1 low near $71.70. It pushed as high as roughly $77.90 around August 9–10, tagged the upper channel line, then rolled over. Since then it's been consolidating just under the channel midline, chopping between about $74.80 and $76.20. Trend structure is technically still up, but momentum is cooling fast — this is consolidation, not continuation, for now.
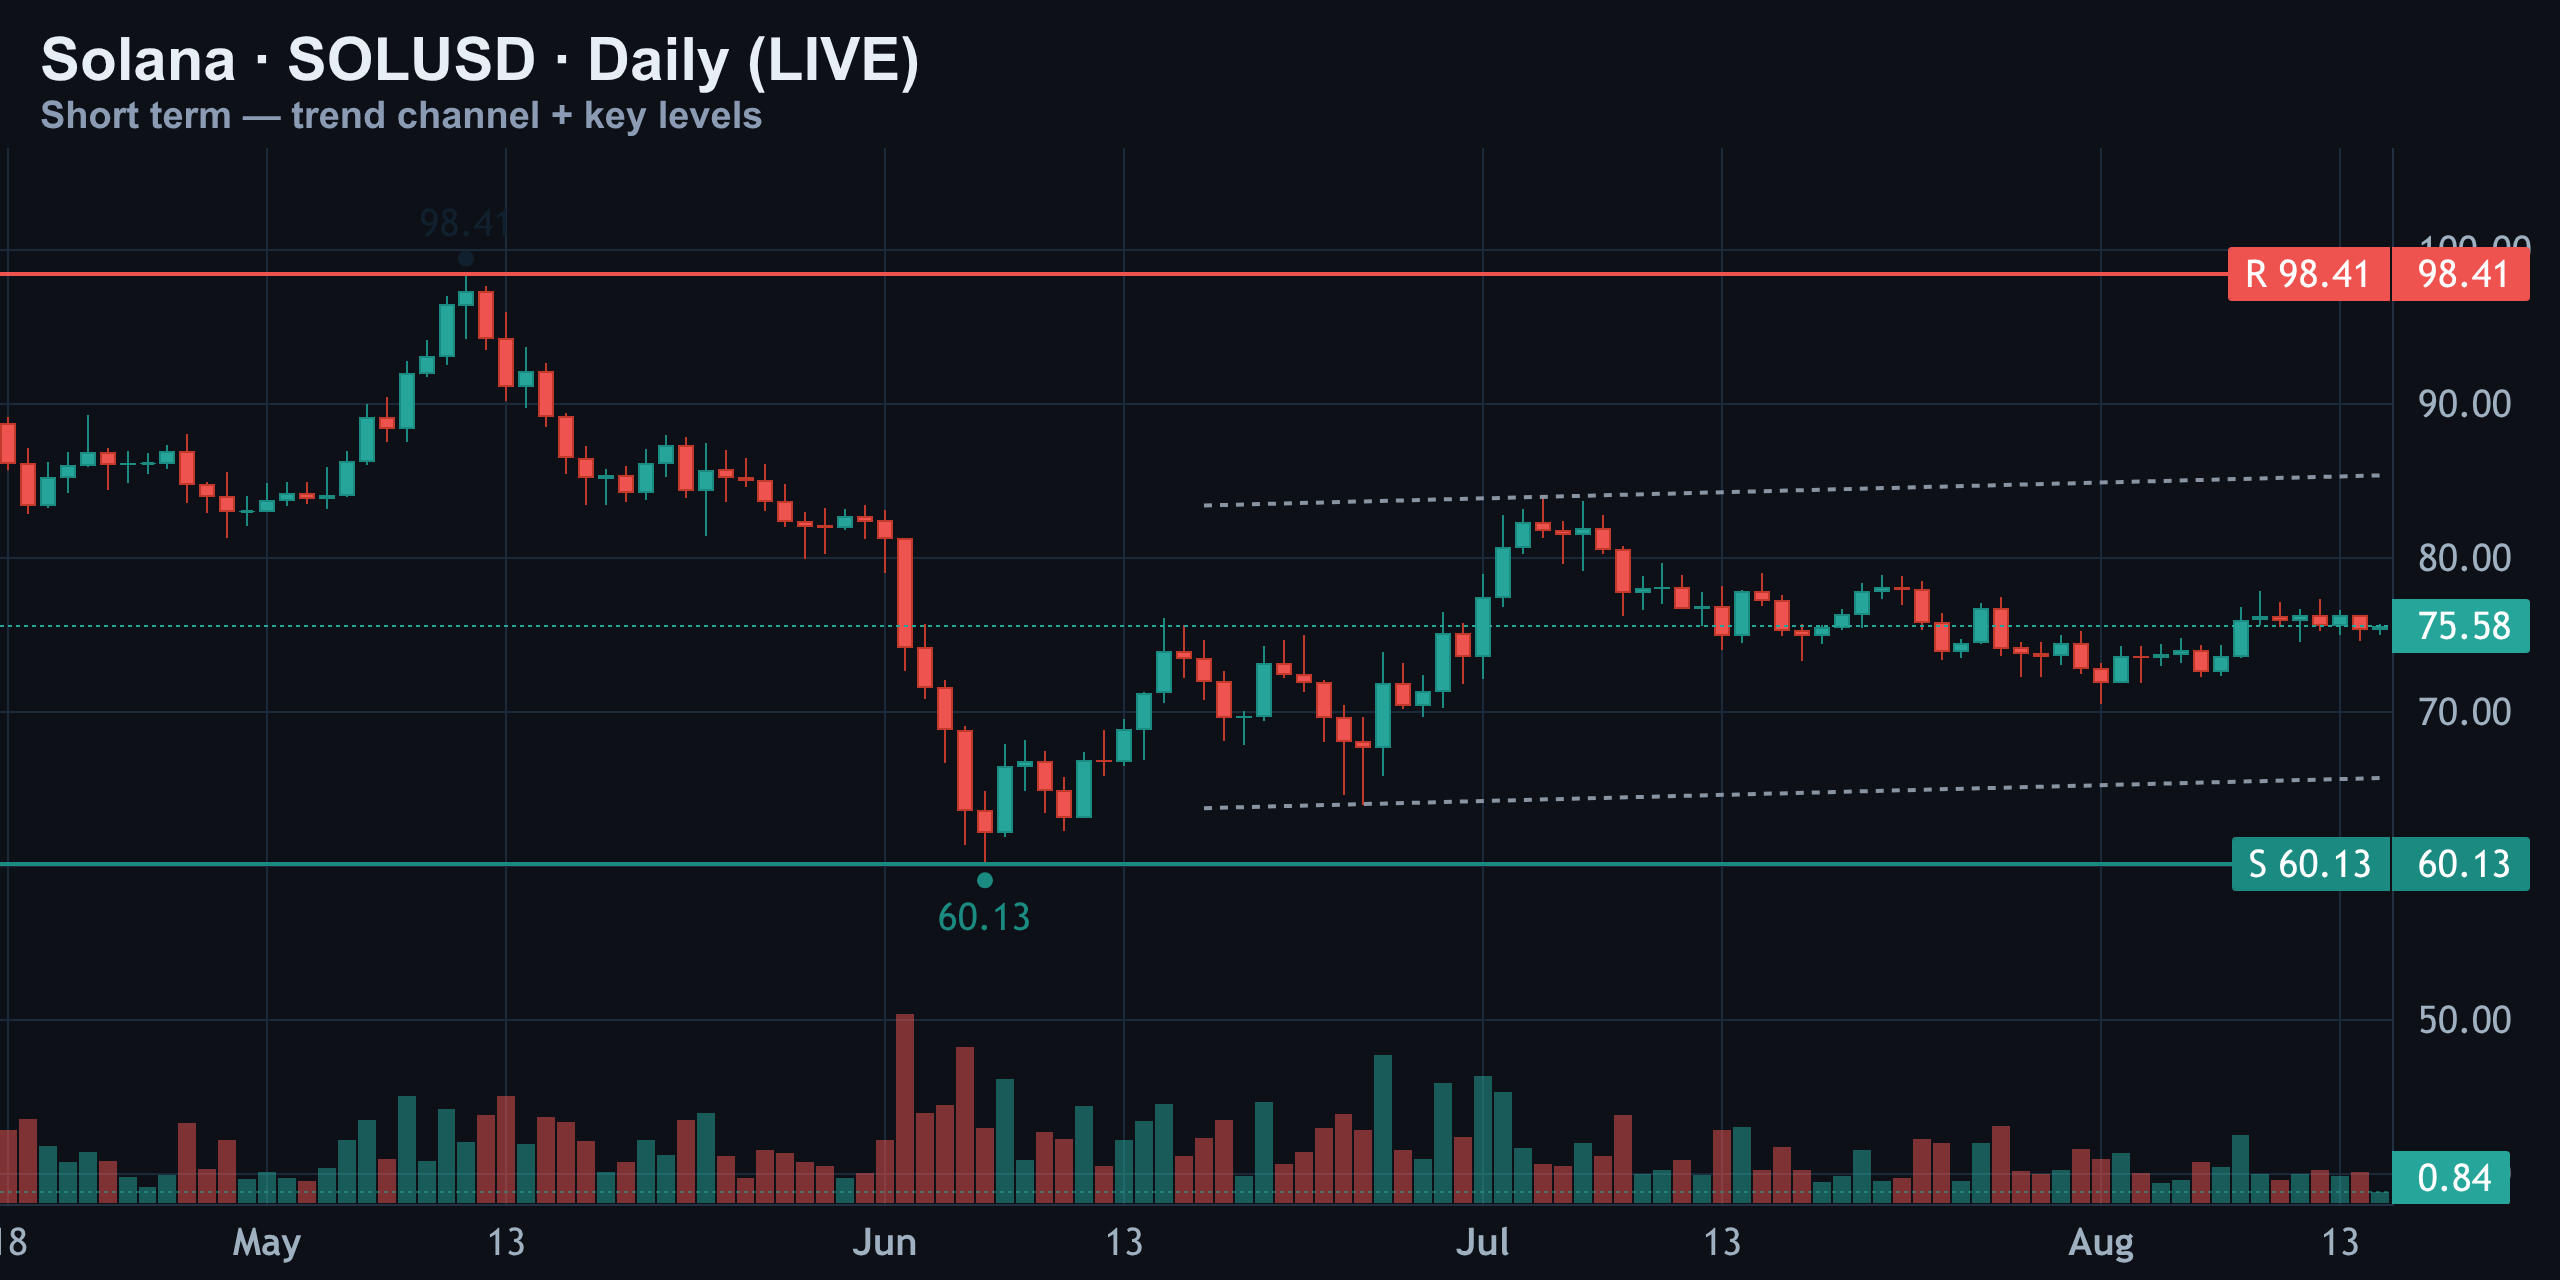
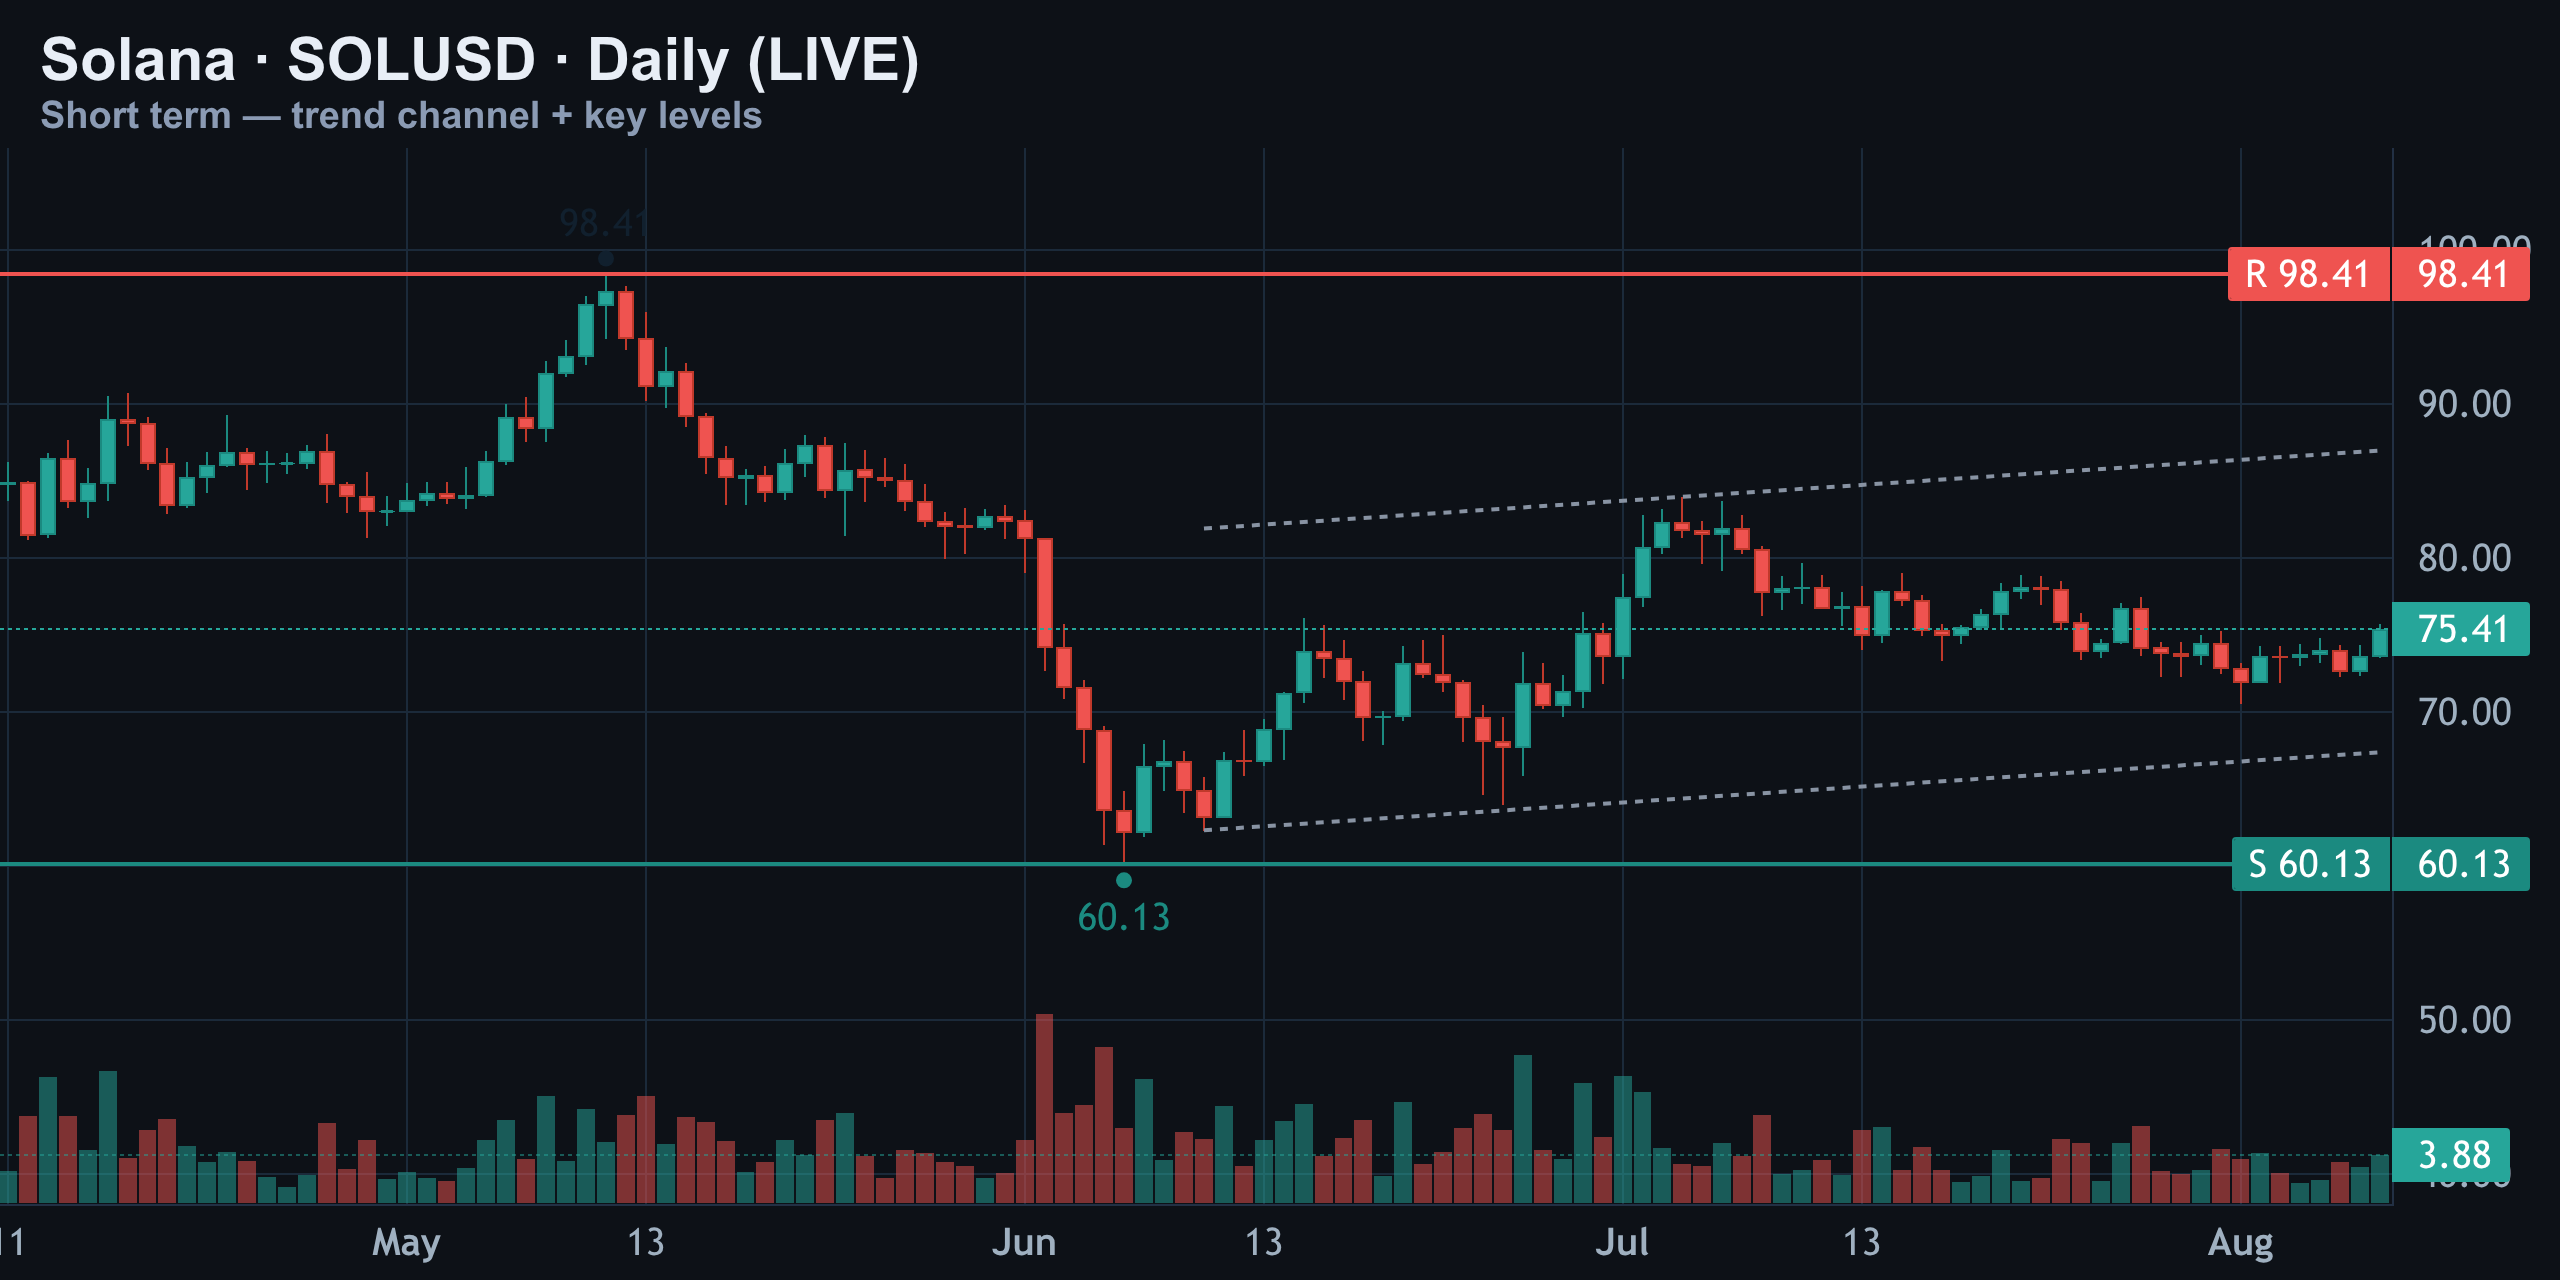
On the daily, the wider picture is a massive round trip: from the May high near $98.41, Solana crashed to $60.13 in June before staging a strong recovery. Since early July it's been boxed inside a rising channel roughly between $72 and $76, and price is sitting almost exactly where it was a week ago at $75.58. That's the definition of a pin — big swings resolved, now tight consolidation under resistance with no fresh breakout.
Momentum Check: RSI Neutral, MACD Barely Crossing
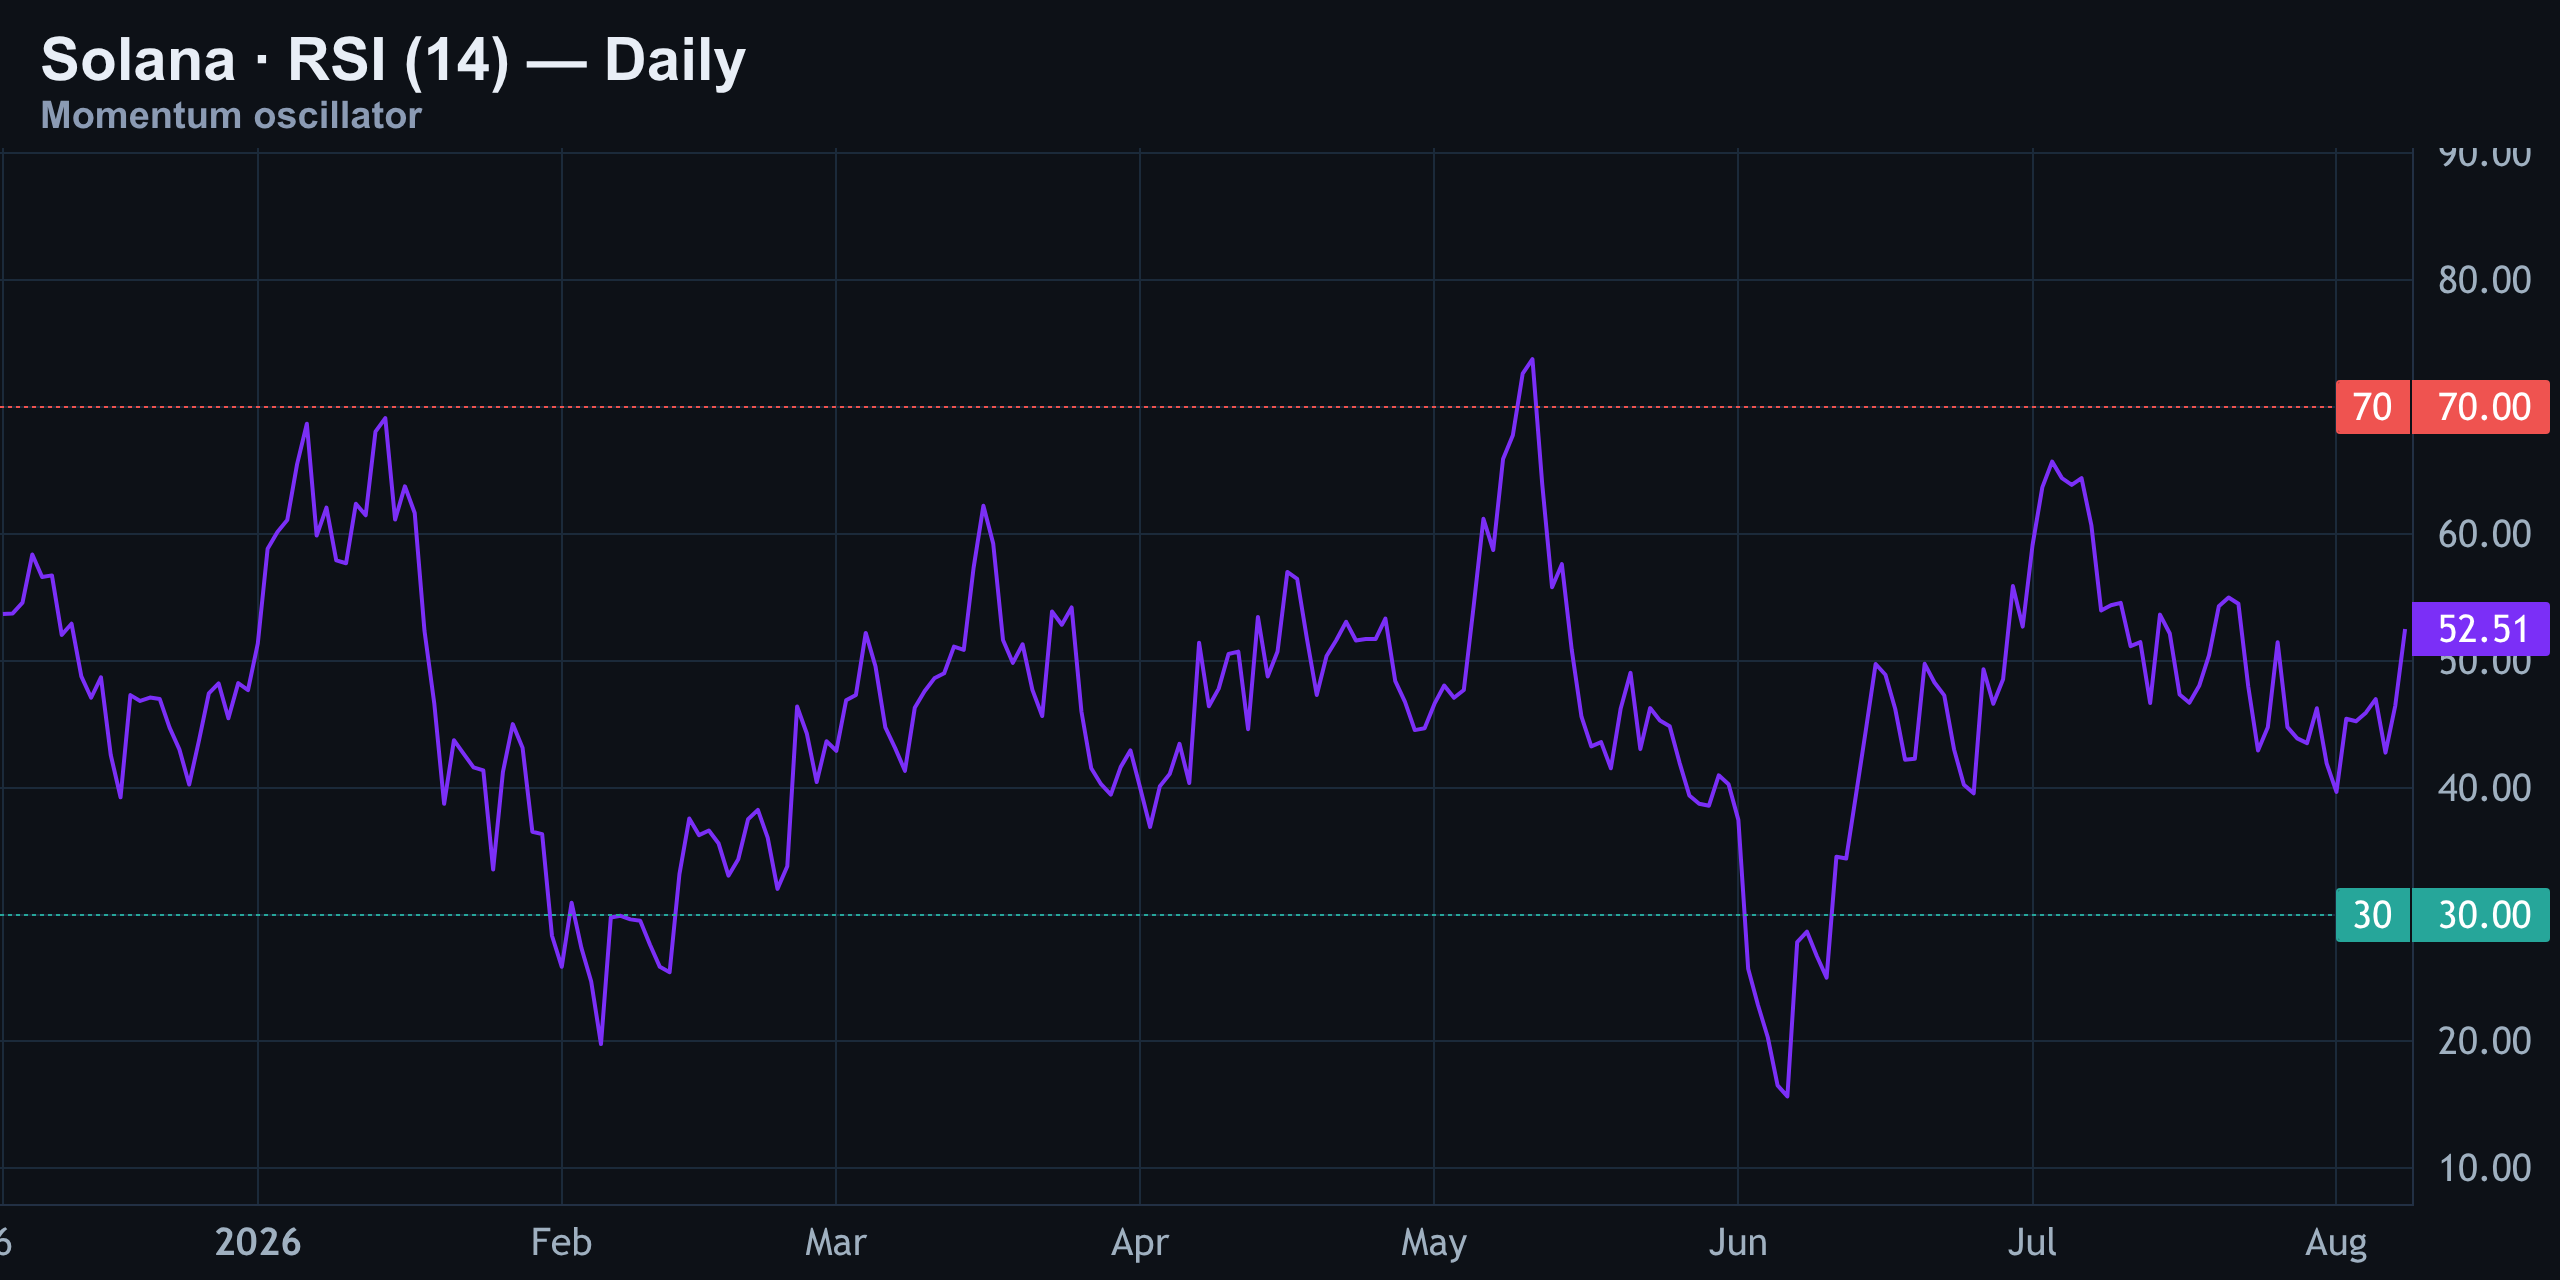
RSI (14) on the daily reads 52 — dead neutral, no oversold or overbought signal either way. This confirms the range-bound thesis: momentum simply isn't strong enough in either direction to force a breakout.
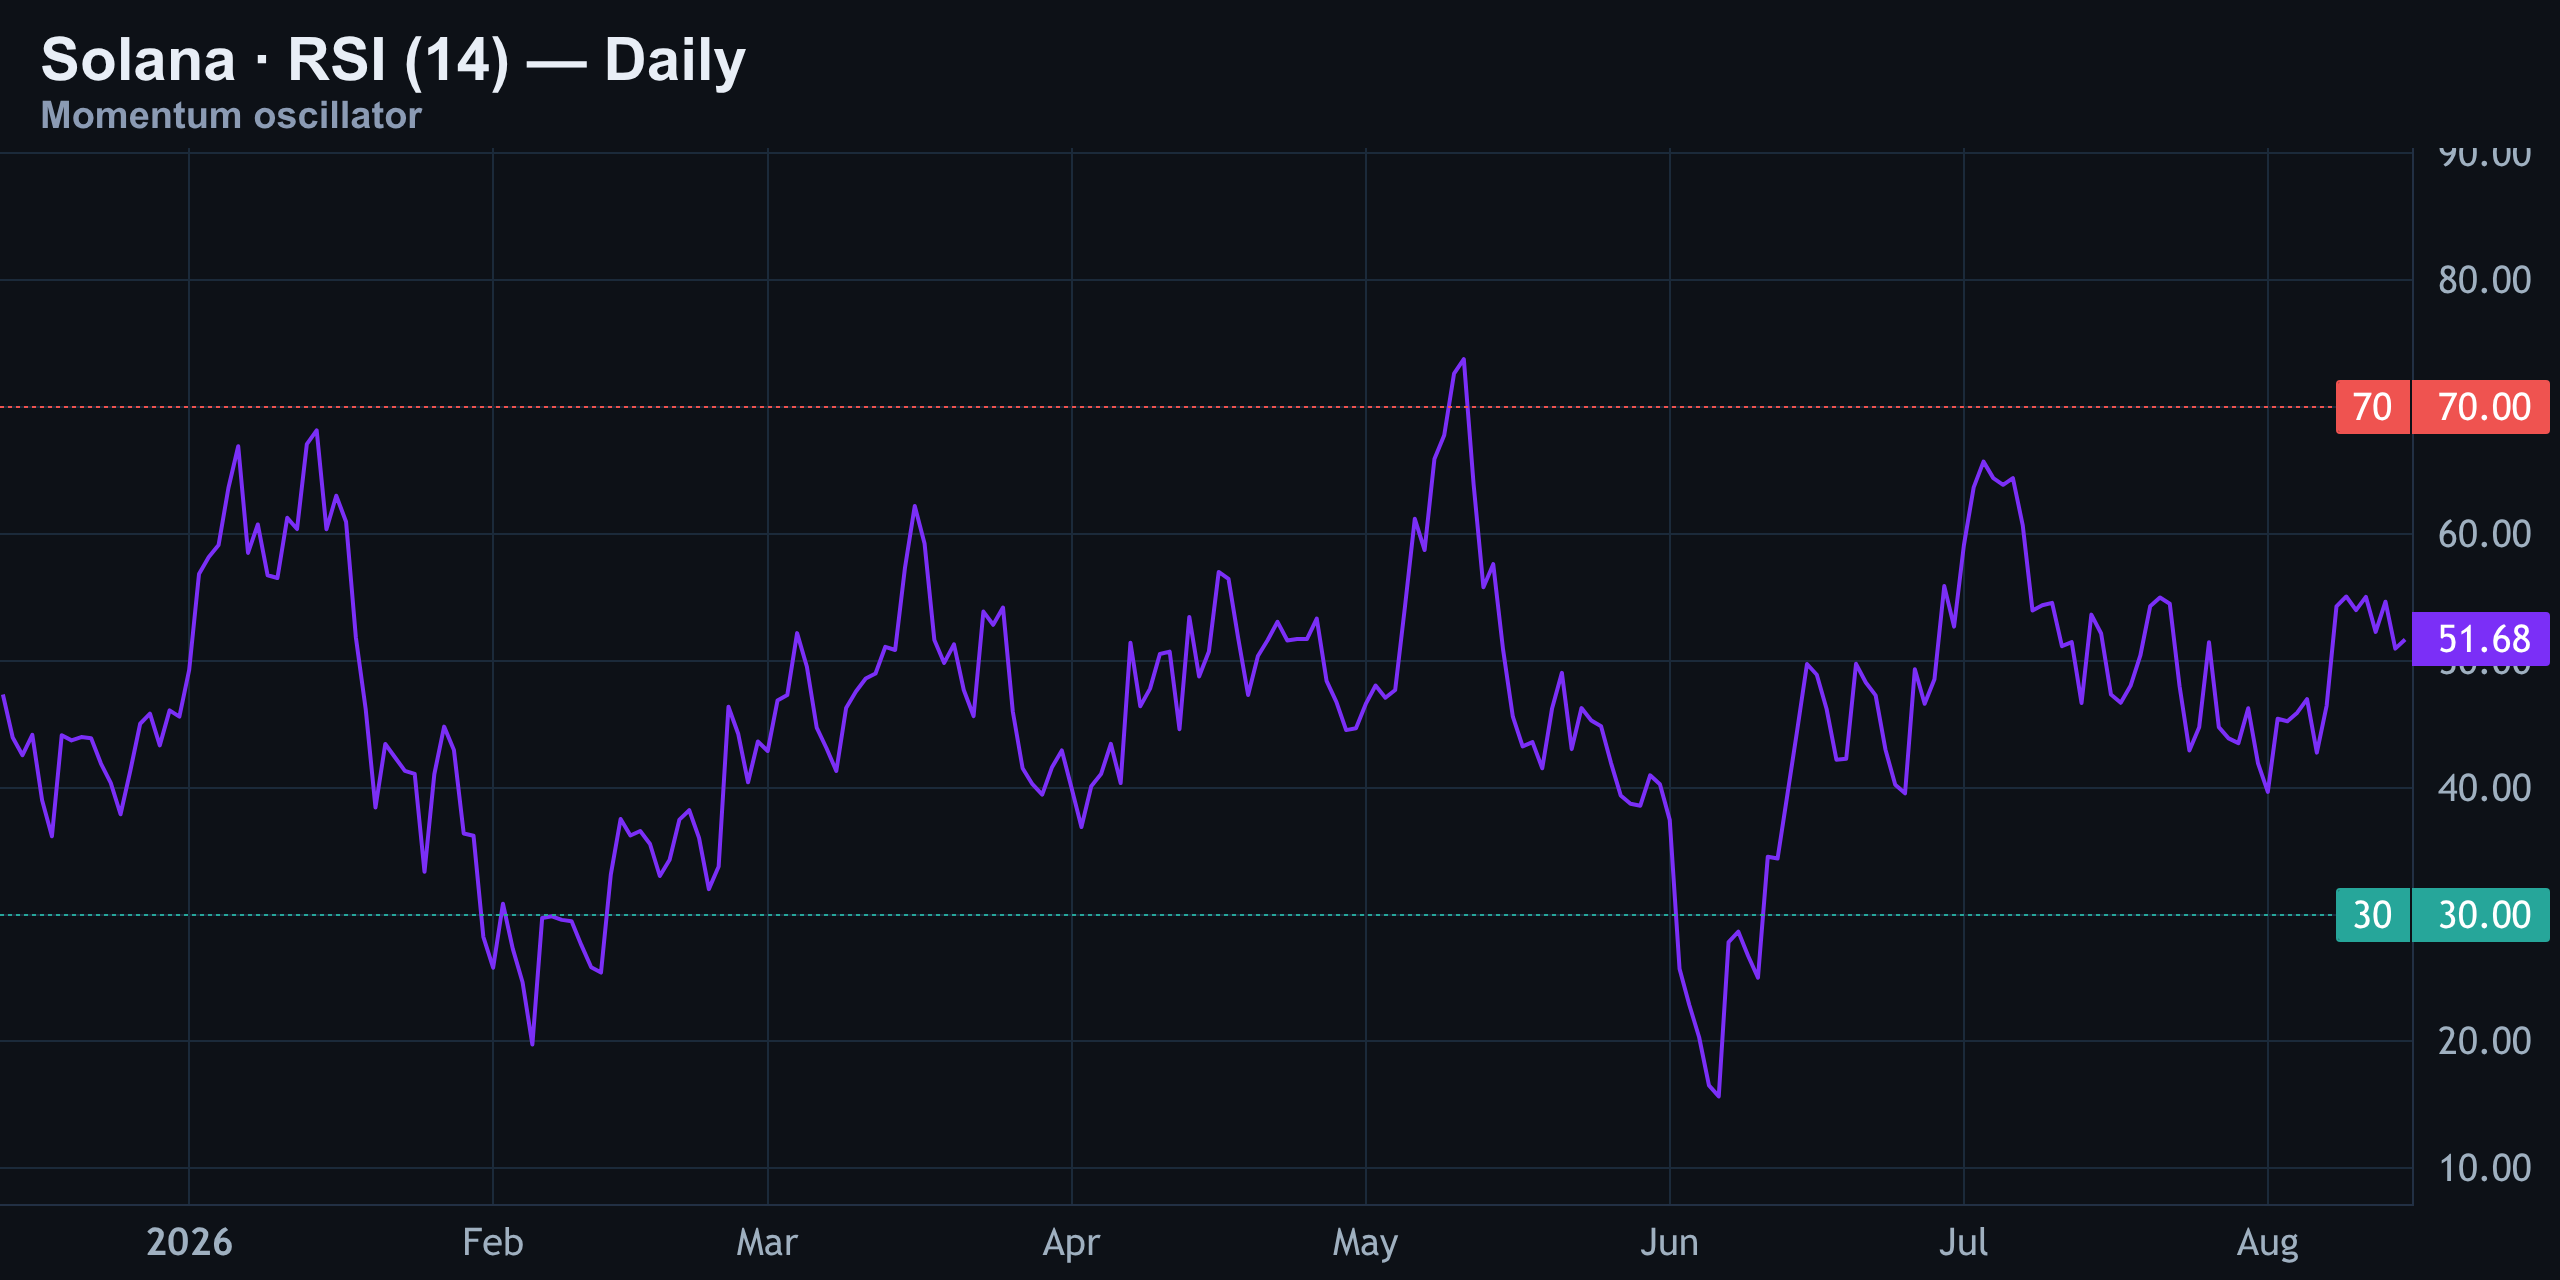
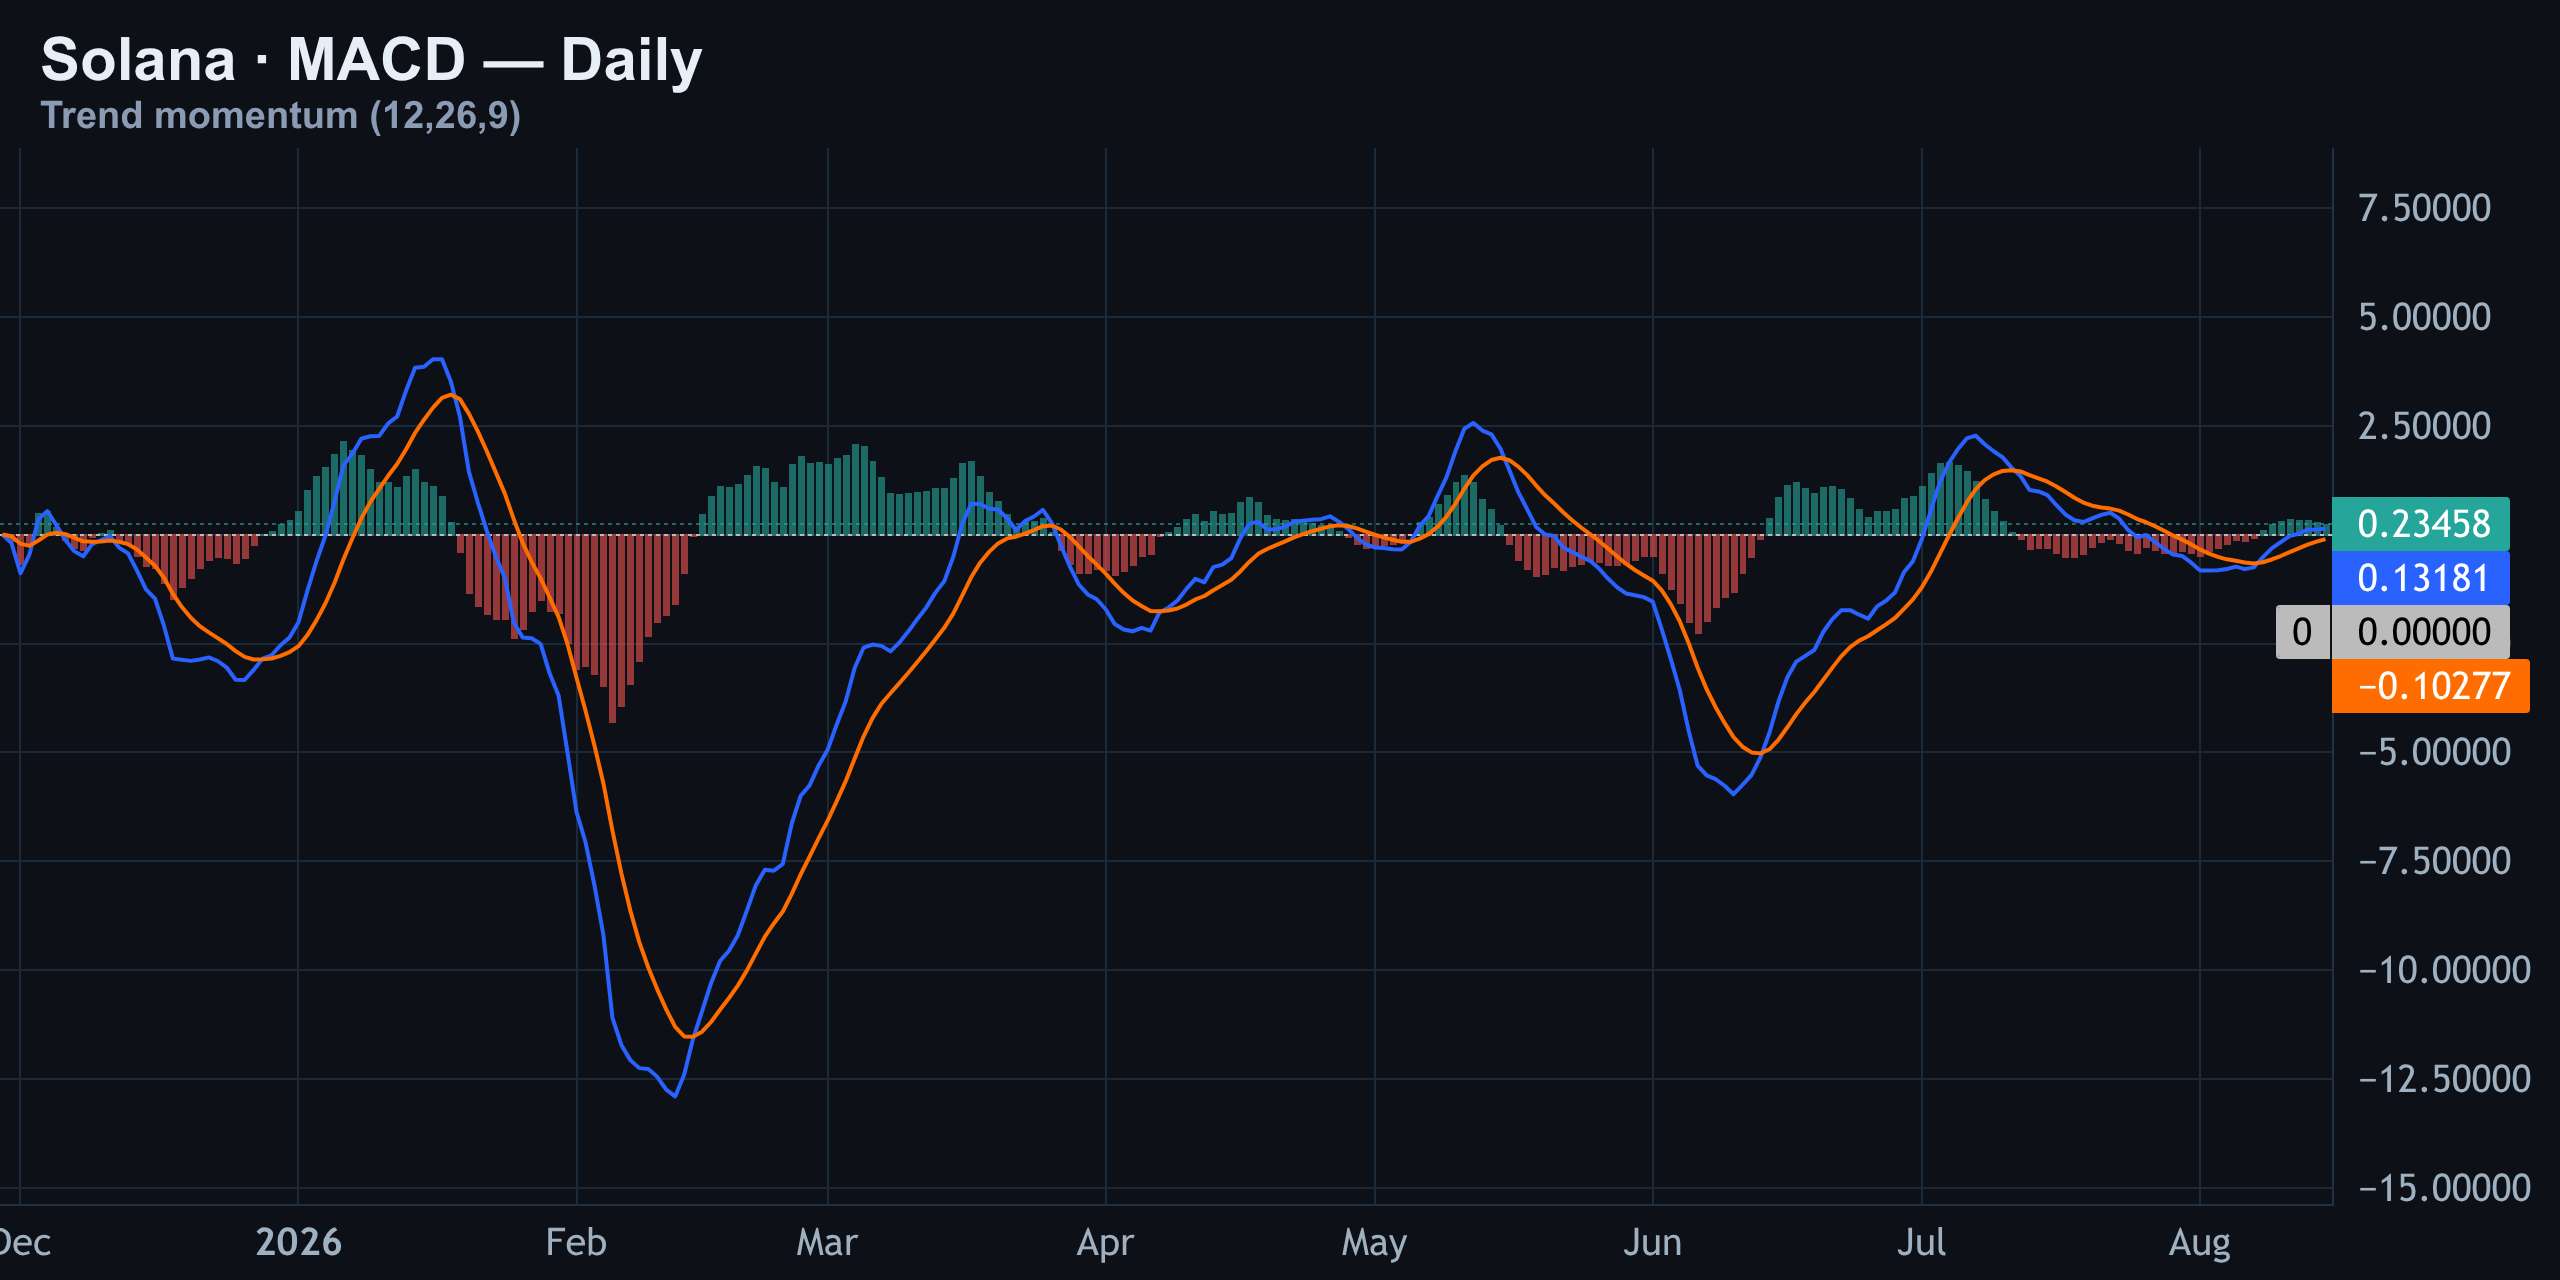
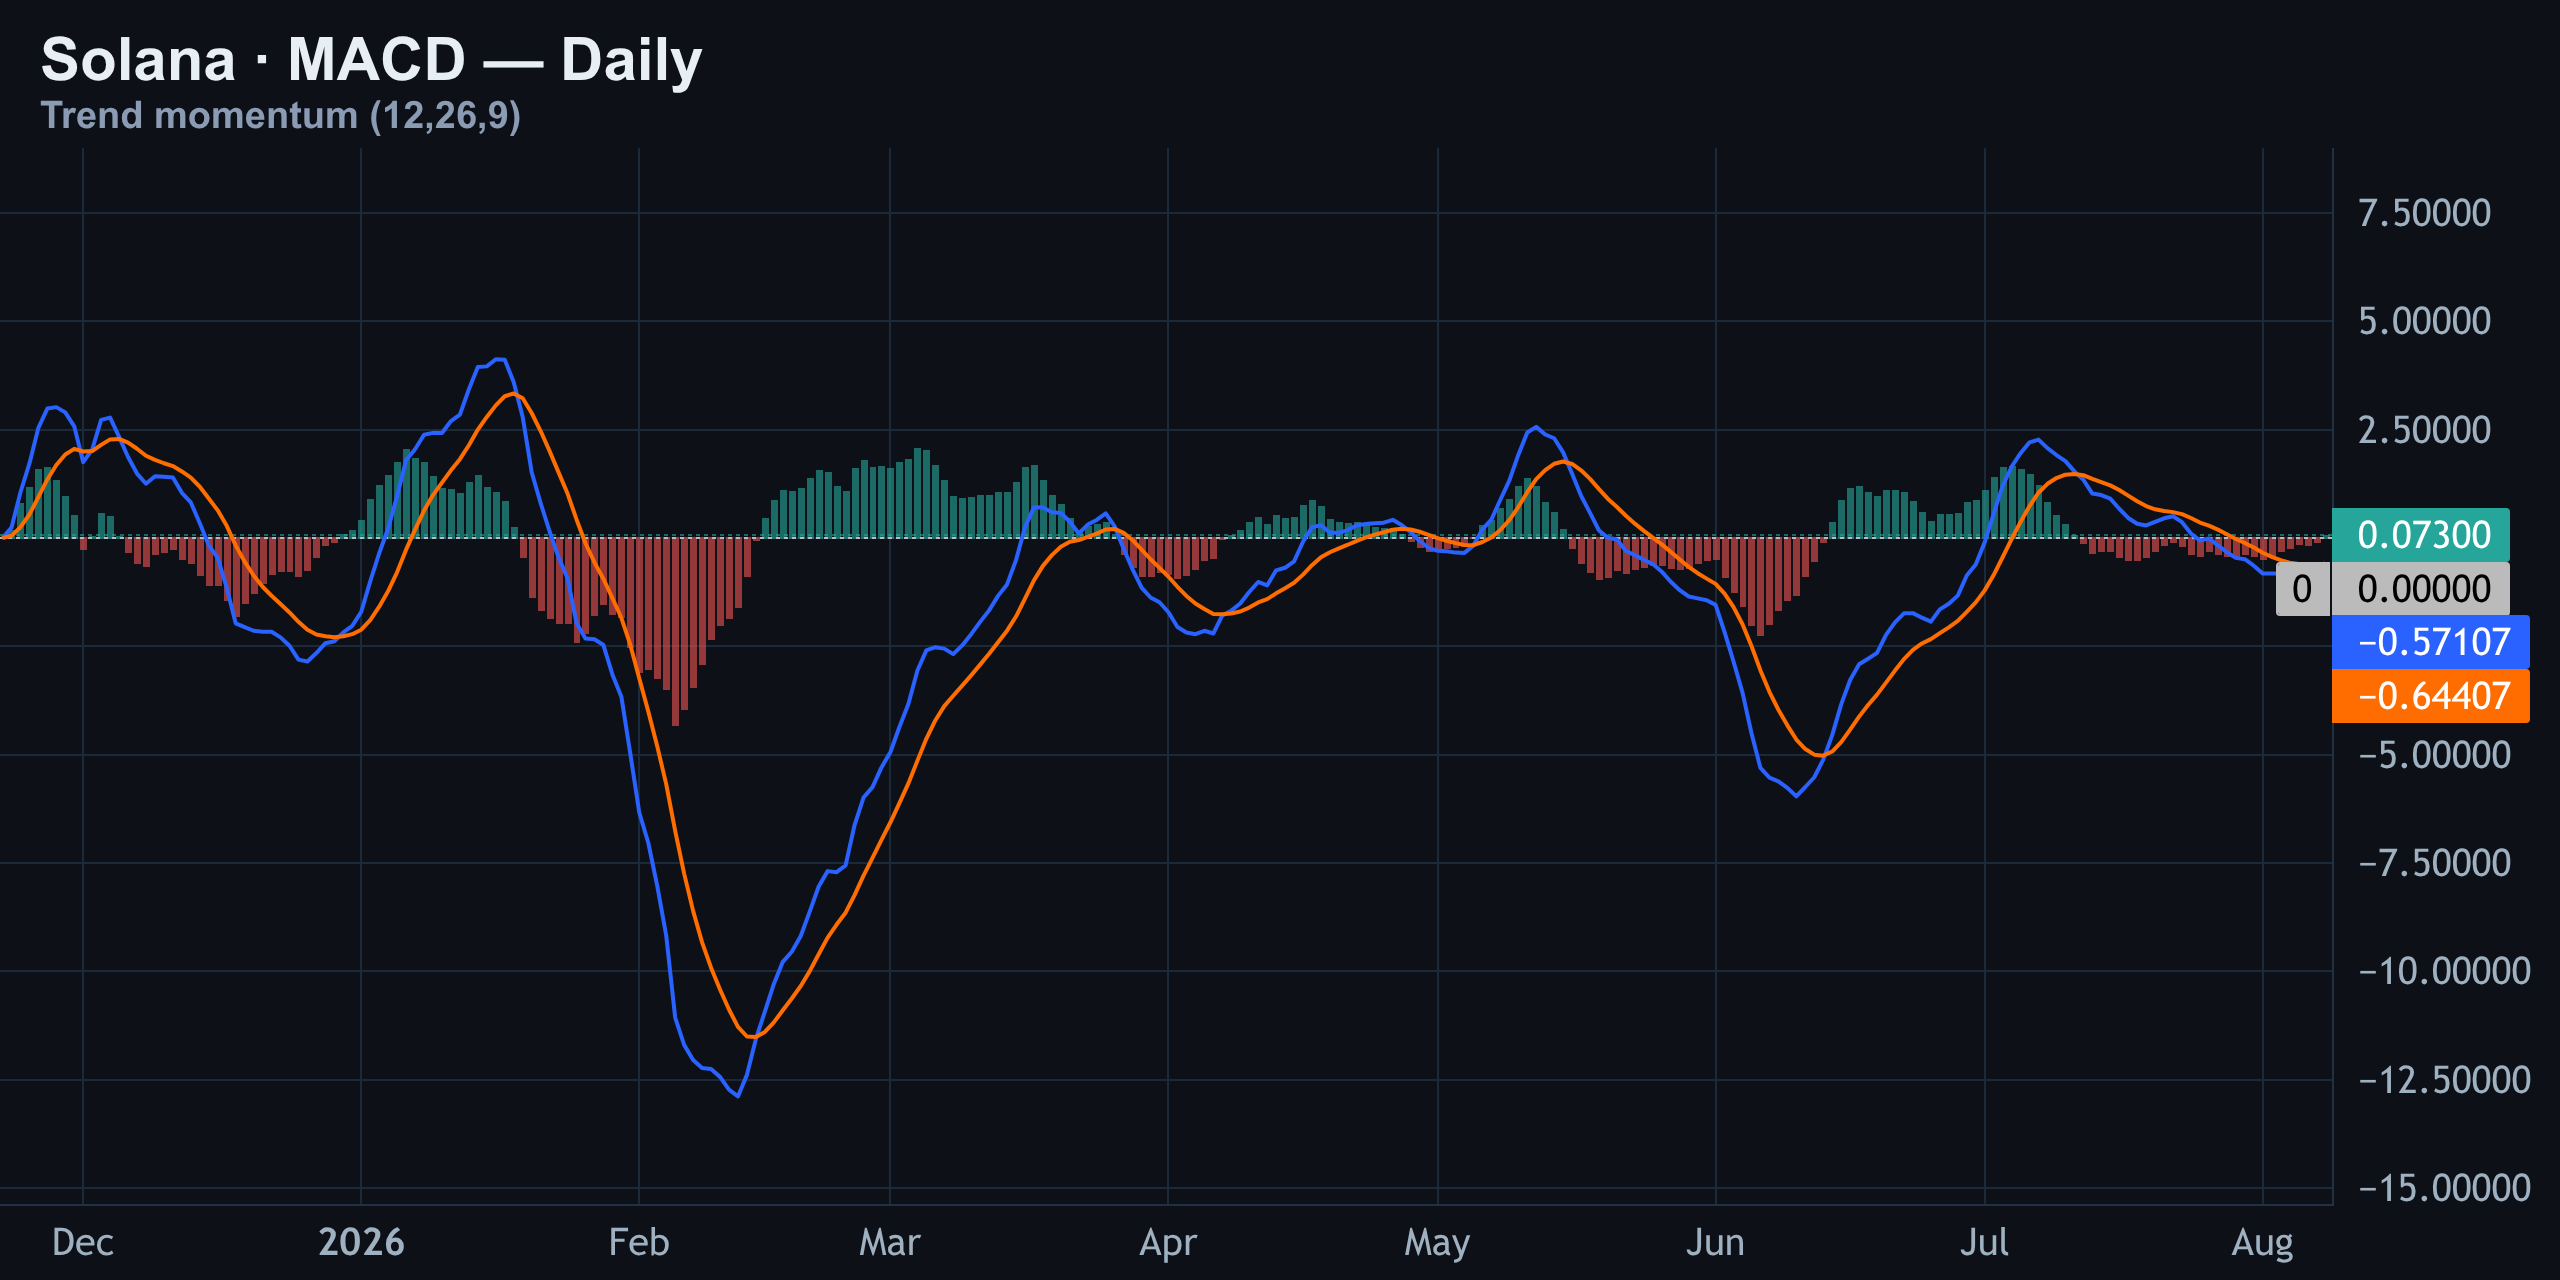
MACD just posted a bullish crossover, but it's a small, unconvincing one — the kind of signal that shows up in low-conviction chop rather than the start of a real trend. Combined with the neutral RSI, momentum indicators are effectively giving no green light for a breakout in either direction right now.
The Hidden Wall: Liquidations and Gamma Positioning
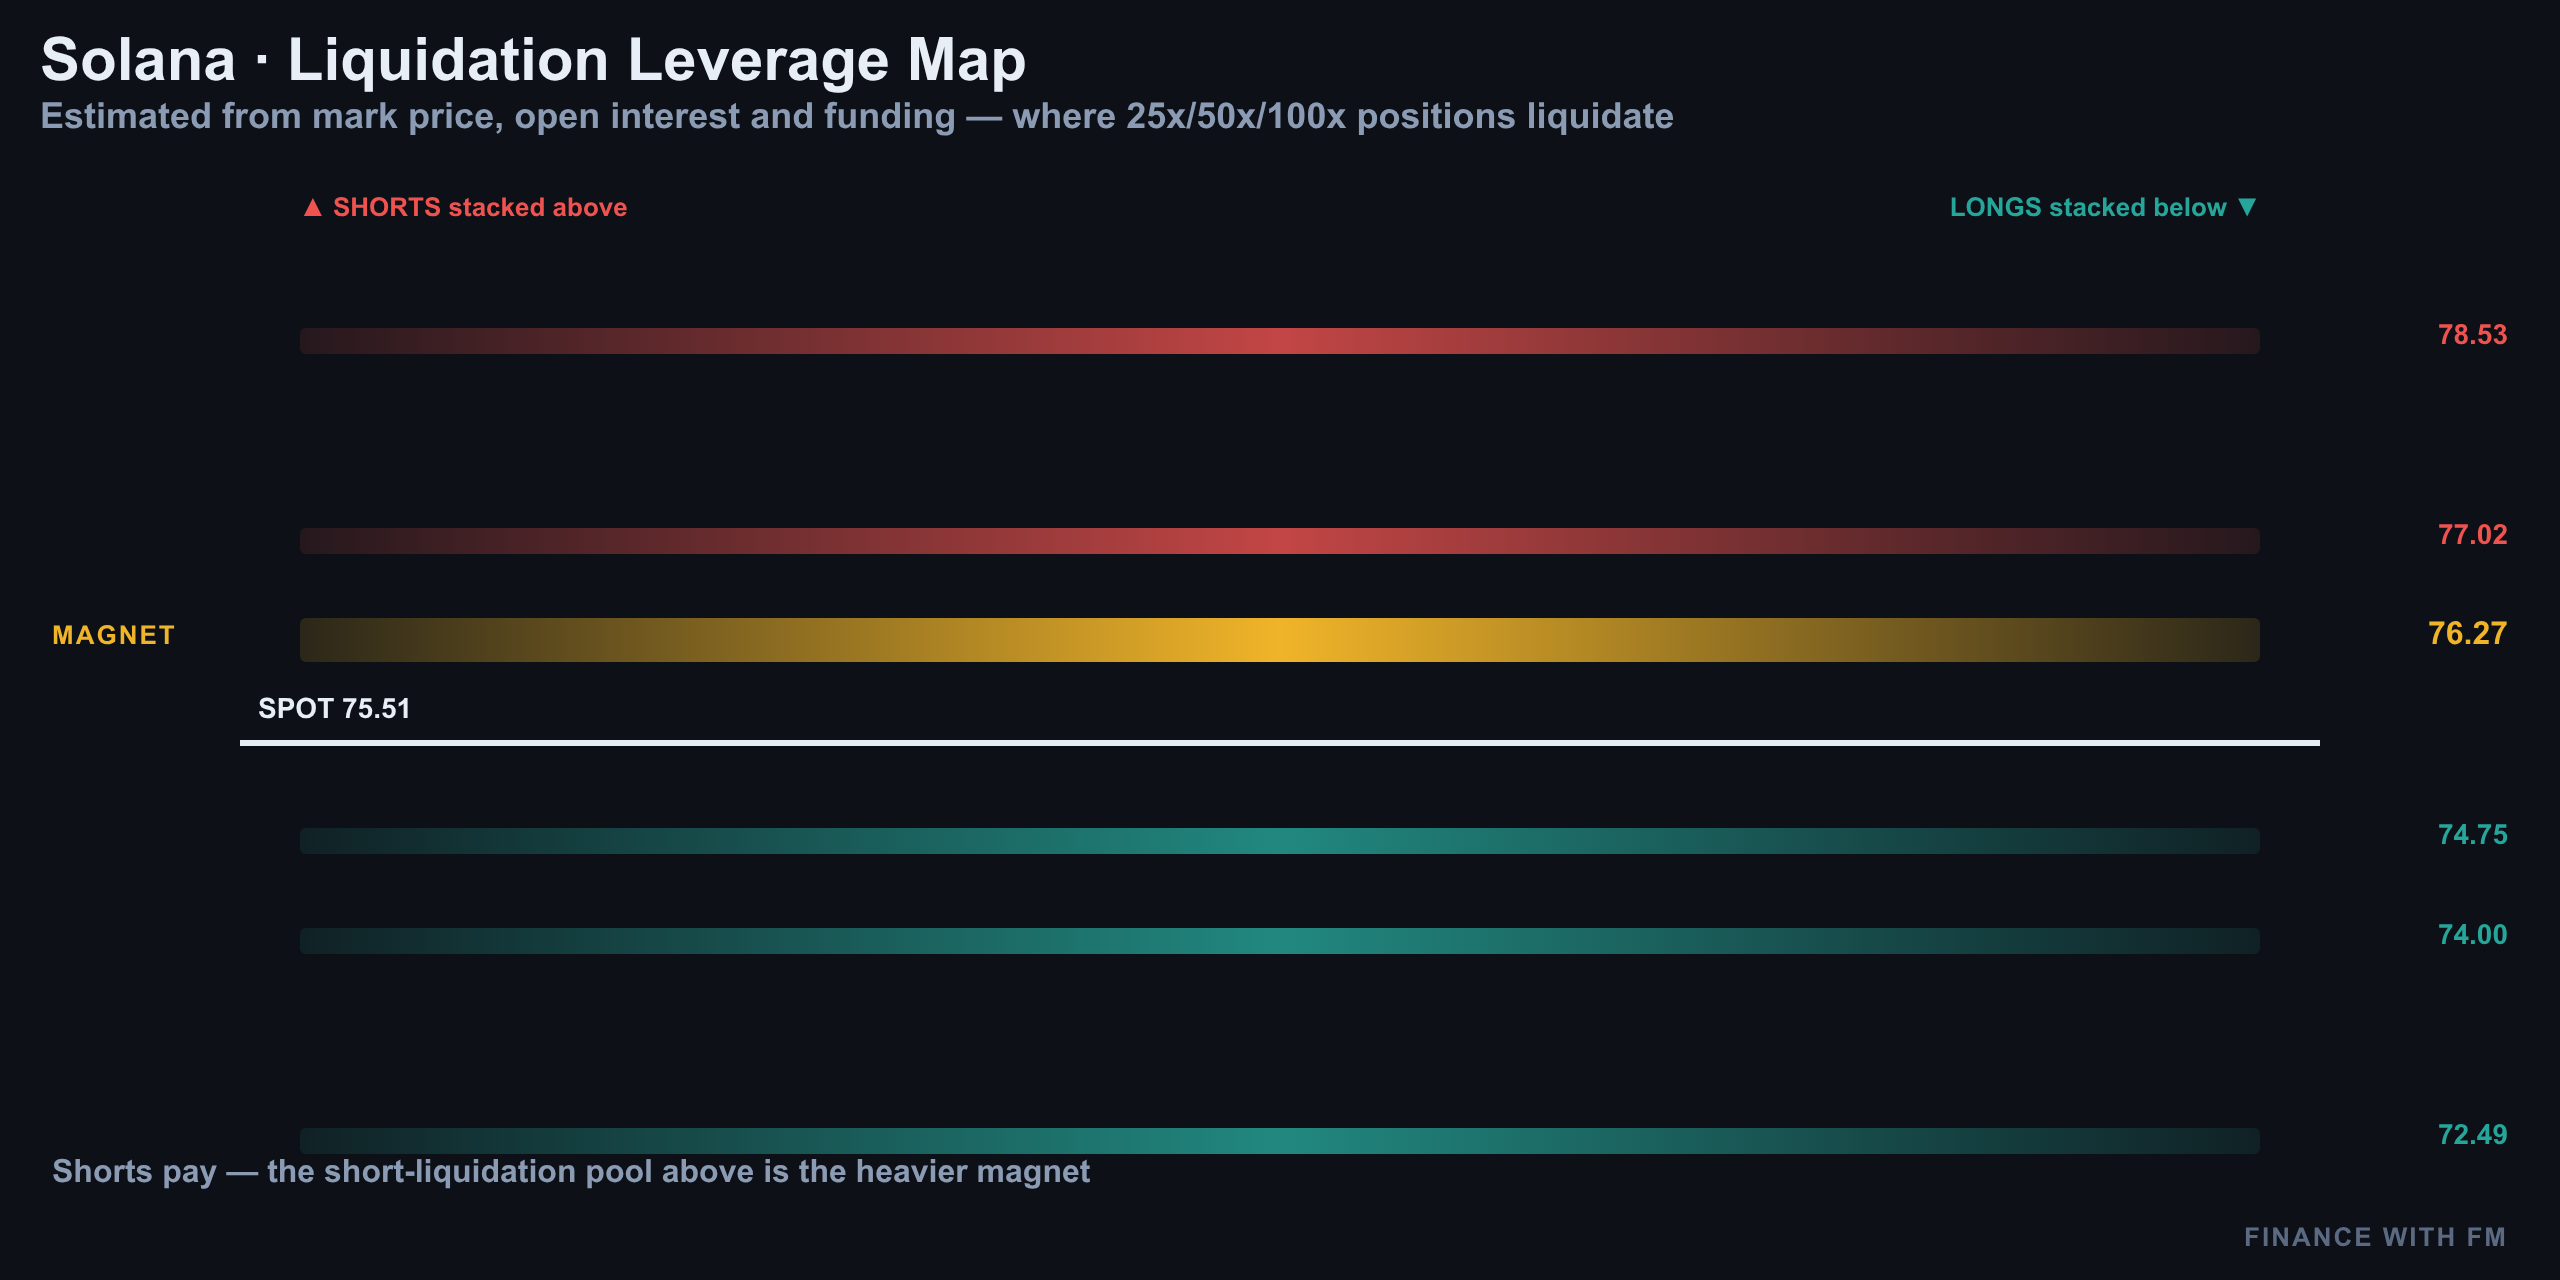
Here's the part nobody's talking about: there's a wall of leverage sitting just below spot. The liquidation heatmap shows clustered long and short liquidation levels stacked tightly around the current price, meaning any decisive move toward $73–$74 or up toward $77–$78 could trigger a cascade that accelerates price rather than just nudging it.
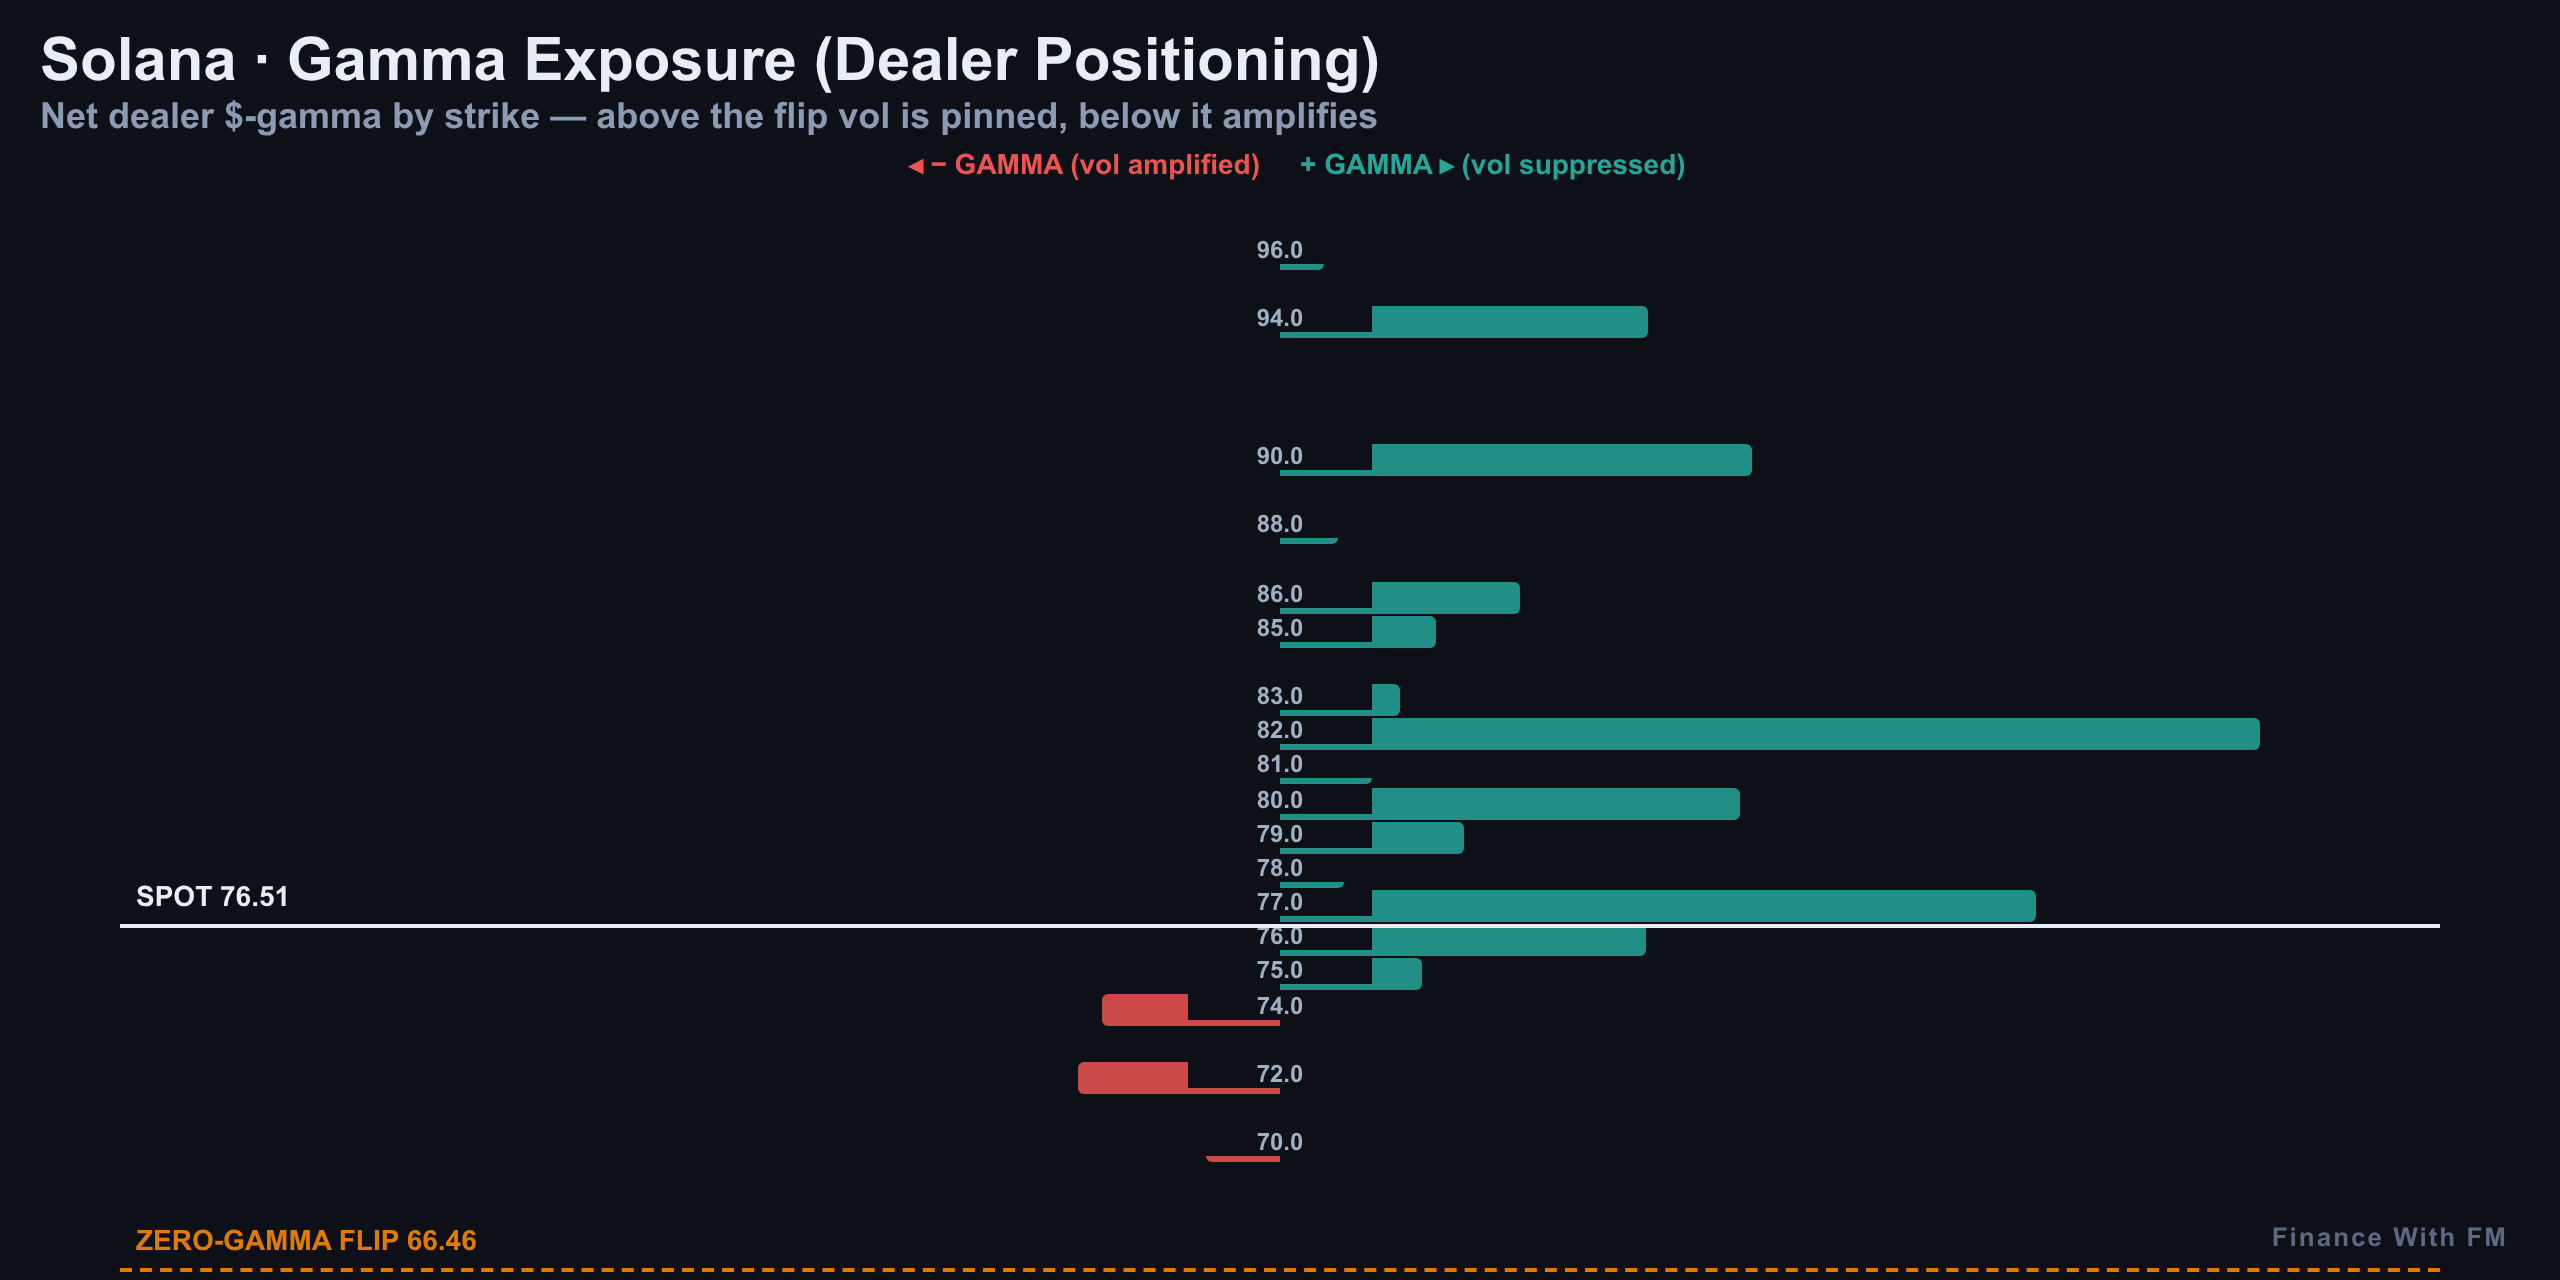
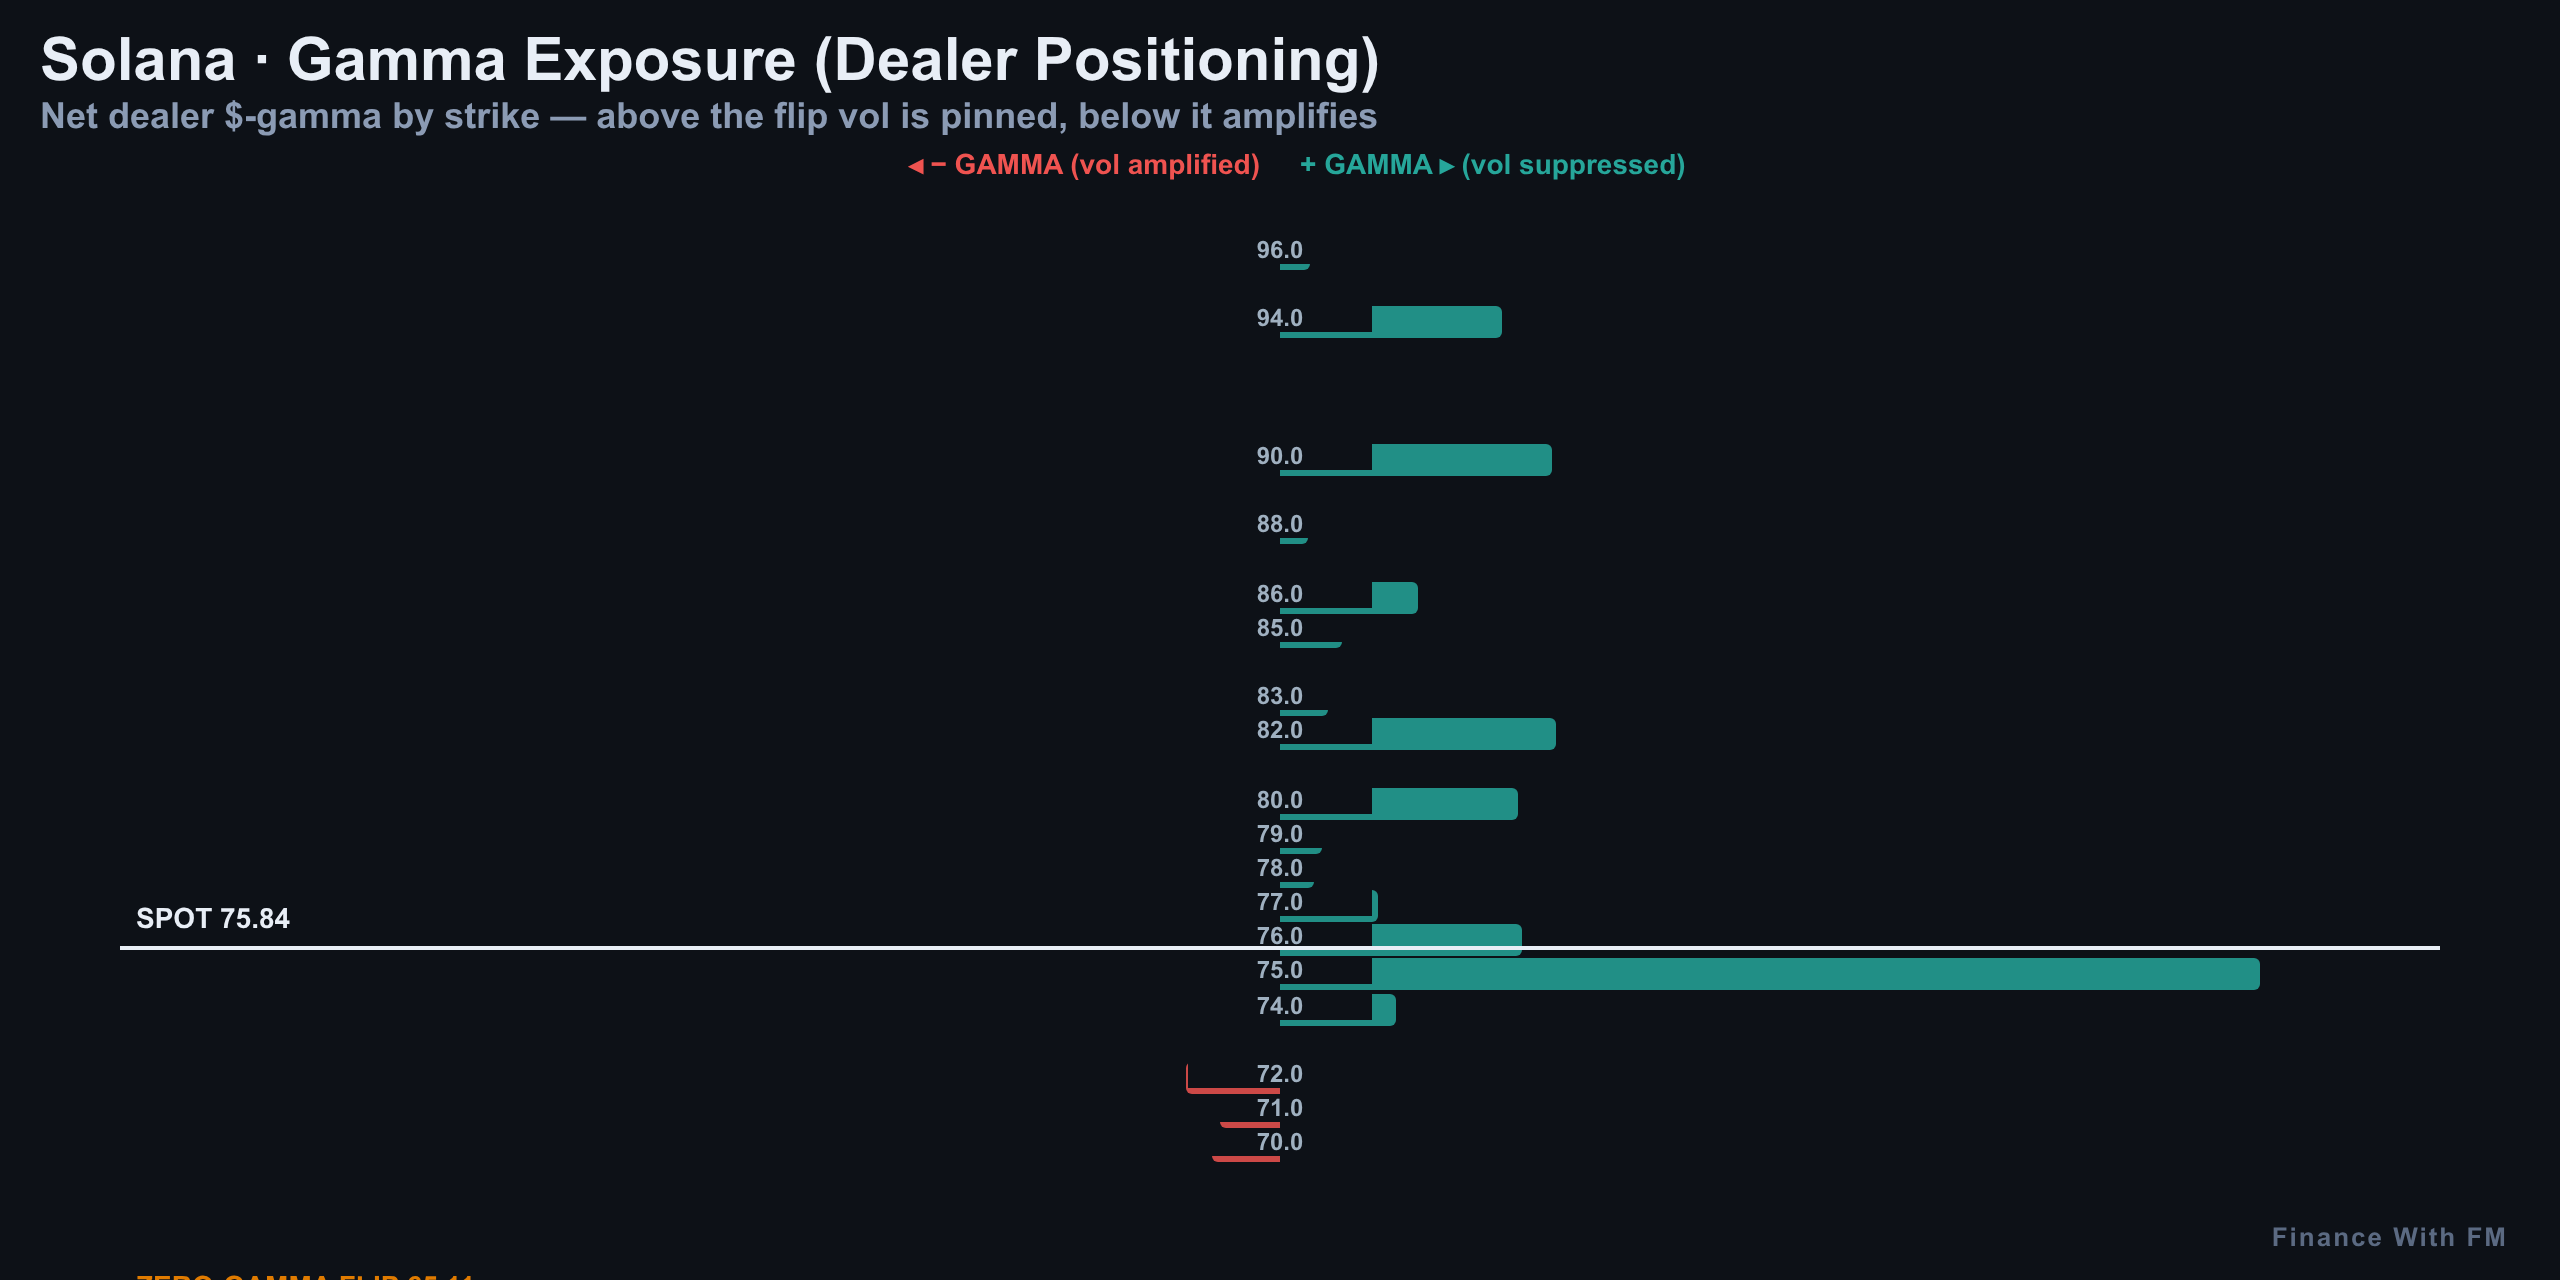
Meanwhile, dealers are sitting in positive gamma. In plain terms, that means dips tend to get bought and rallies tend to get sold by dealer hedging flows — which reinforces the pin. Expect this range to hold unless something forces a break hard enough to flip dealer positioning.
The Trade Setup and Levels That Matter
Putting it together: funding says shorts are paying (a mild bullish tell), options skew is call-heavy and pricing more upside risk, yet max pain and the put wall both sit at $75 — dragging price right back to the pin every time it tries to leave. That's the contradiction driving today's setup.
| Level | Price | Significance |
|---|---|---|
| Resistance (intraday) | $75.75 | 15-min upper range, tagged twice today |
| Support (intraday) | $75.00 | 15-min lower range / put wall / max pain |
| 1-sigma upper | $78.00 | Expected move ceiling for tomorrow |
| 1-sigma lower | $75.00 | Expected move floor for tomorrow |
| 2-sigma upper | $80.00 | 95% probability ceiling |
| 2-sigma lower | $73.00 | 95% probability floor |
| Daily channel top | $76.00 | July–August rising channel resistance |
| Daily channel bottom | $72.00 | July–August rising channel support |
| Call wall | $94.00 | Major overhead options resistance |
| Put wall / Max pain | $75.00 | Gravity center into Aug 16 expiry |
The desk's plan today is a short, with a risk-reward of roughly 1:2.6. The logic: positive gamma and max pain both argue for mean reversion back toward $75 rather than a breakout, and the tight 15-minute resistance at $75.75 offers a defined invalidation point.
- Entry zone: near $75.70–$75.75 resistance, on rejection
- Stop: a confirmed close above $76.20 (4-hour channel midline) kills the trade
- Target: back toward the $75.00 put wall / max pain zone, with an extension toward $73–$74 if liquidations cascade
Not Financial Advice — What This Actually Means
None of this is financial advice. It's a structured read of what options, gamma, liquidations, and price action are collectively saying about Solana on August 15, 2026. The market is compressing volatility into a tight band, and history suggests these pins eventually break — the question is timing and direction, not whether it happens.
For broader context, Solana's 2026 trajectory has been a story of extremes: from a May high above $98 to a June crash near $60, and now months of consolidation in the low-to-mid $70s as the market digests that move.
Until the $75 pin breaks with volume and gamma flips negative, expect more of the same: tight ranges, small moves, and a market that's paying up for options premium it isn't using.
Previous days
08/08/2026 — Solana Price Today: The $75 Pin And Why Patience Wins
Solana Price Today: The $75 Pin And Why Patience Wins
Where We Left It: Last Week's Short Didn't Work
No sugar-coating this one. Last week's short from $73.44 got stopped out at $74.62. The trade simply didn't work — and Solana went on to rip another 3.4% from there, climbing from roughly $72.93 up to today's $75.43 area. That's the real cost of fighting a market that quietly leaned bullish underneath a choppy surface.
| Metric | Value |
|---|---|
| Short entry | $73.44 |
| Stop-out level | $74.62 |
| Result | Stopped out |
| Price since stop-out | +3.4% (≈$72.93 → ≈$75.43) |
| Current spot (Aug 8) | $75.48, +2.3% on the day |
The Options Board: Calm On The Surface, Bullish Underneath
The derivatives market is telling a more nuanced story than the spot chart. The put-call ratio by open interest sits at 0.45, meaning there are far more call contracts open than puts — classic bullish positioning. But the volume ratio today is higher at 0.63, which tells us traders are still actively buying near-term protection even as the broader book leans call-heavy.
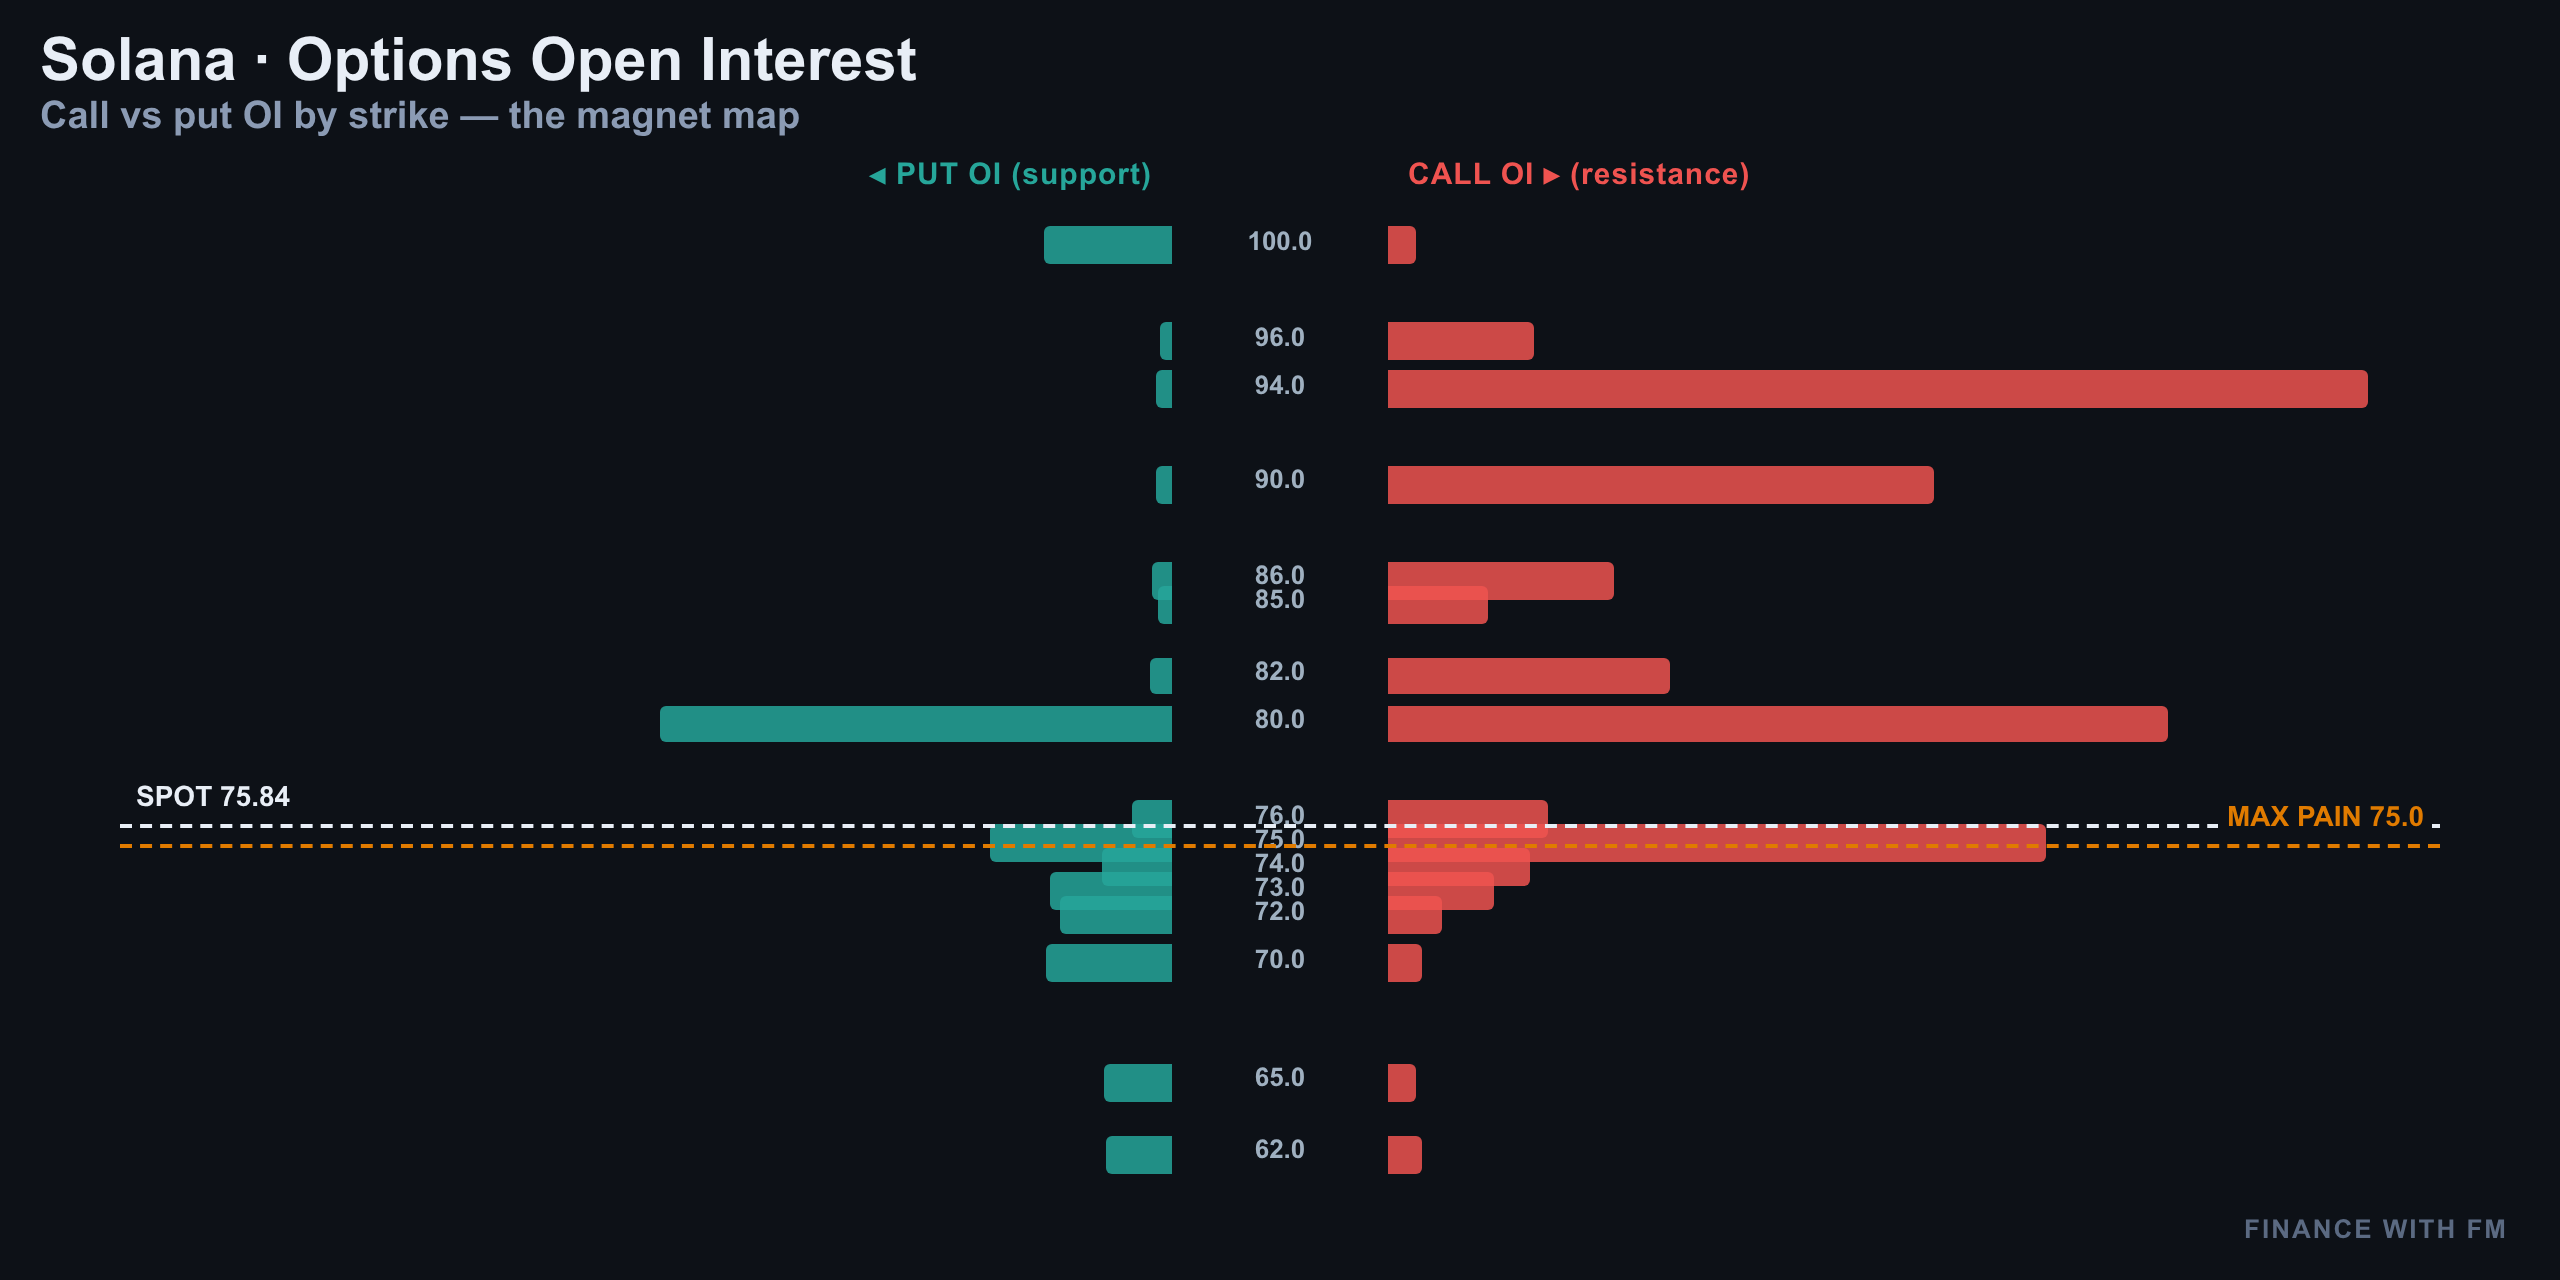
Max pain for the August 9 expiry sits exactly at $75 — effectively pinning spot into today's close. The heaviest resistance overhead is the call wall at $94, while the strongest dealer-defended floor is the put wall, which also lines up right at $75. When your max pain and your put wall converge on the same number, that's a magnet, not a coincidence.
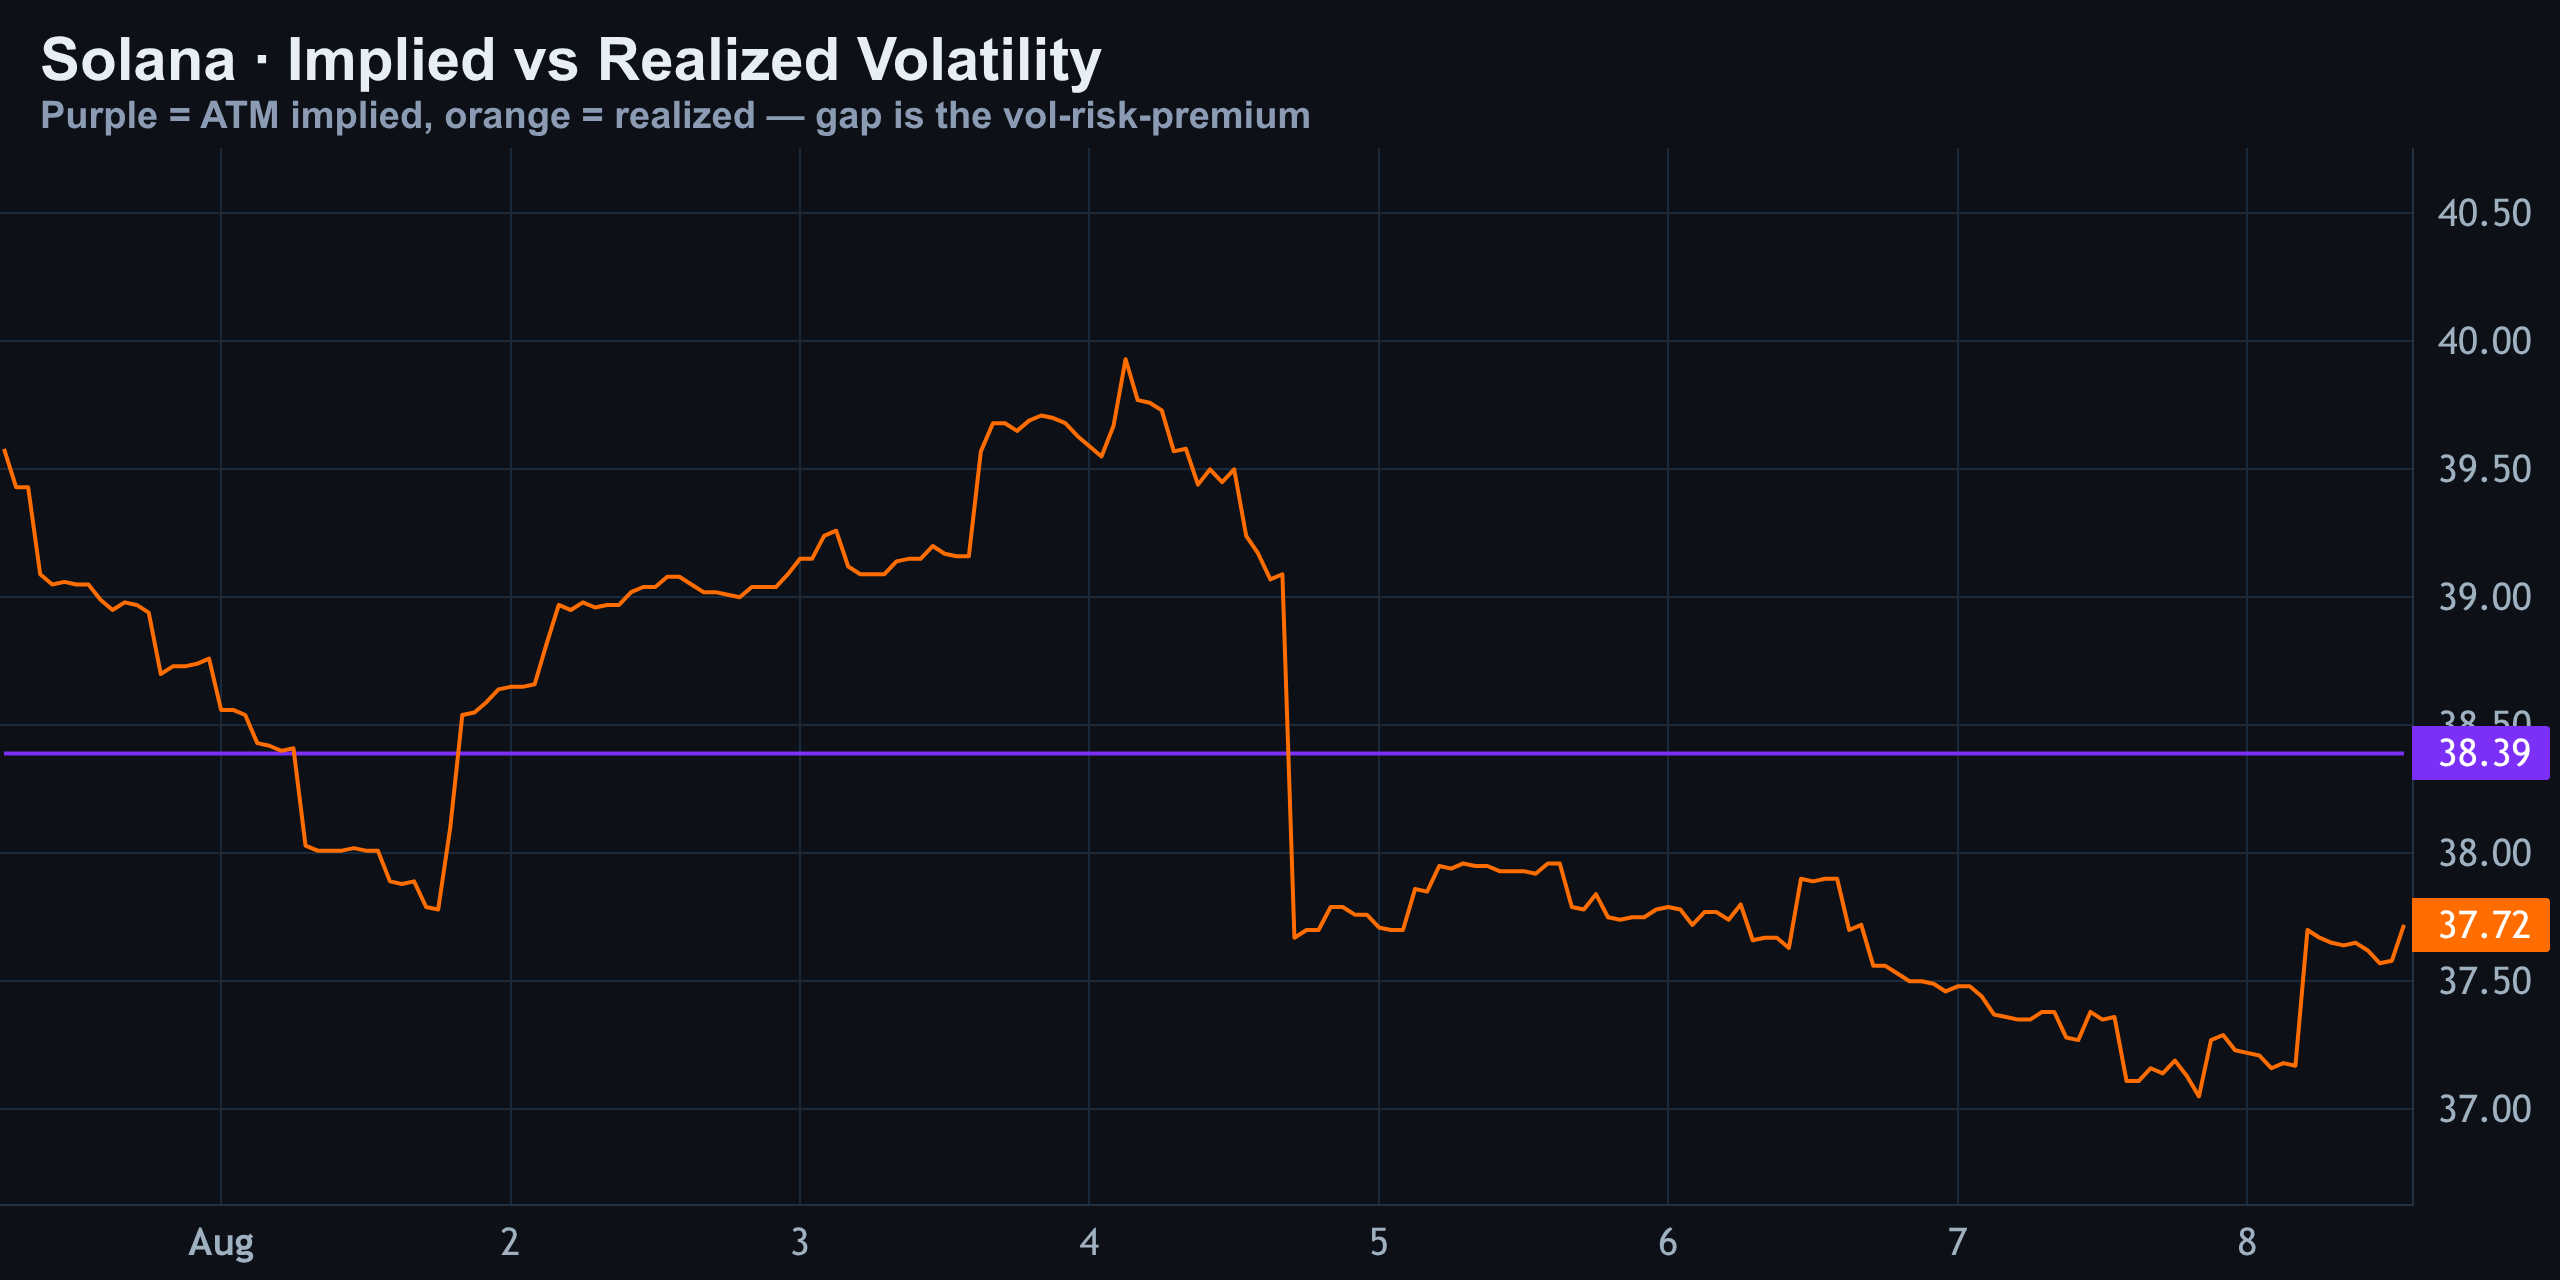
Implied volatility is running at 38.4% against realized volatility of 37.7%, producing a vol-risk-premium of about +0.7. That's mild, not extreme — but it tells you volatility sellers hold a small edge in this environment rather than a screaming one.
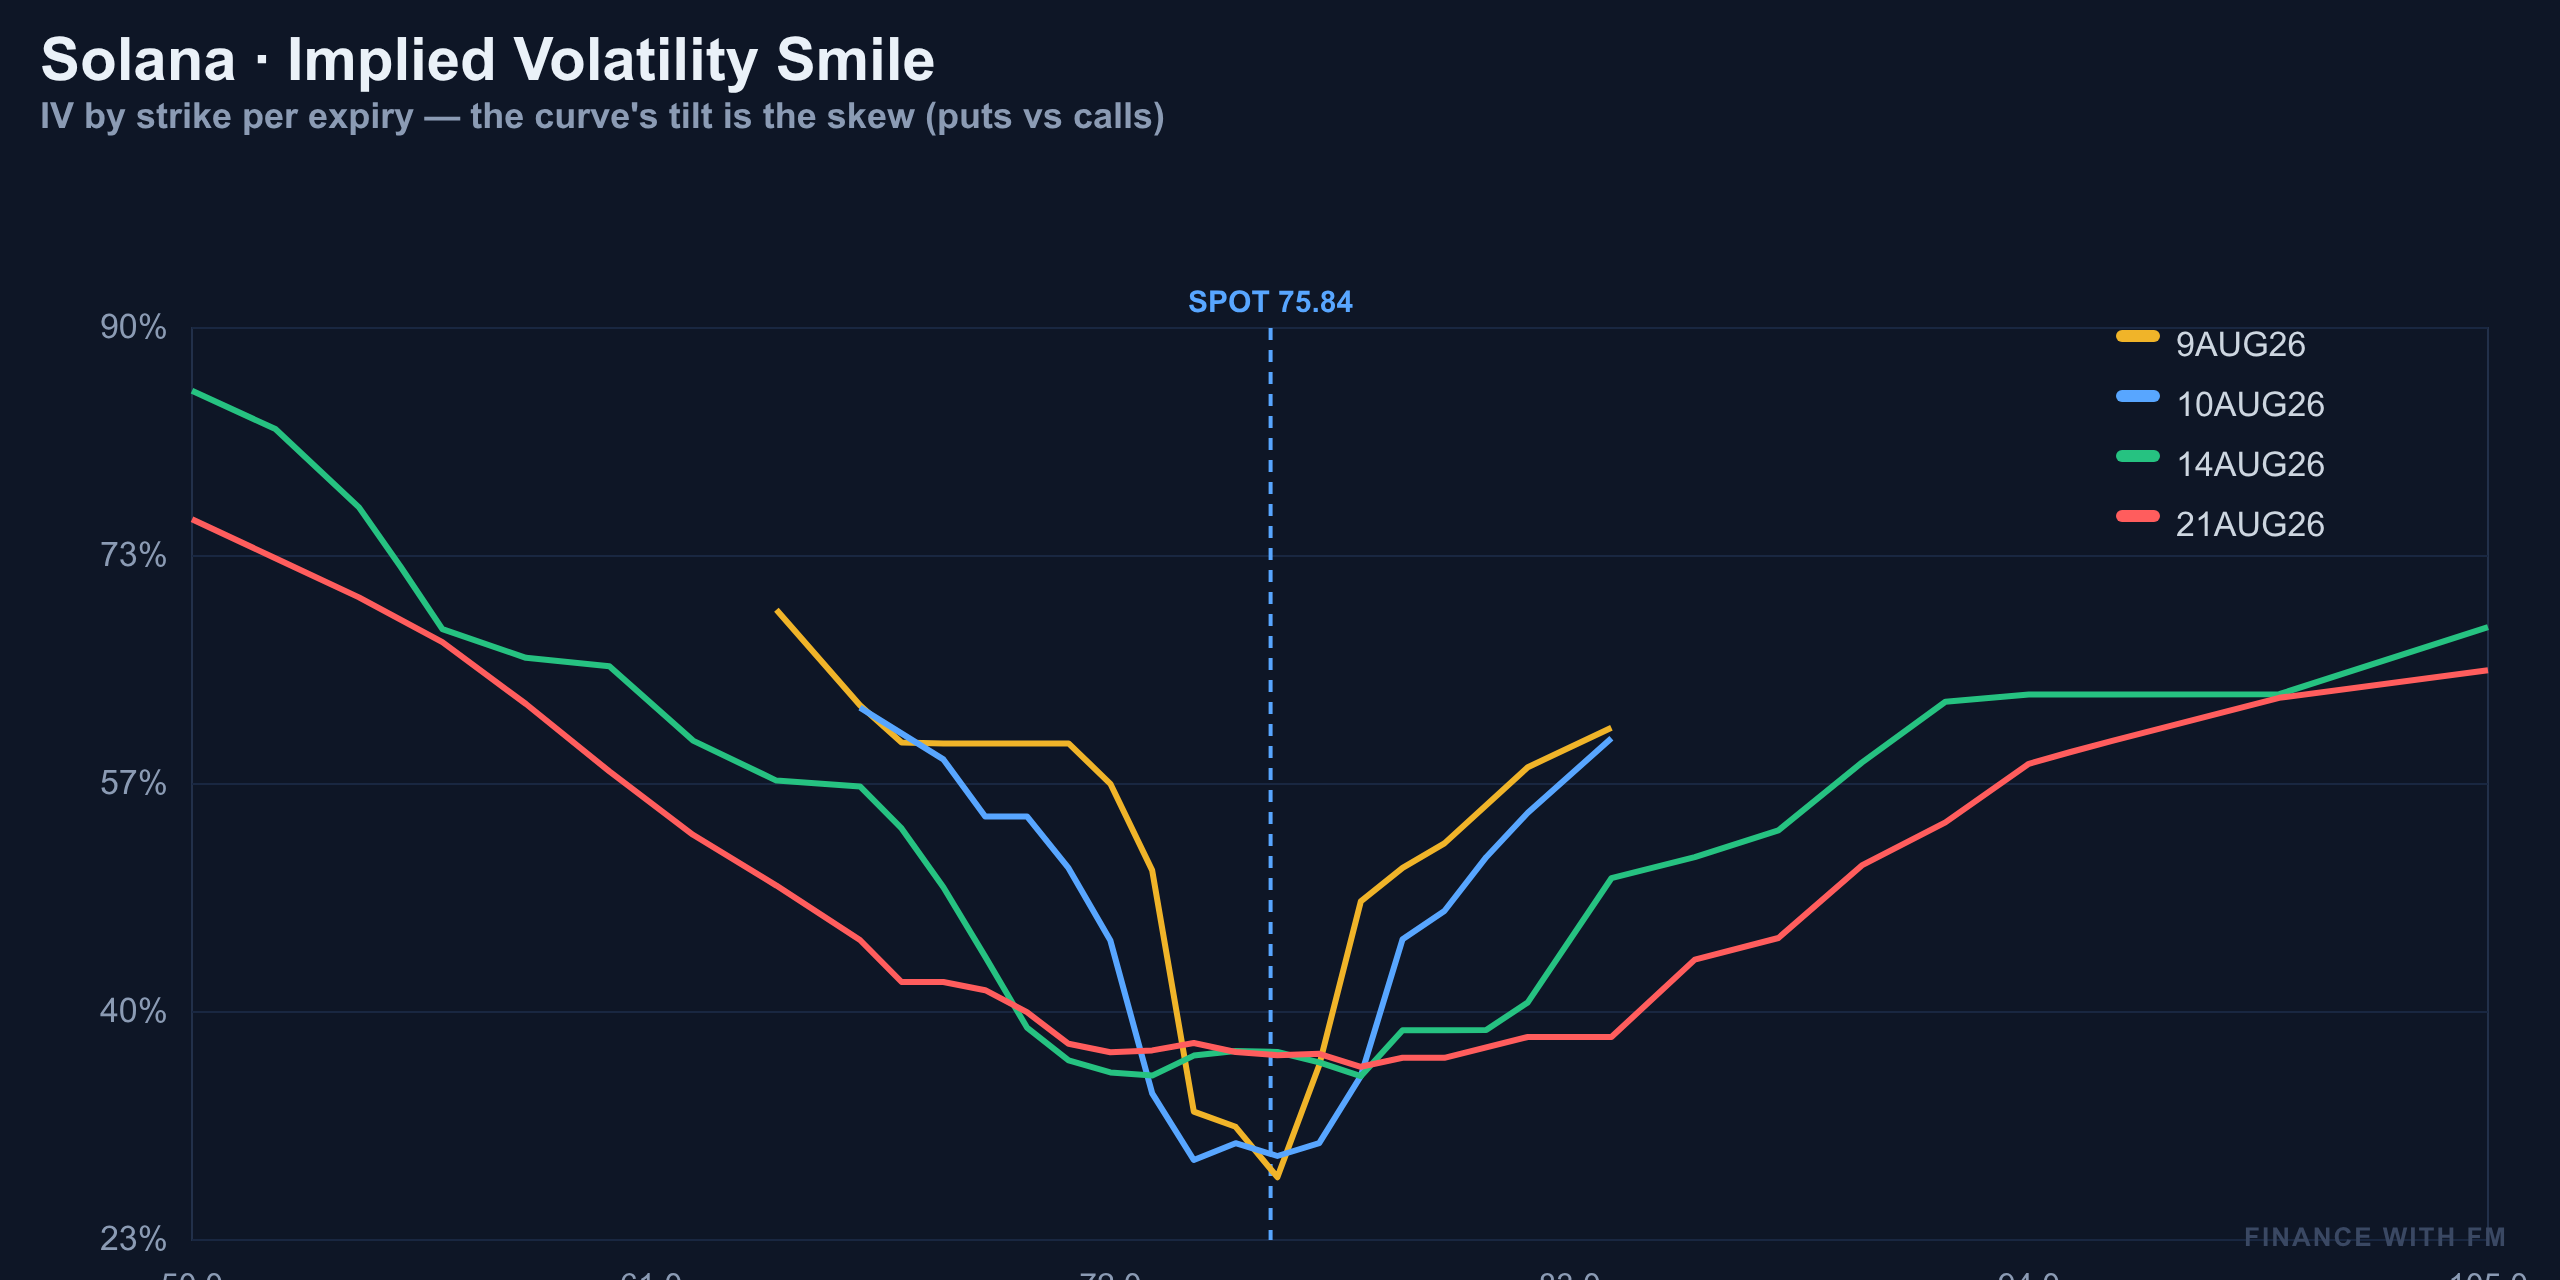
The 25-delta skew reads -1.1%, meaning calls are bid over puts. Traders are paying up for upside exposure rather than downside insurance right now. Looking at the smile across strikes, the left wing (downside puts) trades cheaper relative to the right wing (upside calls) — confirming that same tilt toward chasing a rally rather than hedging a crash.
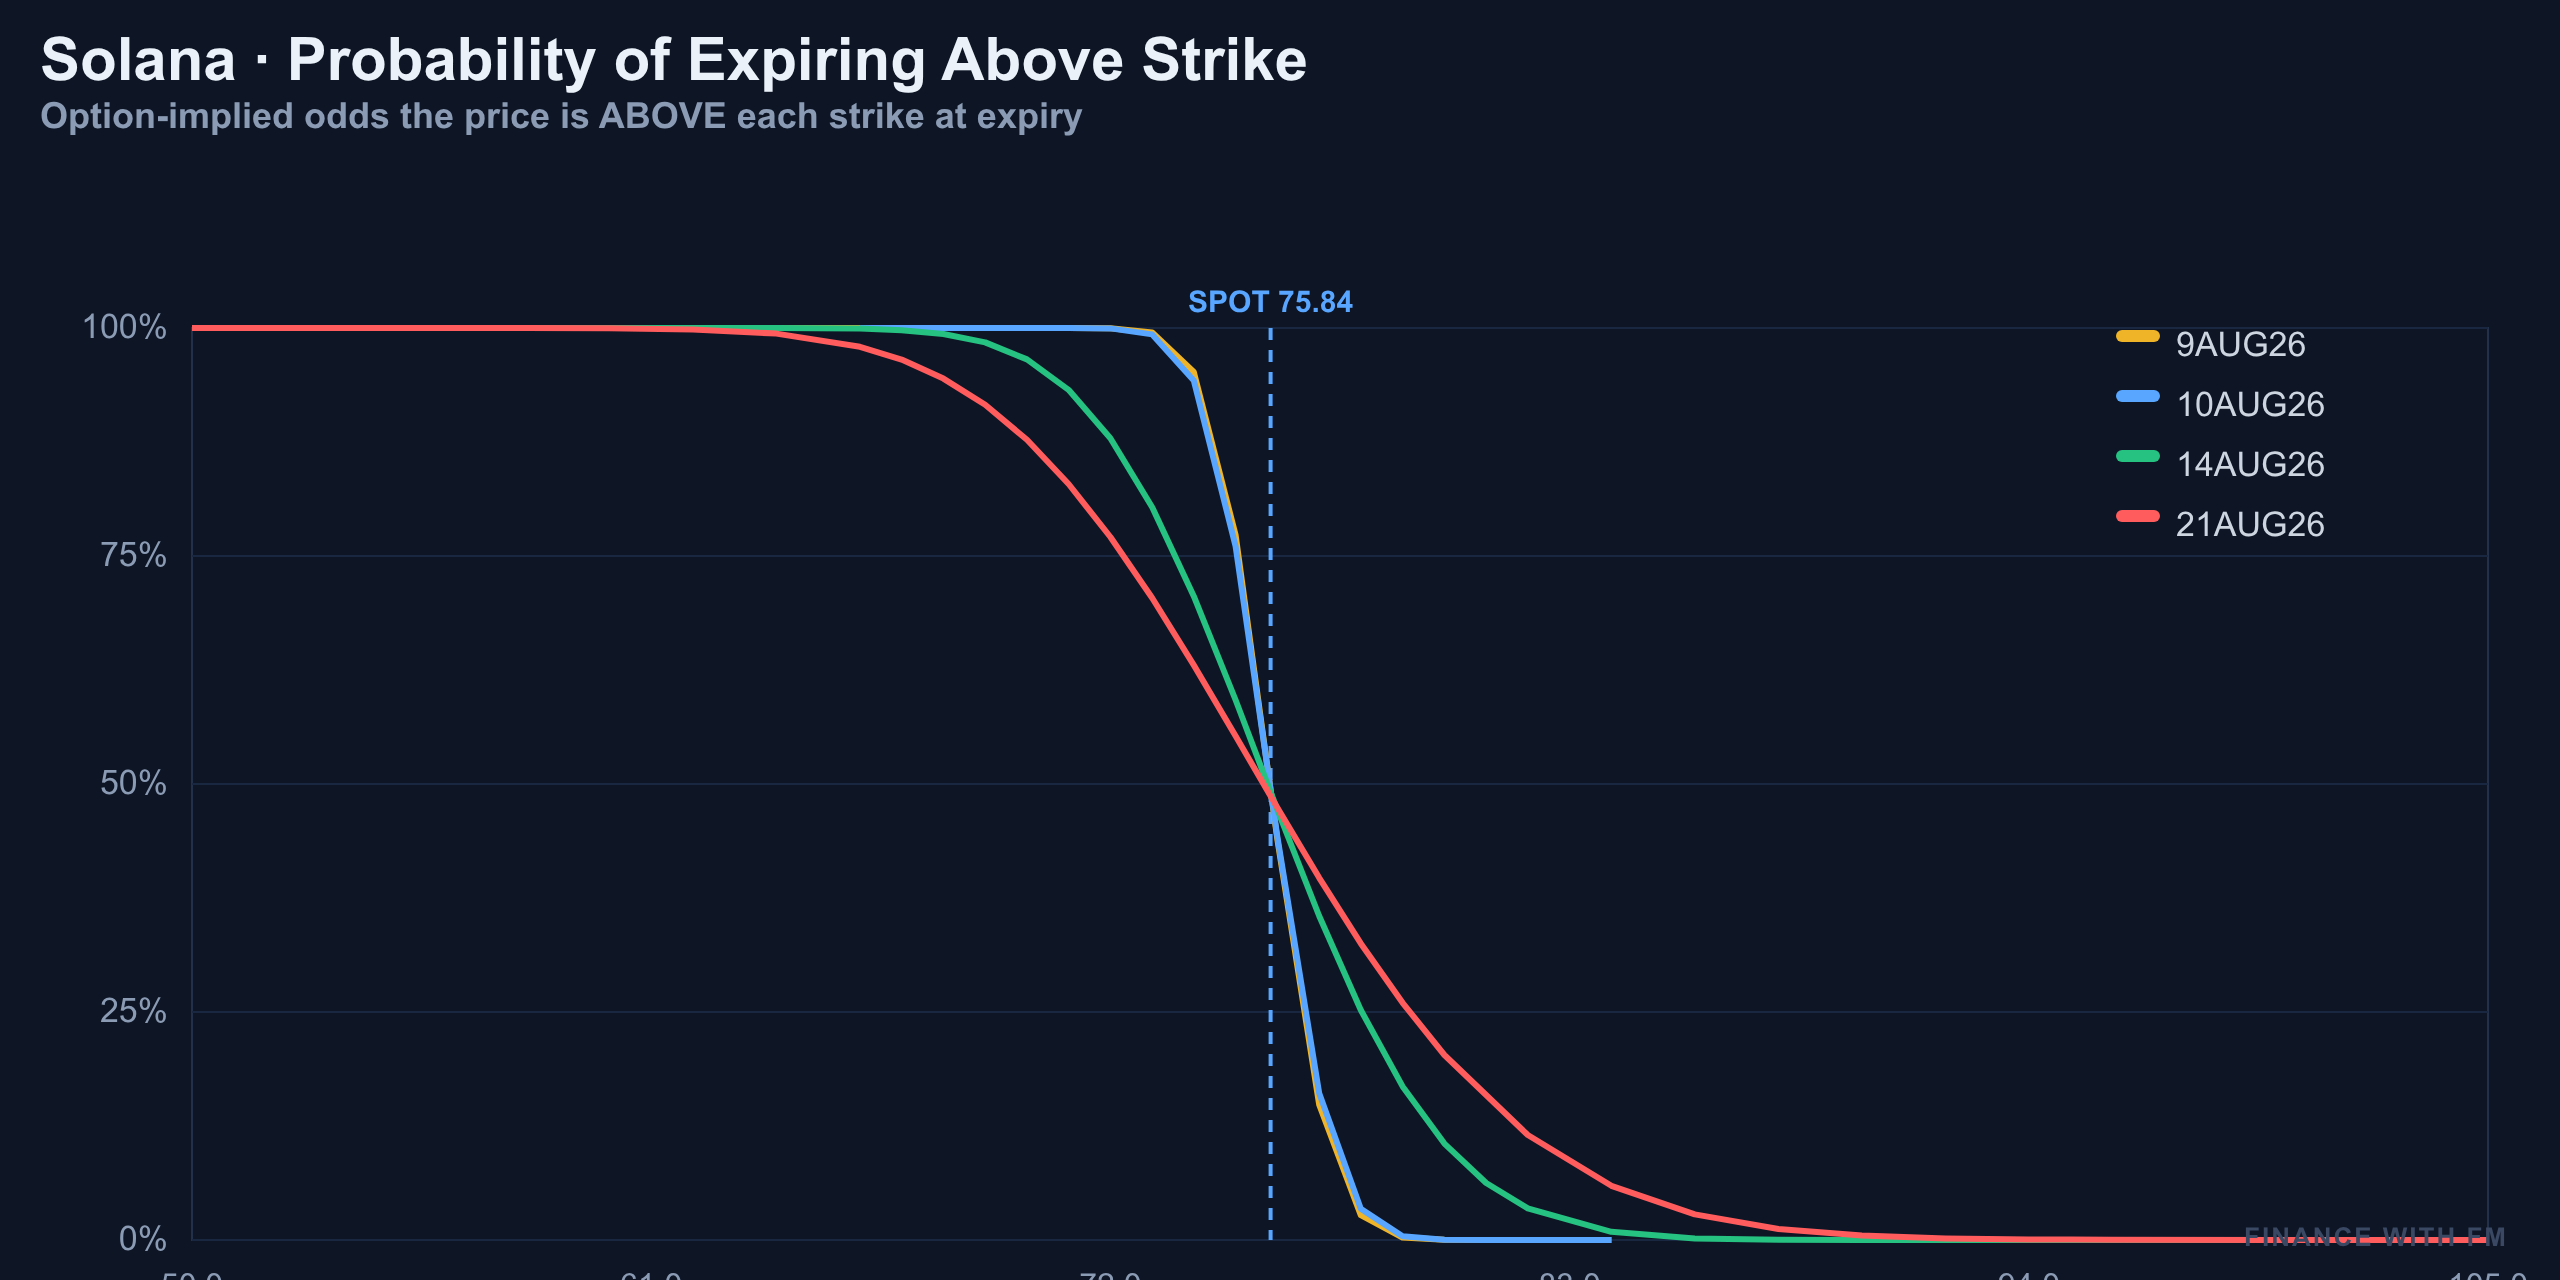
For the August 21 expiry, the market prices only about a 6% chance Solana closes above $84 — a genuinely low-probability tail move. That probability curve backs up everything else on the board: this market expects containment, not a breakout.
| Options Metric | Reading |
|---|---|
| Implied Volatility | 38.4% |
| Realized Volatility | 37.7% |
| Vol-Risk-Premium | +0.7 |
| Put/Call (Open Interest) | 0.45 |
| Put/Call (Volume) | 0.63 |
| 25-Delta Skew | -1.1% |
| Max Pain (Aug 9 exp.) | $75.00 |
| Call Wall | $94.00 |
| Put Wall | $75.00 |
Reading The Charts: From The 15-Minute Grind To The Monthly Range
Zoom into the 15-minute chart and you see today's entire story in one glance: a steady grind higher inside a rising channel, starting from the low-$73s overnight and stair-stepping into the $75 zone. The move accelerated sharply around midday on a volume spike, pushing price right into the top of that ascending channel — the exact area where sellers have stepped in before on this chart.
Stretch the lens to four hours and the picture sharpens. Solana got hammered down to around $71 on August 1, then carved out a steady, higher-low recovery that's brought it right back to $75.40. That's also where a descending trendline from the July highs near $78–$79 is capping things. Pressed into resistance while riding a rising support line from below — that's a textbook squeeze setup.
On the daily chart, Solana has been trapped in a wide range for months. The swing high sits at $98.41 back in May; the swing low near $60.13 from June. Price now sits almost dead center at $75.41, hugging the underside of a shorter-term descending trendline drawn off the July highs. Neither the top nor bottom of this bigger range has been tested in weeks — this is chop, not trend, and that matters enormously for how you size any trade here.
| Timeframe | Key Level | What It Means |
|---|---|---|
| 15-min | Top of rising channel (~$75.5) | Immediate resistance / live battleground |
| 4-hour | Descending trendline (~$78-79) | Caps the recovery from Aug 1 low |
| 4-hour | Rising support from $71 low | Structure holds while price stays above it |
| Daily | Range high $98.41 (May) | Untested for weeks |
| Daily | Range low $60.13 (June) | Untested for weeks |
Momentum Check: RSI And MACD
Momentum indicators are broadly aligned with the 'neutral leaning constructive' read from price structure. RSI (14) is off its recent lows and trending up without pushing into overbought territory — it's turning, not screaming.
MACD tells the same story: the histogram is compressing toward the zero line as the signal and MACD lines converge, hinting at a possible bullish cross forming — but it hasn't confirmed yet. This is exactly the kind of setup where jumping in early on momentum alone tends to get punished.
The Liquidation Trap Below Spot
Here's the part that doesn't show up on a candlestick chart. Funding rates show longs are crowded on this move — retail has piled onto one side of the trade after the 2.3% pop. Underneath that crowded long positioning sits a wall of stacked liquidity, quietly waiting just below spot.
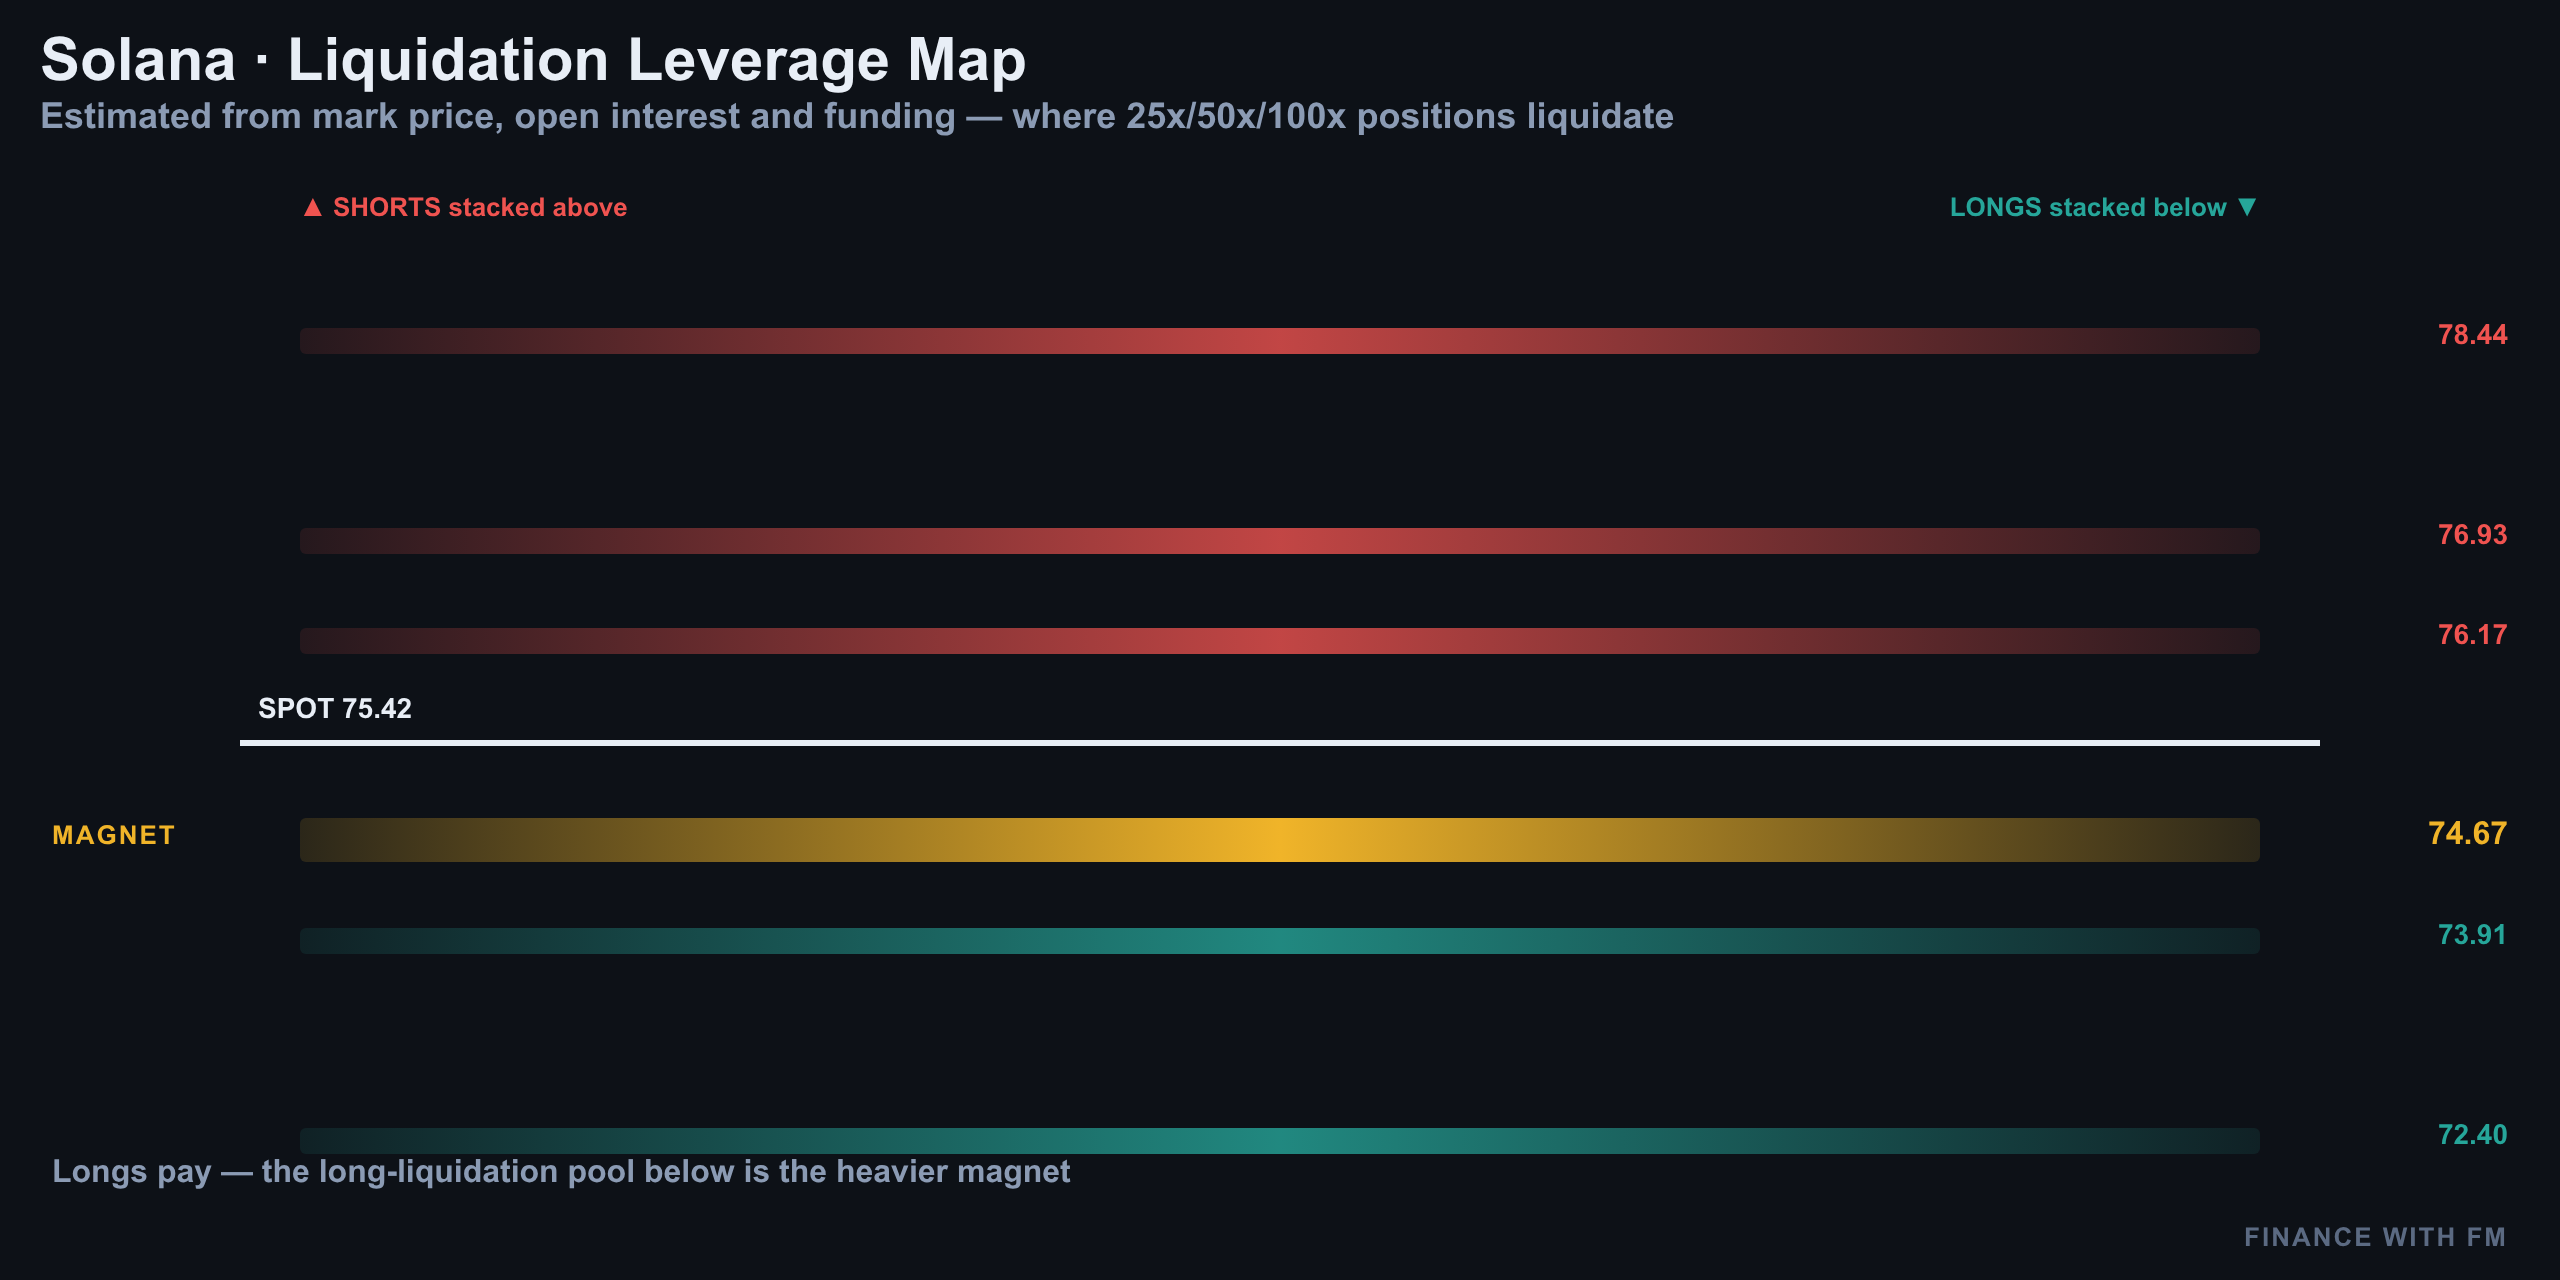
That combination — crowded longs plus a liquidation cluster below — is a classic setup for a sharp, fast wick lower if sellers even lightly test the zone. It doesn't mean a crash is coming; it means the risk of a violent short-term flush is elevated, and chasing the move here without respecting that risk is how good trades turn into bad ones.
| Signal | Reading | Implication |
|---|---|---|
| Taker flow | Aggressive buy-side | Short-term bullish pressure |
| Funding rate | Elevated / longs crowded | Squeeze risk if price stalls |
| Liquidation cluster | Stacked just below spot | Fast downside wick risk |
| Price vs 50 & 200 DMA | Boxed between the two | No clean trend confirmation |
Gamma exposure adds another layer. Dealers are positioned in a way that tends to dampen big moves near current levels — consistent with the low realized volatility and the $75 pin from max pain. That gamma profile is exactly why price has been grinding rather than trending.
The expected move confirms the same containment. For tomorrow, August 9, the one-sigma range is roughly $74 to $77, and the two-sigma (about 95% confidence) range widens only to $73–$79. In plain terms: the options market thinks Solana stays boxed near current levels far more than it thinks it breaks out in either direction.
| Horizon | Range | Confidence |
|---|---|---|
| 1-day (Aug 9) | $74 – $77 | ~68% (1-sigma) |
| 1-day (Aug 9) | $73 – $79 | ~95% (2-sigma) |
| Aug 21 expiry | Above $84 | ~6% probability |
Today's Drivers And Why The Desk Is Standing Aside
Put it all together and Solana at $75.48 is a genuinely mixed picture. Momentum is turning up, taker flow is aggressive on the buy side — but funding shows longs are crowded, price is boxed between the 50- and 200-day moving averages, and options positioning shows a market that expects containment rather than a breakout. Call it neutral leaning constructive — not a trend worth chasing yet.
There's no clean 1:2.5 reward-to-risk trade on the table today. The magnet at $75 (max pain, put wall, and gamma cluster all converging) argues for chop into the close. The liquidation cluster below spot argues for caution on new longs. And the descending trendline overhead on the 4-hour caps upside without a decisive break. When the math doesn't line up cleanly, the disciplined move is to stand aside.
Summary: The Levels That Matter Into Tomorrow's Close
Solana trades at $75.48 today, up 2.3% after tagging a low near $73.17. The $75 level is doing a lot of work right now — it's max pain, it's the put wall, and it's where gamma exposure clusters. Until that pin breaks decisively in either direction, expect more chop than trend.
| Level | Price | Significance |
|---|---|---|
| Call wall | $94.00 | Major overhead resistance |
| 4H descending trendline | ~$78-79 | Near-term cap on the recovery |
| Max pain / Put wall / Gamma cluster | $75.00 | The pin — key battleground into expiry |
| Current spot | $75.48 | +2.3% on the day |
| 4H rising support | ~$71.00 | Structure breaks if lost |
| Daily range low | $60.13 | Months-long floor |
A close and hold above $78-79 would start to shift the bias from neutral toward genuinely constructive. A break below the rising 4-hour support near $71, especially with the liquidation cluster below spot, would flip the picture bearish fast. Until one of those happens, the desk stays flat — and that's the whole point of today's Daily Pulse.
08/01/2026 — Solana Price Today: The $73 Pin And Bearish Setup
Solana Price Today: The $73 Pin And Bearish Setup
Where We Left It — 7 Days Ago
On July 25, Finance With FM called Solana trapped at $73.94, boxed between the 50-day and 200-day moving averages, with no clean setup worth taking. The call was to stand aside.
That patience held up. Over the following week, Solana didn't rip in either direction — it simply bled. Price slipped 1.3%, from $73.88 down to today's $72.93. No trade was forced, and none was needed. The range just kept grinding lower.
The Options Board: A Mixed Signal At $73
Solana's options market is telling two slightly different stories depending on which lens you use. The put-call ratio by open interest sits at 0.51 — technically bullish-leaning, since there's more call open interest sitting on the board than puts. But flip to today's volume, and the ratio jumps to 0.68, meaning traders are actively buying downside protection right now, not just holding old positions.
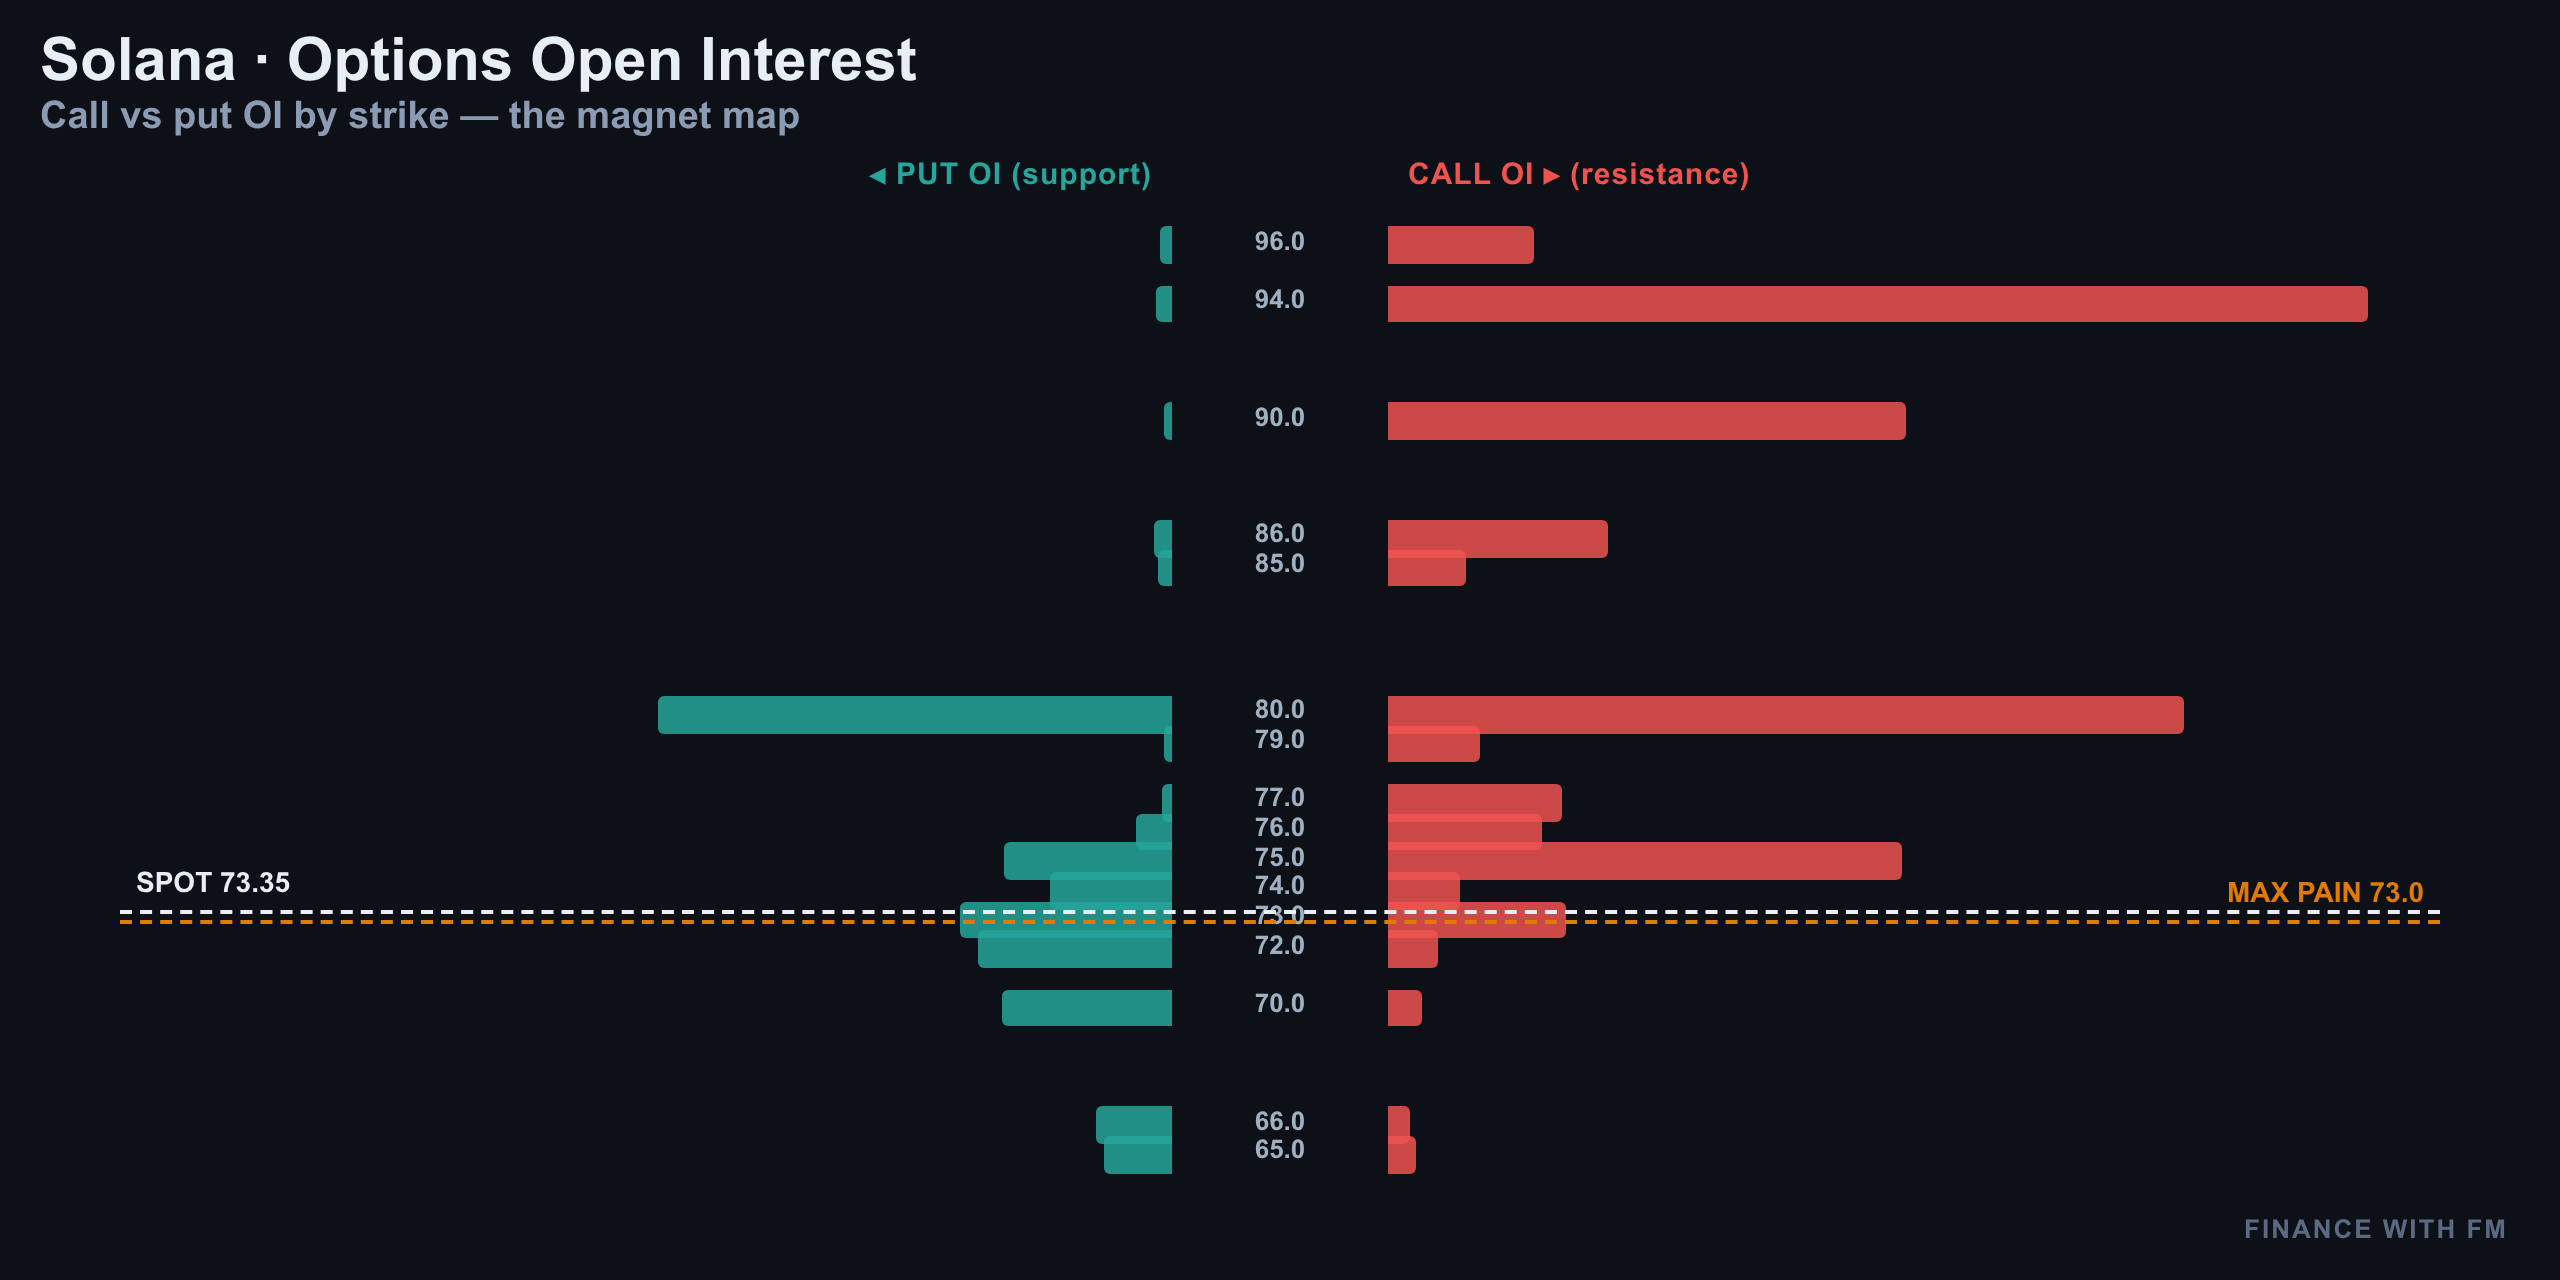
Max pain for the nearest expiry sits right at $73.00 — essentially glued to spot, acting like a magnet into expiry. The put wall reinforces that same level at $73, while the call wall sits way up at $94.00. That gap between the pin and the call wall tells you dealers have no incentive to let this thing run right now.
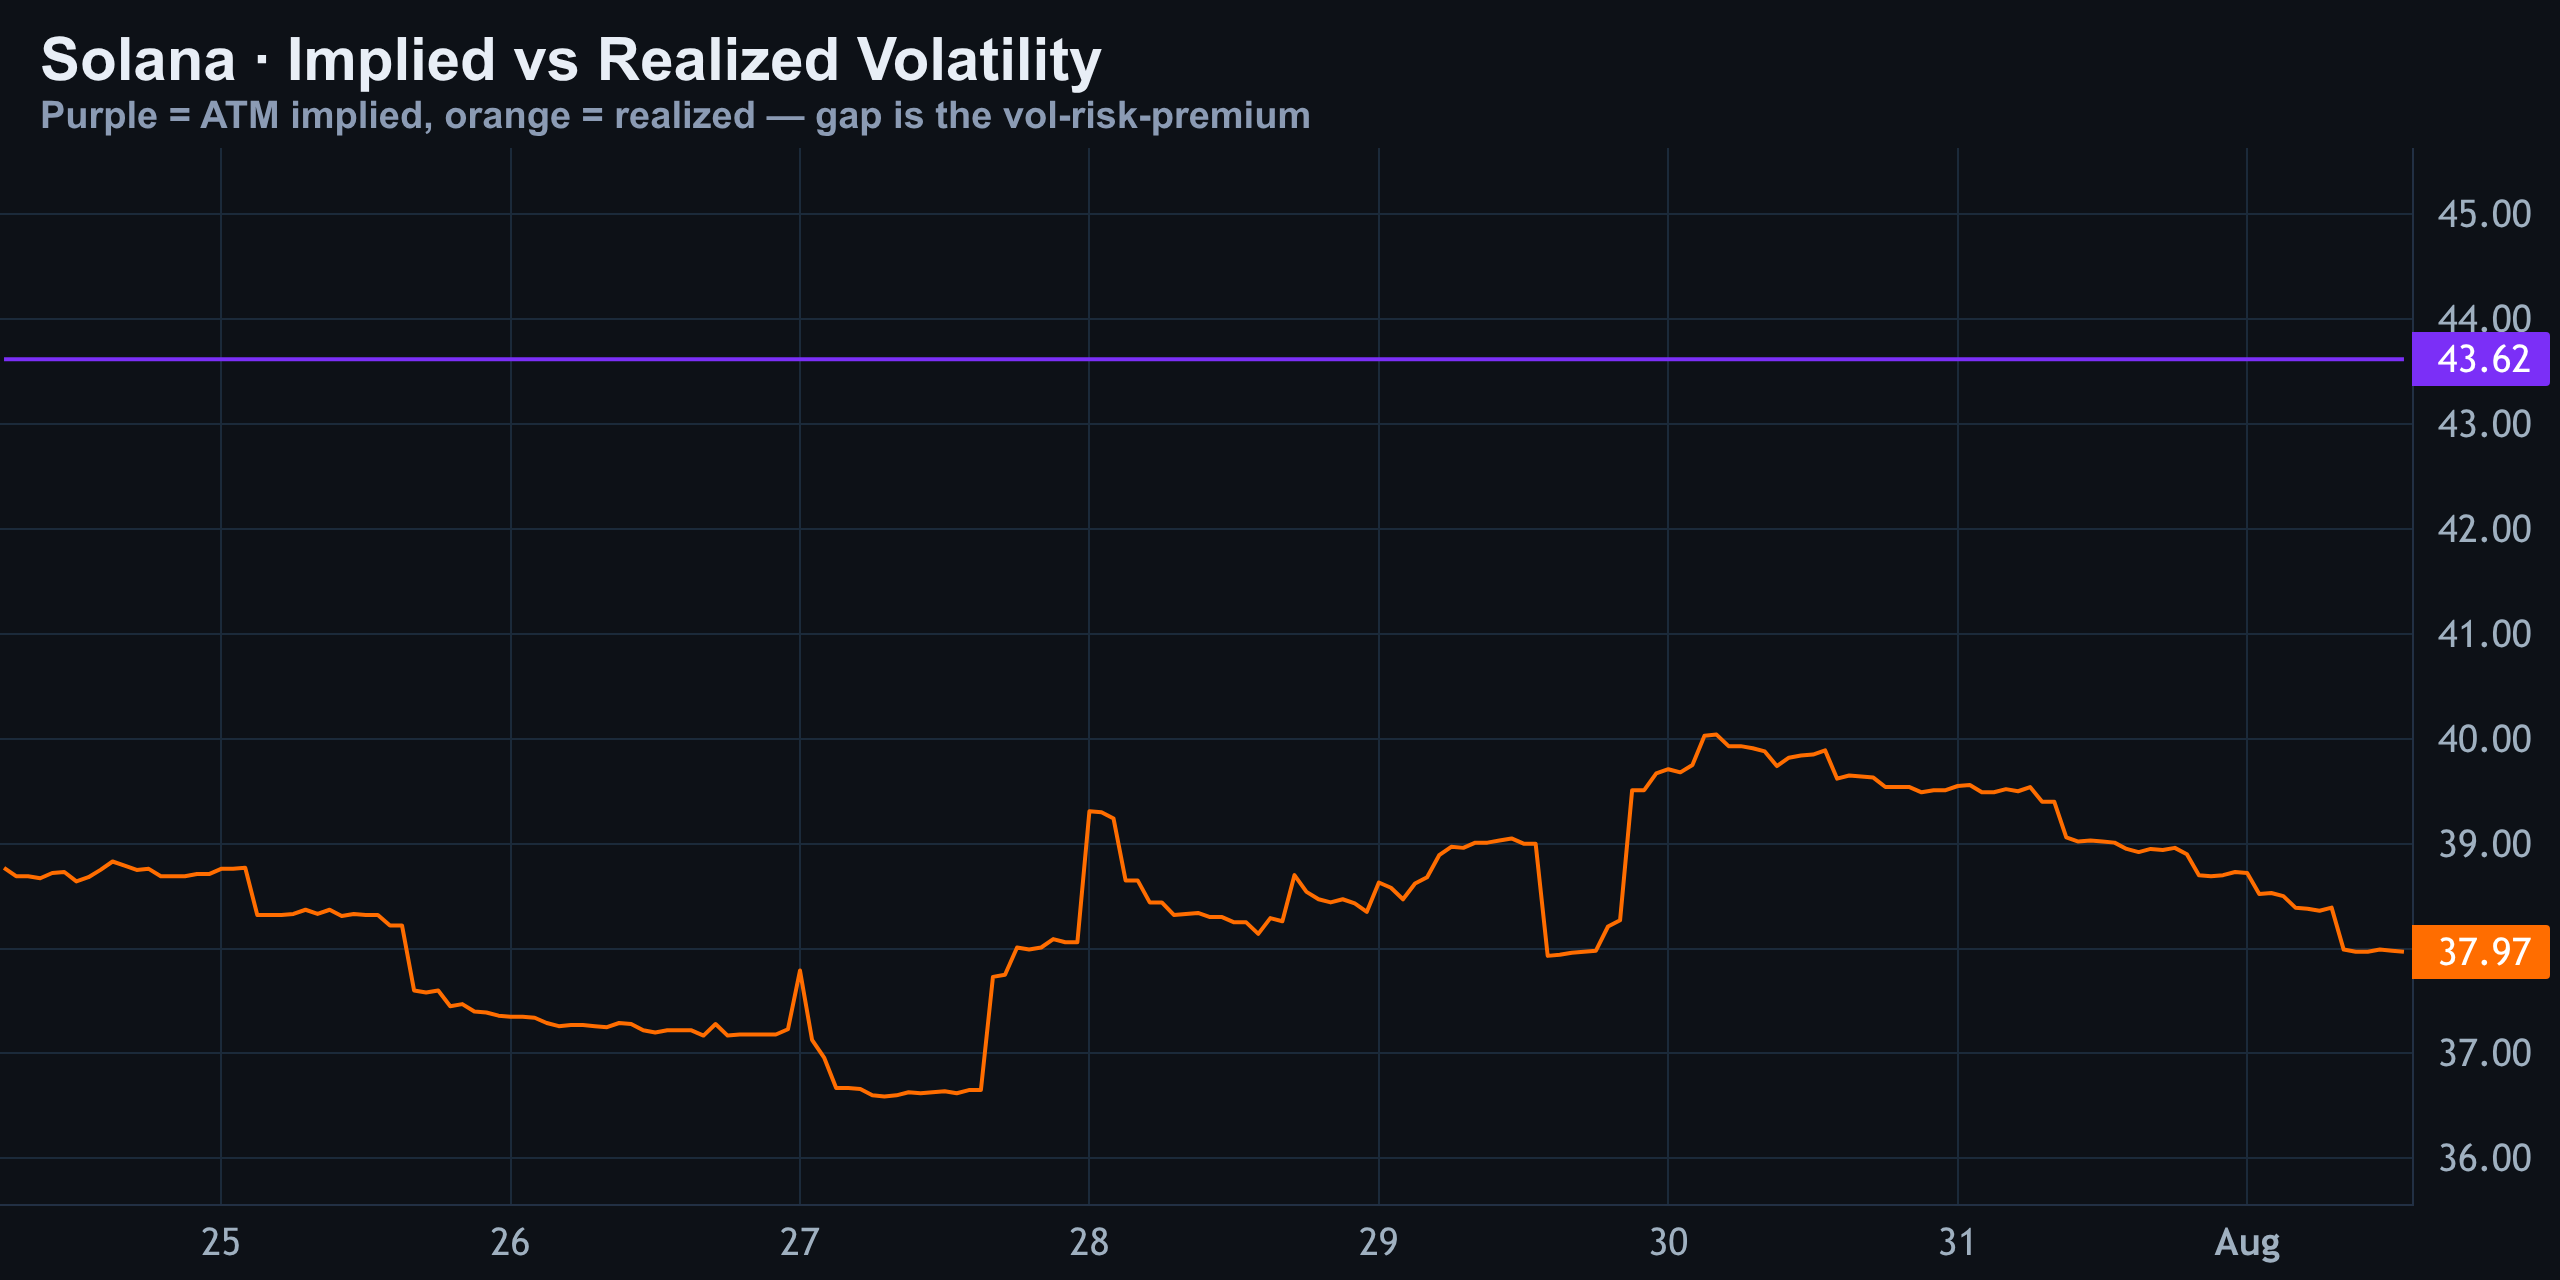
Implied volatility is running at 43.6% against realized volatility of 38.0% — a vol-risk-premium of +5.6 points. That gap means options are running a bit rich relative to actual price movement, which historically gives premium *sellers* a slight statistical edge in this environment.
The IV Smile: The Market Is Paying For Downside
The 25-delta skew is sitting at +13.8%, and that's puts bid over calls. In plain terms: the market is quietly paying up for downside insurance, even while the tape looks calm on the surface.
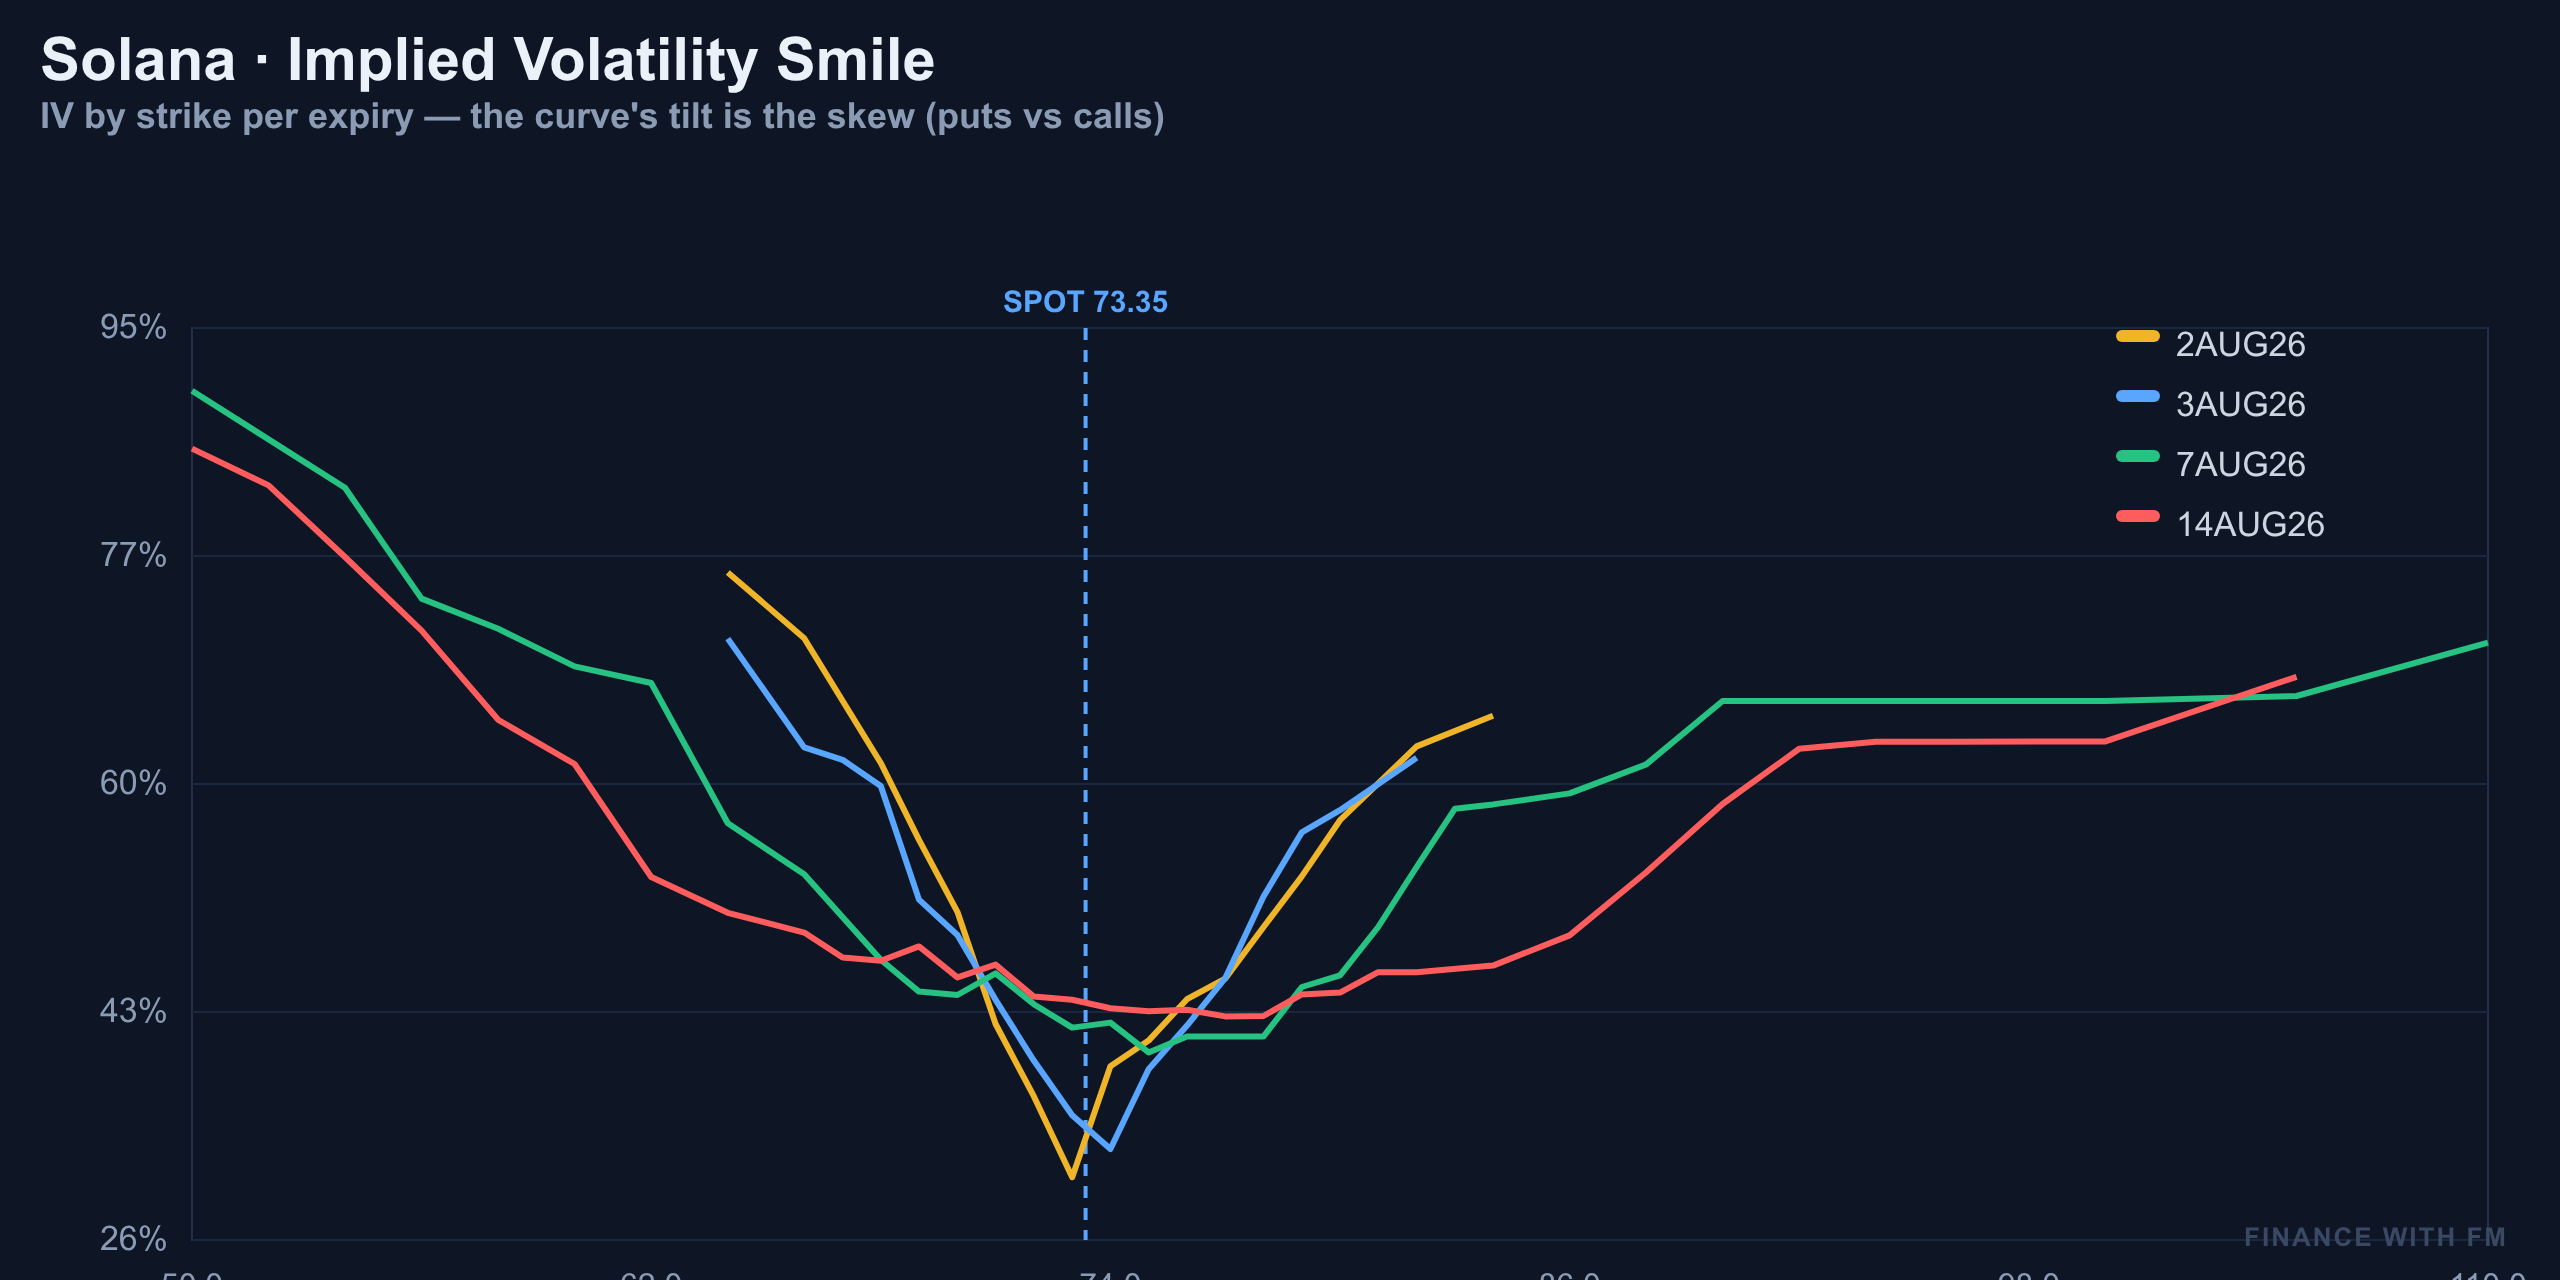
With the smile tilted this hard toward the put side, downside strikes are commanding a real premium over equivalent upside calls. It's not panic — the curve isn't screaming — but it's not complacent either. It's a smile that says hedge first, chase later.
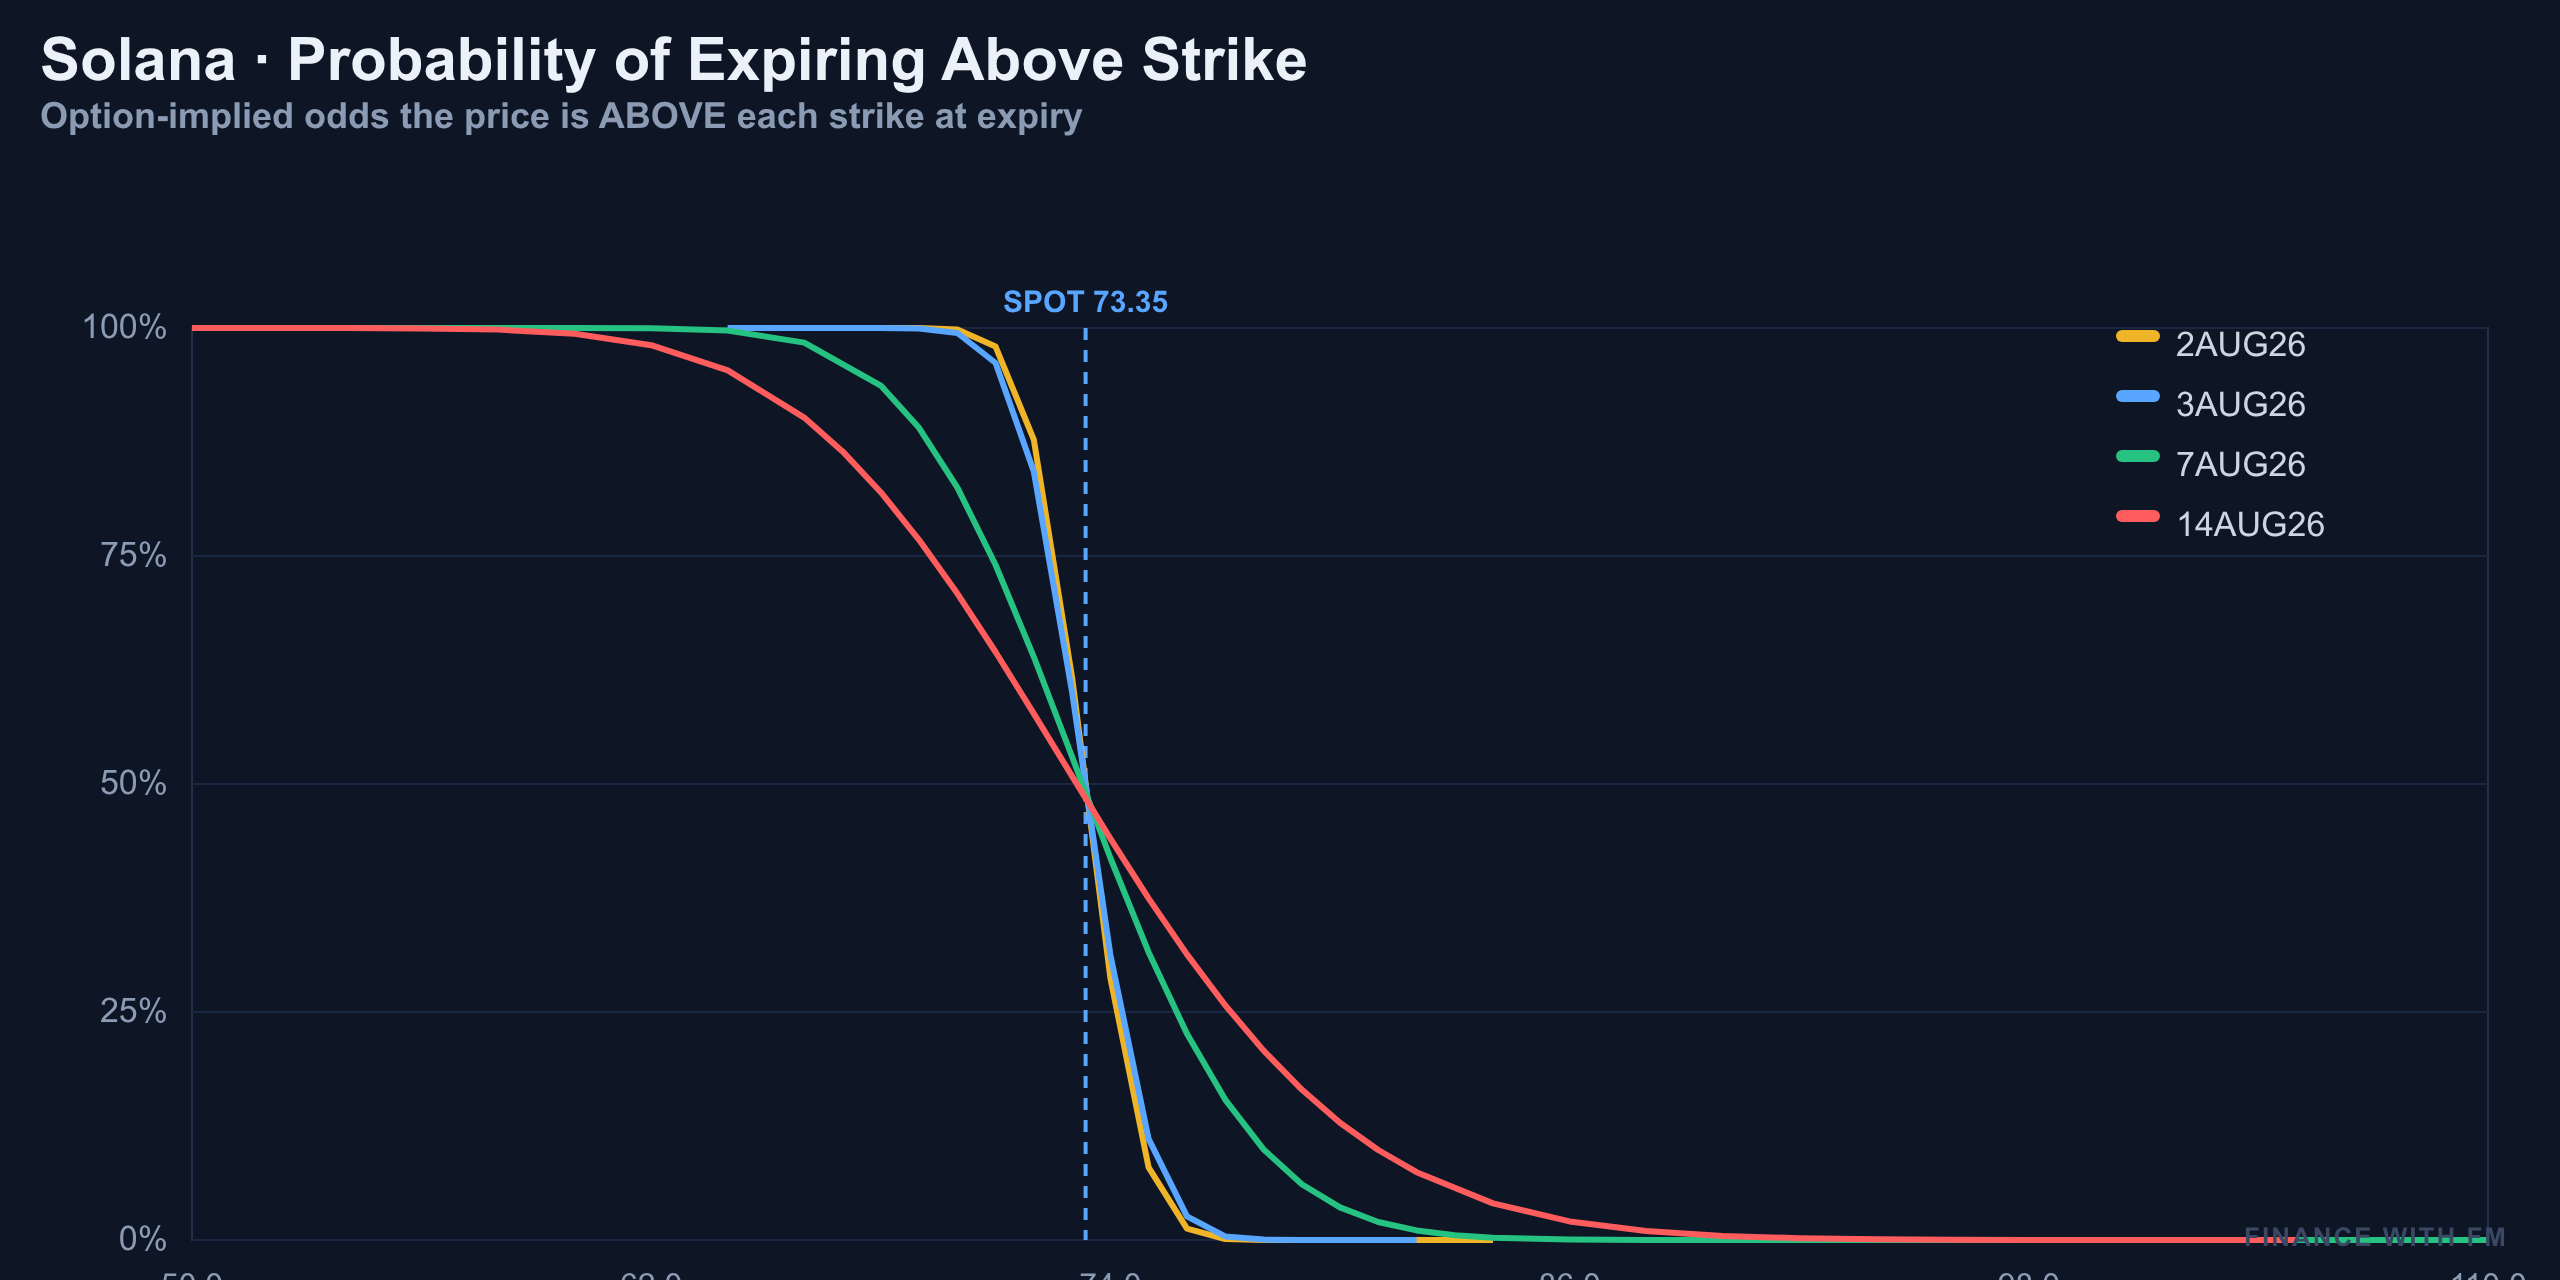
Zooming out to the August 14 expiry, the option-implied odds of Solana trading above $81 sit at only around 10%. That's a low-probability tail from here. The options market simply isn't pricing a breakout in the next two weeks — this is a market boxed in, not one gearing up for a moonshot.
Options Snapshot
| Metric | Reading |
|---|---|
| Implied Volatility | 43.6% |
| Realized Volatility | 38.0% |
| Vol Risk Premium | +5.6 pts |
| Put/Call (Open Interest) | 0.51 |
| Put/Call (Volume) | 0.68 |
| 25-Delta Skew | +13.8% (put-bid) |
| Max Pain (nearest expiry) | $73.00 |
| Call Wall | $94.00 |
| Put Wall | $73.00 |
| Prob. Above $81 (Aug 14 exp.) | ~10% |
Desk Snapshot: Calm On Top, Bearish Underneath
Solana's spot price sits at $72.93, down a little under 1% on the day. On the surface, it looks calm — price is boxed inside a tight range and hasn't gone anywhere fast. But underneath, three things are lining up against the bulls: open interest is shrinking, taker flow is aggressively selling into the pin, and the computed structure points to a short.
Call it neutral on the tape, bearish underneath. A pin like this can only hold so long before it breaks one way — and right now, the pressure is building to the downside.
Chart Breakdown: 15-Minute, 4-Hour, And Daily
15-Minute — Boxed And Fading
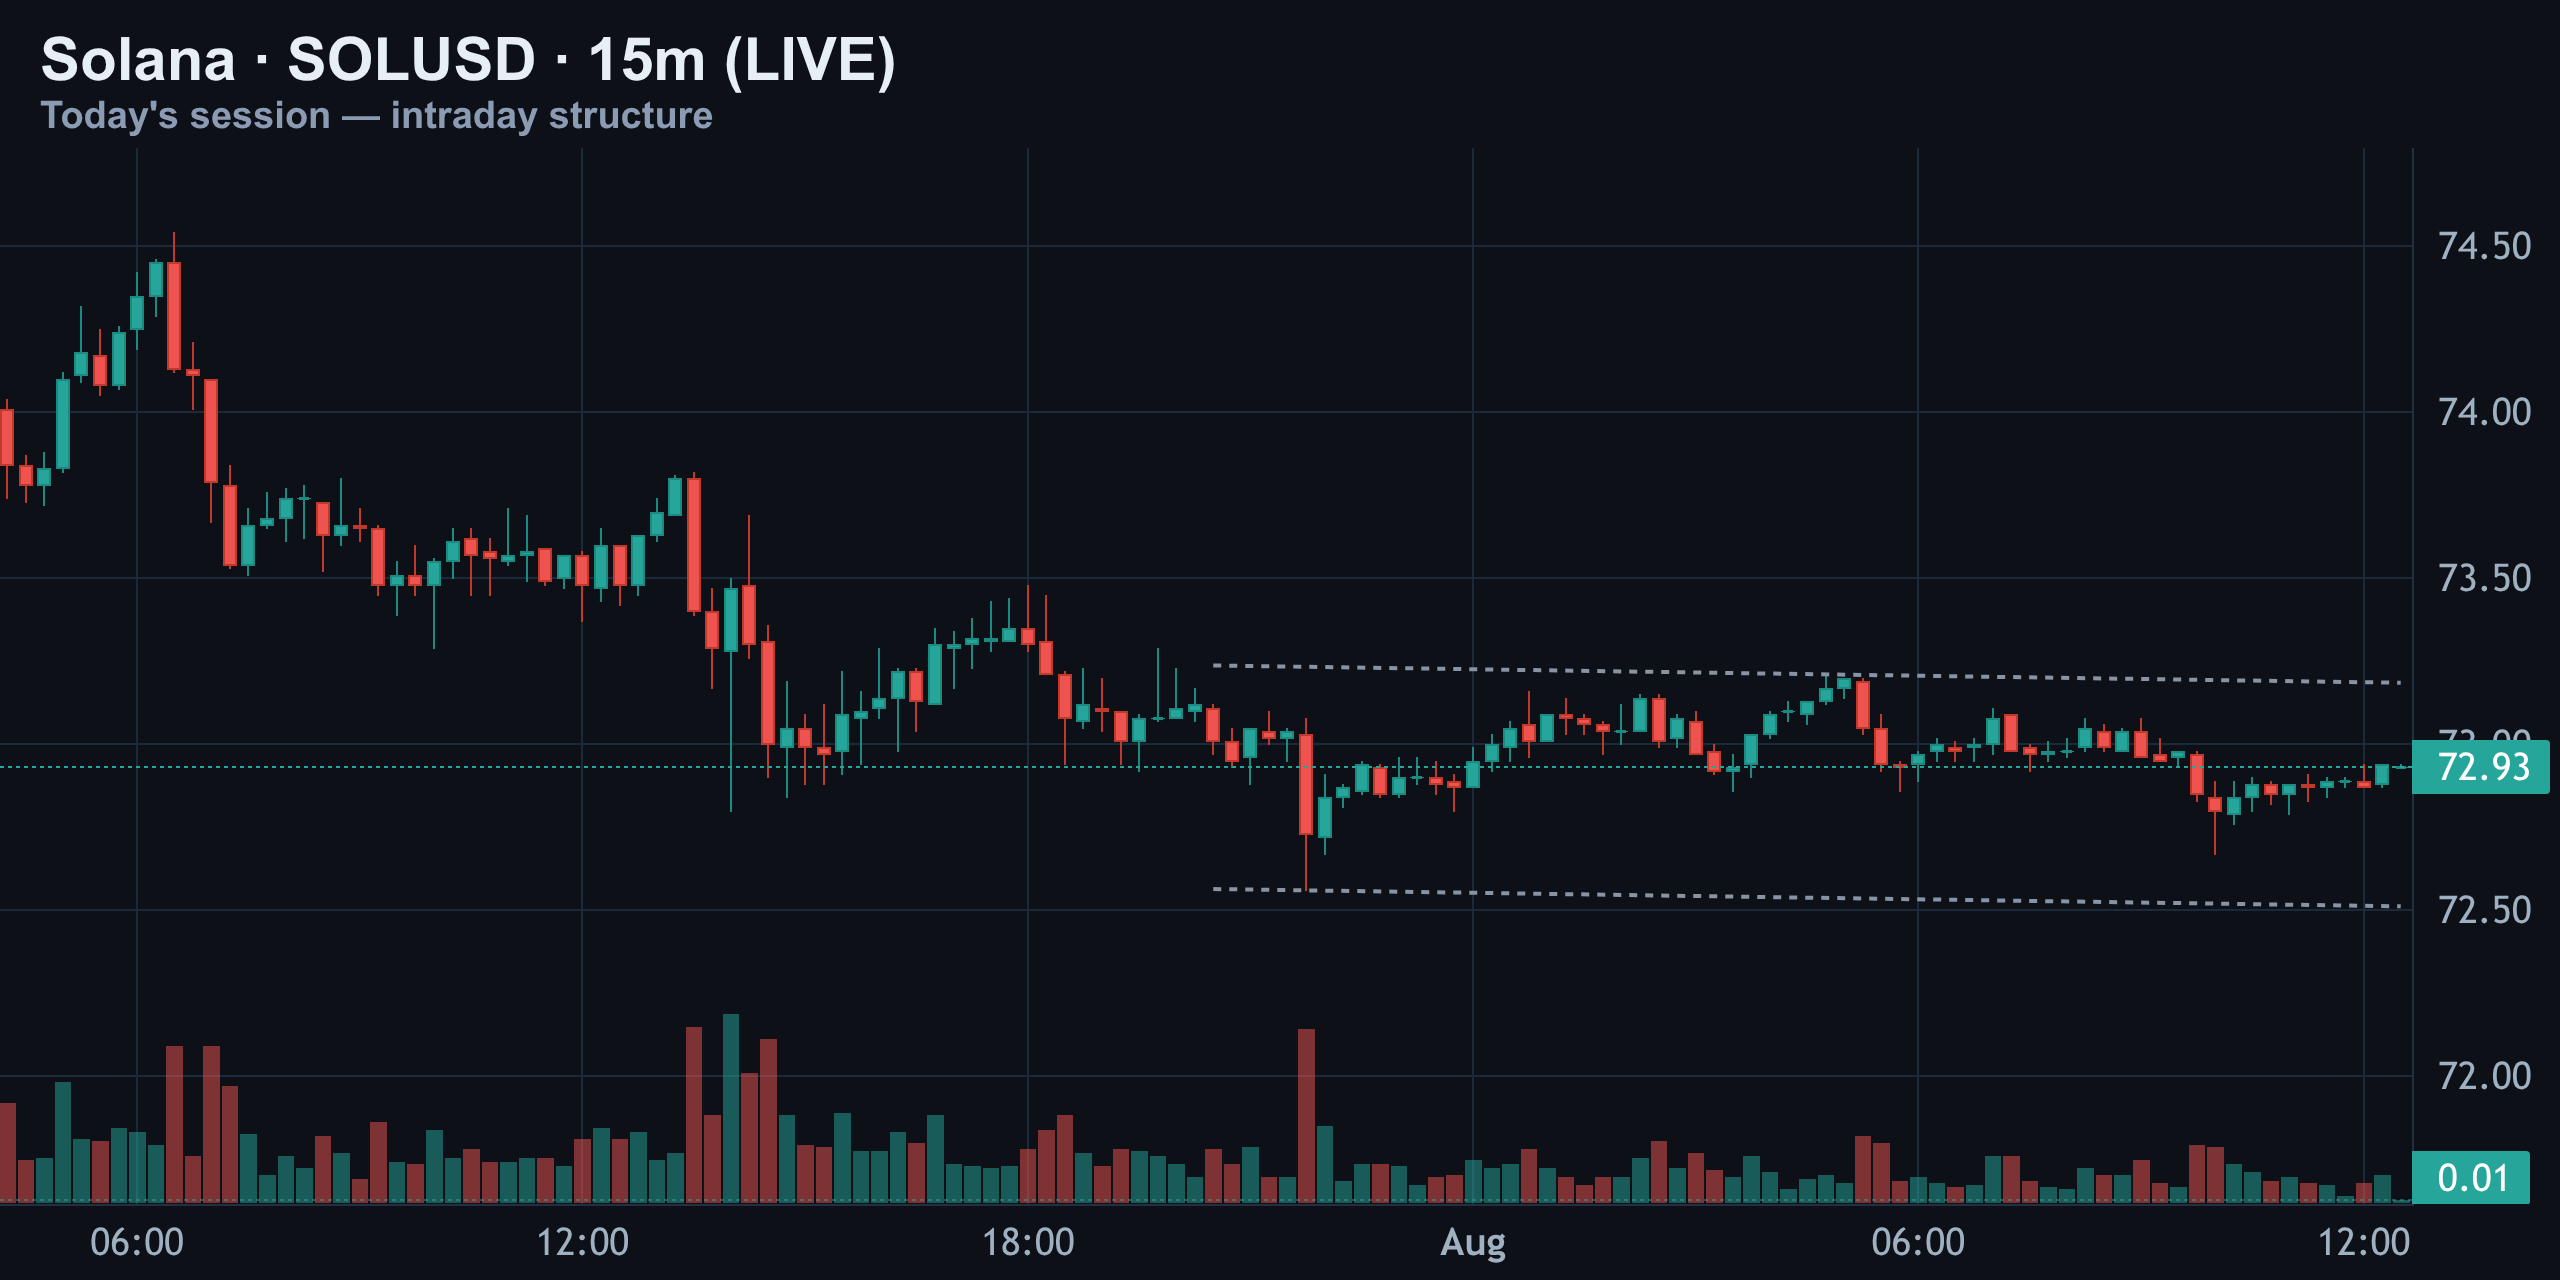
Today's session opened with a spike to a high near $74.60, which got sold hard down into the low-$72 zone. Since then it's been chopping sideways, boxed between roughly $72.50 on the low side and $73.15 on the high side. Price currently sits at $72.93, near the top of that intraday range, with no clean breakout either direction yet.
4-Hour — Lower High, Descending Channel
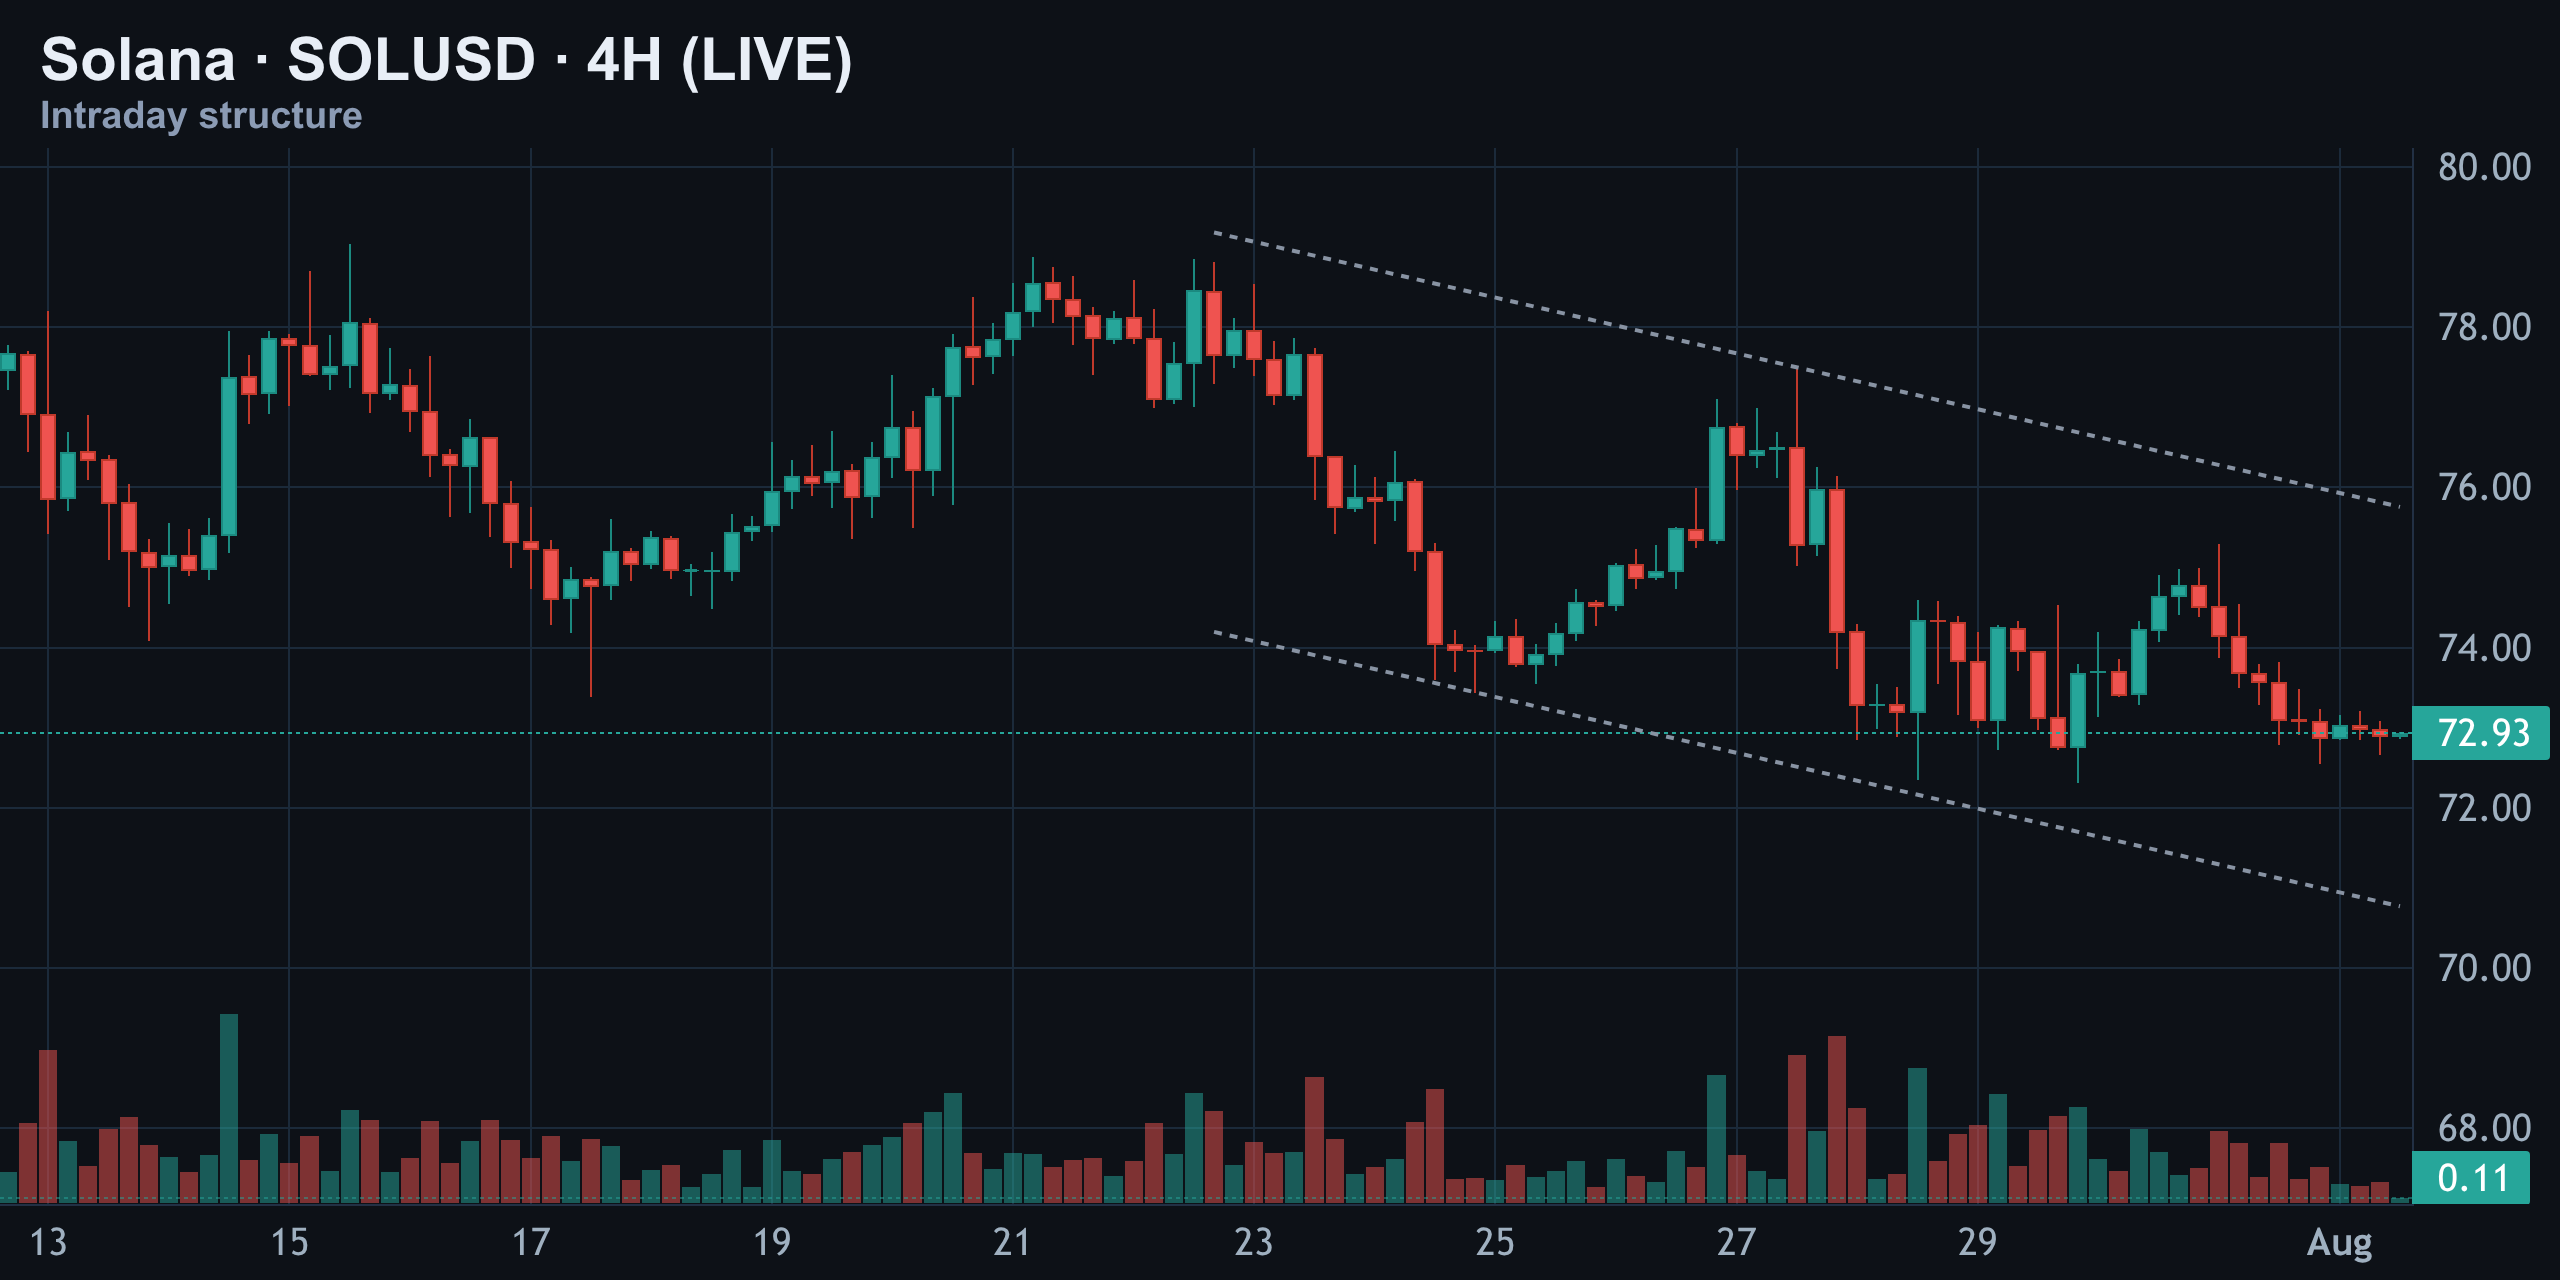
Solana rounded out a top near $79 back on July 21–23, then rolled into a descending channel that's been intact for over a week. Every bounce since has made a lower high. Price is currently sitting right on the lower rail of that channel. Until this channel breaks to the upside, the 4-hour trend stays firmly bearish.
Daily — Rising Channel, Losing Steam
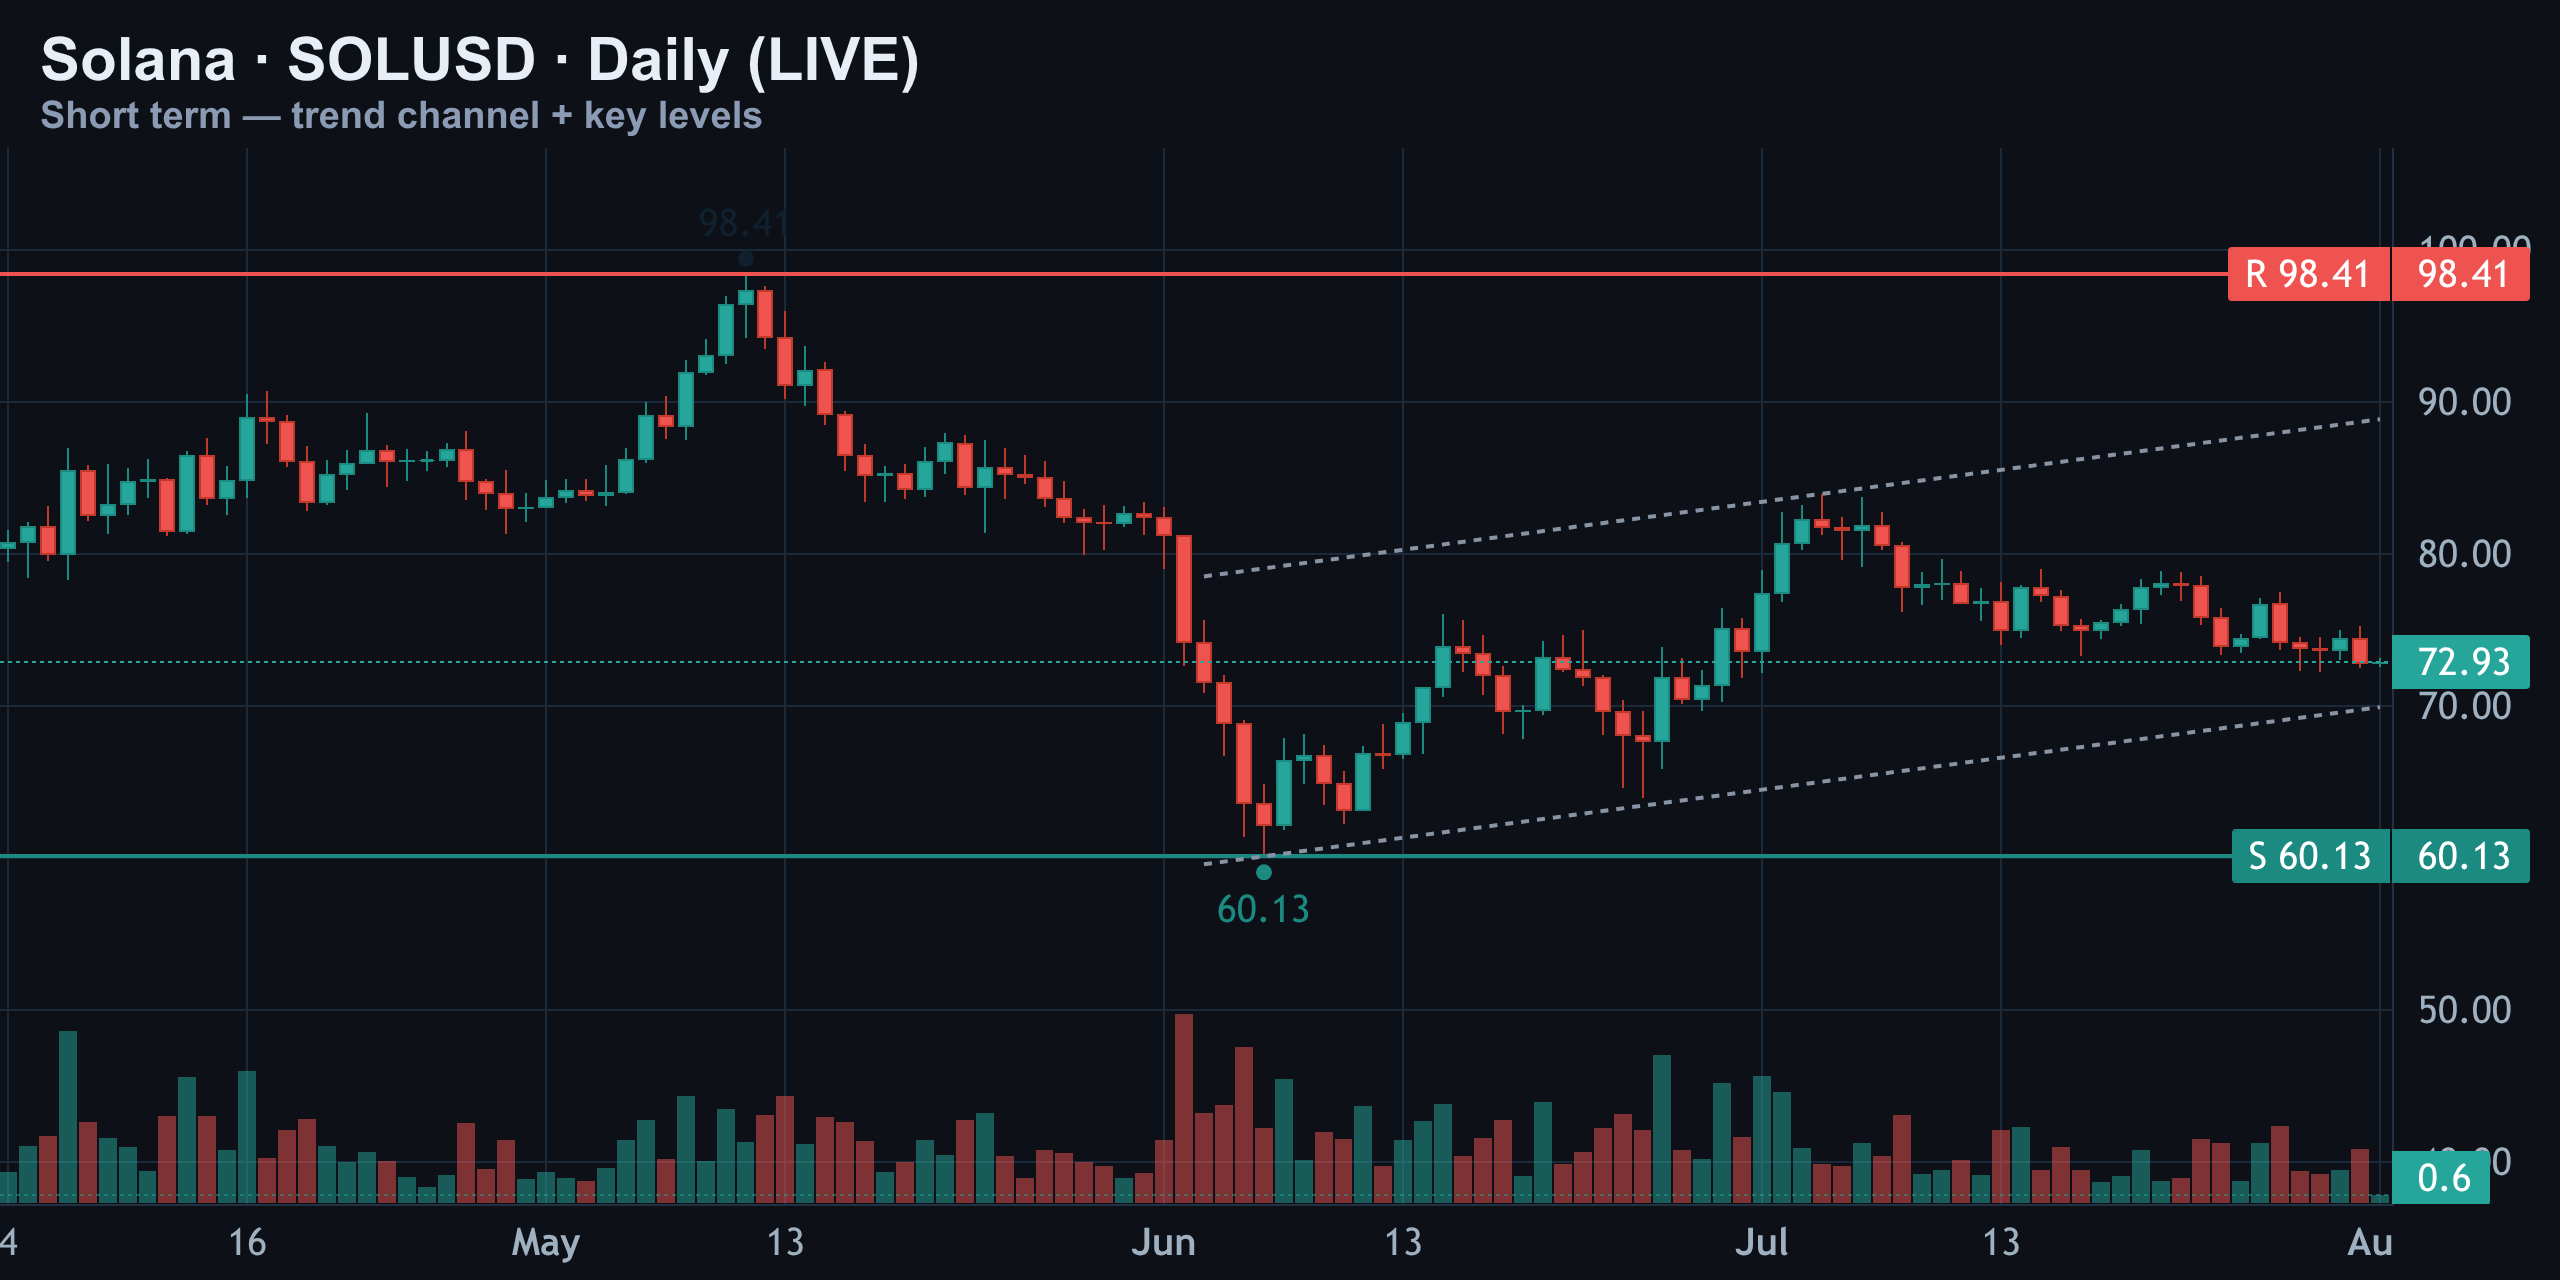
Solana bottomed at $60.13 back in June and has been climbing inside a rising channel since. The old resistance high sits way up at $98.41, and that June low is still the key support underneath everything. But momentum is fading — price is drifting toward the lower band of that rising channel at $72.93, and if that band breaks, the uptrend structure is in real trouble.
Momentum Check: RSI And MACD
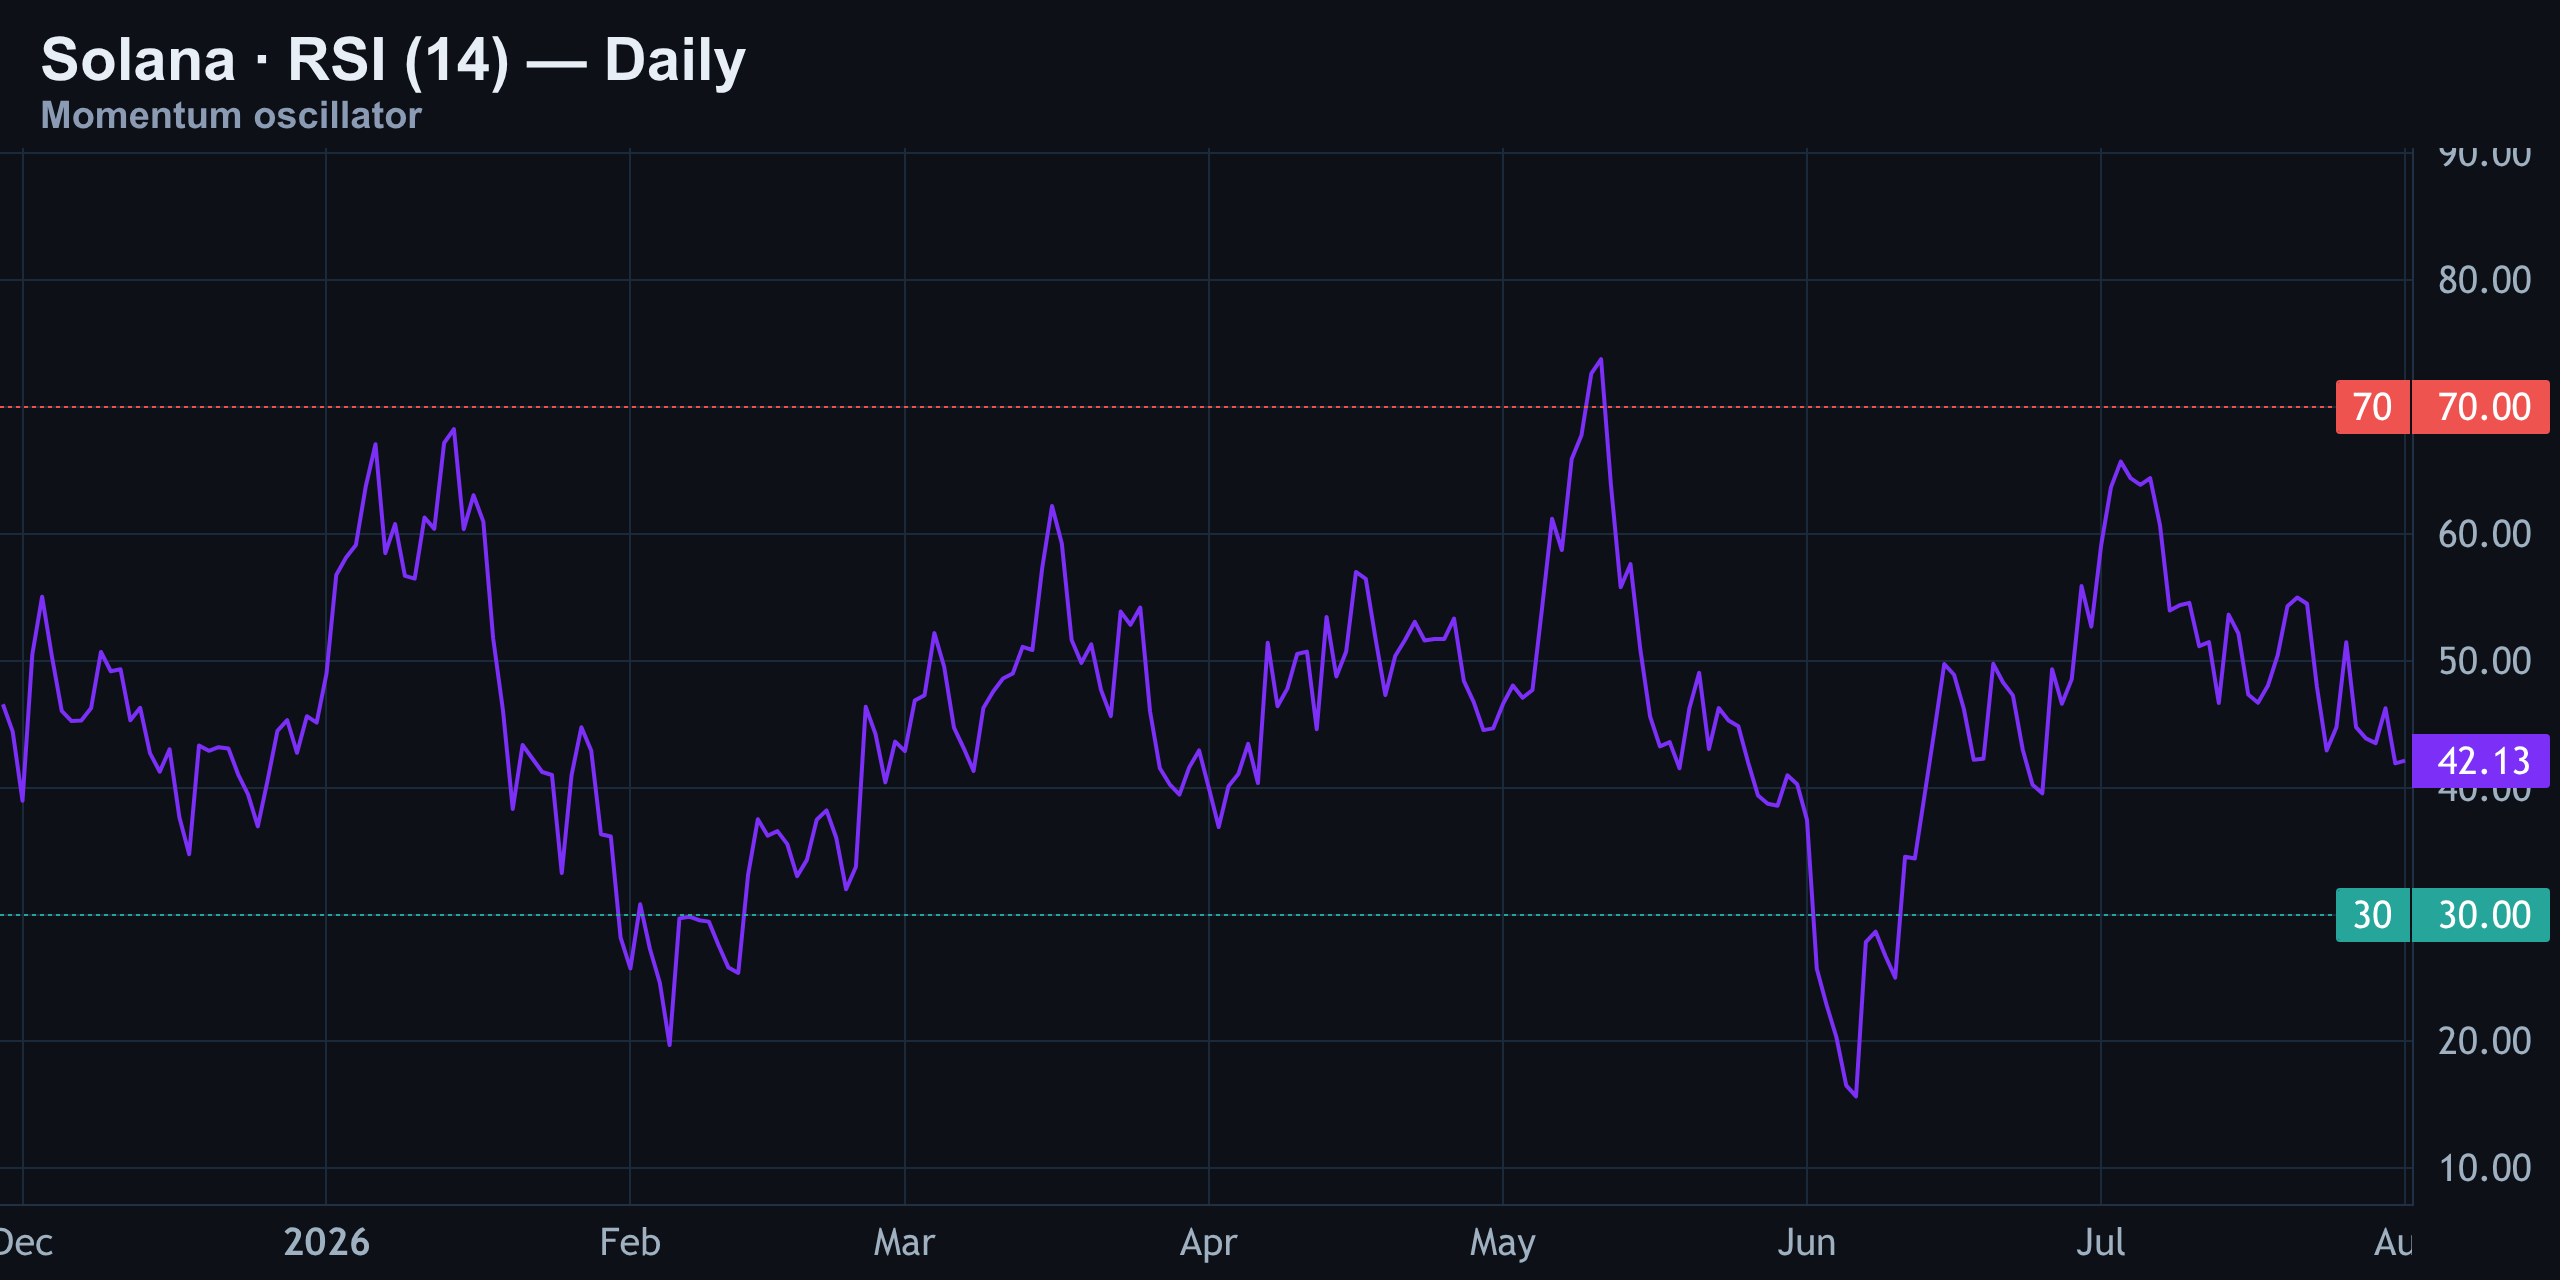
The daily RSI is reading 42 — neutral territory, not oversold. That matters: there's still room for this to fall further before momentum indicators start flashing a bounce signal. The RSI itself is rolling over, not turning up.
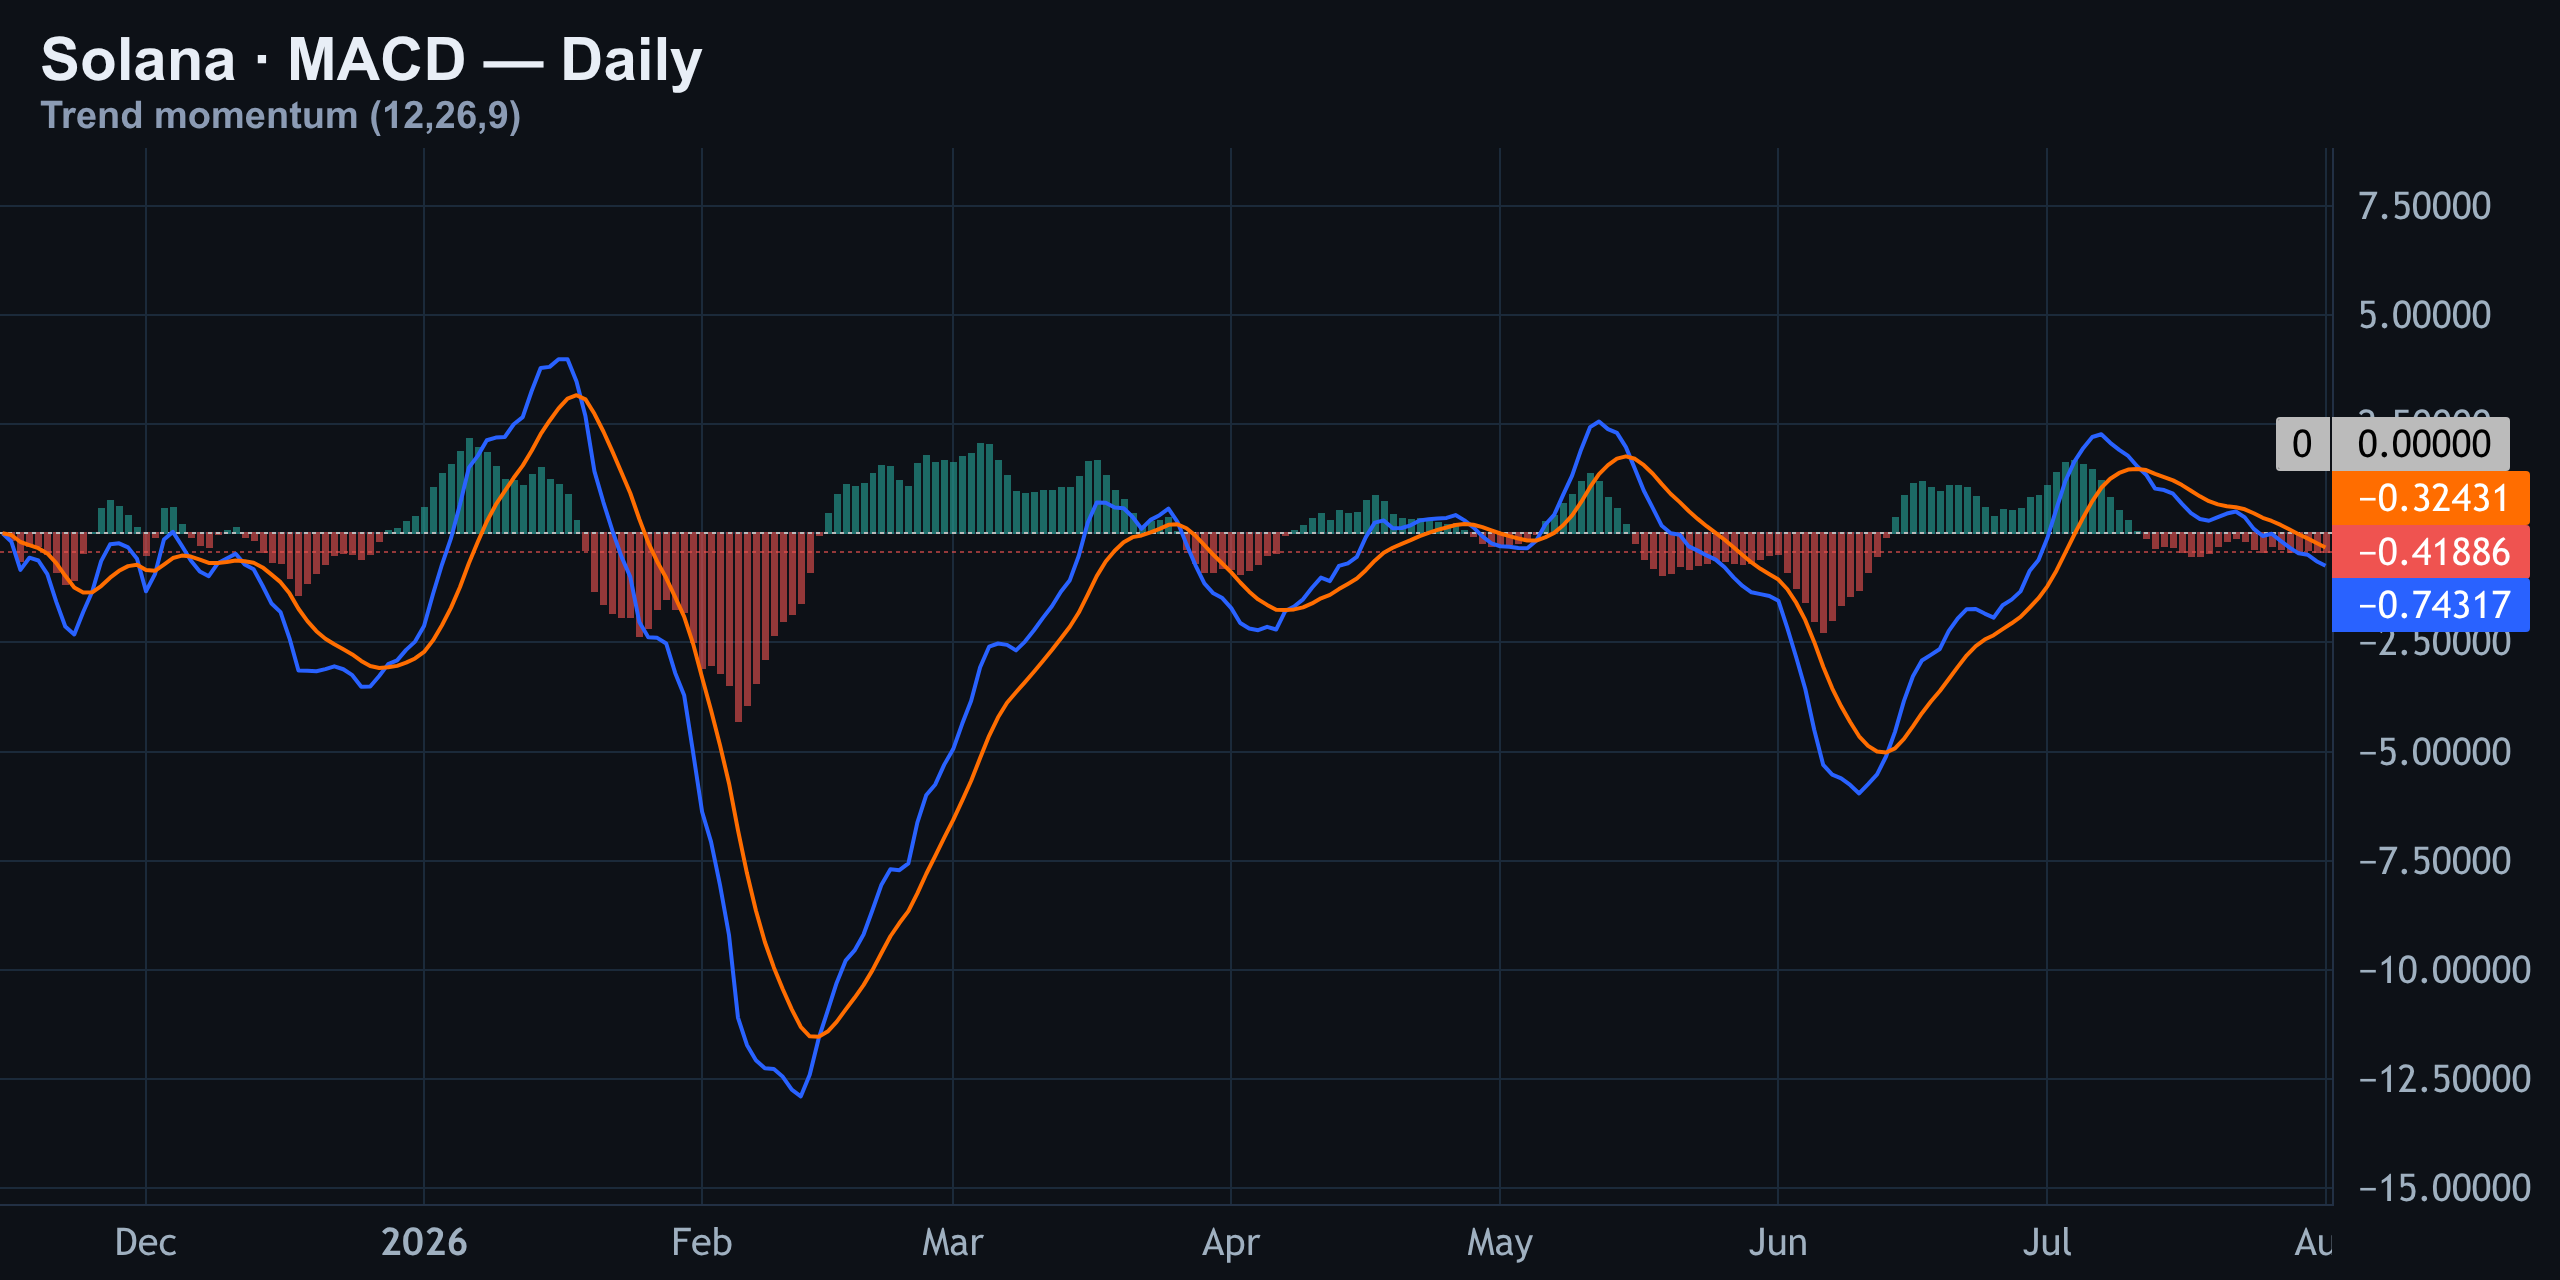
MACD confirms the same story from a different angle: it's trading below its signal line, and the histogram is red and expanding. That's classic momentum-fading-into-a-downtrend behavior, not a market building a base.
Positioning, Liquidations, And Gamma
This is where the setup gets interesting. Retail traders and top traders are leaning in opposite directions right now, and open interest is quietly draining rather than building — a sign that conviction on both sides is thinning out even as price stays pinned.
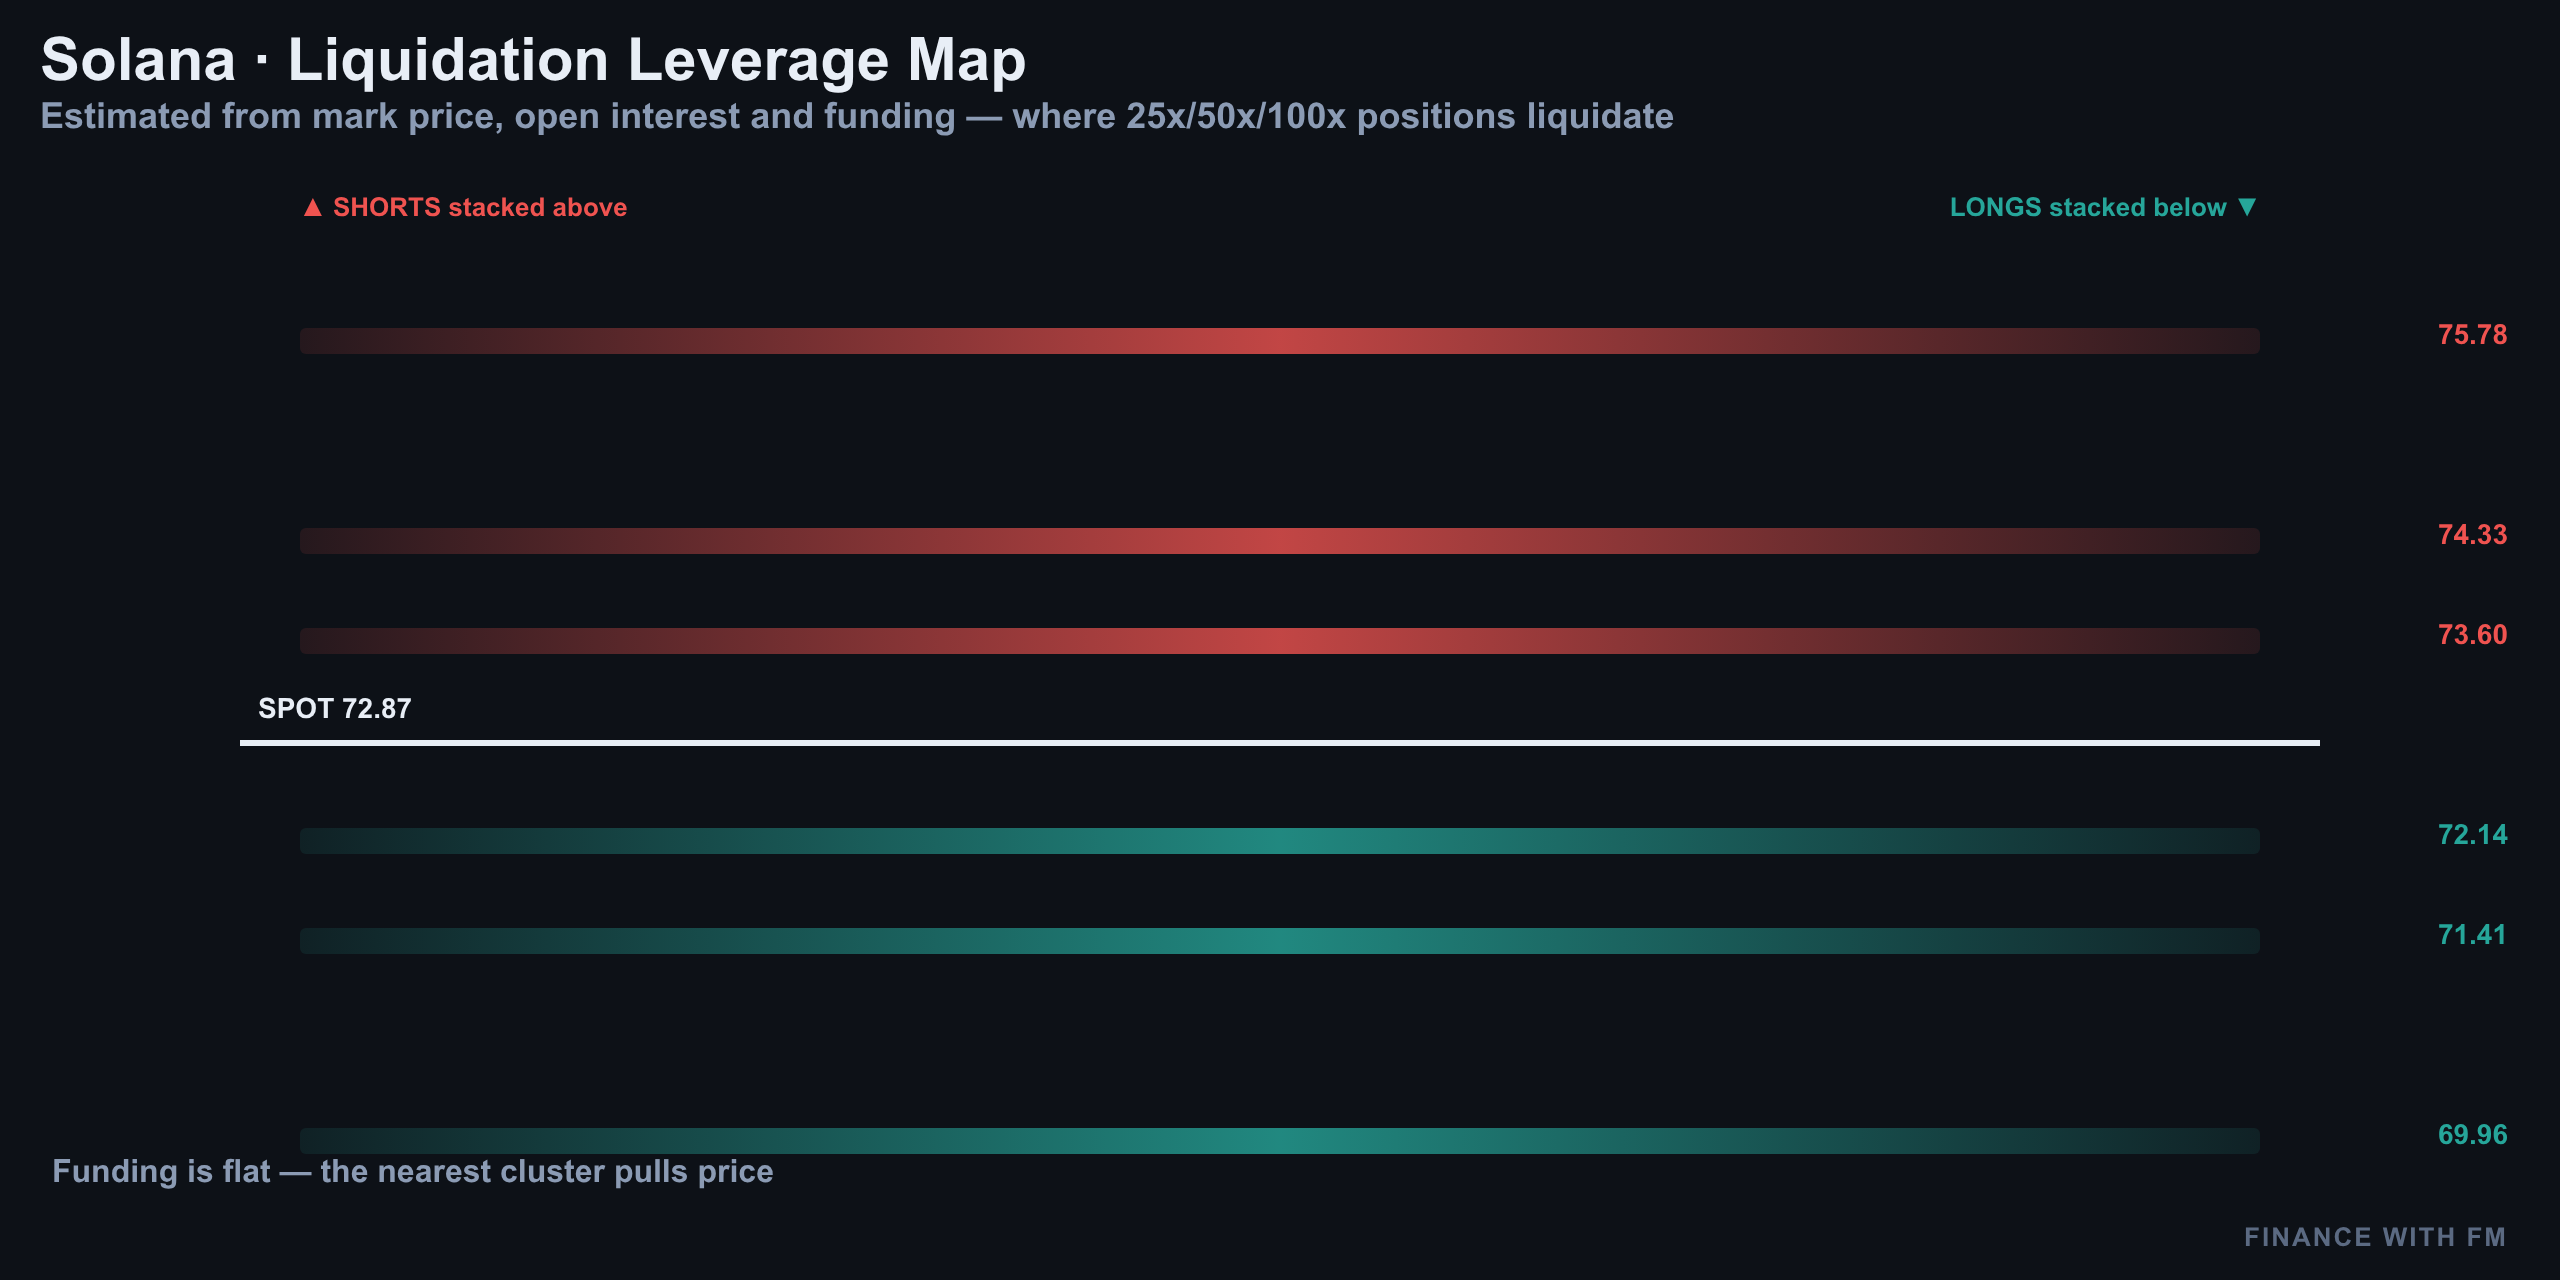
The liquidation heatmap shows meaningful leveraged-long exposure stacked just under the current 15-minute box low. If $72.50 gives way, that cluster becomes fuel — forced liquidations tend to accelerate a move rather than absorb it, which is exactly the kind of trap sitting just under spot right now.
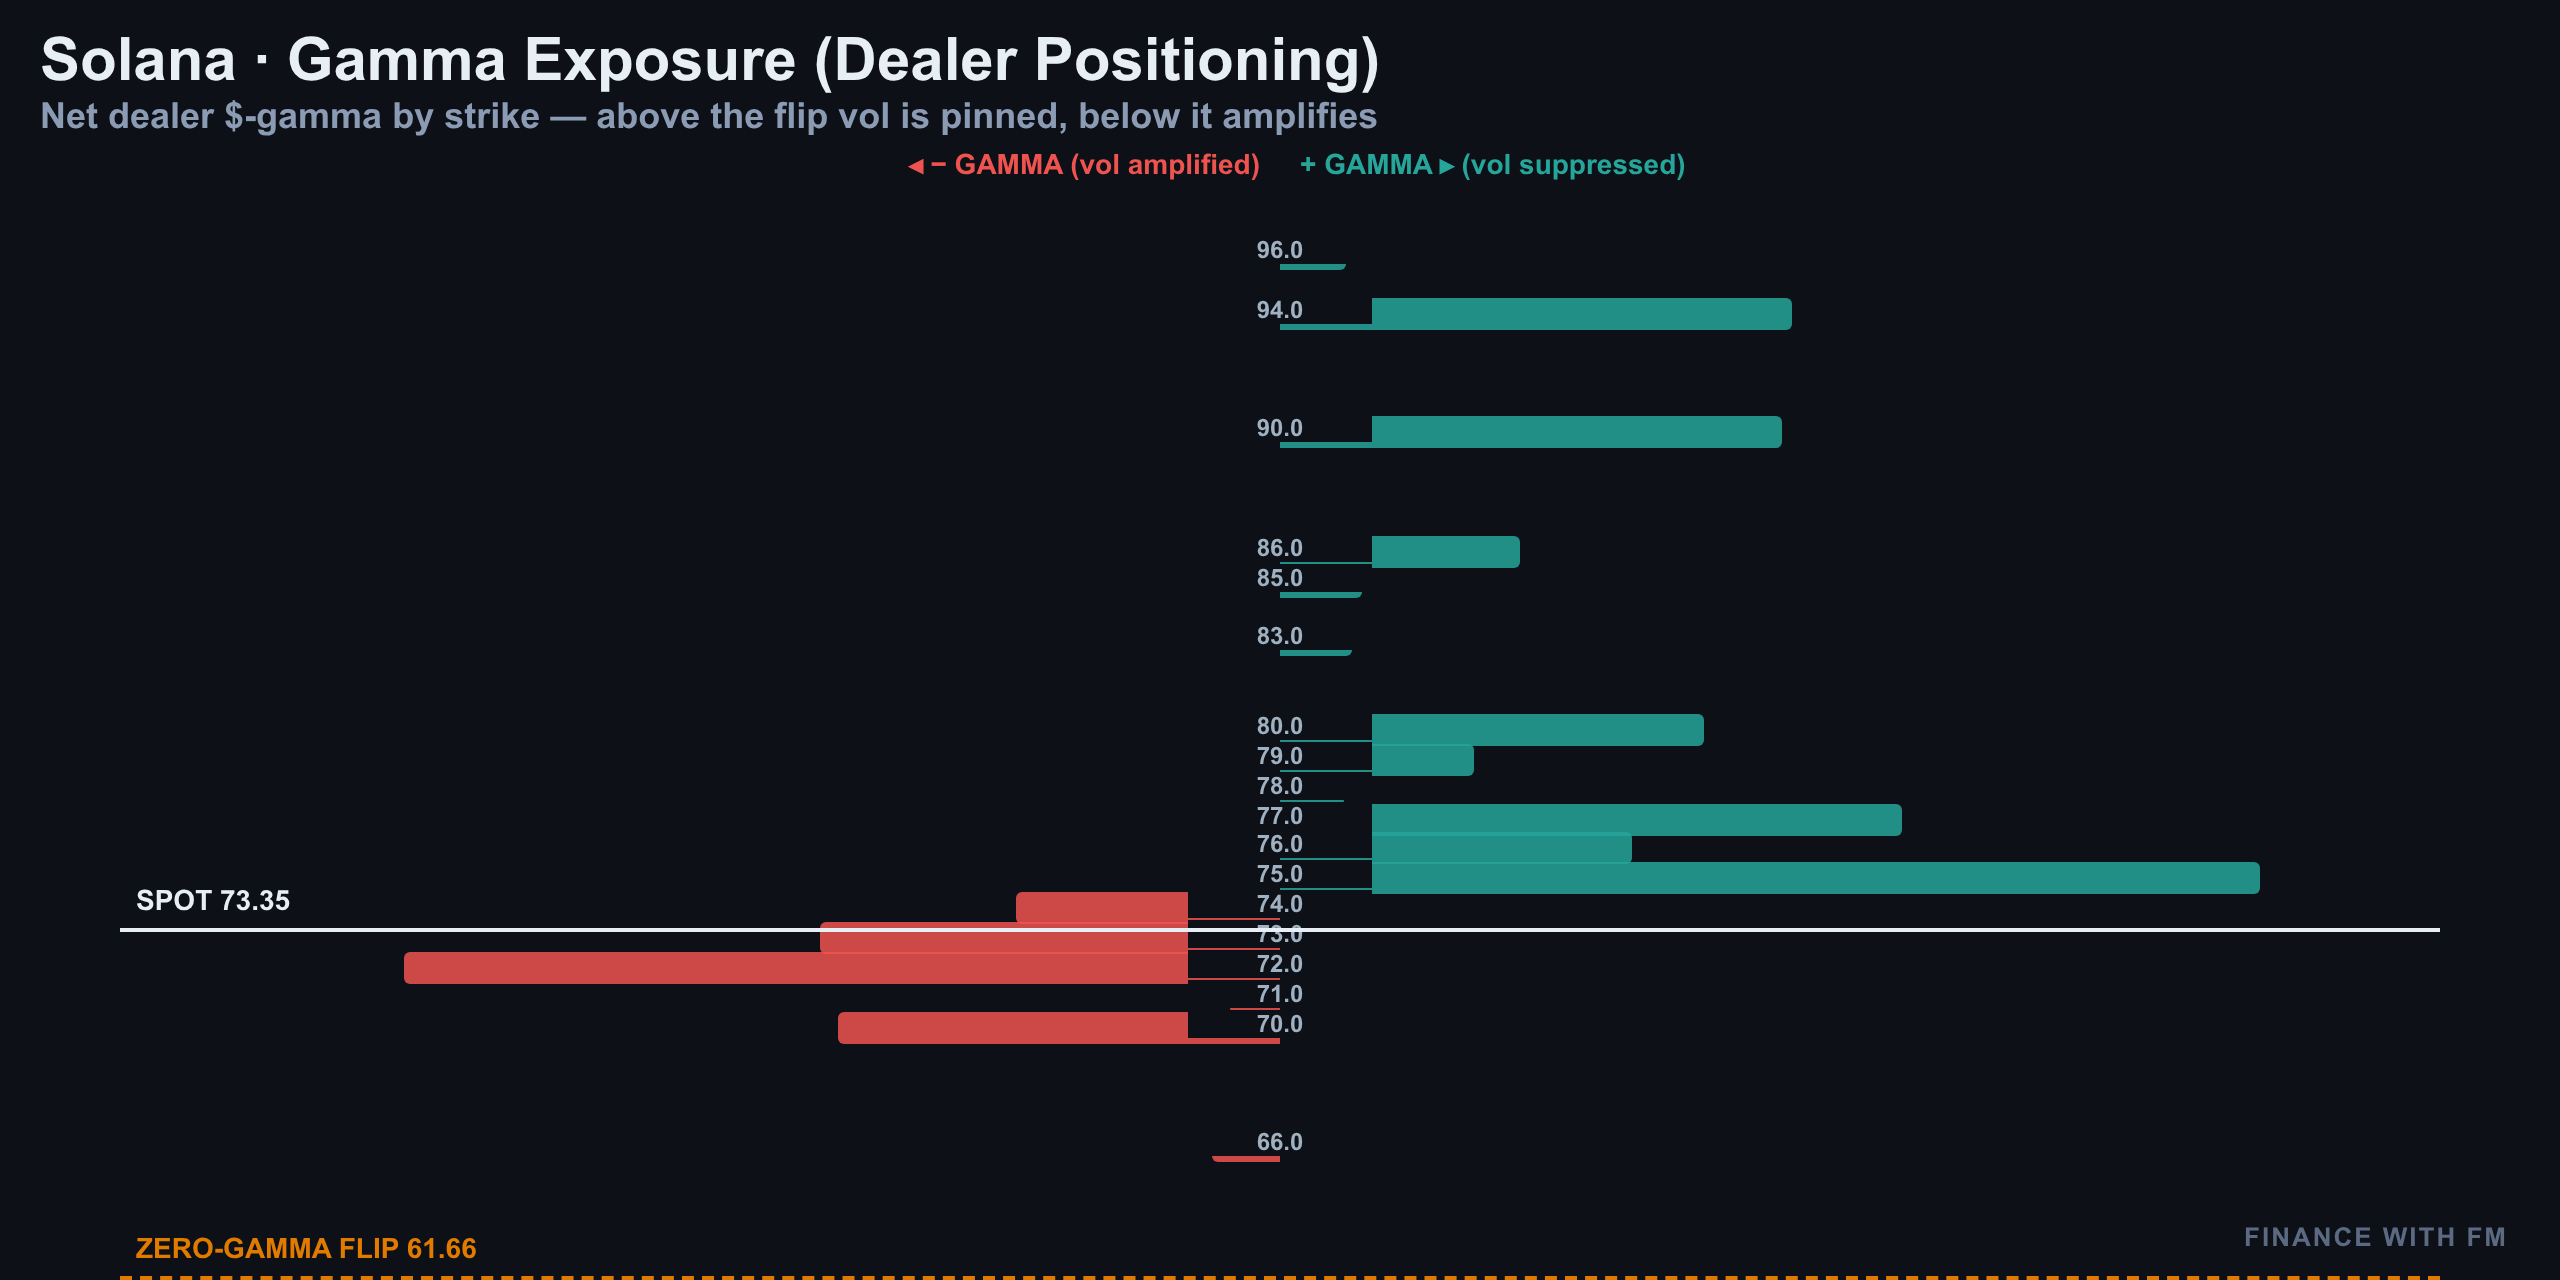
Gamma exposure explains why price has been so glued to $73 all session. Dealers are positioned in a way that actively dampens volatility near this strike — buying dips and selling rips to stay hedged. That's the mechanical reason behind the pin. But pins built on gamma don't last forever; once price moves far enough from the wall, that same dealer hedging can flip from a dampening force into an accelerant.
Levels To Watch
| Level | Price | Why It Matters |
|---|---|---|
| Old Resistance High | $98.41 | Prior swing high, far upside ceiling |
| Call Wall | $94.00 | Dealer resistance, unlikely near-term target |
| Prob. Above $81 (Aug 14) | ~10% odds | Market isn't pricing a breakout |
| 4H Spike High (invalidation) | $74.60 | Breaks the intraday bearish read |
| Max Pain / Put Wall / Pin | $73.00 | Where dealers are actively suppressing price |
| Current Spot | $72.93 | Sitting on the daily channel's lower rail |
| 15m Box Low / Trap Level | $72.50 | Break here triggers stacked liquidations |
| Key Structural Support | $60.13 | June low — the line that saves the uptrend |
The Setup — 1:4.3 (Not Advice)
Everything lines up on the same side today: a descending 4-hour channel, a daily rising channel now testing its own lower rail, RSI rolling over from neutral, a red MACD histogram, put-heavy skew, draining open interest, and aggressive taker selling into a dealer-suppressed pin. That's a lot of independent signals pointing the same direction.
| Trade Component | Level |
|---|---|
| Direction | Short / Bearish |
| Entry | $72.90 |
| Stop Loss (invalidation) | $74.60 |
| Target | $65.60 |
| Risk | ≈ $1.70 |
| Reward | ≈ $7.30 |
| Risk : Reward | 1 : 4.3 |
The logic: entry near the current pin, stop placed above today's intraday spike high — the level that, if reclaimed, kills the bearish read entirely — and a target that sits just above the key structural support at $60.13, giving the trade room to work without demanding a full breakdown of the entire June uptrend on the first attempt.
Not Financial Advice / Summary
This is analysis, not a personalized recommendation. Position sizing, risk tolerance, and your own market view should always come before any single setup — including this one.
- Solana is pinned at $73 by dealer gamma, with max pain and the put wall lined up at the exact same level.
- Options volume is skewing toward puts today even though open interest still leans call-heavy.
- The 4-hour trend is a descending channel; the daily uptrend is now testing its own lower rail.
- RSI (42) and MACD (red, below signal) both confirm fading momentum, not oversold exhaustion.
- A break below $72.50 opens a liquidation cluster; a break above $74.60 invalidates the short.
Bottom line: the surface looks calm, but the structure underneath — flow, skew, and open interest — is leaning bearish. The $73 pin holds until it doesn't, and today's setup is built for exactly that break.
Analysis and education, not investment advice. See our editorial policy.