Daily market analysis
Bitcoin (BTC) elliott wave
Last updated
Bitcoin at $64,610: B-Wave Trap or Bears Proven Wrong?
Invalidation Held, C-Low Bounced Instead of Extending
Three days ago we drew one line in the sand for Bitcoin bears: $65,474. It's still standing. Nothing has closed above it, and until it does, the bearish structure on Bitcoin technically remains intact.
But the downside continuation the bears were hoping for didn't show up either. Instead of extending the C-wave lower, price bounced 2.4% off the $62,535 low, punched straight through the old $63,247 trigger, and is now grinding right back into that same $65,474 ceiling. That's the whole story in one sentence: the invalidation held clean, but so did the buyers.
So the count isn't flipped. It's refined. Same bearish lean, same invalidation level, but the current leg up now wears a new label: a B-wave rally, not a fresh C-leg lower. That distinction matters because it changes how this bounce should be traded — as a shorting opportunity into resistance rather than the start of a new downtrend.
4H — The Big Picture: Wave C Low Or Just Another Leg?
Zoom out to the four-hour chart and the higher-degree structure becomes the anchor for everything downstream. From the mid-August high, the auto-pivots carve a textbook-looking five waves — until you actually run the rule check.
| Wave | Price |
|---|---|
| Wave 1 | $65,600 |
| Wave 2 | $62,538 |
| Wave 3 | $66,956 |
| Wave 4 | $62,742 |
| Wave 5 | $65,410 |
| A-wave | $62,275 |
| B-wave (invalidation) | $65,474 |
| C-wave low | $62,535 |
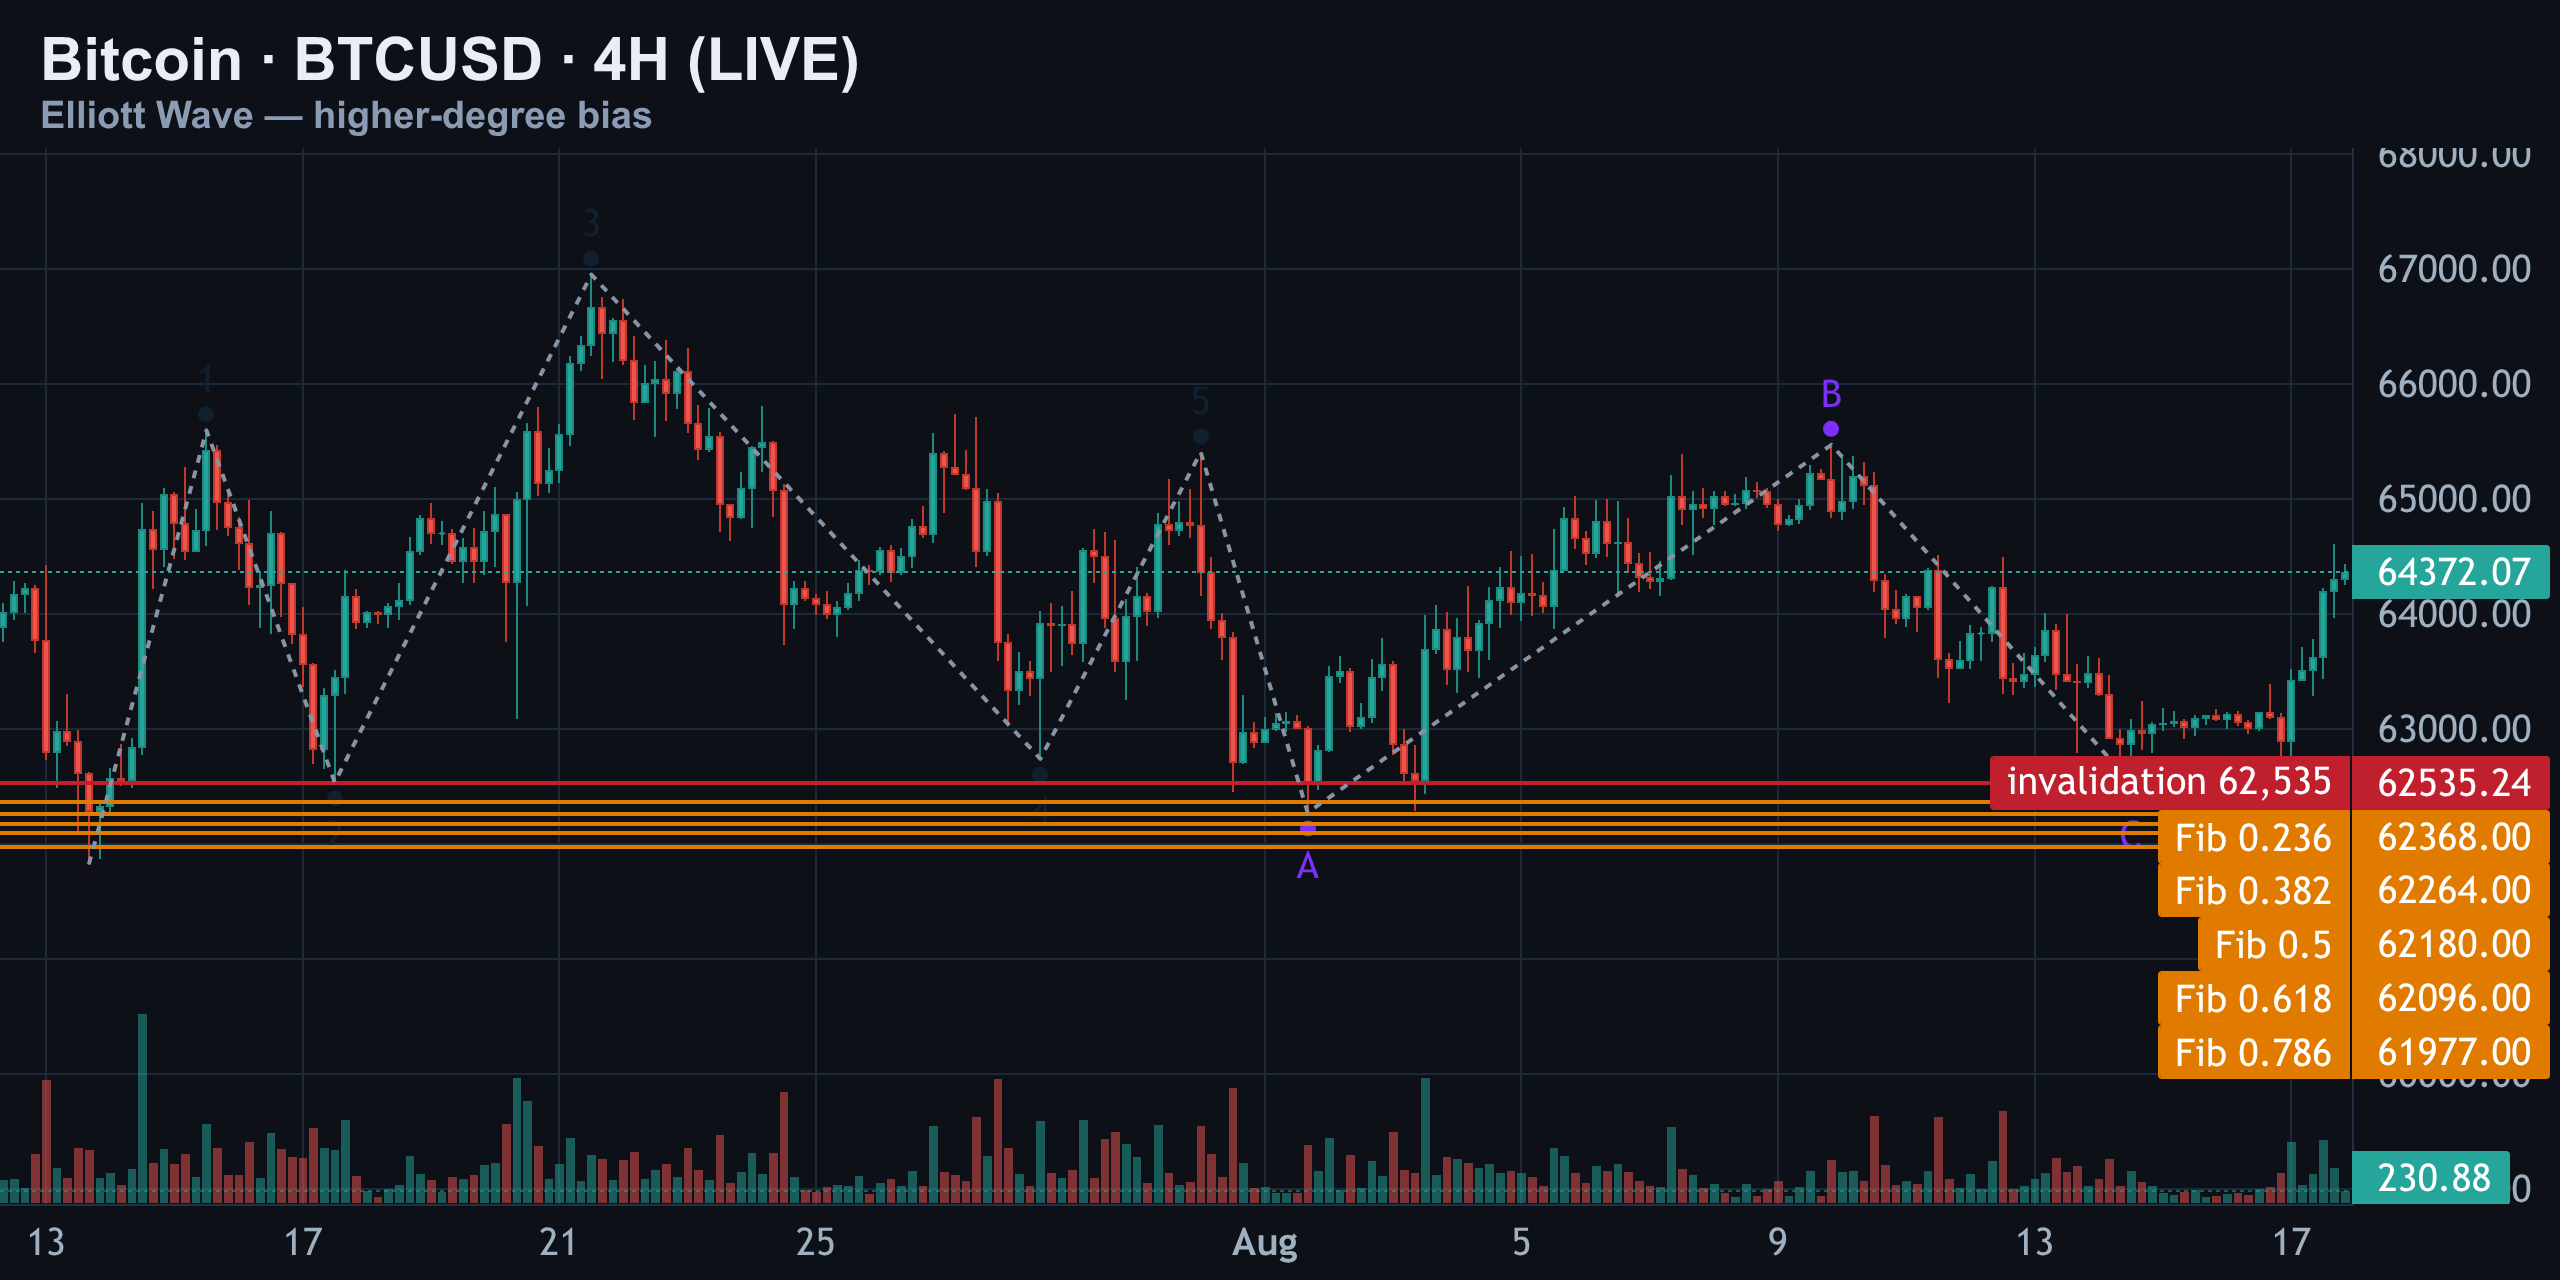
Two hard violations kill the impulsive read here. First, wave 4 dips back into wave 1's territory — an overlap that a true five-wave impulse simply doesn't allow. Second, wave 2 retraced over 80% of wave 1, which is deep enough to flag the whole structure as weak.
Put those together and the entire move from $62,538 through $66,956 reads far more like a corrective zigzag — or an ending diagonal — than a clean bullish markup. That means the rally into $66,956 was likely wave 3 or wave C of a larger correction, not the first leg of a new bull impulse. The macro backdrop cooperates with this read too: rate-cut odds and ETF flow chatter have kept Bitcoin range-bound rather than trending, which fits a corrective structure better than an impulsive one.
1H — Primary Count vs Alternates: Walking Every Path
Drop to the one-hour chart and the auto-pivots try again to force a five-wave sequence off the recent lows. It doesn't survive contact with the rules.
| Wave | Price |
|---|---|
| Wave 1 | $63,796 |
| Wave 2 | $62,300 |
| Wave 3 | $65,474 |
| Wave 4 | $63,238 |
| Wave 5 | $64,500 |
| A-wave | $62,535 |
| B-wave (current) | $64,610 |
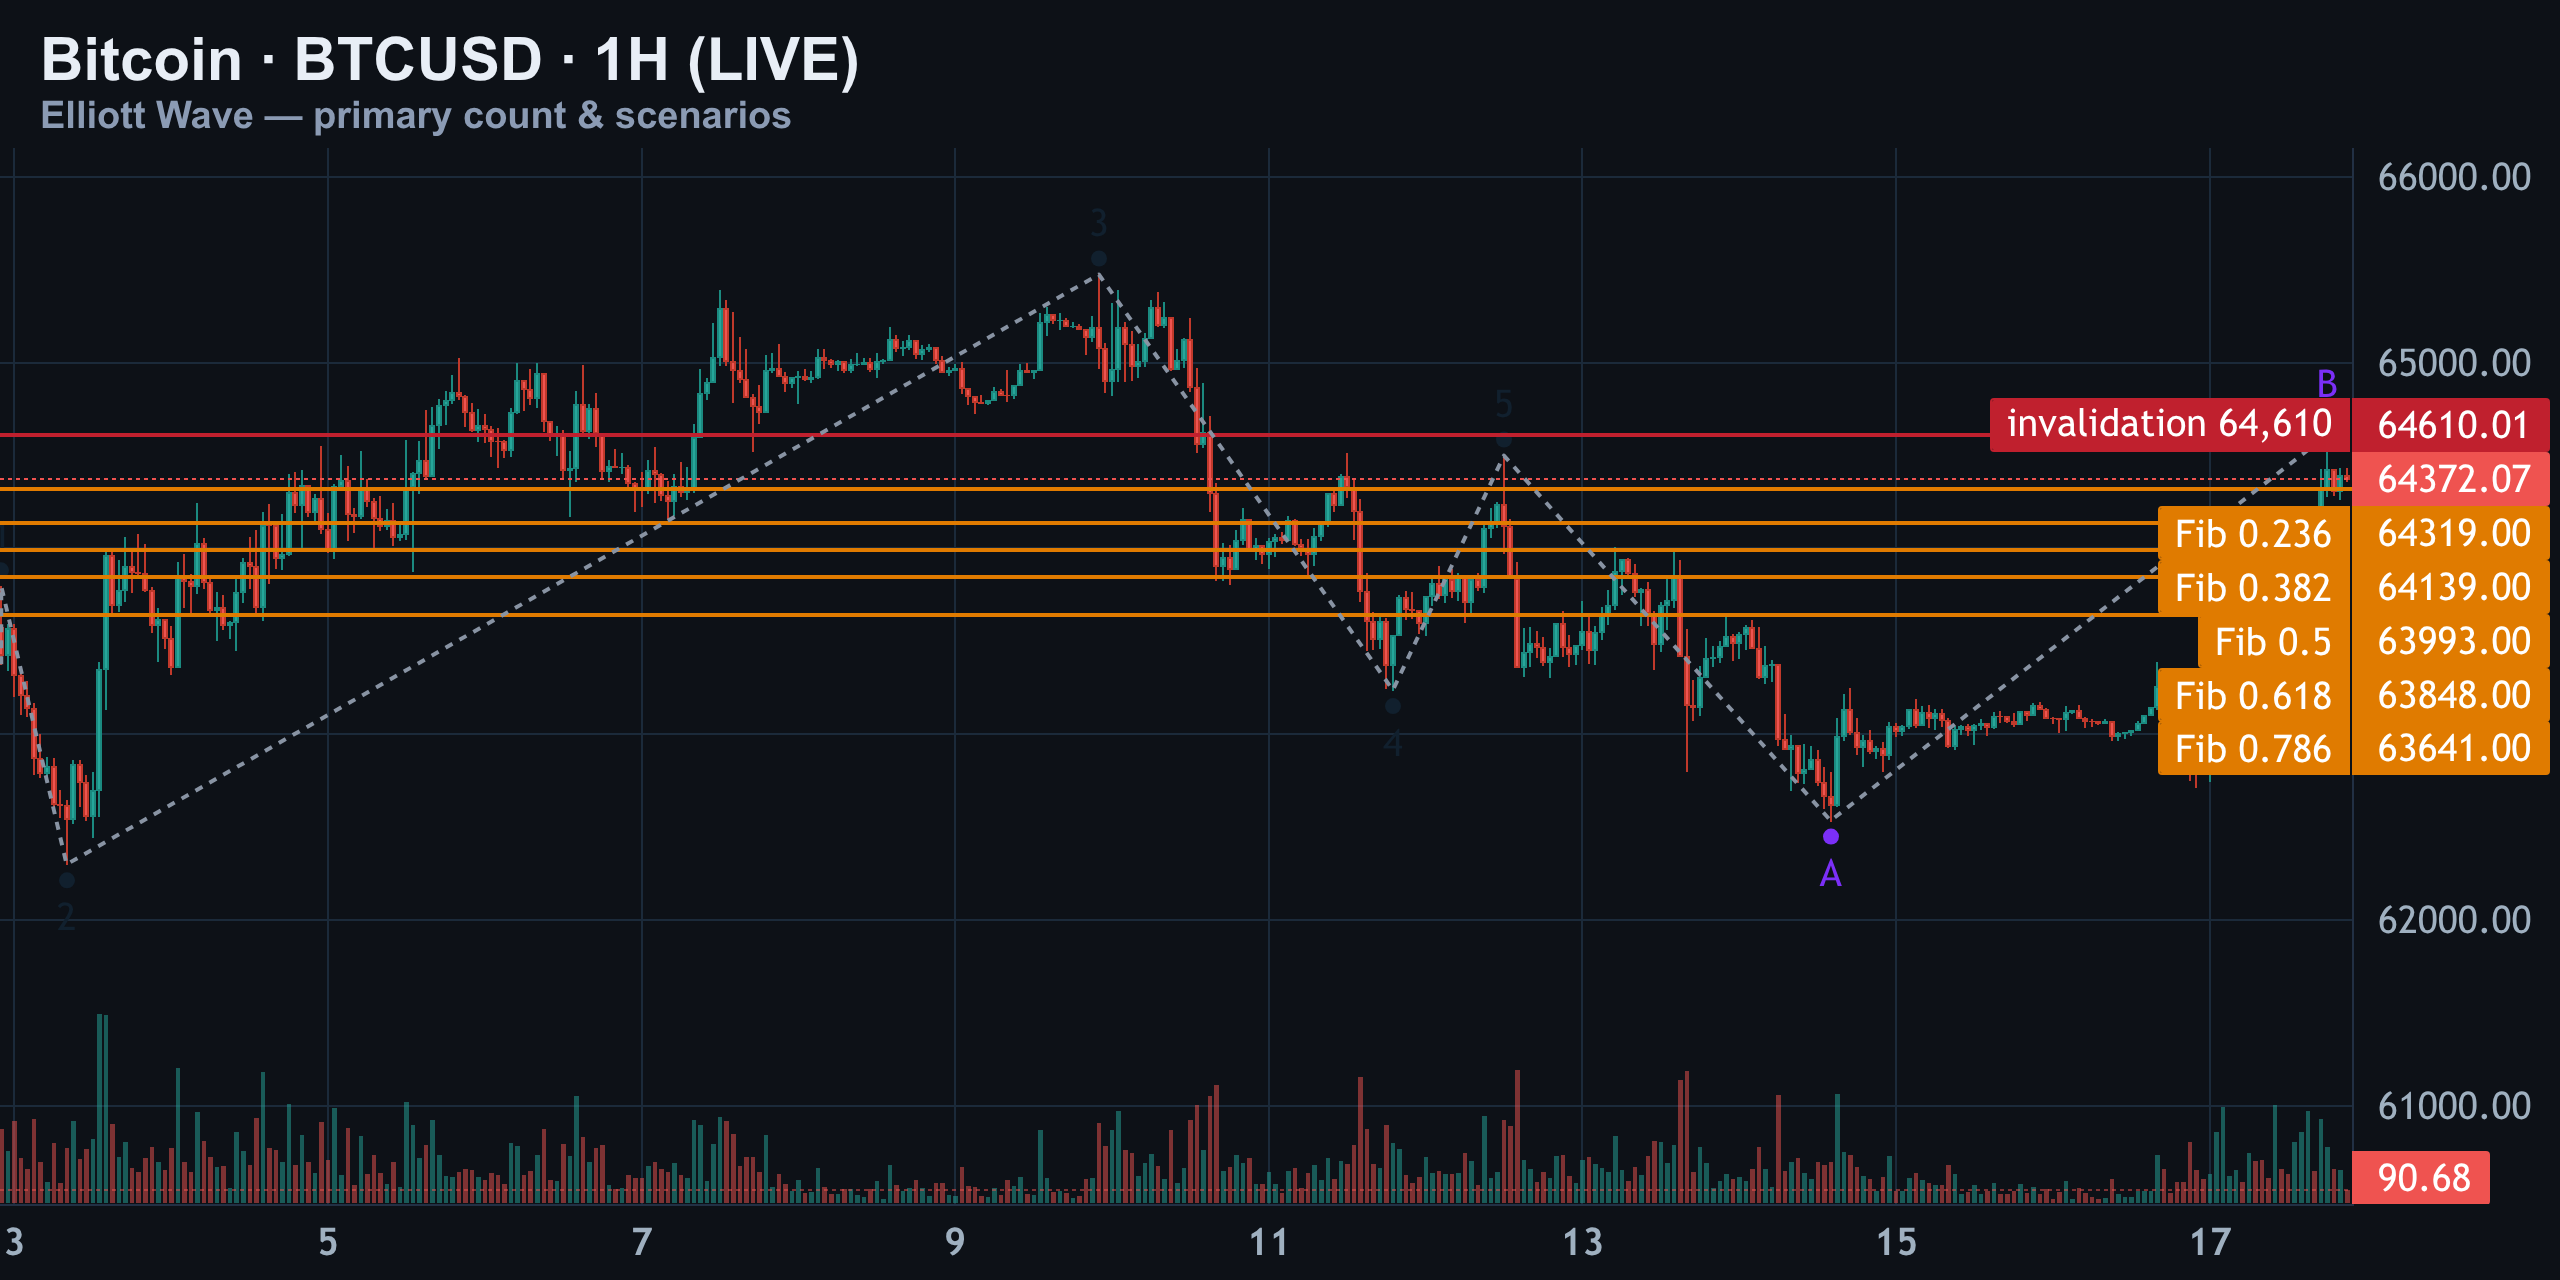
Wave 2 retraced more than 100% of wave 1, and wave 4 overlaps wave 1's territory. Two hard violations, no exceptions — this is not an impulse.
Primary Count
The whole move off the $62,535 low is a corrective B-wave inside a larger flat — built like an A-B-C, not a one-through-five. Confirmation is a clean rejection at or just above $64,610, backed by the 0.5 fib near $63,993. Roll over from here, and wave C down resumes toward $62,000 and below.
Alternate #1
If buyers reclaim and hold above $64,610 with real volume, the corrective label breaks down. That would argue this is the front edge of a genuine reversal, targeting a retest of $65,474 and eventually $66,956. The 0.618 level at $63,848 is the last line of defense for bulls if this alternate fails.
Alternate #2 (lower odds)
An ending diagonal completing wave 5 right near current price, exhausting buyers and snapping back down hard through the 0.786 level at $63,641 toward the $62,535 zone.
Rules broken, bounce reading corrective — bearish bias stays intact until $64,610 actually breaks and holds.
15M — Timing The Entry Around 64,610
Drop to the fifteen-minute chart for the actual trigger mechanics. The local low sits at $62,535.
| Wave | Price |
|---|---|
| Wave 2 | $63,247 |
| Wave 3 | $62,800 |
| Wave 4 | $63,390 |
| Wave 5 | $62,716 |
| A-wave | $63,717 |
| B-wave | $63,295 |
| C-wave | $64,610 |
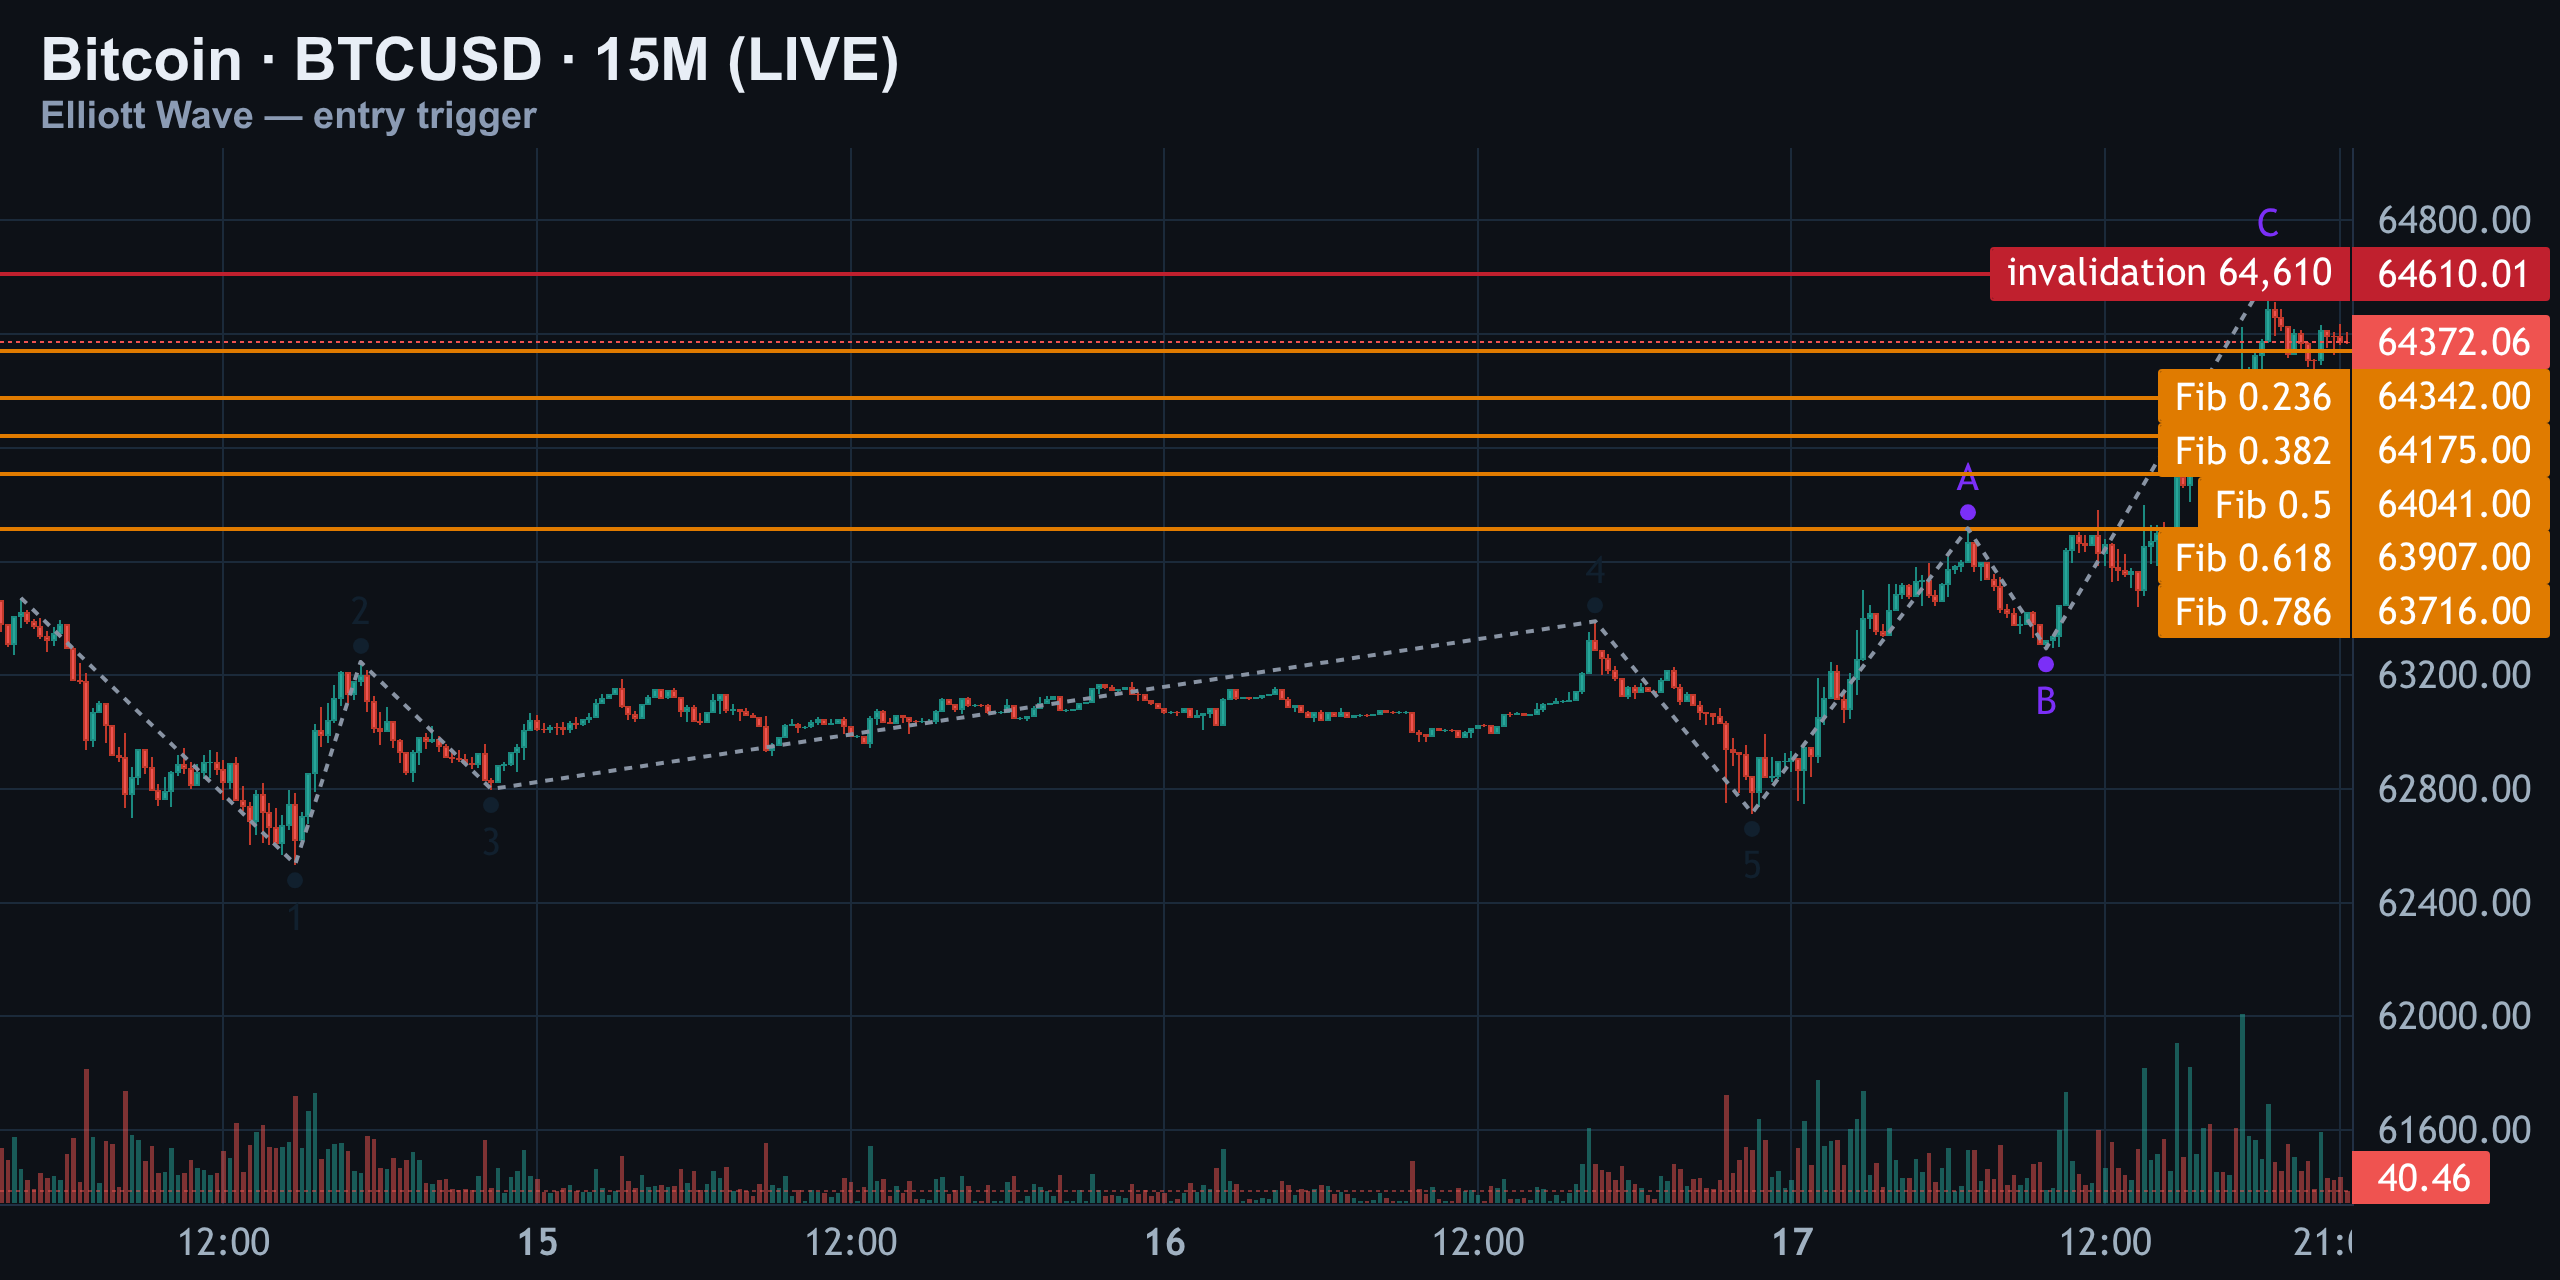
Wave 3 comes out as the shortest wave of the sequence — a hard rule violation, and no true impulse survives that. So the five-wave label here is really just a smaller corrective wiggle, not a real markup.
From that low, price built an A-wave up to $63,717, a B-wave pullback to $63,295, and a C-wave rally straight into $64,610 — exactly where the 1H invalidation sits and exactly where the order book's 4 BTC ask wall is stacked. That confluence is the whole trigger for this trade.
The Scenarios, Ranked
| Scenario | Trigger | Target | Confidence |
|---|---|---|---|
| B-wave rejection (primary) | Rejection at/above $64,610 | C-wave down to $62,264 / $62,096 / $61,977 | High |
| Reversal underway (alt 1) | Sustained close above $64,610 | Retest of $65,474, then $66,956 | Moderate |
| Ending diagonal blow-off (alt 2) | Brief spike then hard reversal | Snap back to $62,535 zone | Low |
Notice all three scenarios share one decision point: $64,610–$65,474. That's not a coincidence — it's the same resistance shelf viewed from three timeframes, and it's why this level matters more than the headline price.
Positioning & Order Flow: The Edge
Structure tells you what price *should* do. Positioning tells you what traders are actually *betting* on — and right now the two are lining up rather than fighting each other.
Liquidation Clusters
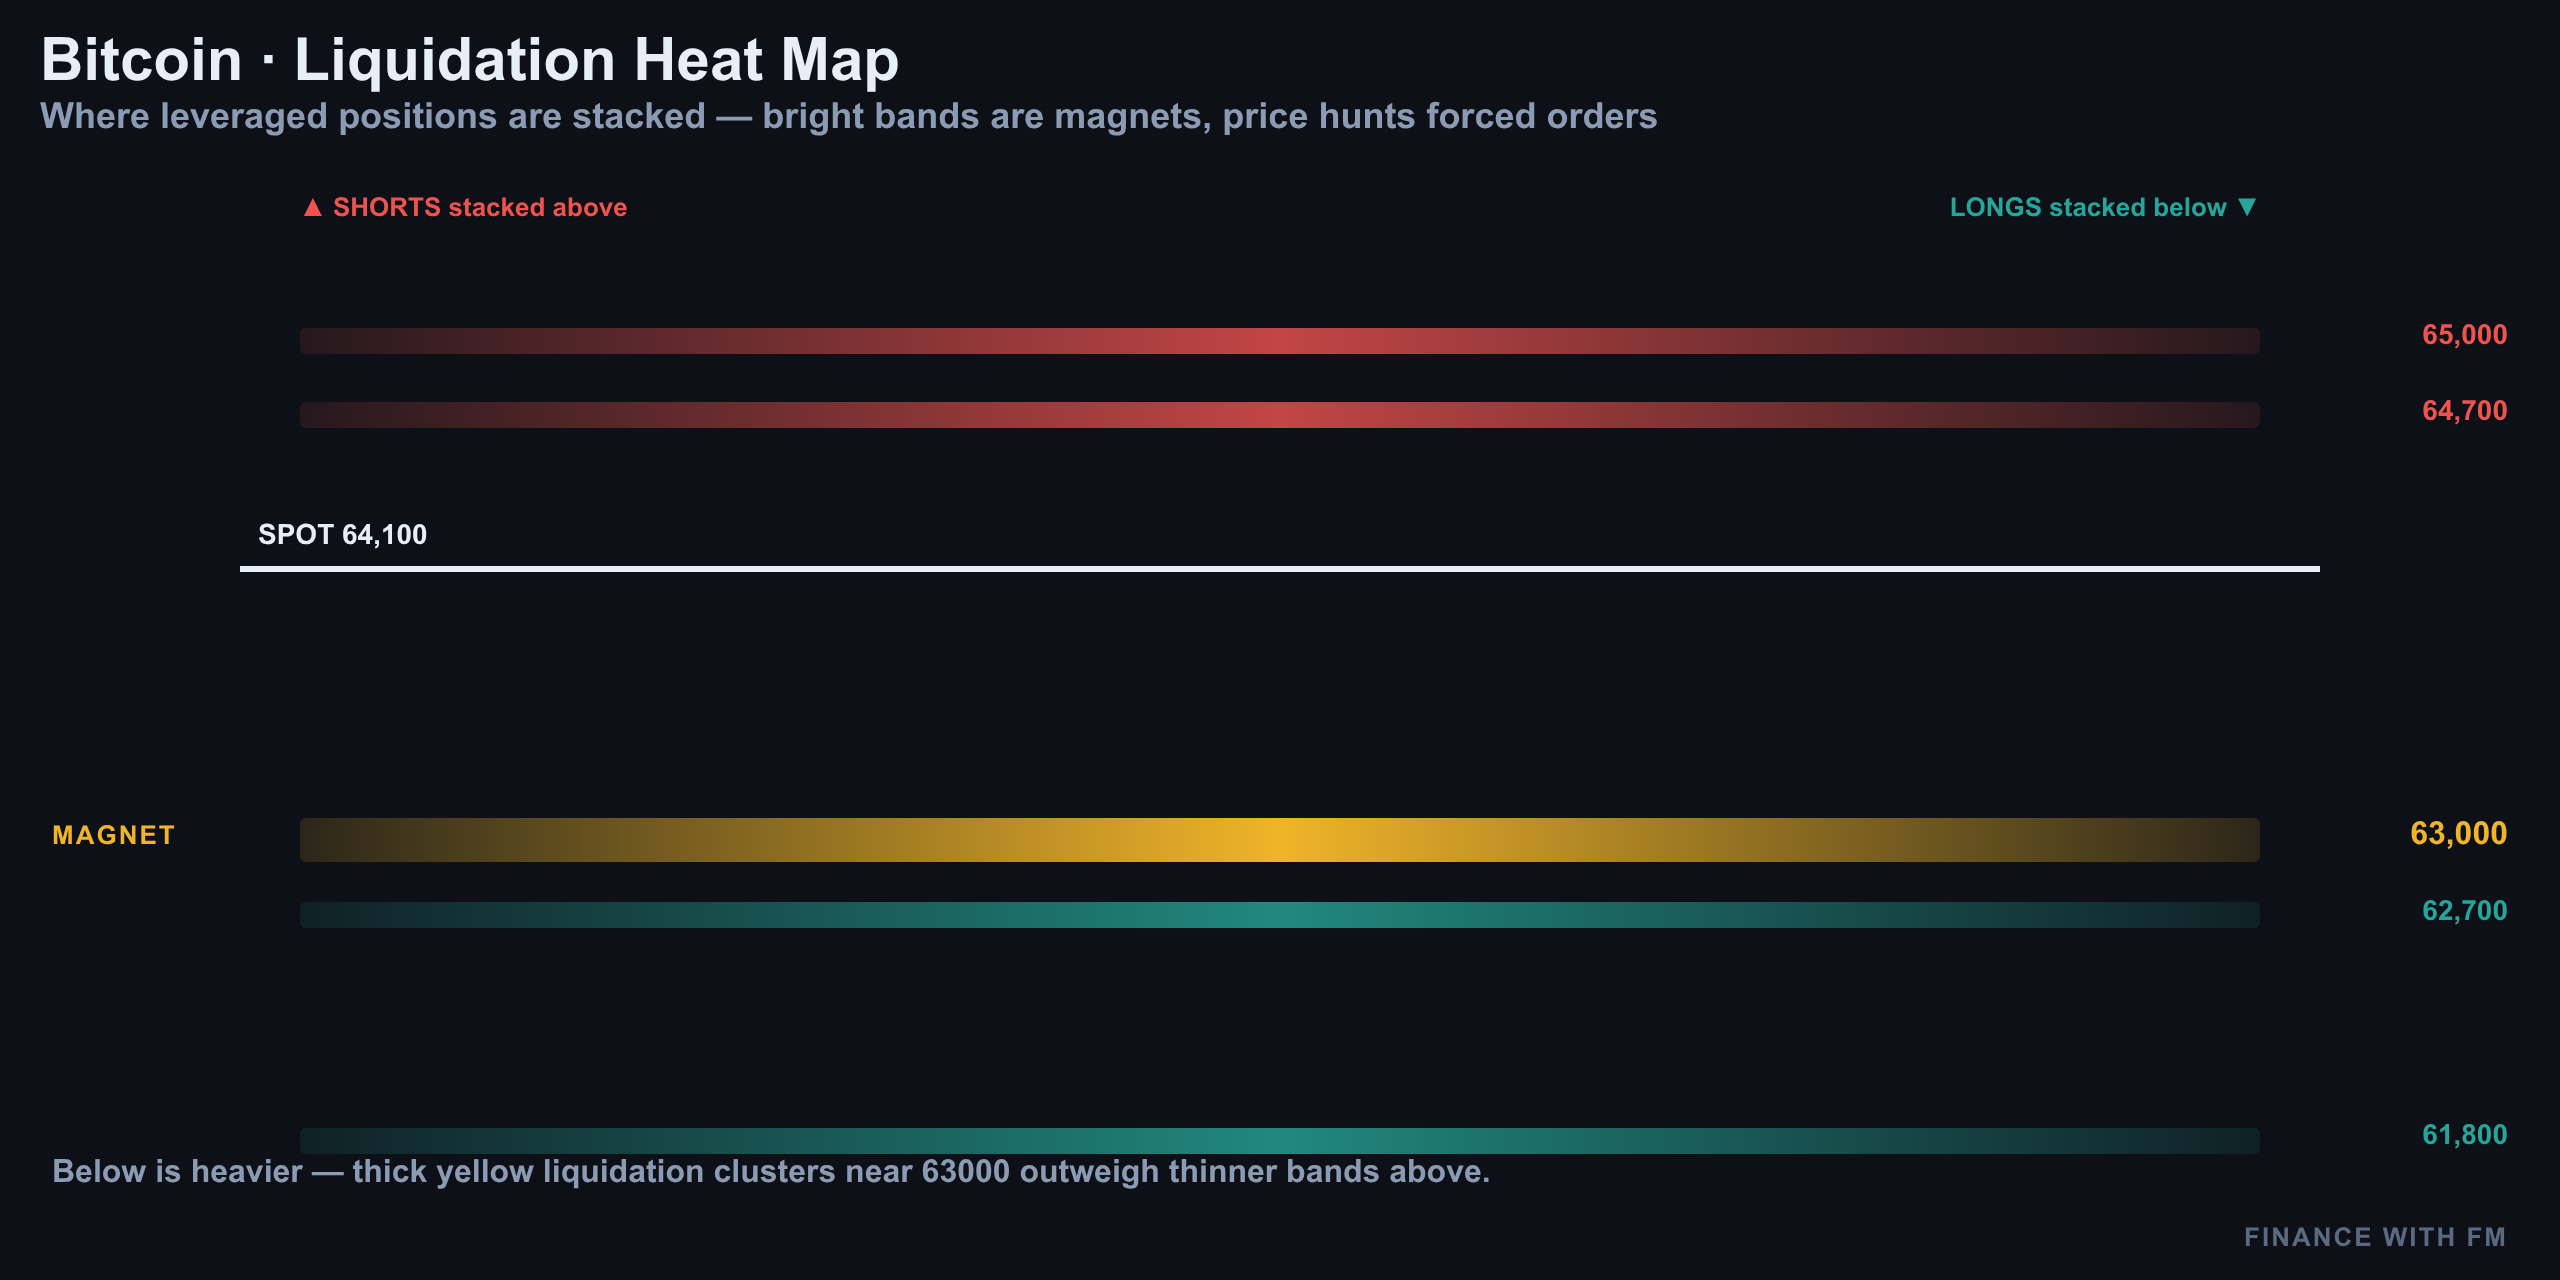
The liquidation map shows a dense cluster of leveraged long positions stacked just above current price, right in the $64,600–$65,500 band — the same zone as our structural resistance. A rejection here wouldn't just confirm the B-wave count technically; it would also trigger a cascade of long liquidations that accelerates any move back down toward the $62,000s.
Structure vs Positioning — Do They Agree?
Yes, and that's the edge. The 4H count says the entire rally off $62,538 is corrective. The 1H count says the current leg is a B-wave that should reject near $64,610. The 15M count shows an oversized, exhaustion-prone C-wave hitting resistance right into a real ask wall. And the liquidation data shows leveraged longs sitting exactly where the bears need them to be trapped.
When structure, order flow, and positioning all point the same direction, that's when a level stops being just a line on a chart and starts being an actual decision point.
Levels to Watch
| Level | Price | Meaning |
|---|---|---|
| Hard invalidation | $65,474 | Bears wrong on close above |
| Trigger / resistance | $64,610 | B-wave rejection zone, 4 BTC ask wall |
| 0.5 retracement | $63,993 | Confirms corrective bounce if rejected |
| 0.618 retracement | $63,848 | Last defense for bulls |
| 0.786 retracement | $63,641 | Bears regain control below here |
| C-low anchor | $62,535 | Structural anchor for entire count |
| Target 1 | $62,264 | First downside objective |
| Target 2 | $62,096 | Second downside objective |
| Target 3 | $61,977 | Final live target from prior update |
Setup Per The Count (Not Advice)
For traders following the primary count, the setup is straightforward: watch for rejection signals — wicks, volume fade, or a bearish close — at or just above $64,610, with the $65,474 line as the hard stop-out level above which the entire bearish structure is invalidated.
If $64,610 gives way and Bitcoin holds above it on a retest, the bias flips toward the reversal alternate, with $65,474 and then $66,956 becoming realistic upside objectives instead of resistance to fade.
Summary
- The $65,474 invalidation from three days ago has held clean — bears haven't been proven wrong yet.
- But the bounce off $62,535 (+2.4%) means the drop didn't extend either — it's now read as a B-wave, not a fresh C-leg.
- 4H structure shows two rule violations (wave 2 retracement, wave 4 overlap) — the rally into $66,956 looks corrective, not impulsive.
- 1H primary count: this leg is a B-wave inside a larger flat, rejecting near $64,610 with downside targets at $62,264 / $62,096 / $61,977.
- Liquidation clusters stack leveraged longs right into the same $64,600–$65,500 resistance zone — structure and positioning agree.
- One level — $64,610 to $65,474 — decides everything from here. Below it, bears stay in control. Above it, the reversal case opens up.
Previous days
08/14/2026 — Bitcoin at $62,535: Flat C or Diagonal Reversal Decides Now
Bitcoin at $62,535: Flat C or Diagonal Reversal Decides Now
Invalidation Held, Target $62,899 Hit
Yesterday's call was precise: an expanded flat targeting the wave C zone near $62,900, with $65,474 as the line that had to hold on the upside. It held. Bitcoin rolled over from $63,600 and dropped into $62,888 — tagging the target almost to the dollar.
That's not a lucky guess, it's structure playing out. The count isn't flipping today — it's refining. We can now see the internal B-wave and C-wave shape clearly on the 1H chart, and the next decision point is the same $62,535 floor, now under sharper scrutiny because three separate timeframes agree on it.
As of this writing, Bitcoin is trading in a tight band around $62,800–$63,100, still hugging that line. CoinMarketCap has it at roughly $62,839, CoinGecko near $62,863, and Yahoo Finance/Binance quoting closer to $63,000–$63,130 — the spread itself tells you the market is undecided right at this level.
4H — The Bigger Picture: A Correction, Not an Impulse
Zoom out first. On the 4H, the auto-count tags a wave one at $65,600, a wave three up at $66,956, and a wave five at $65,410. On the surface it looks like a clean five-wave impulse — until you check the rules.
- Wave four at $62,742 drops straight into wave-one territory — a hard rule violation for a valid impulse.
- Wave two retraced 0.811 of wave one — far deeper than a healthy second wave should ever go.
- Both are weak-structure flags that disqualify this as a textbook five.
What that tells us is the entire rally off the June low was never one clean impulsive leg. It was a series of corrective legs — more zigzag than motive wave. Re-labeling with that lens gives a cleaner higher-degree picture: from the $66,956 top, price fell into an A-wave at $62,275, bounced hard into a B-wave at $65,474, and is now pressing into a C-wave low at $62,535 — exactly where price sits right now.
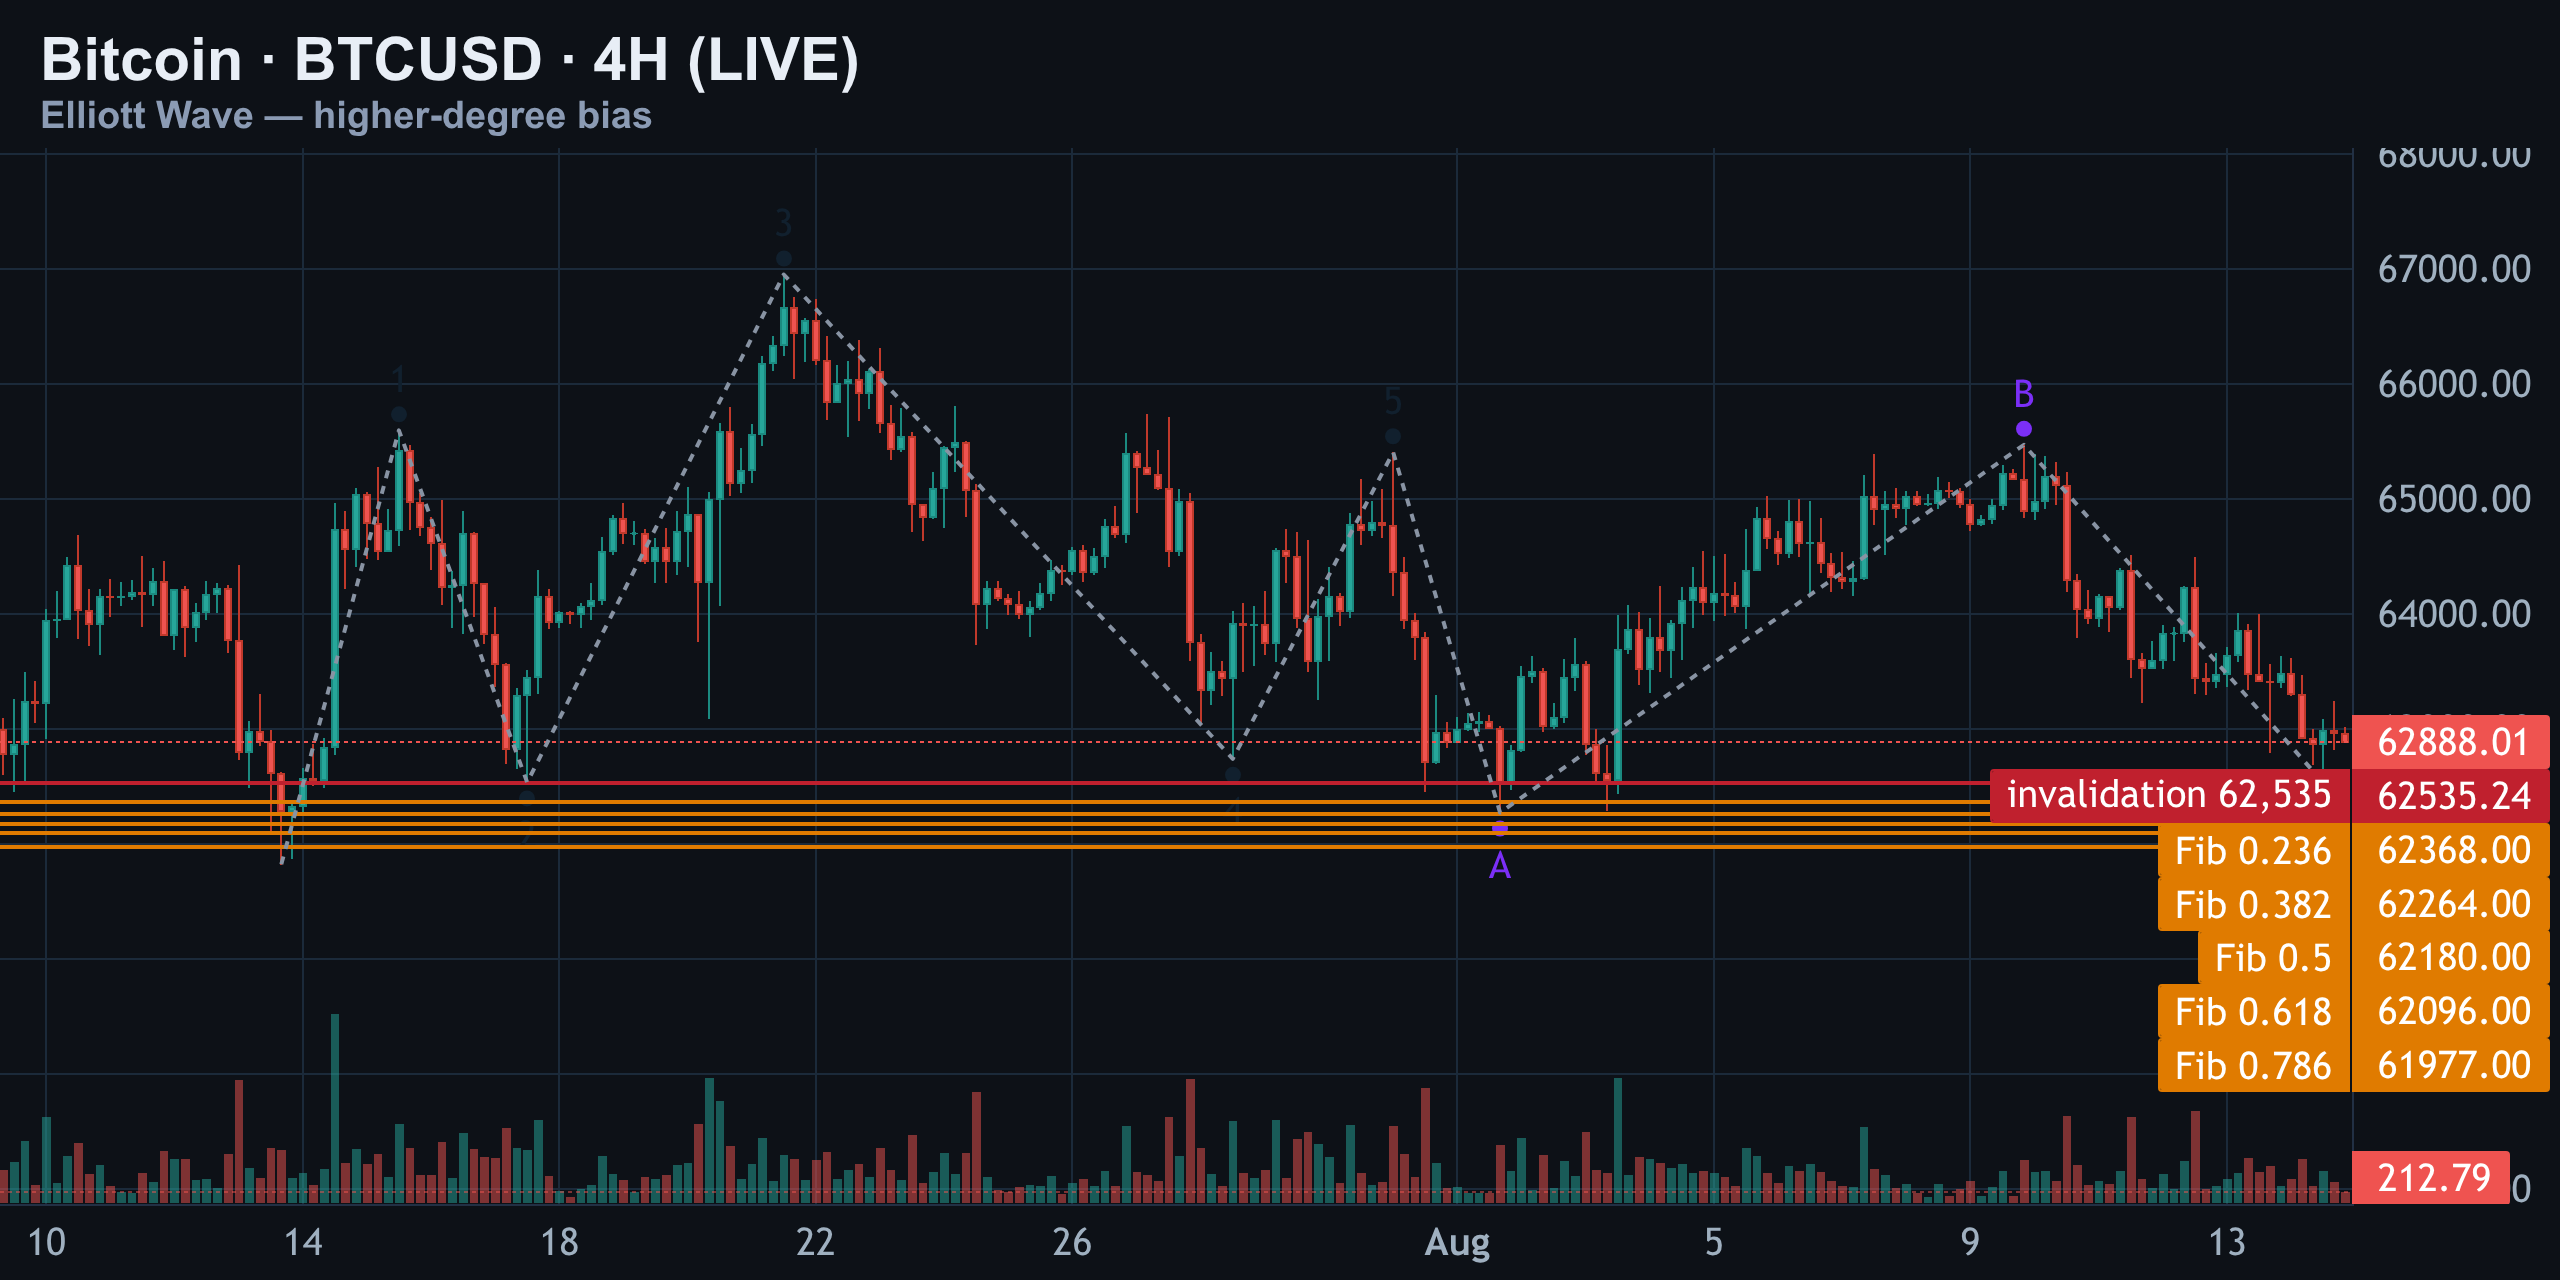
Both the 4H and 1H charts flag that same $62,535 print as invalidation. That's real confluence, not coincidence. Below it sits a tight Fibonacci cluster that becomes the next magnet if the floor gives way.
| Level | Price | Role |
|---|---|---|
| Wave B high | $65,474 | Upside invalidation (held) |
| C-wave target | $62,899 | Hit yesterday |
| Structural floor | $62,535 | Triple-timeframe invalidation |
| Fib 0.382 | $62,264 | Downside target 1 if floor breaks |
| Fib 0.618 | $62,096 | Downside target 2 |
| Fib 0.786 | $61,977 | Downside target 3 |
1H — Primary Count vs Two Real Alternatives
Clear the chart. Primary count first. The 1H rally from $62,275 to $65,474 looks like a five — but wave two crashed all the way back to $62,300, a retrace of more than 100% of wave one. That's a broken rule for a true impulse, but it's completely normal for a diagonal, where overlap and deep retraces are permitted.
So this five-wave shape is most likely the internal structure of the bigger B-wave, topping at $65,474. From there the C-wave down began: an A-wave at $63,238, a shallow B-bounce to $64,500, then a C-wave low tagging $62,535 — right on the higher-degree floor. That's the primary path: the flat's C-wave completing, or grinding a little lower, exactly at this line.
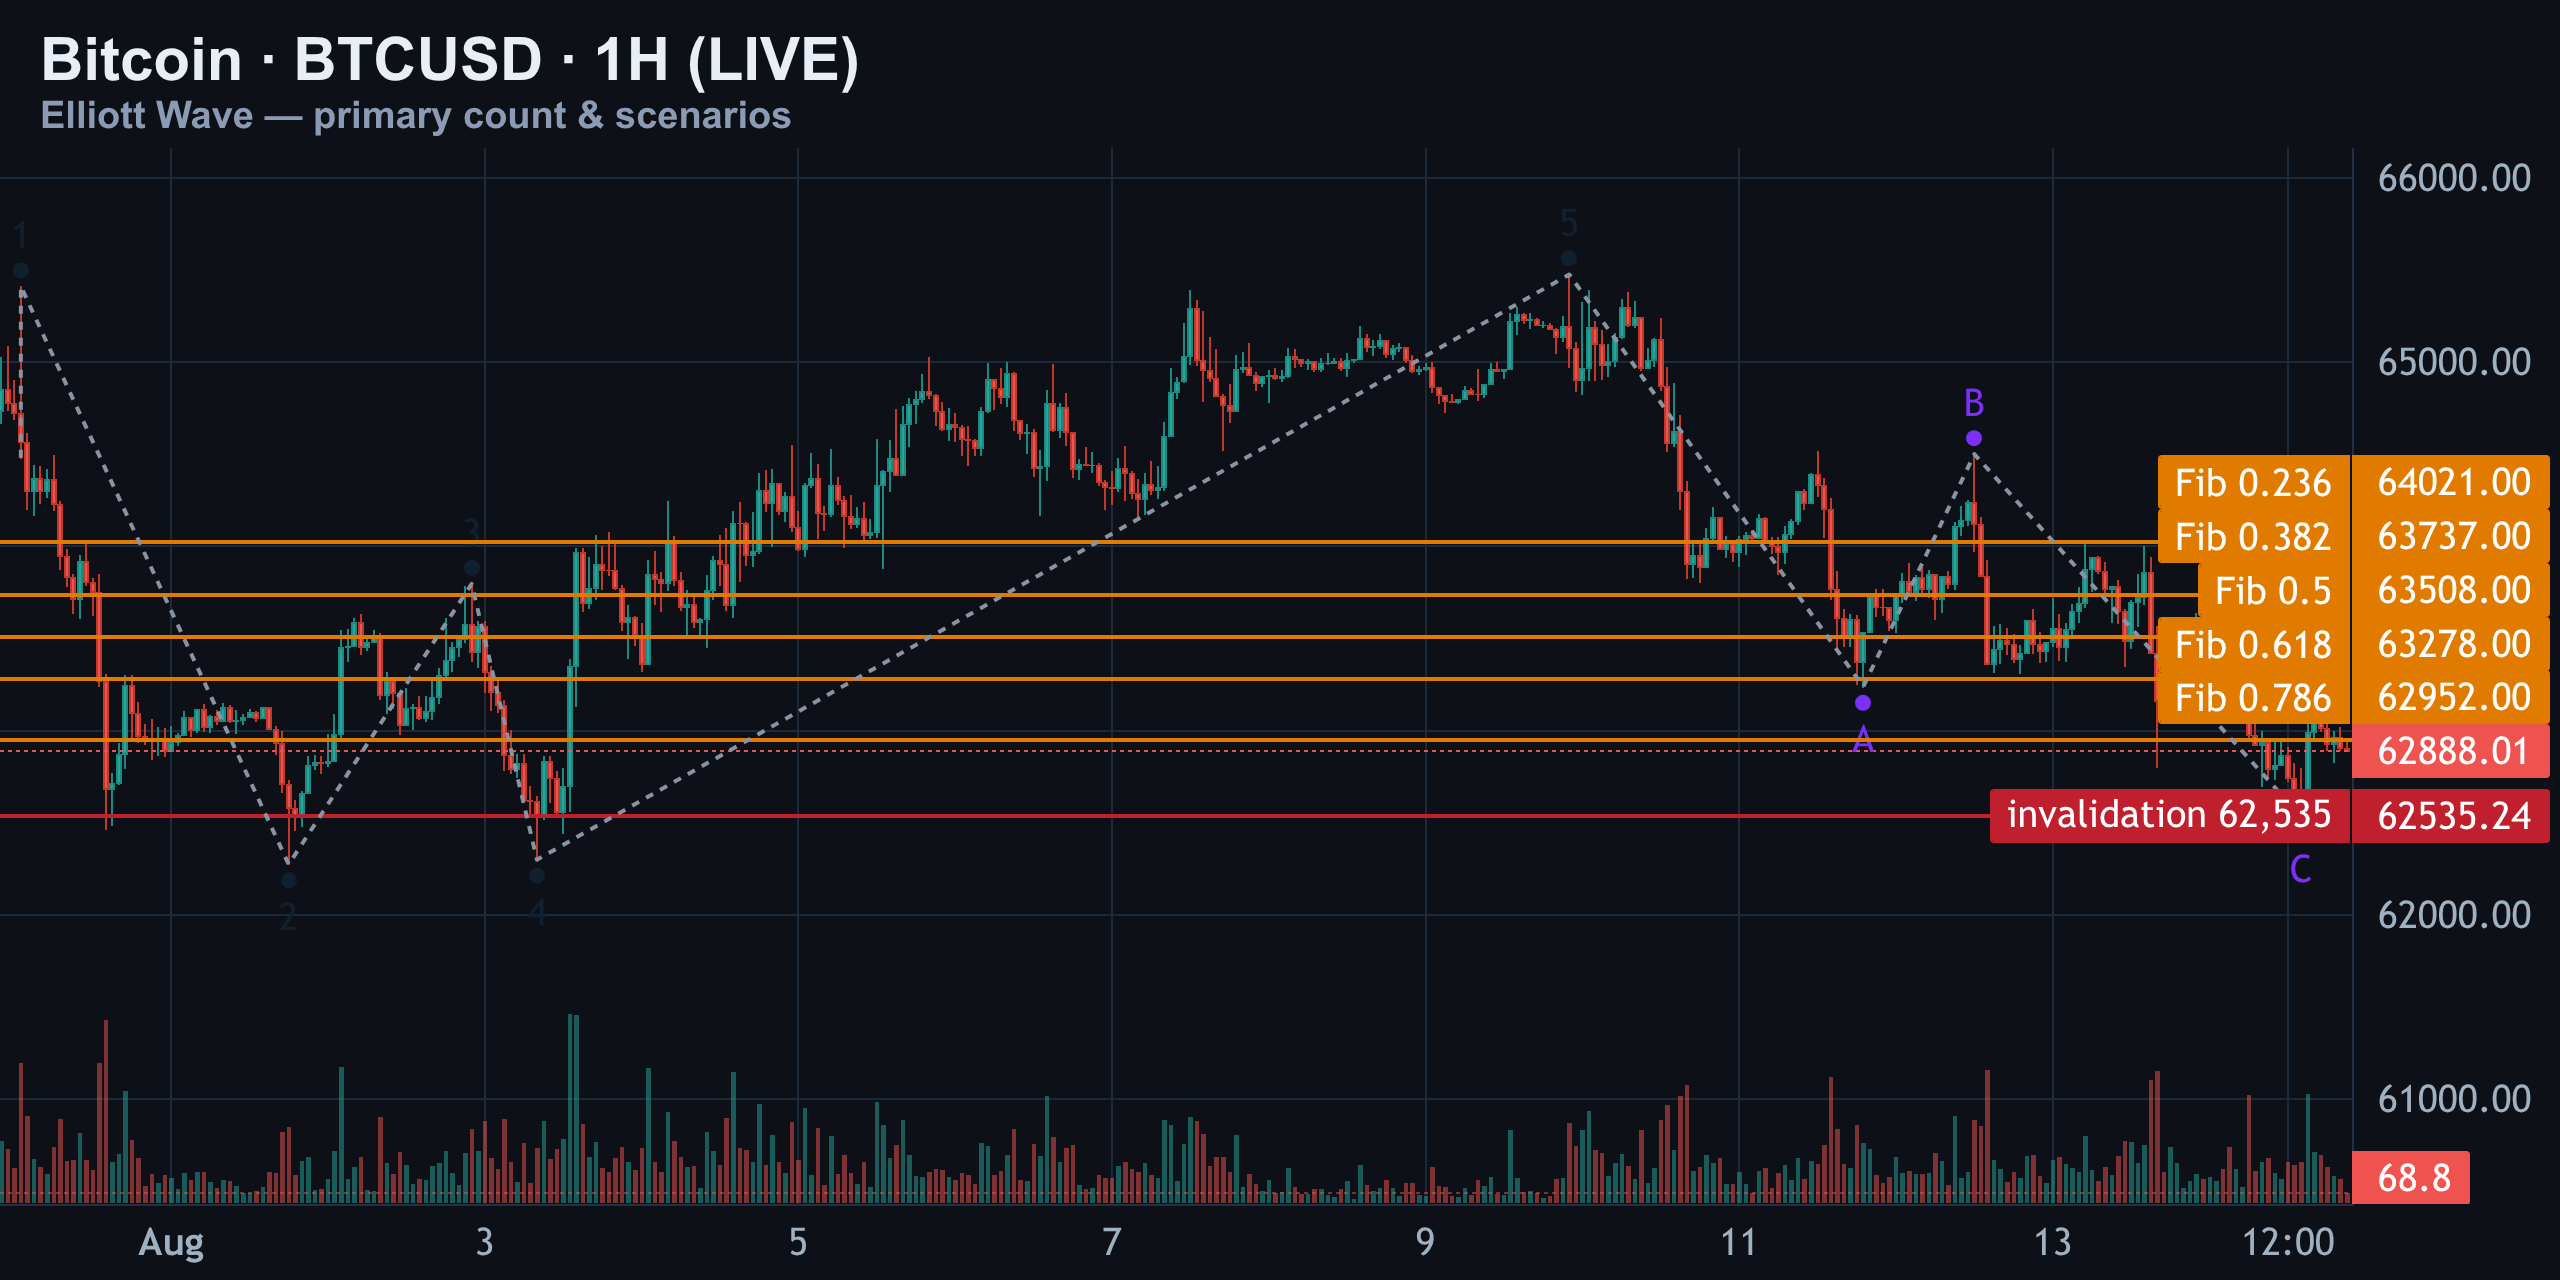
Alternate one: if $62,535 actually breaks clean, this stops being corrective. It flips into an impulsive decline and price accelerates toward the 0.618 and 0.786 Fib levels near $62,096 and $61,977 — no bounce, just continuation.
Alternate two: if the ABC down is already finished, $65,474 was the real final top — not just a B-wave — and buyers reclaim $63,247, then $63,640, pushing back toward the 0.236 level at $64,021–$64,204. Only a clean break below $62,535 kills that idea outright.
| Path | Trigger | Where it leads |
|---|---|---|
| Primary — flat C completing | Hold $62,535 | Grind higher toward $63,247 / $63,640 |
| Alternate 1 — impulsive breakdown | Clean break below $62,535 | Accelerate to $62,096 / $61,977 |
| Alternate 2 — trend reversal | Reclaim $63,247 then $63,640 | Push toward $64,021–$64,204 |
15M — The Trigger Level for Entry
This is the timing chart. Local wave three at $63,350 is shorter than wave one — a hard rule break, so this isn't a textbook impulse either, it's corrective chop. After that five-wave-looking move topped near $62,800, price fell into a local A at $63,640, then a B-wave low that landed exactly at $62,535 — the same number flagged as invalidation on both the 1H and 4H charts.
From there, price bounced into a C-wave high at $63,247, and has since drifted back down to where we sit now, around $62,888–$62,900. That $63,247 print is today's real trigger.
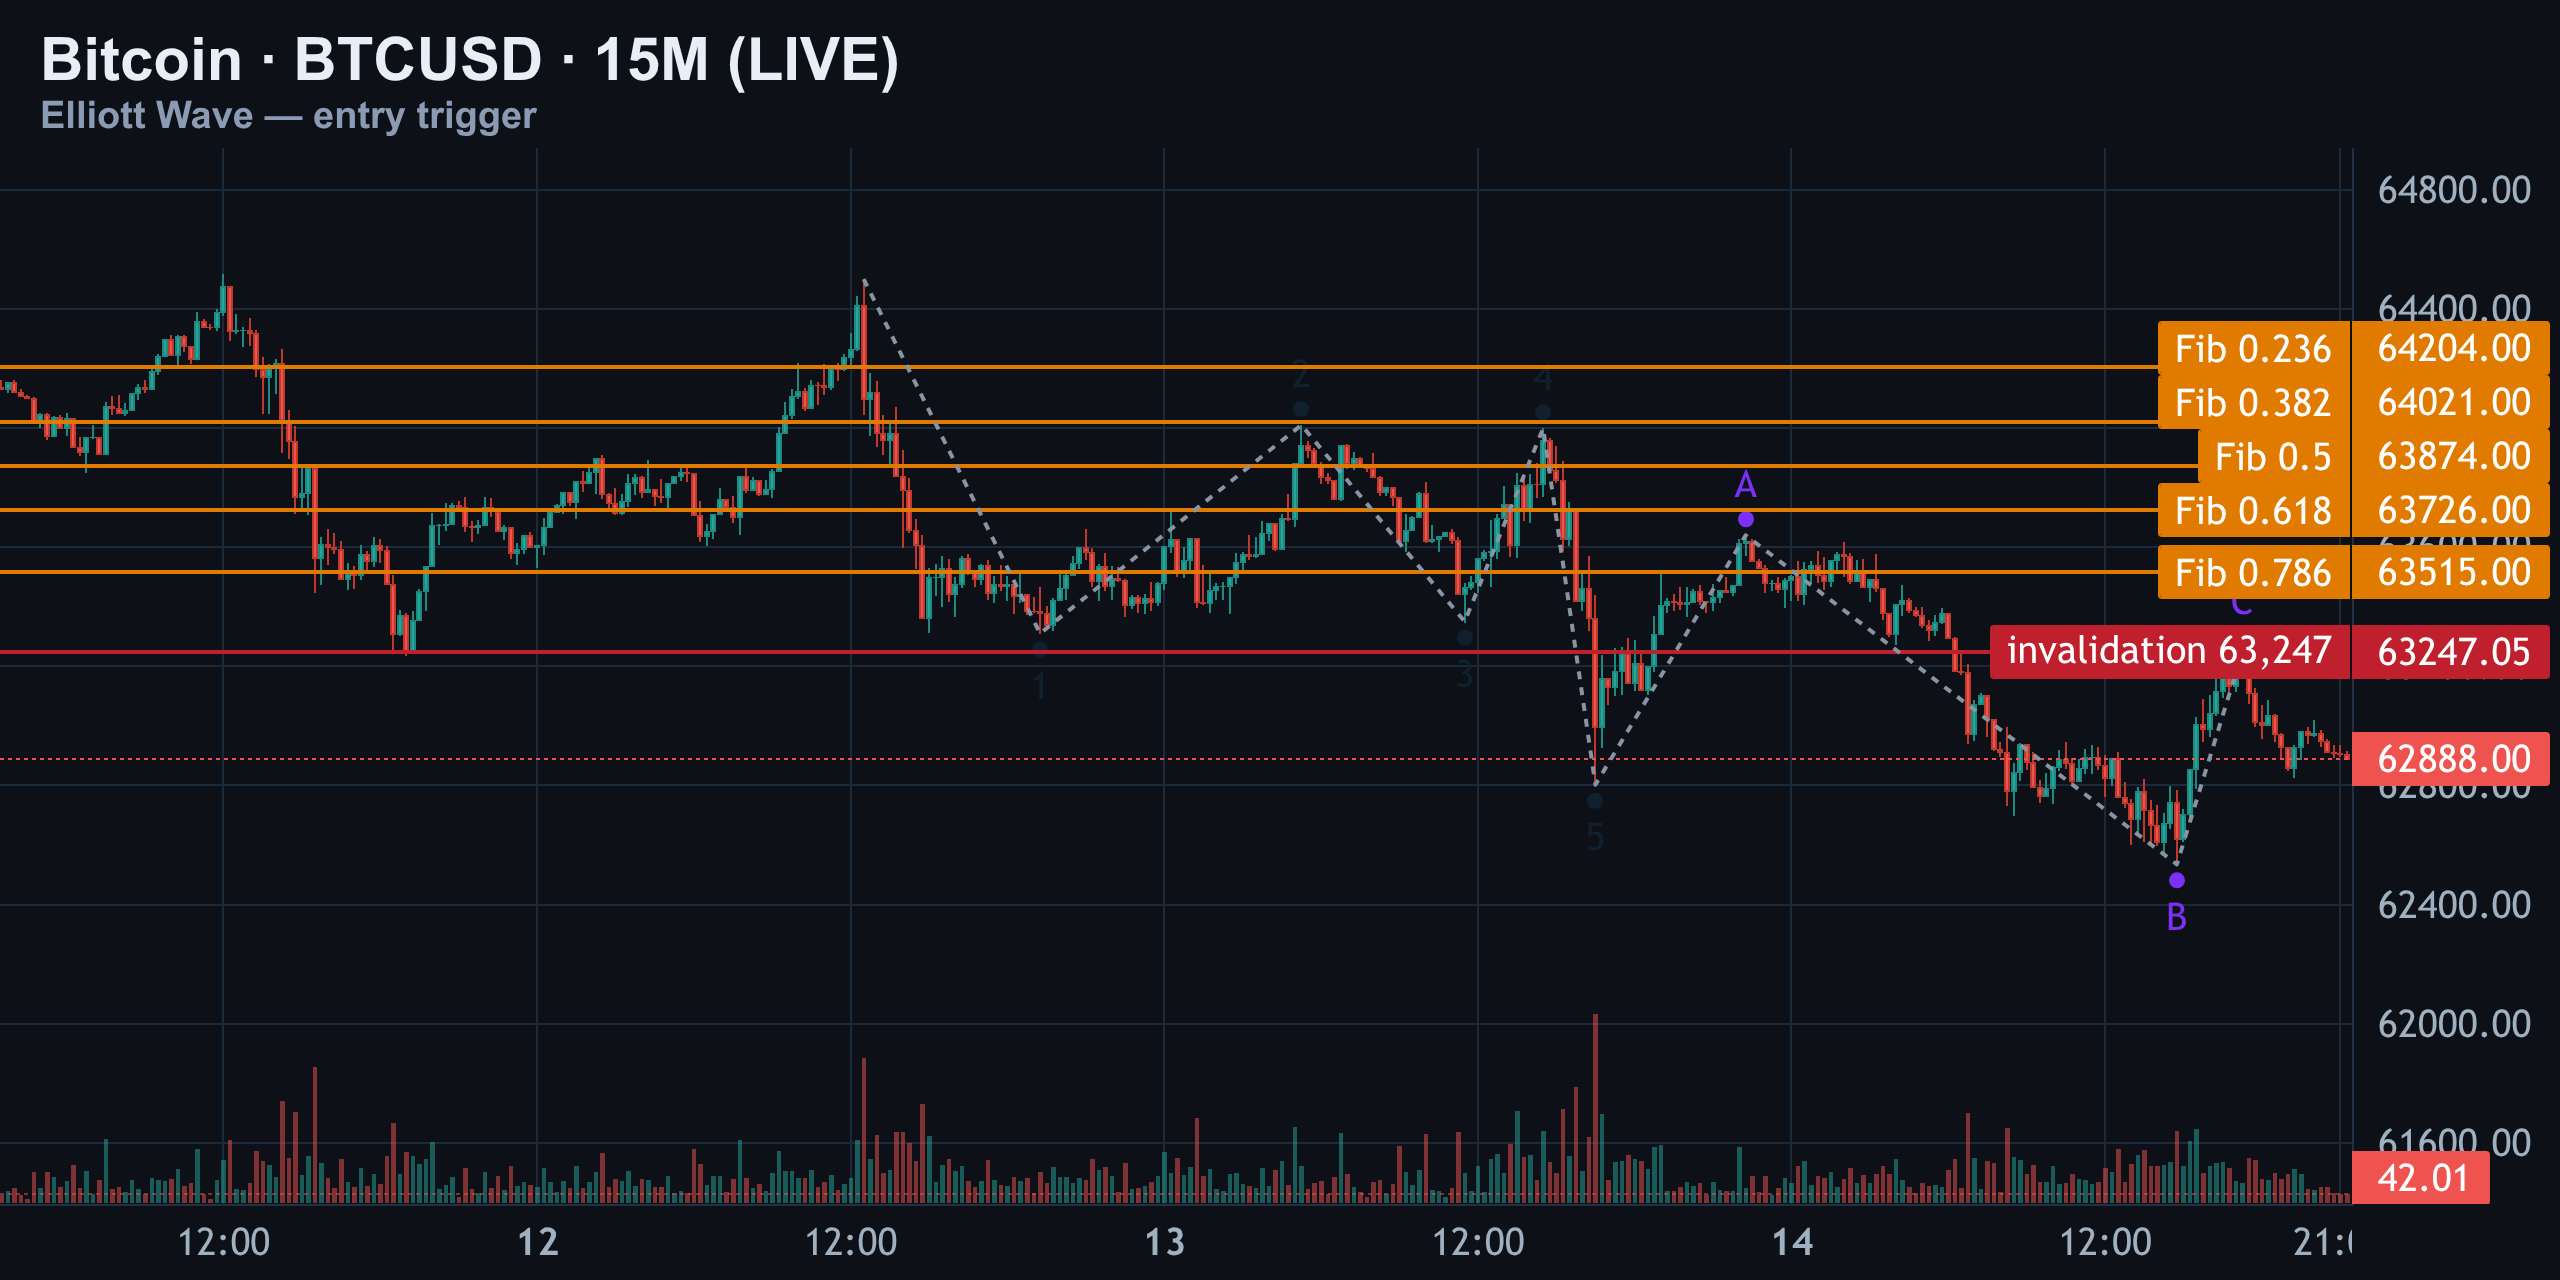
- A clean reclaim and hold above $63,247 opens the door to $63,640 and then the 0.236 level at $64,204.
- A rejection there sends price straight back to retest $62,535 — and this time, a failure to hold could send it straight through.
Watch $63,247. Reclaim it, or roll over. Current spot prices near $62,900–$63,000 put Bitcoin right in the balance between those two outcomes.
The Scenarios, Ranked
Stacking the 4H, 1H, and 15M counts together, here's how the three live paths rank by structural weight right now.
| Rank | Scenario | Confirmation needed | Target if confirmed |
|---|---|---|---|
| 1 — Primary | Flat C completing near the floor | Hold $62,535, reclaim $63,247 | $63,640 → $64,021 |
| 2 — Alternate | Impulsive breakdown | Clean break below $62,535 | $62,264 → $62,096 → $61,977 |
| 3 — Alternate | B-wave top already in, reversal underway | Reclaim $63,247 and $63,640 | $64,204 (0.236 fib) |
Three paths, one level. Grind lower, break down hard, or reverse up — and every one of them is defined against the exact same $62,535 print.
Positioning & Order Flow: Liquidation Clusters
Structure tells you what price should do. Positioning tells you what traders are actually betting on. Liquidation heatmaps currently show clusters stacked just below the $62,535–$62,900 zone and another dense pocket just above $63,600–$64,200.
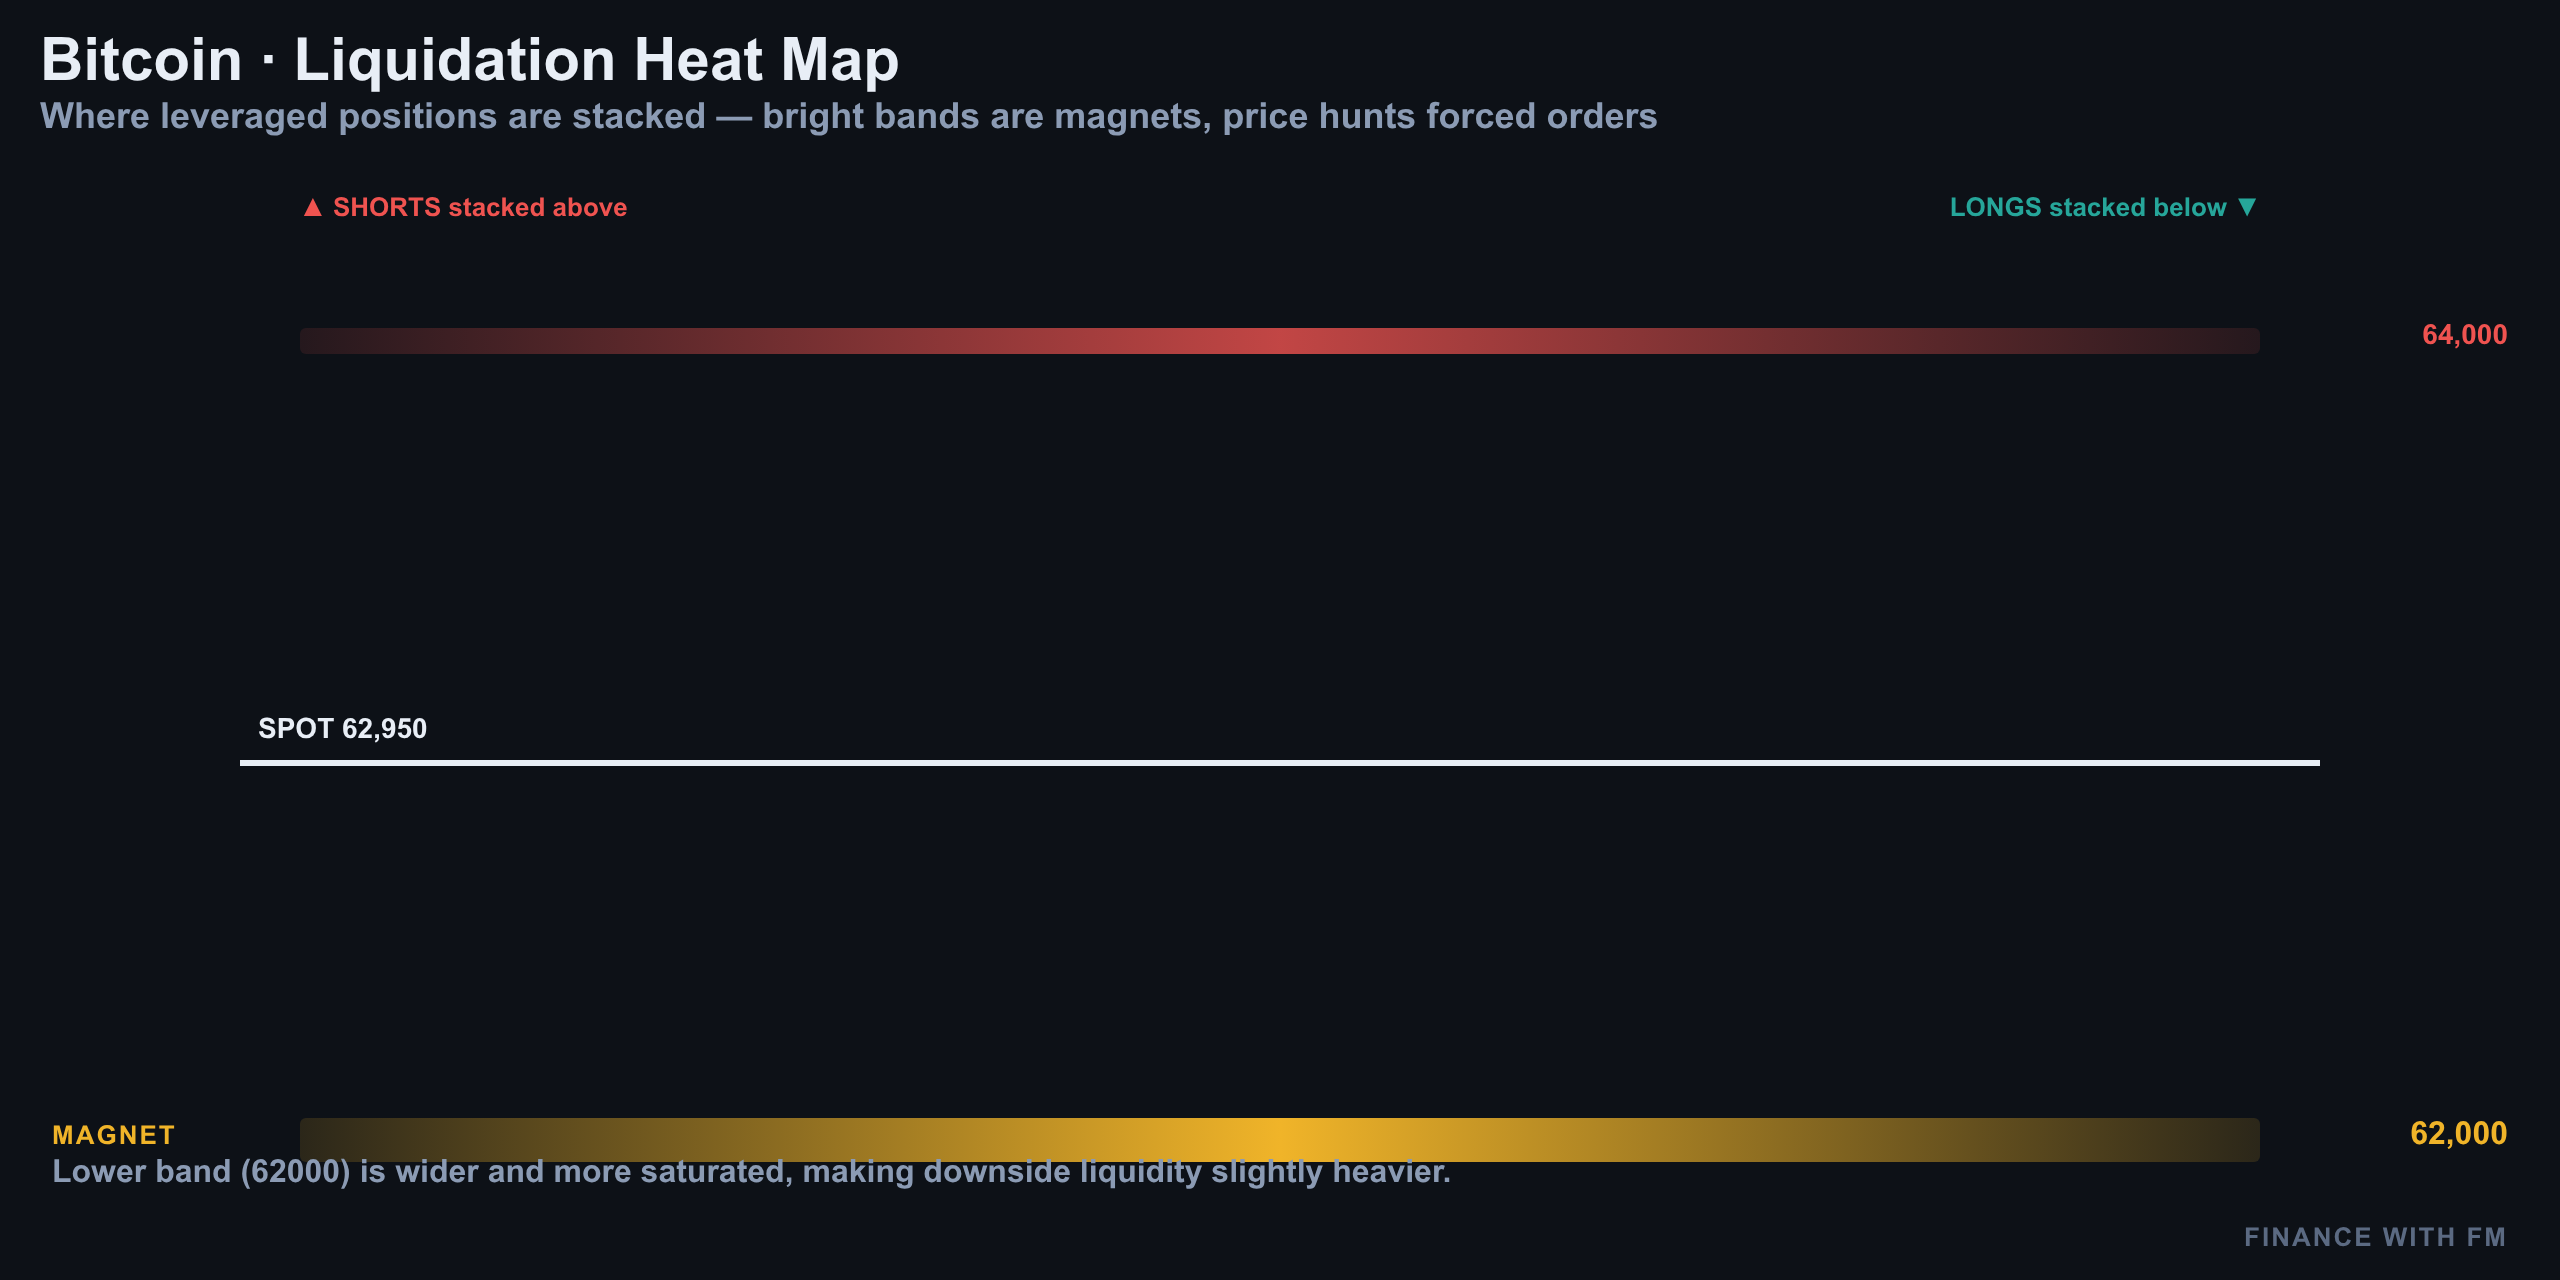
That distribution matters. A break of $62,535 wouldn't just confirm the impulsive-breakdown wave count — it would also trigger a cascade of long liquidations that could hand the market the exact acceleration the Elliott Wave count predicts. Conversely, a reclaim of $63,247–$63,640 runs directly into short liquidations, which would add fuel to the reversal alternate.
In other words, the order-flow map and the wave count aren't fighting each other — they're pointing at the same two doors.
Structure vs Positioning — Do They Agree?
Yes, and that's the notable part of today's setup. The wave count says $62,535 is the fork in the road. The liquidation data says the same thing — heavy long exposure just below current price, meaningful short exposure just above the $63,247–$63,640 trigger zone.
- If price breaks $62,535: expect the move to be sharp, not gradual, as stacked longs get swept.
- If price reclaims $63,247 and holds $63,640: expect the bounce to extend faster than usual as shorts get squeezed.
- The one scenario positioning doesn't reward is a slow, directionless grind — the crowd is leaning, and one side is about to get paid.
That alignment between structure and order flow is exactly why this article opened with a single number. Everything — the count, the Fibonacci confluence, and the leverage data — collapses to the same decision point.
Levels to Watch & Setup Per the Count
| Level | Price | What it means |
|---|---|---|
| Higher-degree B top | $65,474 | Upside invalidation, held |
| C-wave target (hit) | $62,899 | Yesterday's call, confirmed |
| Local trigger | $63,247 | Reclaim = bullish; reject = bearish |
| Next resistance if reclaimed | $63,640 | Local A-wave level |
| 0.236 Fib upside | $64,021–$64,204 | Reversal alternate target |
| Critical floor | $62,535 | Triple-timeframe invalidation |
| 0.382 Fib downside | $62,264 | First breakdown target |
| 0.618 Fib downside | $62,096 | Second breakdown target |
| 0.786 Fib downside | $61,977 | Third breakdown target |
For anyone tracking this as a setup rather than a forecast, the logic per the count is straightforward: a hold of $62,535 with a reclaim of $63,247 favors the flat-completion or reversal paths, with initial resistance at $63,640 and stretch targets near $64,021–$64,204. A clean break and close below $62,535 flips the bias toward continuation, with the 0.618 and 0.786 Fib levels at $62,096 and $61,977 as the next magnets.
Summary
Bitcoin called its shot yesterday — the expanded flat's C-wave target at $62,899 hit almost to the dollar — and today it's sitting exactly where the 4H, 1H, and 15M counts all say it should: on top of $62,535. Live prices across major trackers currently cluster between roughly $62,800 and $63,130, confirming the market is genuinely undecided at this exact floor.
- Hold the floor and reclaim $63,247 → flat C completing, path toward $63,640 and $64,021–$64,204.
- Break the floor cleanly → impulsive continuation toward $62,264, $62,096, and $61,977.
- Liquidation clusters on both sides of the level mean whichever way it breaks, the move should be fast, not slow.
One line, three timeframes, and a leverage map all pointing at the same number. That's as clean a decision point as this market offers right now — watch $62,535, watch $63,247, and let the break tell you which Bitcoin shows up next.
08/13/2026 — Bitcoin EW: Broken Impulse Still Targets Wave C Near $62.9K
Bitcoin EW: Broken Impulse Still Targets Wave C Near $62.9K
Invalidation held, count intact
Two days ago the call on Bitcoin was simple: this isn't a real impulse, it's a broken one, and it's still setting up a Wave C decline toward $62,900, with hard invalidation at $65,474. Since then, price has barely moved. Bitcoin currently trades around $63,500–$63,600, up roughly 0.1% over the window, per live quotes from CoinMarketCap, Binance, and TradingView.
That $65,474 ceiling has not been touched. Neither has the downside target at $62,899. In Elliott Wave terms, that's about as clean a two-day hold as you can ask for — no target hit, no invalidation broken, and no reason to flip the count. The only development worth noting is a local bounce off $63,238, and that bounce is exactly what we're using to time the next short entry.
4H — The Impulse That Isn't
Zoom out to the four-hour chart and the auto-generated count looks bullish at first glance — a textbook one-through-five off the $61,800 low, topping near $66,956. It isn't textbook at all once you check the rules.
- Wave 2 retraced more than 130% of Wave 1 — a hard rule violation. No valid impulse allows a second wave to retrace beyond the start of the first.
- Wave 4 dove back into Wave 1's price territory, overlapping it completely — a second, separate violation.
- Two broken rules in one structure means this five-wave rally was never a motive impulse. It's corrective — most likely a large zigzag or diagonal-type structure.
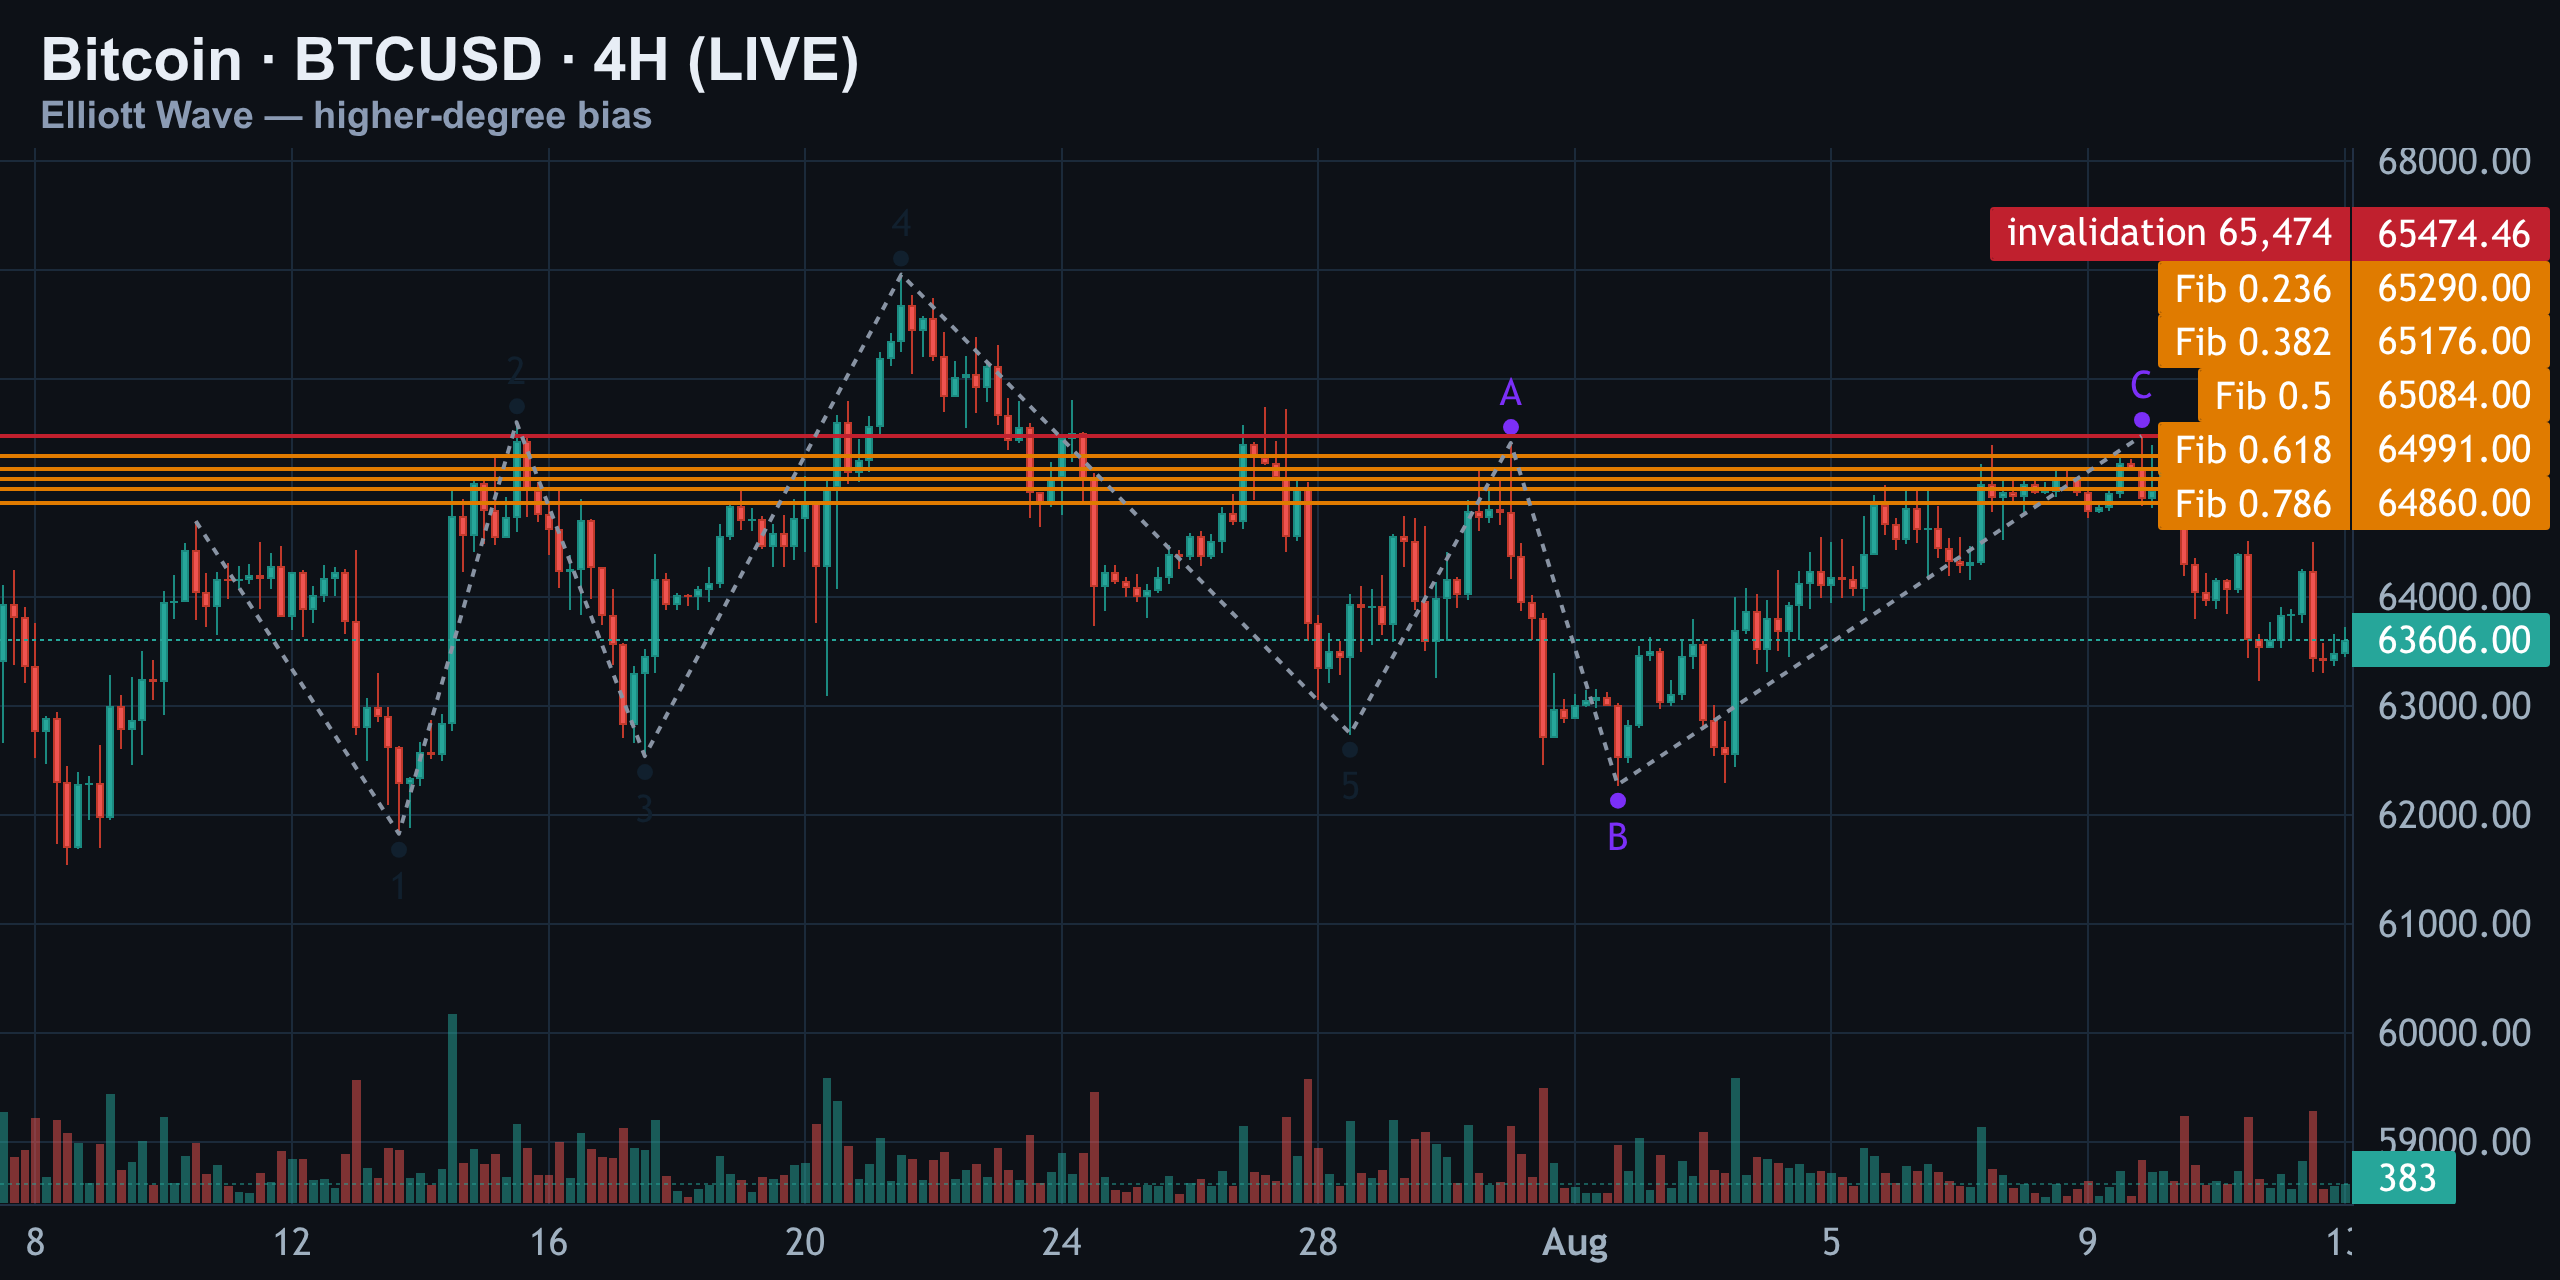
What follows that fake impulse is the real story: an A-B-C correction. Wave A bottomed near $65,400, Wave B ran all the way back up to $66,275 — already 1.18x Wave A, deep for a normal flat — and Wave C stalled at $65,474, exactly 1.2x Wave A. That C-wave high is now the higher time frame invalidation.
| Leg | Level | Note |
|---|---|---|
| Wave A low | $65,400 | Start of the A-B-C correction |
| Wave B high | $66,275 | 1.18x Wave A — deep flat |
| Wave C high | $65,474 | Invalidation for the bearish count |
| Current price | ≈$63,600 | Comfortably below the ceiling |
As long as Bitcoin stays under $65,474, the higher-degree bias stays bearish and one more leg down is still owed to complete this correction. This chart doesn't hand us an entry — it hands us the boundary everything else has to respect.
1H — Primary Count vs The Alternates
Drop to the one-hour chart for the primary count, drawn fresh off the $64,745 pivot. Wave 1 drops to $63,267 for a Wave 2 retrace of over 100% — again not a clean impulse by the book. Wave 3 stretches to $65,410, a healthy 1.87x extension. Wave 4 drops to $62,275, overlapping Wave 1 once more. Wave 5 completes near $63,796.
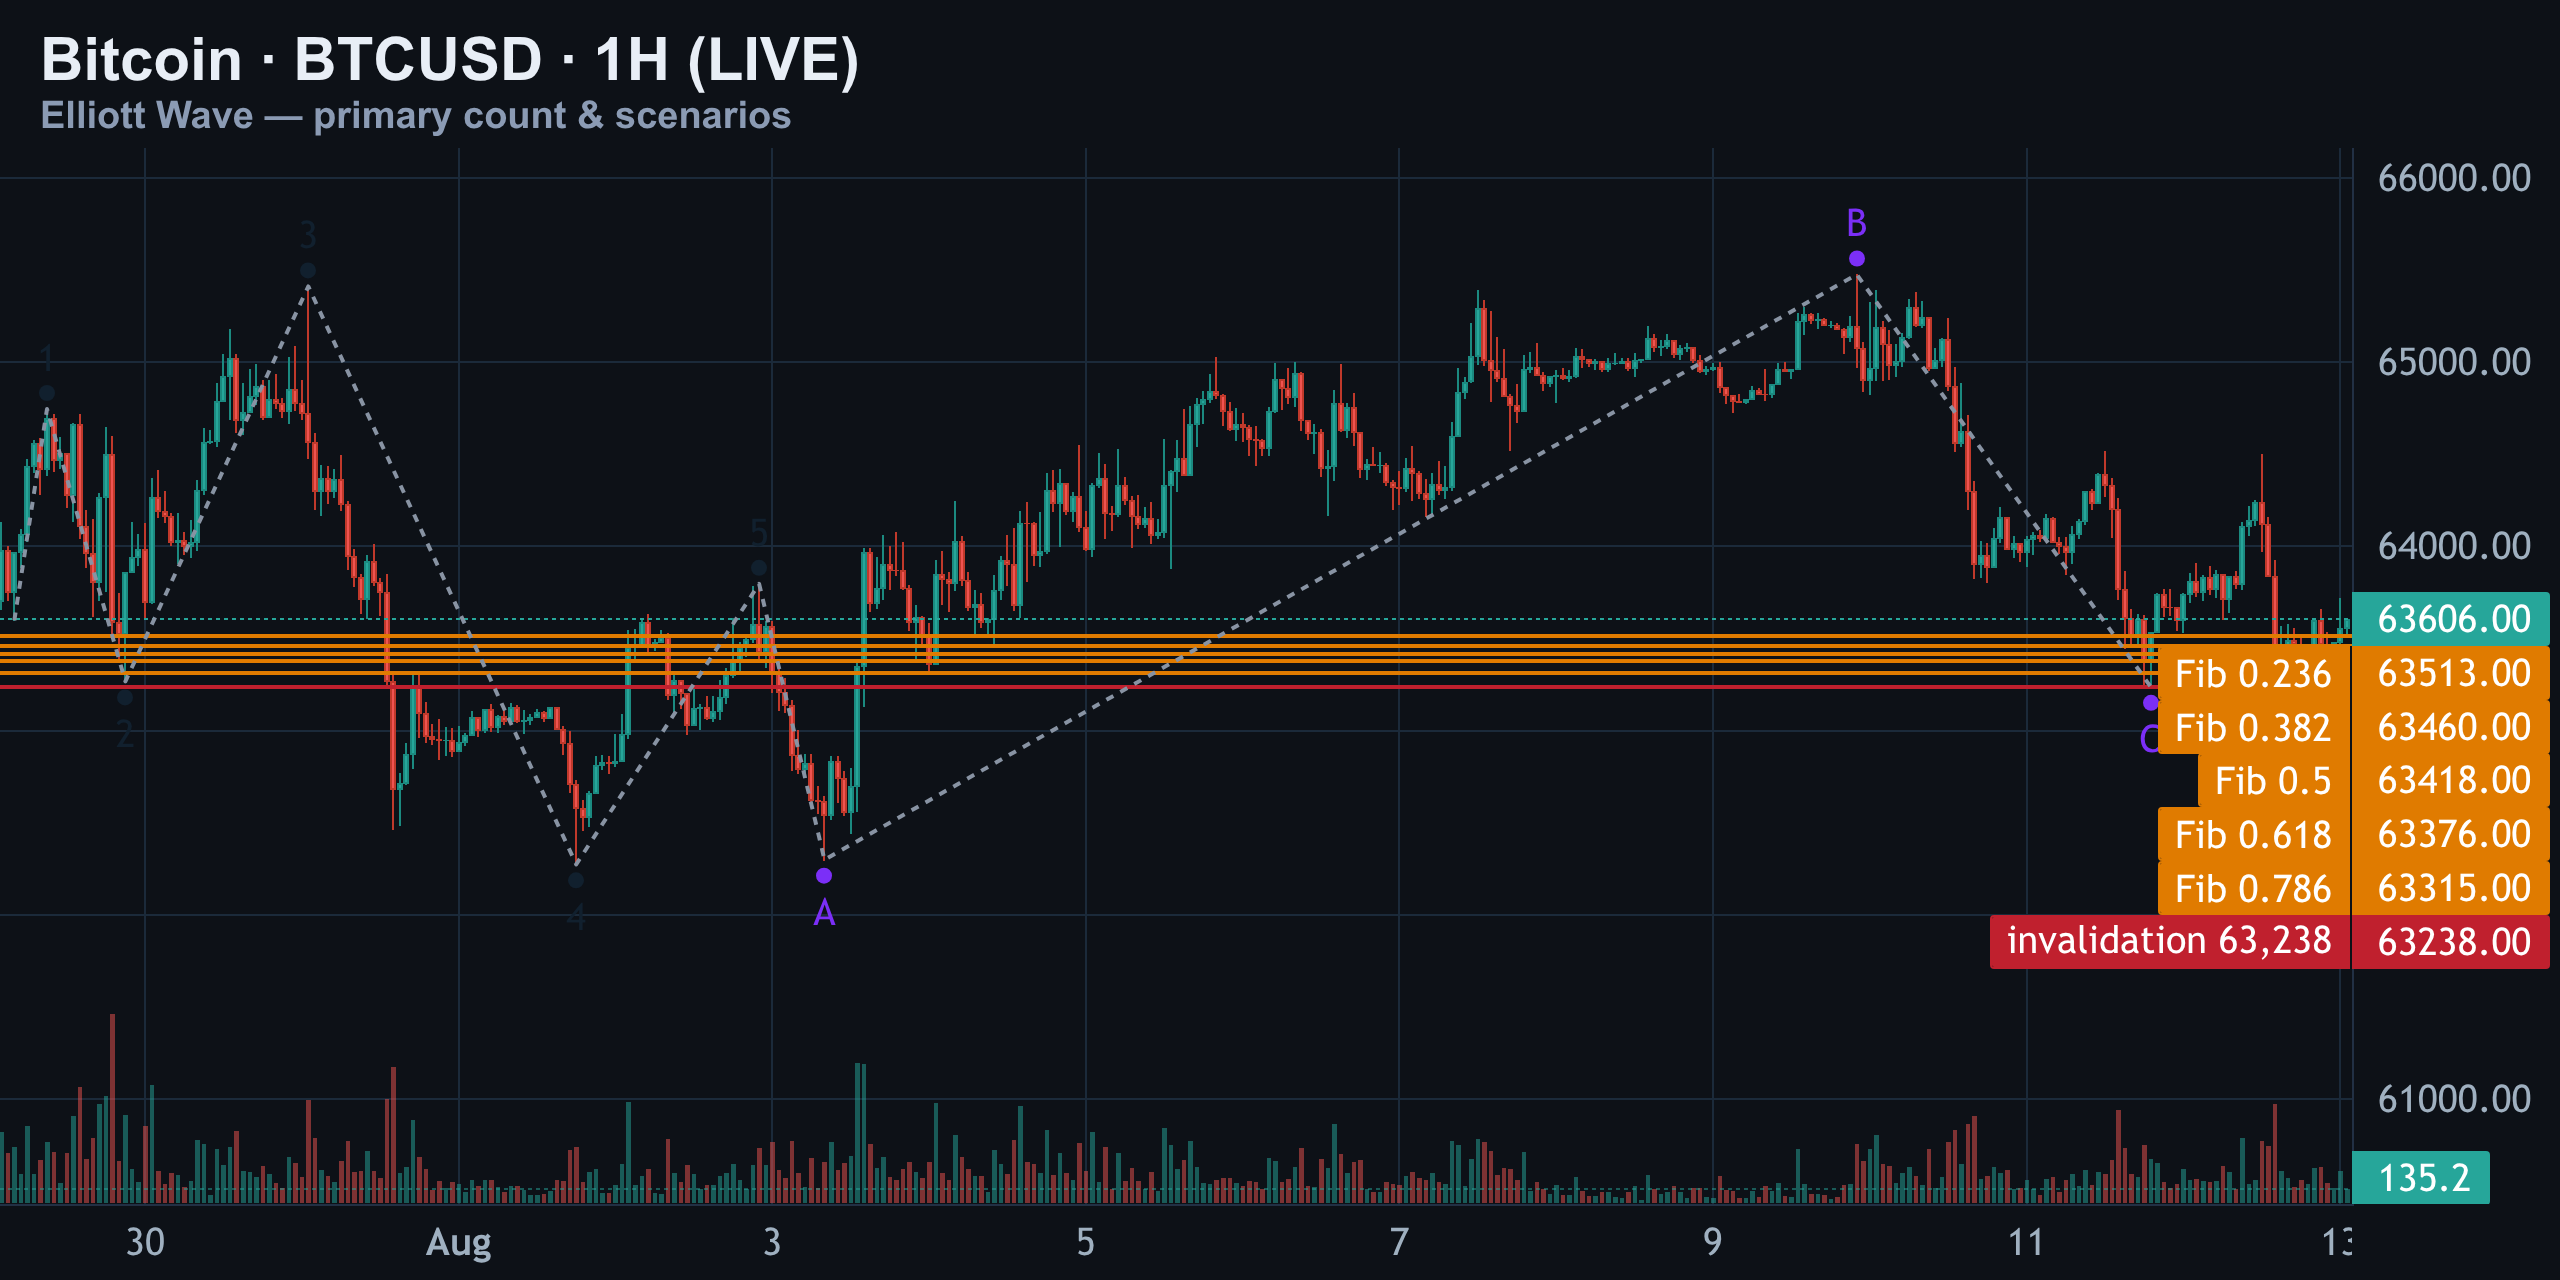
Then comes the correction that actually matters right now: Wave A down to $62,300, Wave B exploding back up to $65,474 — 2.12x Wave A, a textbook expanded flat — and Wave C bottoming at $63,238. That's the exact level Bitcoin is bouncing from today.
| Scenario | Trigger | Bias |
|---|---|---|
| Primary | Bounce off $63,238 fails into resistance | Bearish — fresh leg down toward $62,900 |
| Alternate 1 | Confirmed close above $65,474 | Bullish — relabel as reversing ending diagonal |
| Alternate 2 | $63,238 breaks without a real bounce | Bearish — direct Wave C extension, same target |
Wipe the chart and the alternates split cleanly. If Bitcoin closes back above $65,474 with conviction, the whole bearish skeleton breaks and this becomes an ending diagonal that's actually reversing higher — that's the scenario that ends the bearish case for good. If instead $63,238 gives way without any real bounce first, that's a direct C-wave extension: same bearish destination, just no consolation bounce along the way.
15M — Timing The Short
The fifteen-minute chart isn't for direction — it's purely for triggering the entry. The micro count runs Wave 1 at $63,570, Wave 2 at $63,368, Wave 3 at $63,578. That's a problem: Wave 3 is shorter than Wave 1, which is never allowed in a valid impulse. Wave 4 sits at $63,310, Wave 5 completes at $63,661.
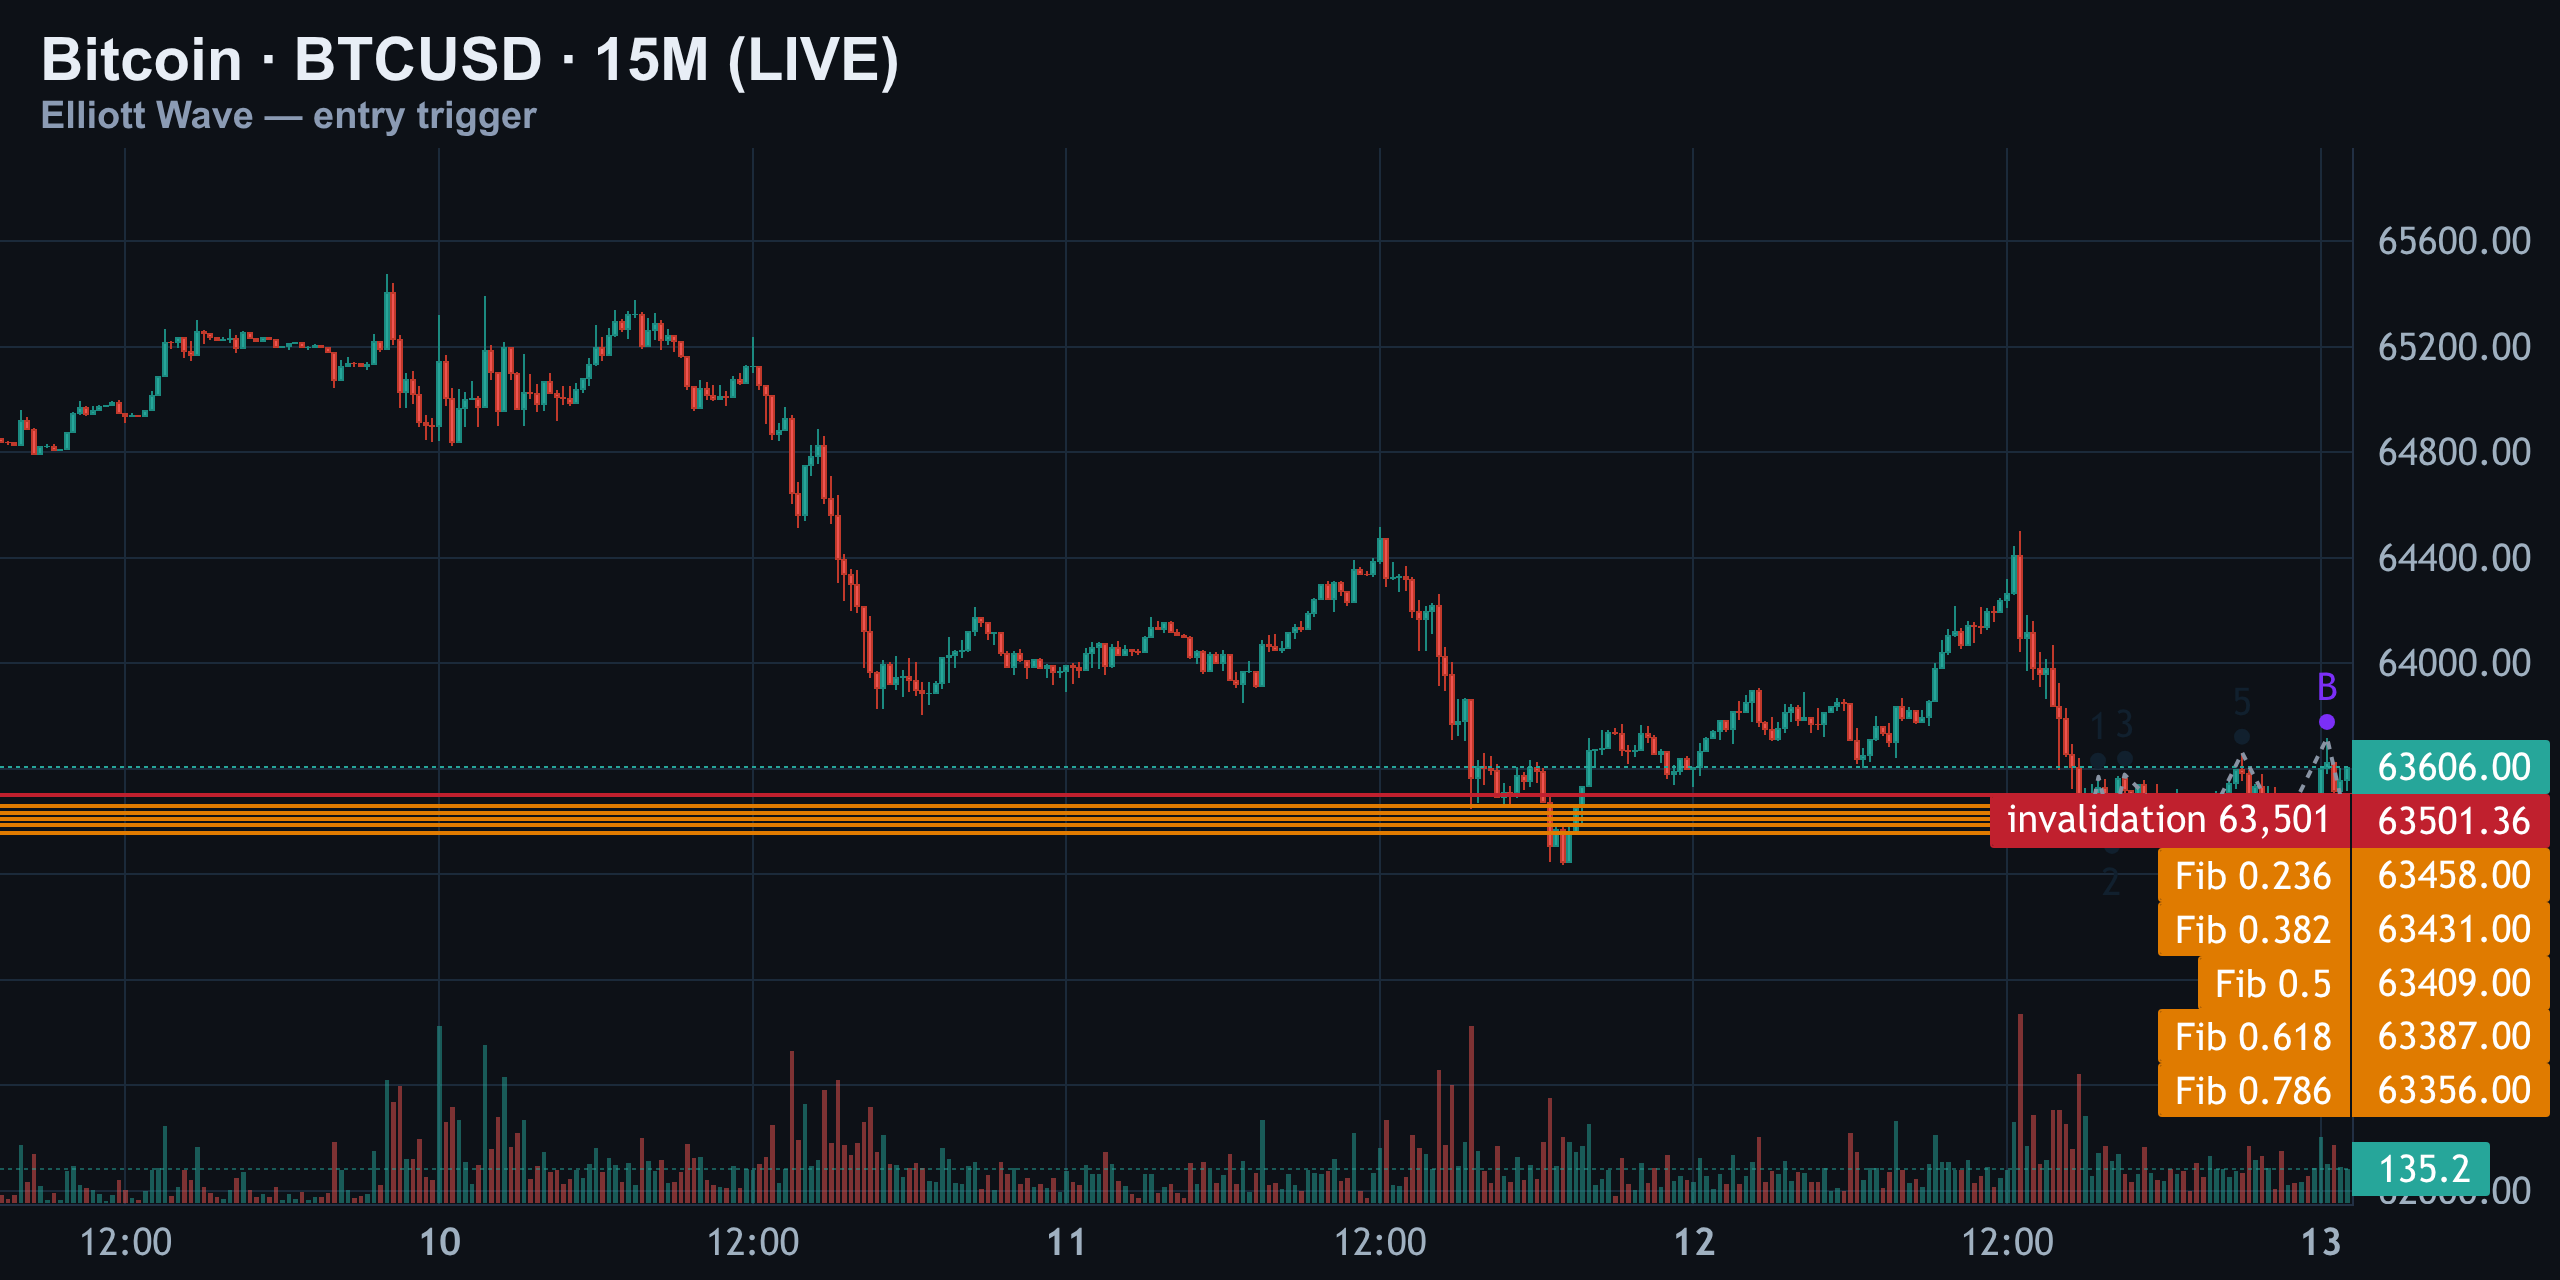
After that comes a small A-B-C: A down to $63,370, B up to $63,717, C back down to $63,501. That $63,501 print is the local invalidation. The key detail is where B topped — $63,717 — landing right on top of a five-Bitcoin ask wall sitting at $63,676. That's not coincidence; that's real supply sitting in the order book.
- If price pushes into the $63,676 wall and gets rejected again, that's the cue to start scaling into the short.
- If price rips through the wall and holds above it, the bounce has real strength — the next test shifts to the higher time frame resistance zone at $64,860–$65,084.
The scenarios, ranked
Stack the three timeframes together and the picture is consistent rather than contradictory — every degree of trend shows the same broken-impulse, corrective-structure fingerprint.
| Rank | Scenario | Condition | Target |
|---|---|---|---|
| 1 | Primary bearish | Rejection at $63,676–$63,717, then rollover | $62,900 (Wave C) |
| 2 | Direct C extension | Break of $63,238 without a bounce | $62,900 or lower |
| 3 | Bullish invalidation | Confirmed close above $65,474 | Reversal / new highs |
Two of three ranked outcomes still point lower. The bullish case only activates on a specific, well-defined trigger — not a guess, a level.
Positioning & order flow (the edge)
Structure tells you where price should go. Positioning tells you who's on the wrong side when it does. Recent market snapshots show Bitcoin oscillating in a tight $63,300–$64,000 band with 24-hour volume around $22–23 billion, according to data aggregated by Crypto.com and CoinMarketCap — a low-volatility grind that's classic for a B-wave or C-wave bounce rather than a fresh impulsive breakout.
Liquidation clusters
This is where retail positioning and the wave count start pulling in opposite directions. Long liquidation clusters have been building just below current price, while a thinner band of short liquidations sits stacked above $65,000 — right around the same $65,474 invalidation the chart count already flags.
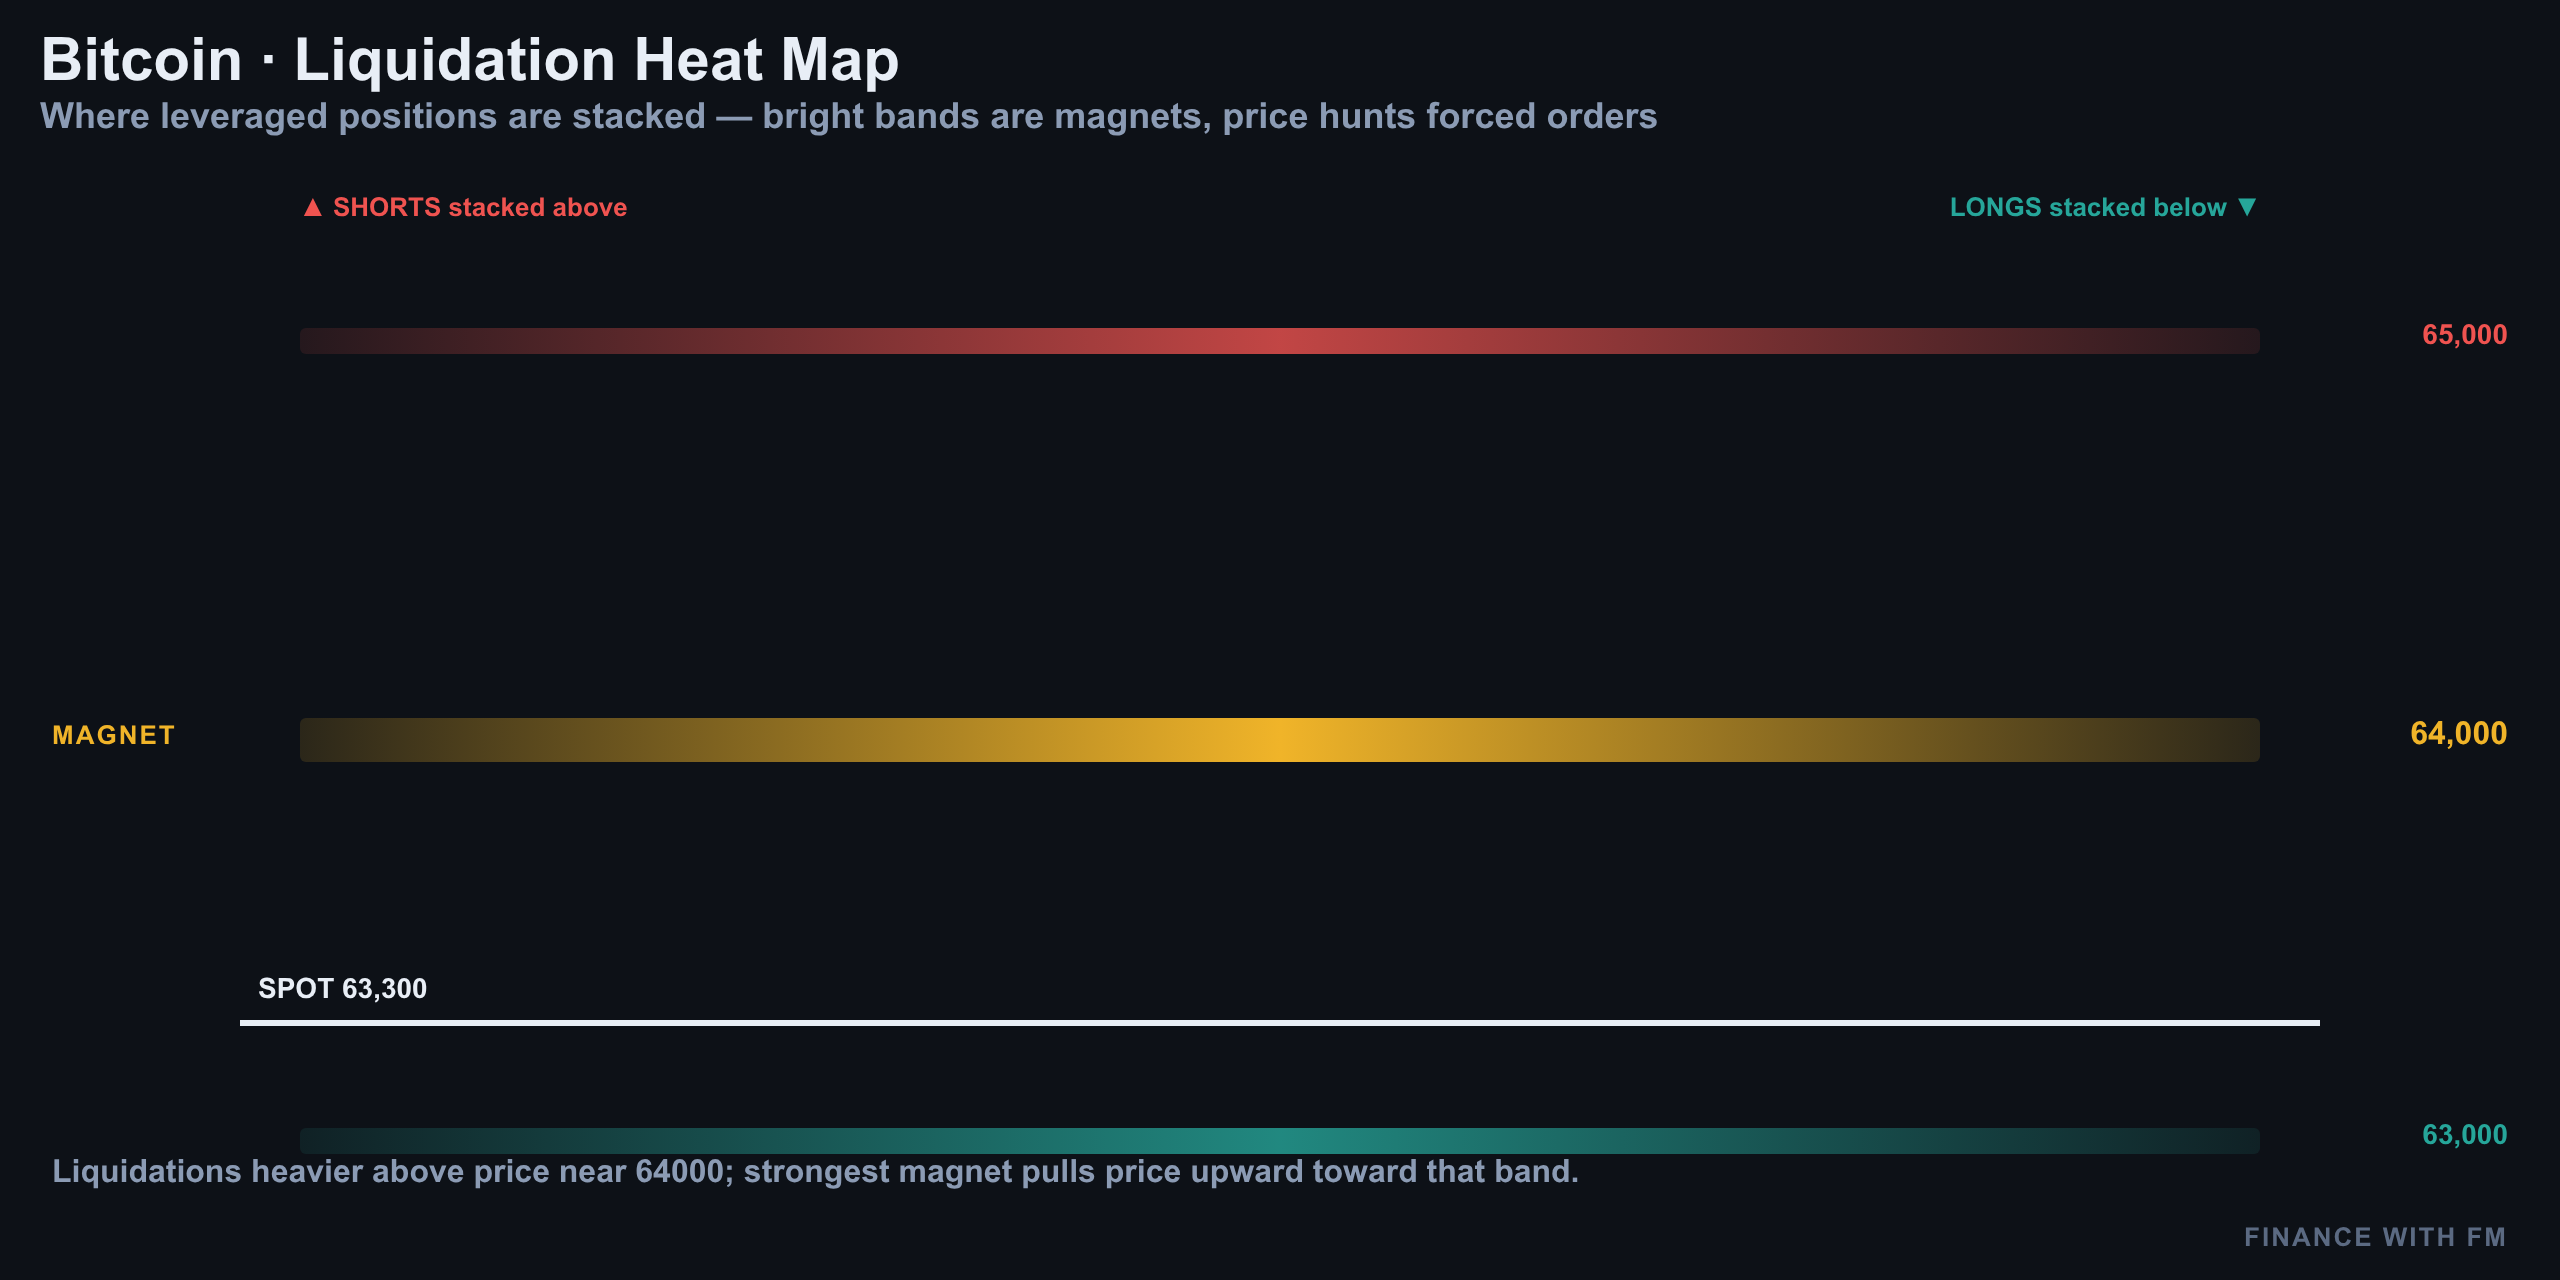
Translation: retail is piling into longs at exactly the level the structure says should fail. If that bounce off $63,238 rolls over as the primary count expects, those long clusters become fuel for the move toward $62,900. If instead price grinds up into $65,474 and takes out the short liquidations stacked there, it could accelerate a squeeze that validates the bullish alternate — which is precisely why that level is the line in the sand.
Structure vs positioning — do they agree?
Mostly, yes — and that's the interesting part. The chart says bearish below $65,474. The order book shows a real ask wall at $63,676 reinforcing that ceiling on the micro timeframe. Liquidation data shows leveraged longs crowding a level the structure expects to fail. Three independent signals, one direction.
- Elliott Wave structure (4H, 1H, 15M): corrective bounce, bearish continuation favored
- Order book: ask wall at $63,676 capping the bounce
- Liquidations: longs clustered below spot, vulnerable to a flush toward $62,900
The one place they'd disagree is a decisive close above $65,474. That's the level where structure, order flow, and positioning would all need to flip together — and until that happens, treating this as anything other than a corrective bounce inside a larger downside count is fighting the tape.
Levels to watch
| Level | Price | Why it matters |
|---|---|---|
| Hard invalidation | $65,474 | Close above this breaks the entire bearish count |
| HTF resistance zone | $64,860–$65,084 | Secondary rejection zone if $63,676 fails to hold |
| Micro ask wall | $63,676 | 15M supply — first rejection trigger |
| B-wave top / trigger zone | $63,717 | Local micro invalidation on the 15M |
| Current price | ≈$63,600 | Sitting right at the pivot |
| Local bounce low | $63,238 | Wave C low on the 1H — the level being tested now |
| Primary downside target | $62,899 / $62,900 | Wave C target from the 1H count |
| Wave 4 low (1H) | $62,275 | Prior structural low, near-target zone |
Setup per the count (not advice)
For traders following the primary count strictly for structure — not as investment advice — the framework is: watch for rejection at $63,676–$63,717, scale into shorts on confirmation, target $62,900 with the $62,275 zone as a stretch objective, and treat any confirmed close above $65,474 as a full stop-out of the bearish thesis. This is a wave-based framework for context, not a signal to trade blindly — position sizing and risk management remain entirely on the individual.
Where every coin sits in its count
Bitcoin isn't trading in isolation, and its wave position matters most as the market's dominant reference structure. Right now BTC sits inside a corrective B-wave/C-wave bounce below a well-defined ceiling — not in a fresh impulsive uptrend. That distinction matters for anyone mapping altcoin structures off BTC's dominance chart, since a failed bounce here typically drags correlated risk assets down with it rather than letting them decouple.
Live spot checks across Binance and TradingView both show price consolidating just under the $63,700 micro-resistance flagged on the 15-minute chart, reinforcing that this is a wait-and-confirm zone rather than a breakout in progress.
Summary
Nothing has changed in two days, and that's the point. The rally from $61,800 to $66,956 broke impulse rules twice, marking it corrective rather than motive. That places Bitcoin inside a larger flat correction where Wave B overshot to roughly 2.12x Wave A before Wave C carved out a low at $63,238 — the exact level price is bouncing from right now.
- Primary bias stays bearish while price trades under $65,474.
- The $63,676 ask wall is the first tell — rejection there times the short.
- Wave C target remains $62,900, with $62,275 as a stretch objective.
- A confirmed close above $65,474 is the only thing that kills this count.
More on Bitcoin: elliott wave · technical analysis
Analysis and education, not investment advice. See our editorial policy.