Daily market analysis
Hype (HYPE) derivatives
Last updated
HYPE Leverage Check: OI Rising, Funding Flat — Who Breaks?
HYPE Sits at $53 — Calm on the Surface, Not Underneath
HYPE is trading at $52.99, open interest is up 3.4% in a day to $2.3 billion, and funding is sitting at almost exactly zero. On paper, that looks like a market catching its breath. It isn't. Underneath the flat funding print, top traders are stacked long at 1.76:1, the broader crowd barely leans long at 1.07:1, and two liquidation pools sit on either side of price pulling in opposite directions.
This is the Liquidity Report, by Finance With FM. We read the leverage on HYPE the way a derivatives desk would — funding, open interest, liquidation clusters, and where the smart money is actually positioned versus where the crowd is guessing. Two liquidation magnets are doing the real work here, and price is threading the needle between them right now.
The Chart: Price vs the Liquidation Magnets
Seven days of HYPE, and it's been a slide with texture. Price opened the window near $60, bled down through the high-$55s and low-$56s by July 28–29, chopped sideways in the mid-$50s through July 30, tried one more push back toward $56 on July 31, and failed — rolling over hard into August and grinding down to where it sits now, $52.99.
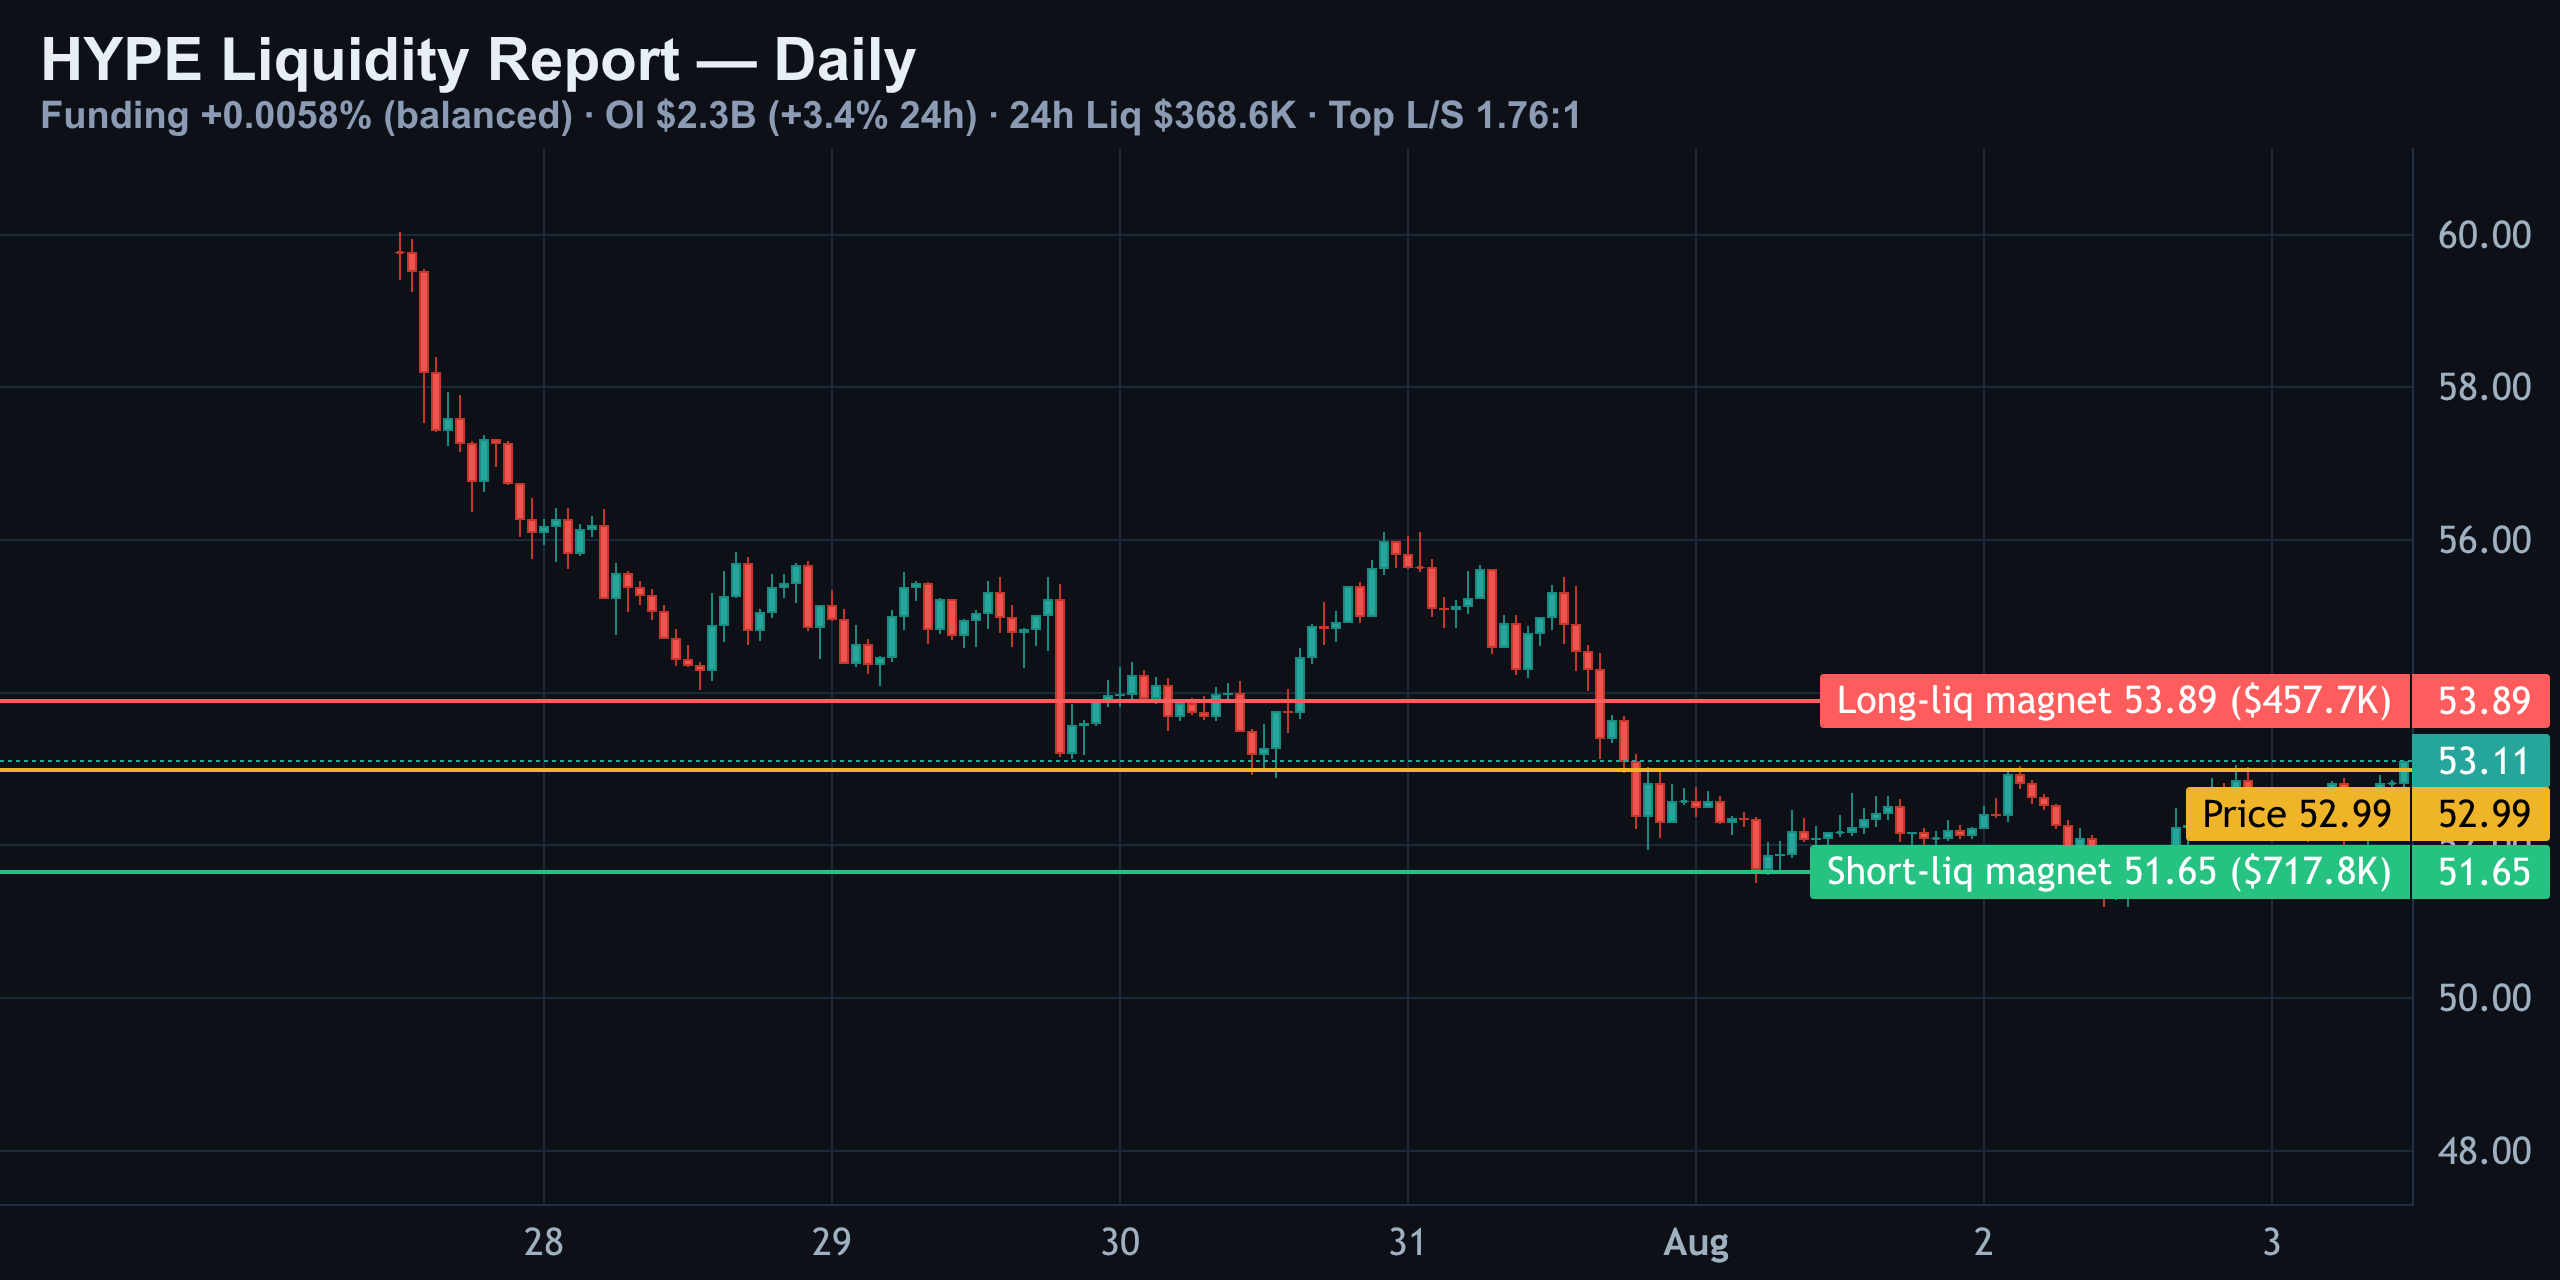
Two horizontal lines matter more than the candles. The red line at $53.89 is the long-liquidation magnet — $457.7K of leveraged longs sitting there, stops that trigger if price pushes up through it. The green line at $51.65 is the short-liquidation magnet — $717.8K of shorts, nearly 60% larger than the pool above. Price is currently threading the needle right between them, with $53.89 the nearest test above and $51.65 the nearest test below.
| Level | Price | Pool Size | What Triggers |
|---|---|---|---|
| Long-liquidation magnet | $53.89 | $457.7K | Forced long exits on a push higher |
| Current price | $52.99 | — | Threading between both pools |
| Short-liquidation magnet | $51.65 | $717.8K | Forced short-covering on a push lower |
That size mismatch matters. A break below $51.65 has nearly 60% more fuel behind it than a break above $53.89 — meaning a dip into the lower pool is statistically more likely to produce a sharp, fast bounce than a push through the upper pool is to produce a runaway breakout.
What the Derivatives Say — Live
The derivatives strip tells you the mood in four numbers. Funding is at +0.0058% per 8 hours — roughly 6.4% annualized — basically flat, meaning no crowd is paying a premium to hold this position either way. Open interest is at $2.3 billion, up 3.4% in the last 24 hours, and it's rising alongside price, not falling — that's fresh capital opening longs, not shorts covering into a squeeze. 24-hour liquidations sit at $368.6K, and the top-trader long/short ratio reads 1.76:1, tilted long.
| Metric | Reading | Signal |
|---|---|---|
| Funding rate (8h) | +0.0058% | Neutral — no crowded side |
| Open interest | $2.3B (+3.4% 24h) | Rising with price — fresh longs |
| 24h liquidations | $368.6K total | Longs took the bigger hit |
| Top-trader L/S ratio | 1.76 : 1 long | Smart money convicted long |
| Broader crowd L/S ratio | 1.07 : 1 long | Retail barely leaning |
| Taker buy volume | 51.8% | Slight buy-side lean |
So the chart is saying: a market that dropped hard, stabilized, and now has new leveraged money quietly rebuilding long exposure — sitting between a smaller long-liq pool above and a bigger short-liq pool below.
Do Funding, OI and Positioning Agree?
Call it a six out of ten — leaning long, not convinced. Funding is neutral, so there's no crowd to squeeze either way — that's the honest starting point. Open interest rising 3.4% alongside price is the strongest bullish tell here: that's fresh longs, not short-covering. Top traders back that up, sitting 1.76:1 long against a crowd that's barely leaning at 1.07:1 — smart money is more convicted than retail right now.
- Bullish: OI rising with price = new longs, not short-covering
- Bullish: Top traders at 1.76:1 long vs a near-flat retail crowd at 1.07:1
- Bullish: Taker buy volume slightly ahead at 51.8%
- Bearish: Longs absorbed $202.7K of the $368.6K in 24h liquidations — nearly double the shorts' $165.8K
- Bearish: Options desk is put-heavy at 1.38, pinning price toward $52
But the 24-hour liquidation split cuts against the bullish story: longs took $202.7K in liquidations versus $165.8K for shorts, meaning some fresh long leverage already got tested and failed. And the options desk is put-heavy at 1.38, pinning toward $52. Bullish lean, thin margin — this isn't a market where you should be leaning hard in either direction.
Reading the Funding and OI Layers Together
Start with funding, because it tells you who's paying to stay in the trade. At +0.0058% per 8 hours — about 6.4% annualized — it's about as neutral as funding gets. Neither longs nor shorts are paying a premium, which means there's no obviously crowded side sitting there waiting to get squeezed on a funding unwind. That's the calm layer.
The leverage layer underneath is doing more work. Open interest is up 3.4% to $2.3 billion over the last 24 hours, and it's rising while price is also higher. That combination — open interest up, price up — is the one that matters most in this framework: it's new longs opening, not shorts covering into a squeeze. Fresh capital is willing to add exposure here, which is the closest thing to a real signal this dataset gives you.
But look at who actually got hurt in the last 24 hours. Liquidations total $368.6K, split $202.7K longs against $165.8K shorts. Longs took the bigger hit. That's not a contradiction of the open interest story — it's the mechanism. Some of the longs that opened into the push toward $56 on July 31 got stopped out on the pullback into August, and new longs opened at the lower price to replace them. Net open interest still grew. That's healthy churn, not necessarily fragility — but it does mean the current long book has a shorter memory than the open interest number alone suggests.
Where the Stops Cluster — and Why the Bigger Pool Wins the Argument
Now the magnets, because they're doing the real pulling. Above, $53.89 holds $457.7K in long liquidations — that's the resistance current longs need to clear, and if it goes, it likely goes fast, since clearing it removes the stop-cluster currently capping price. Below, $51.65 holds $717.8K in short liquidations — a pool far bigger than the one above. If price is pushed down into that zone, it's shorts that get forced out, and forced short-covering tends to produce a sharp, fast bounce rather than a slow grind.
| Scenario | Level | Pool Size | Likely Reaction |
|---|---|---|---|
| Break higher | $53.89 | $457.7K | Fast move on long stops clearing resistance |
| Break lower | $51.65 | $717.8K | Sharp bounce on forced short-covering |
Layer in positioning: top traders sit long at 1.76:1, well ahead of the broader crowd's near-flat 1.07:1. That gap is the tell — position-weighted accounts are more convicted long than the average trader, and when the bigger money leans harder than the crowd, it's usually not noise. Taker flow backs it slightly, with 51.8% of 24-hour volume on the buy side.
What Options & Institutional Flow Say
The options desk isn't reading this the same way the futures crowd is. The put/call ratio sits at 1.38, meaning puts outweigh calls by a meaningful margin, and dealer hedging appears to be pinning price toward the $52 zone into the next expiry. That's a mild counterweight to the top-trader long bias in the futures market — it suggests institutional hedgers are buying protection even while directional futures traders lean long.
- Put/call ratio: 1.38 — put-heavy, hedging demand outweighs call demand
- Dealer hedging pin: roughly $52, close to the current $52.99 print
- Futures top-trader bias: 1.76:1 long — the opposite lean from the options desk
This split between options hedging and futures positioning is exactly why the setup scores a 6 out of 10 rather than higher. Two different corners of the derivatives market are telling two slightly different stories, and until one side gives way, price is likely to keep pinning near current levels rather than trending hard.
Summary — Who Breaks First?
HYPE at $52.99 is sitting in a genuinely balanced spot: flat funding, rising open interest, a top-trader base that's more convicted long than the crowd, but a liquidation tape that's already punished longs more than shorts in the past 24 hours, and an options market hedging toward $52. The larger liquidation pool sits below at $51.65 ($717.8K), the smaller one sits above at $53.89 ($457.7K).
| Factor | Reading | Lean |
|---|---|---|
| Funding | +0.0058% (flat) | Neutral |
| Open interest | $2.3B, +3.4% 24h | Bullish |
| Top traders vs crowd | 1.76:1 vs 1.07:1 | Bullish |
| 24h liquidations | Longs $202.7K vs shorts $165.8K | Bearish |
| Options put/call | 1.38, pin ~$52 | Bearish |
Given the size mismatch in the liquidation pools, a move down toward $51.65 has more fuel behind a bounce than a move up toward $53.89 has behind a breakout — but the fresh long positioning and top-trader conviction mean dips are likely to get bought rather than sold aggressively. This is a lean, not a certainty. Watch $53.89 and $51.65 — whichever pool gets tested first tells you who breaks.
More on Hype: derivatives · technical analysis
Analysis and education, not investment advice. See our editorial policy.