
Analysis
NVDA at the Gamma Wall: Breakout or Pin to $230?
The Setup: Nvidia Presses Into the $230 Wall
Nvidia closed recent sessions in the $225–$227 zone, trading at $226.66 on the last full session before pulling back slightly to around $224–$225 in the following days. That puts price squarely inside one of the more interesting setups on the tape right now: a bullish trend structure running headfirst into a wall of dealer call gamma sitting at $230.
This isn't a random ceiling. It's a mechanical one. Options dealers who sold calls at the $230 strike now have to hedge that exposure, and the way they hedge tends to suppress volatility and cap rallies right at the strike — at least until enough buying pressure forces a break. That's the tension defining Nvidia's chart today: strong trend, strong momentum, but a very specific price magnet just overhead.
Daily Structure: Climbing Back Into Resistance
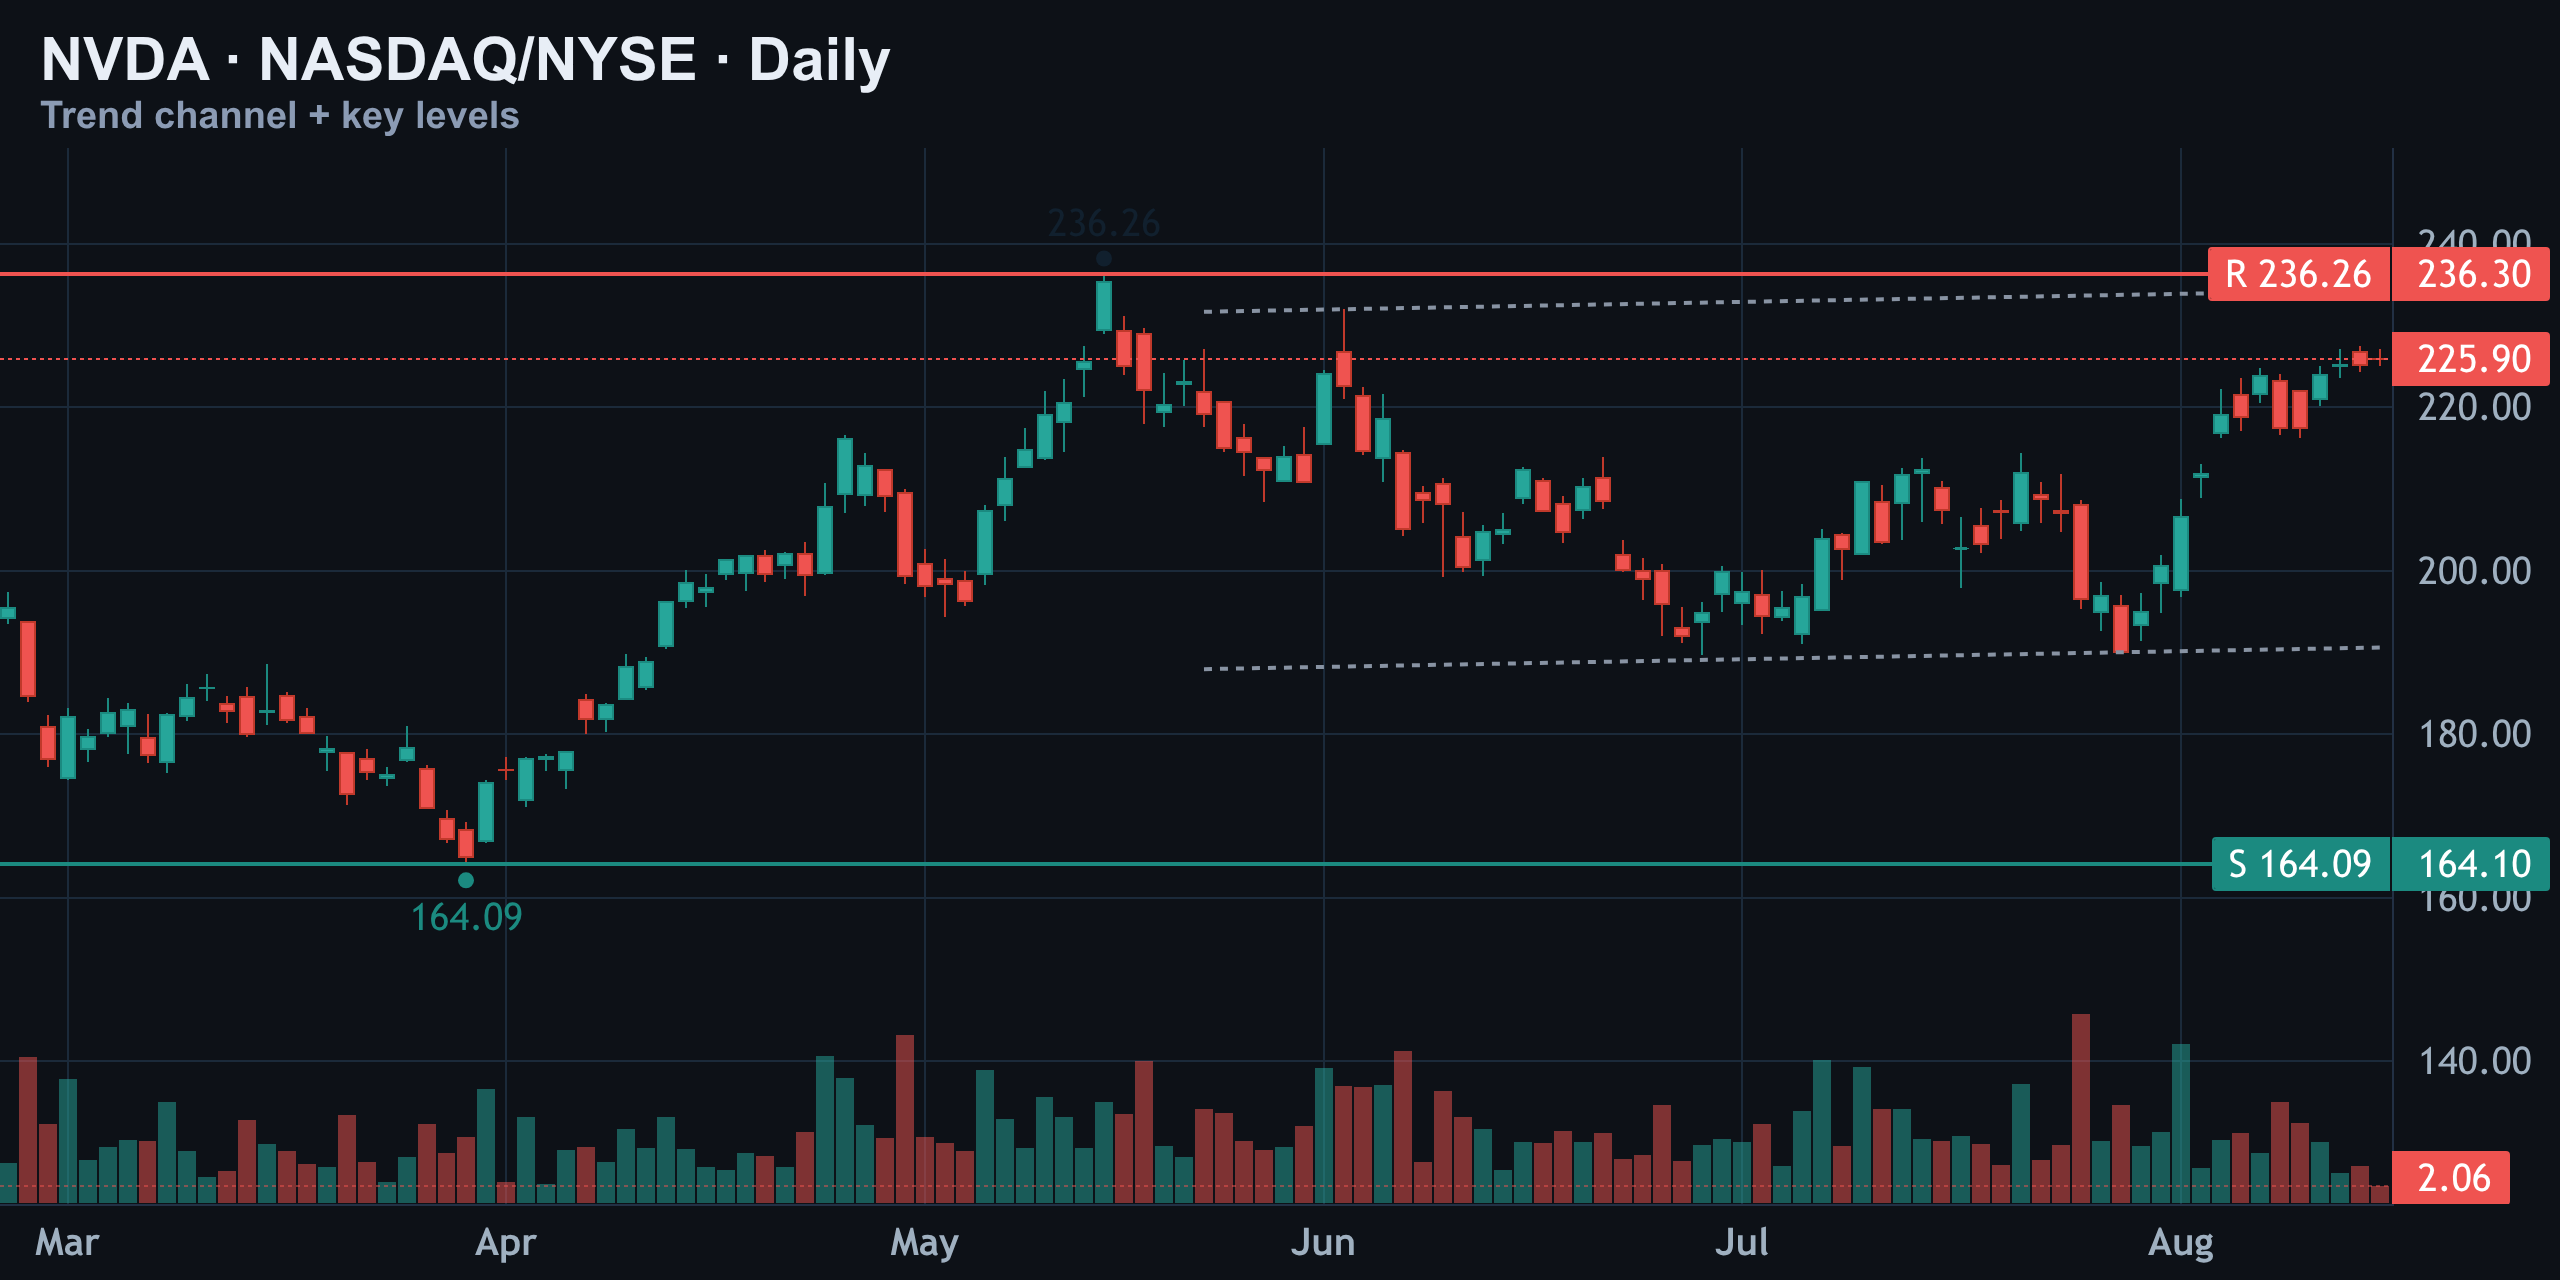
Zoom out to the daily chart and the story is straightforward. Nvidia bottomed near $164.09 in April, then carved a clean uptrend of higher highs and higher lows that eventually tagged a high of $236.26 before pulling back. Price has since recovered and is now retesting that prior resistance shelf around $226, still inside the rising channel that's defined the entire move.
- Structure: higher highs, higher lows — intact
- April low: $164.09 (key structural support)
- Recent swing high: $236.26
- Current retest zone: ~$226, inside the rising channel
Support is building near $190, which lines up with a prior consolidation shelf. As long as Nvidia holds above that zone, the daily trend stays constructive — this is a pullback-and-retest pattern, not a breakdown.
1-Hour Structure: The Short-Term Channel Test
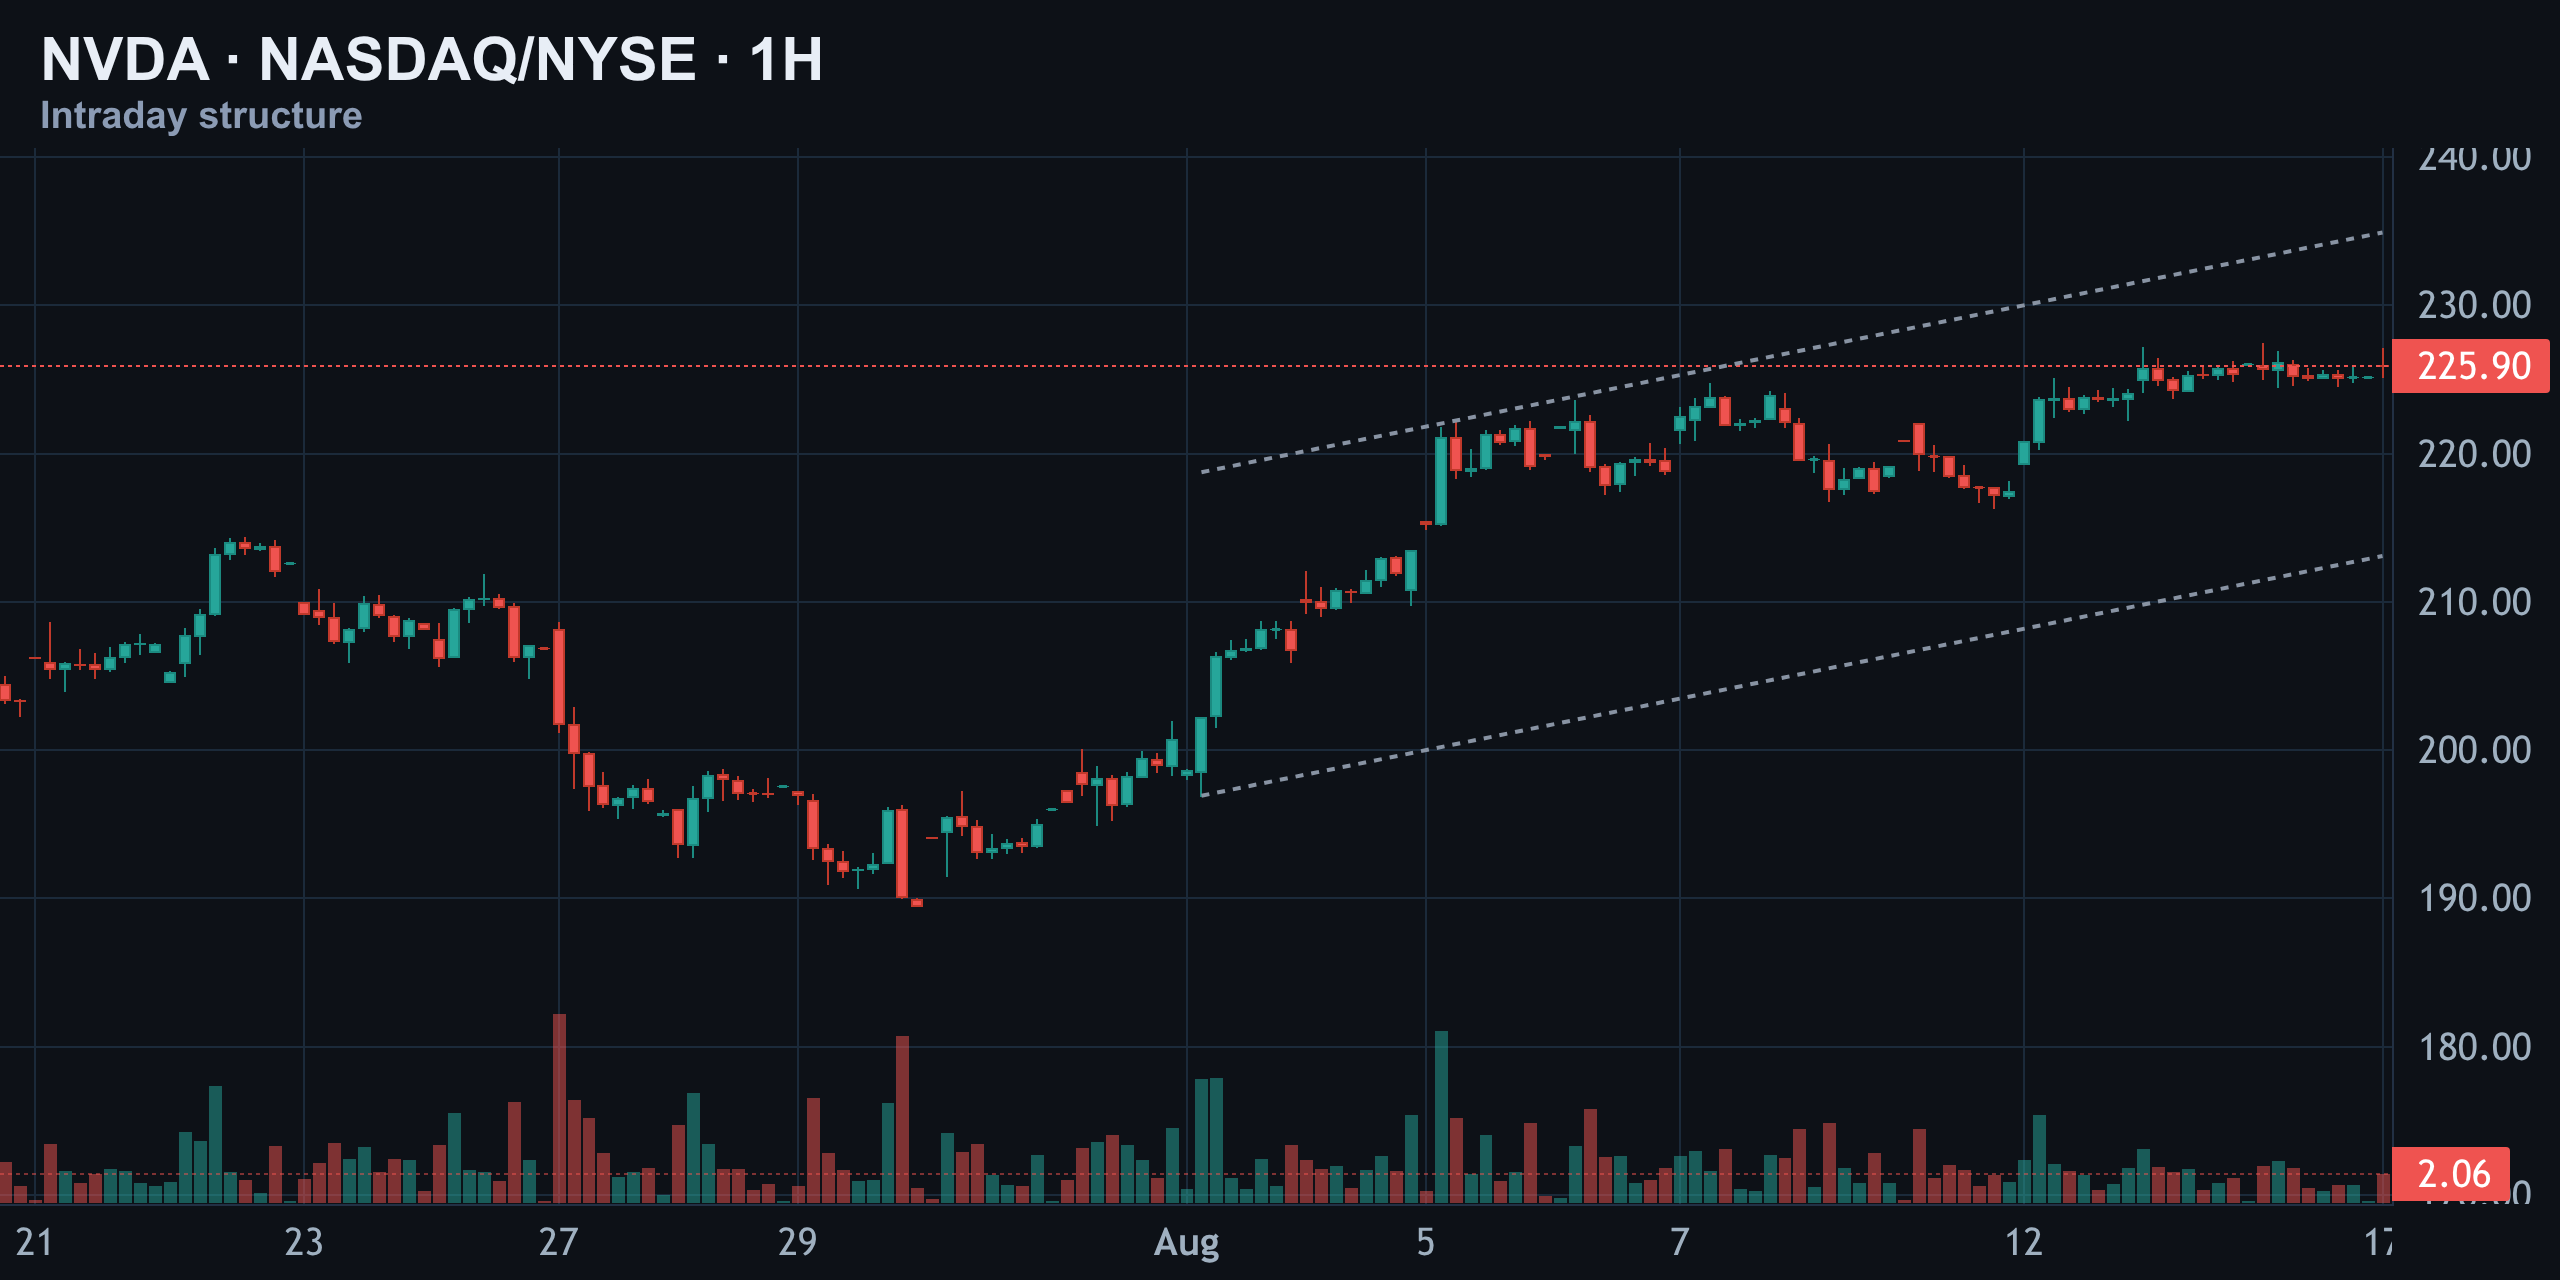
Drop down to the hourly chart and the picture sharpens further. Nvidia carved a clean higher low near $189 in late July, then built a steady ascending channel that's carried price all the way back to current levels near $226. Price is now testing the top rail of that short-term channel.
That's a classic decision point. A clean break and hold above the channel top usually signals continuation and an attempt at the $230 gamma wall. A rejection here, on the other hand, often means a pause or shallow pullback inside the channel before the next attempt — not necessarily a reversal, just digestion.
Weekly View & Elliott Wave: Impulse or Corrective C?
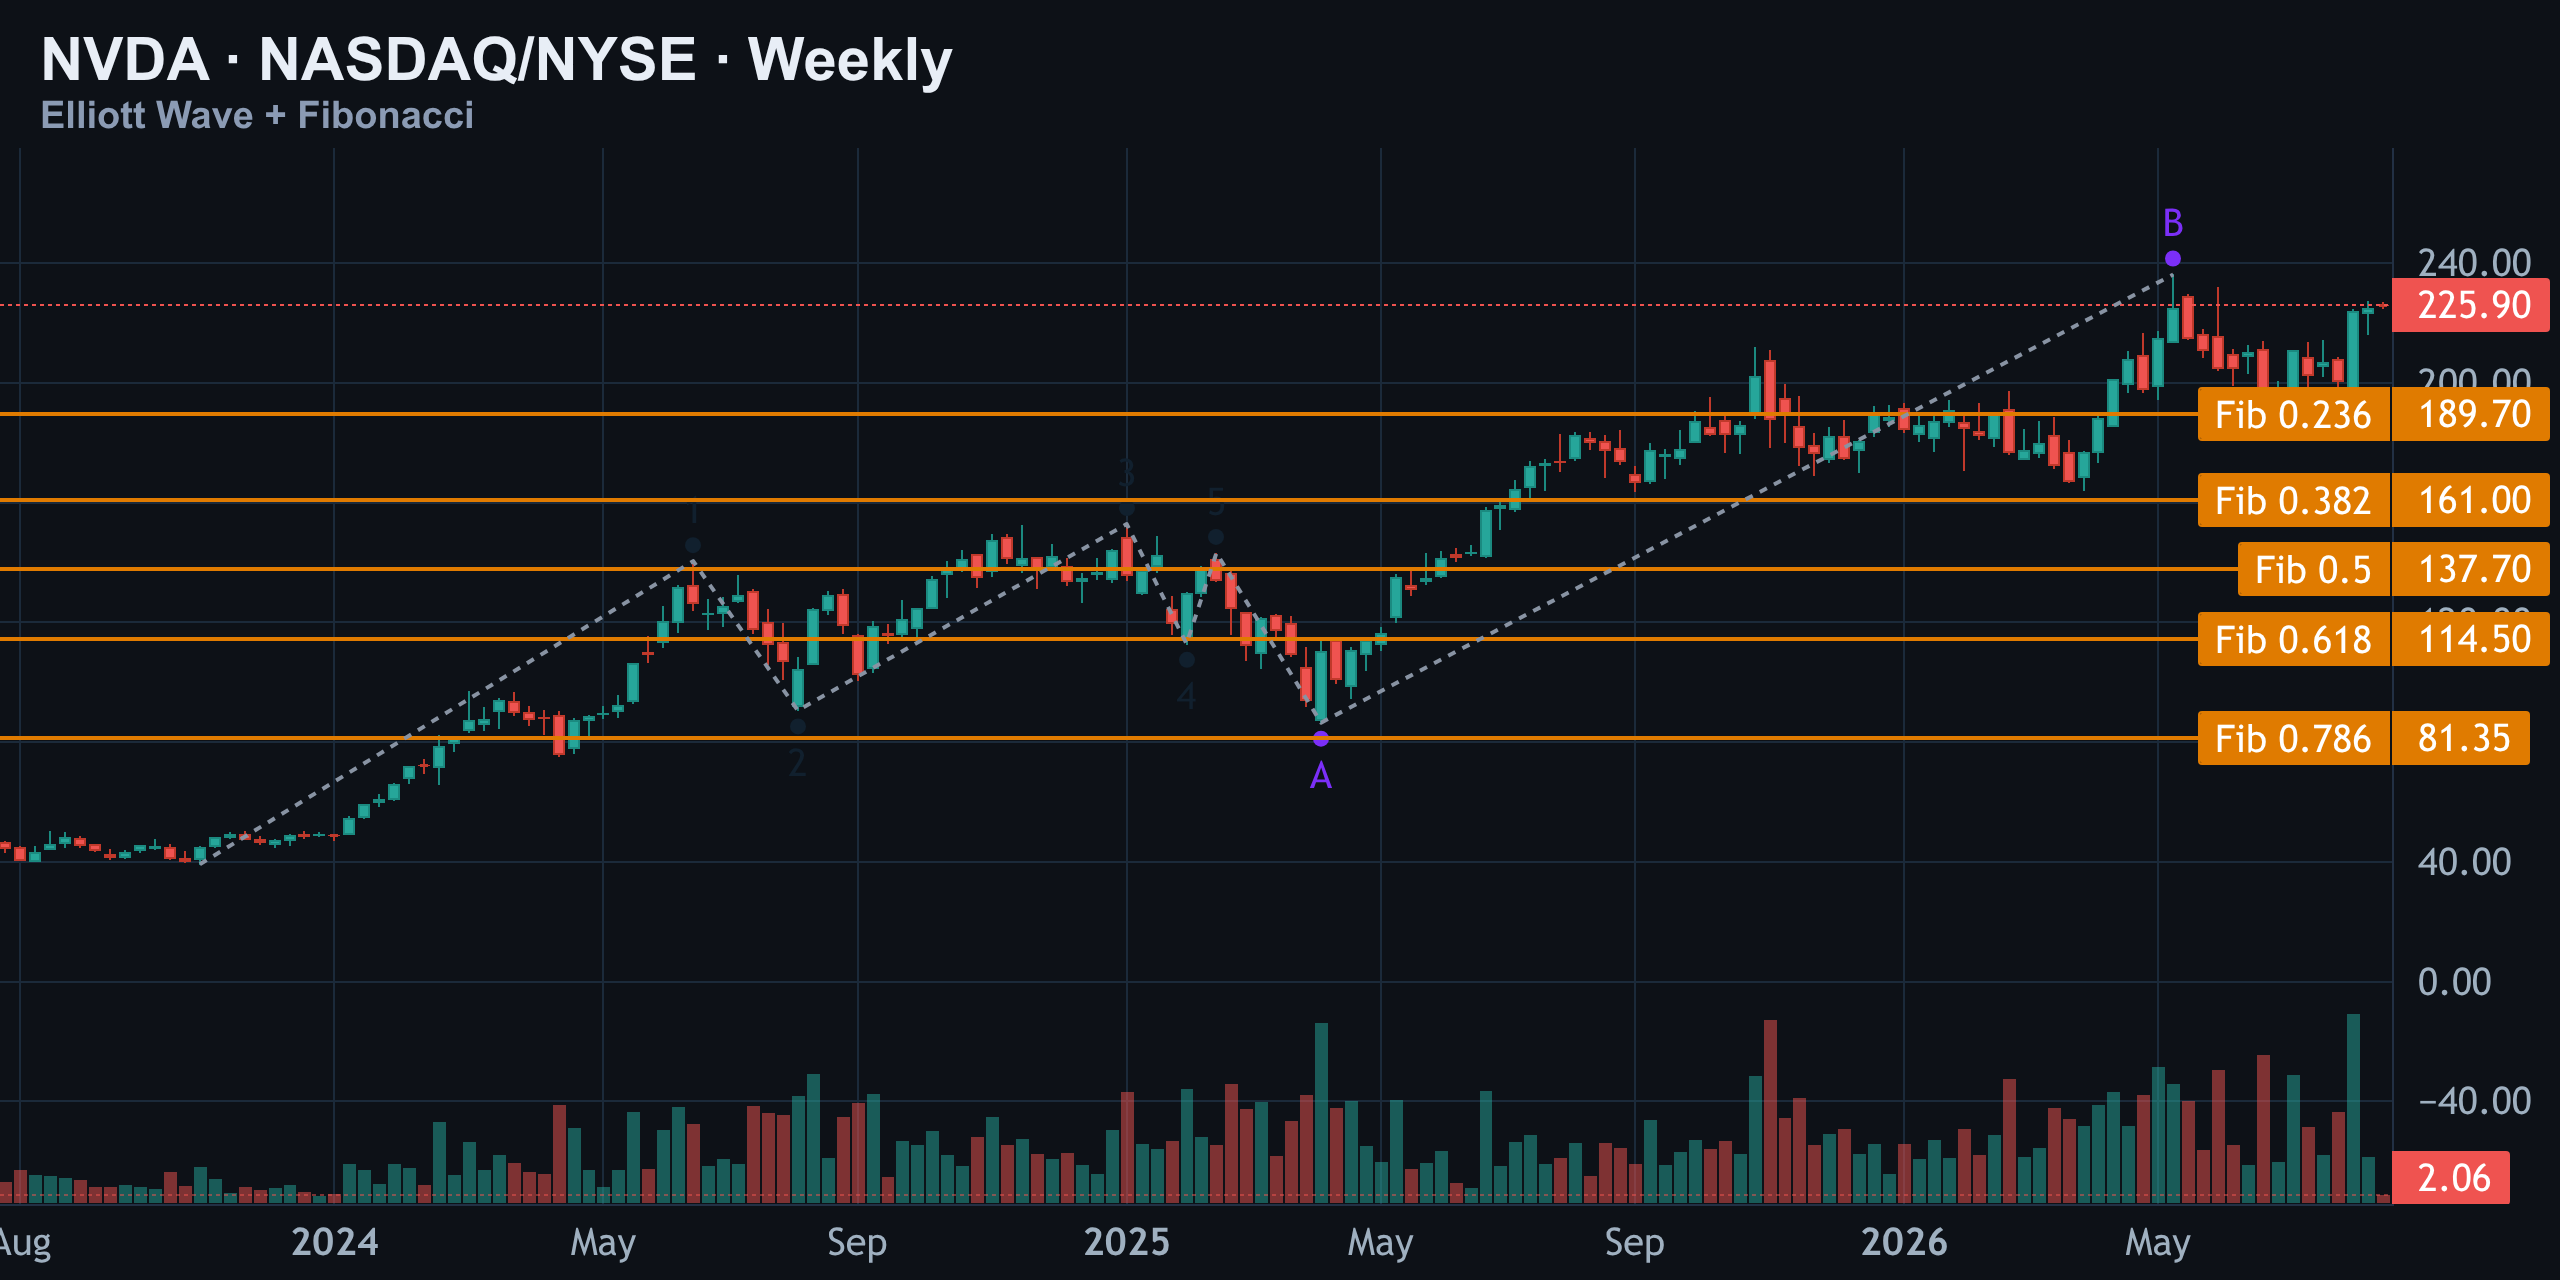
The weekly chart is where the bigger question lives. The primary count shows a completed five-wave advance from the 2023 lows, with Wave 1 near $140 and change and Wave 5 topping near $143 (relative to the larger degree count), followed by an A-B-C correction that bottomed near $86.50.
Point B at $236 marks the recent swing high — and that's the crux of the debate. Two scenarios are live right now:
- Bullish scenario: the A-B-C correction has completed, and Nvidia is now starting a fresh impulsive wave higher, with the current consolidation under $230–236 being the launch pad.
- Corrective scenario: Point B was simply the top of a corrective bounce, and price is now tracing Wave C of a larger correction — meaning the move toward $230 is a trap before a deeper pullback, potentially toward $190 or lower.
Neither count is confirmed yet. The tell will come from how price behaves at the $230–$236 zone: a decisive breakout with follow-through favors the impulsive-wave read; a sharp rejection and breakdown below the hourly channel favors the corrective count.
Momentum Check: Moving Averages, RSI & MACD
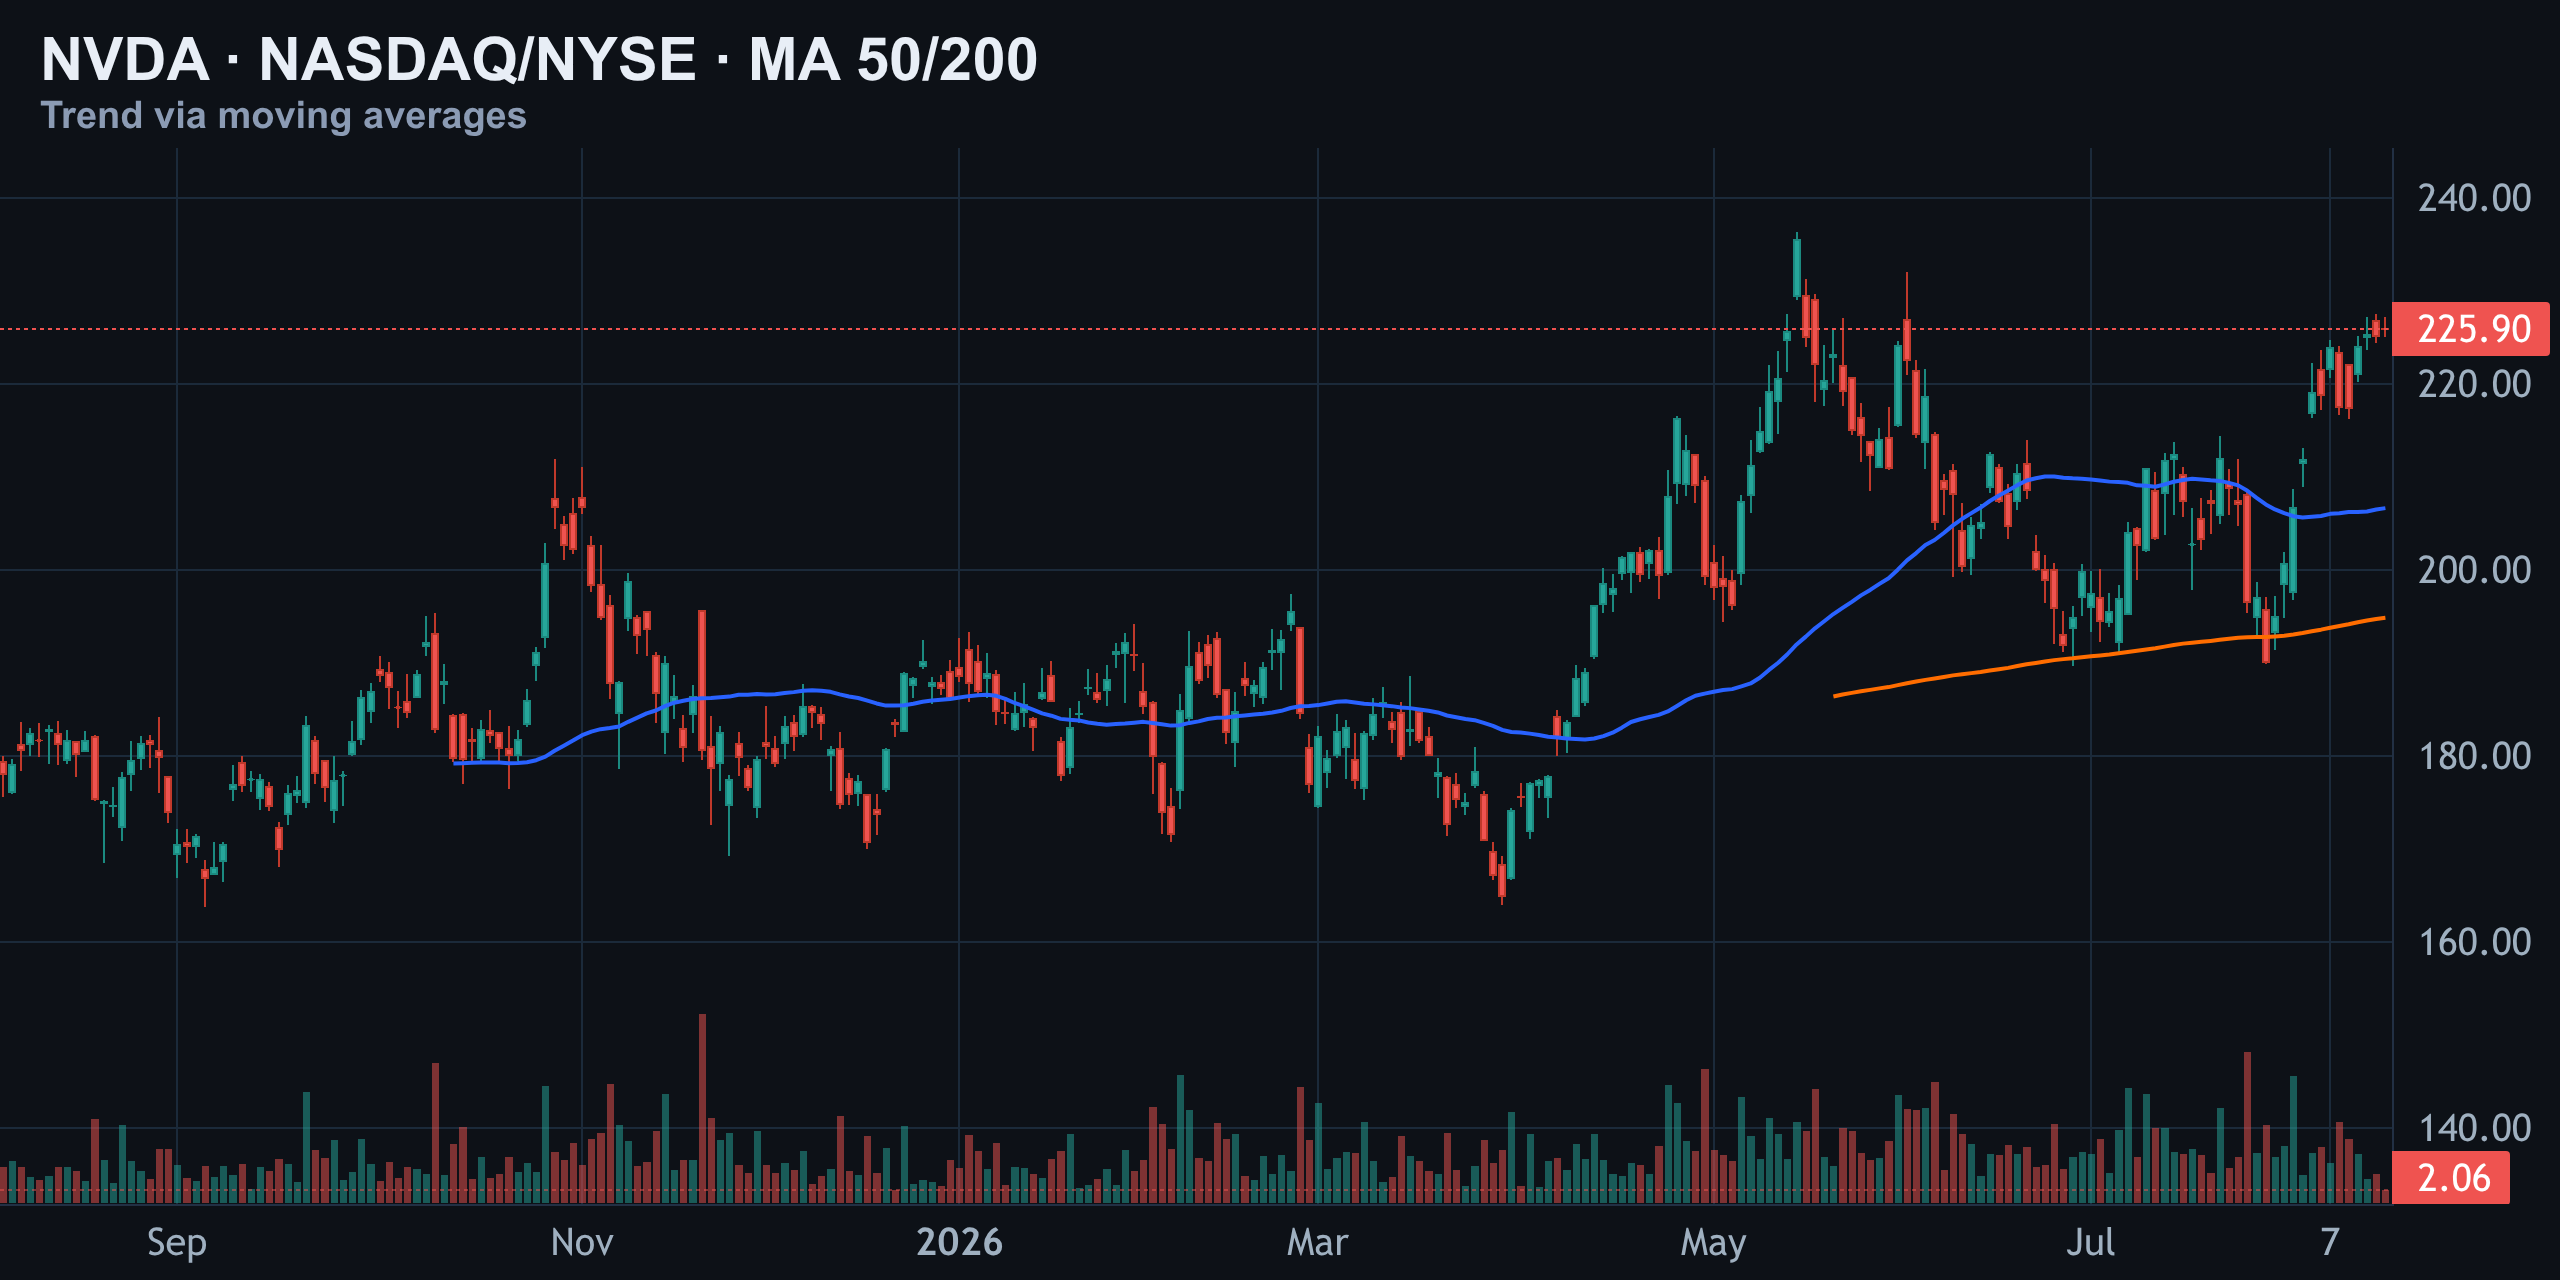
Price at $225.90 sits comfortably above both the 50-day MA at $206.64 and the 200-day MA at $194.87. Being above both major moving averages is the textbook definition of an intact bullish trend, and it's consistent with where the stock has actually traded in recent sessions around $224–$227.
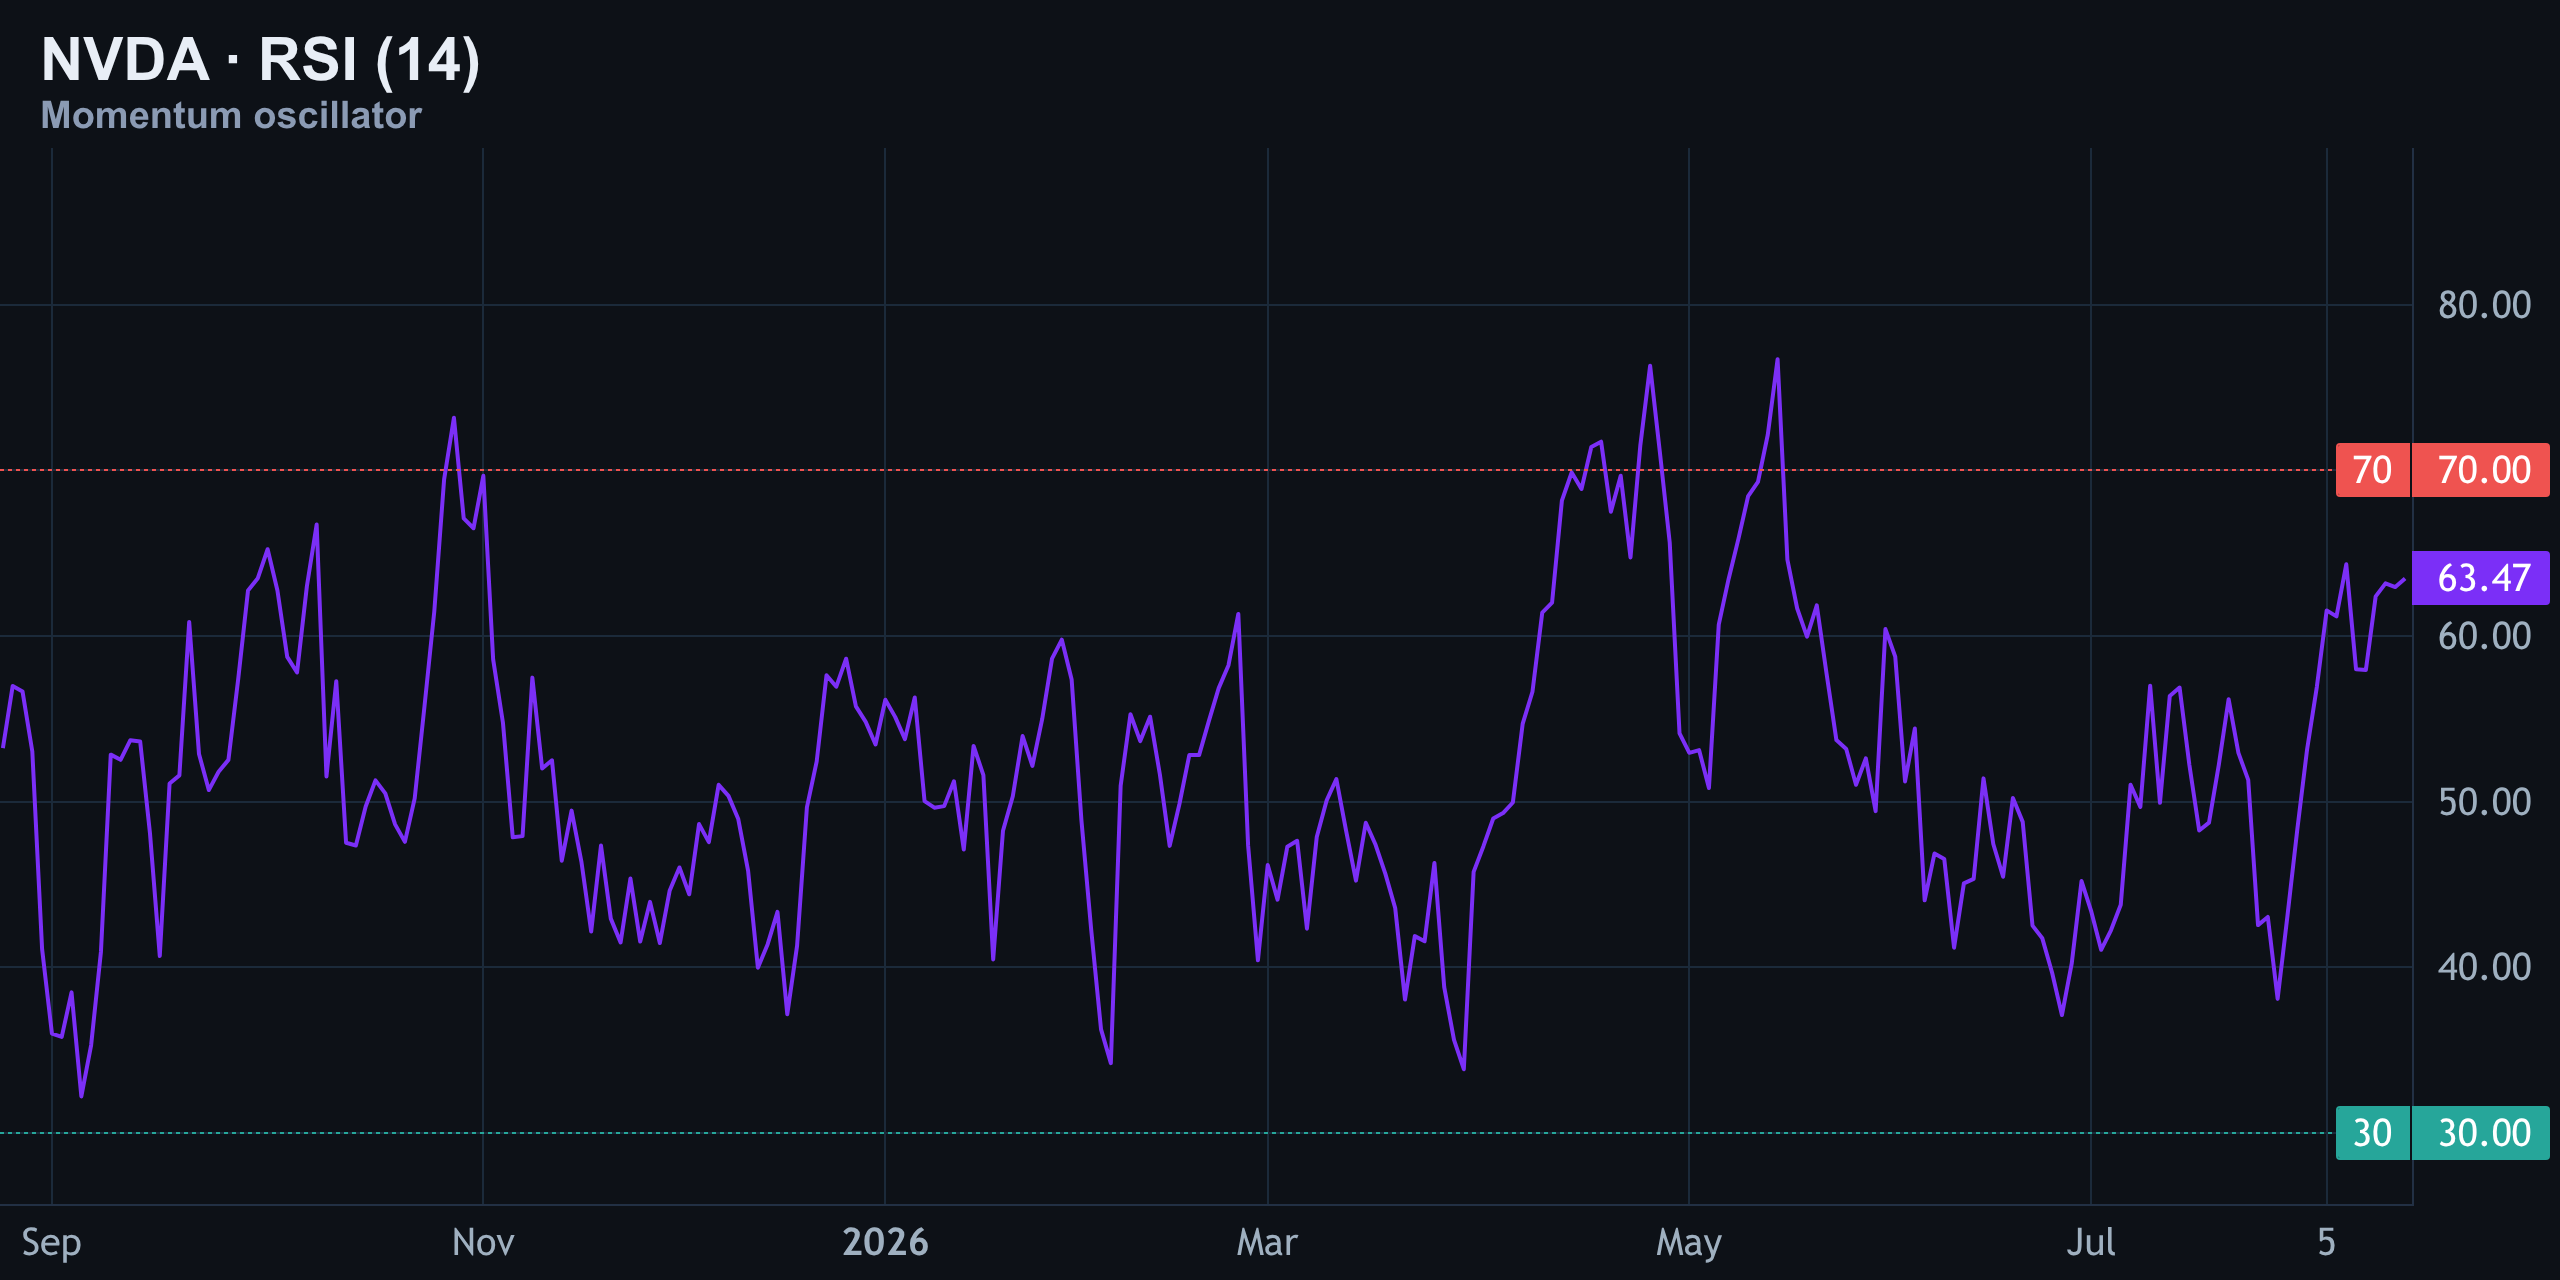
RSI(14) reads 63 — firmly in bullish territory but nowhere near the overbought extreme (typically 70+) that would flag exhaustion risk. That gives the rally room to run without immediately screaming "stretched."
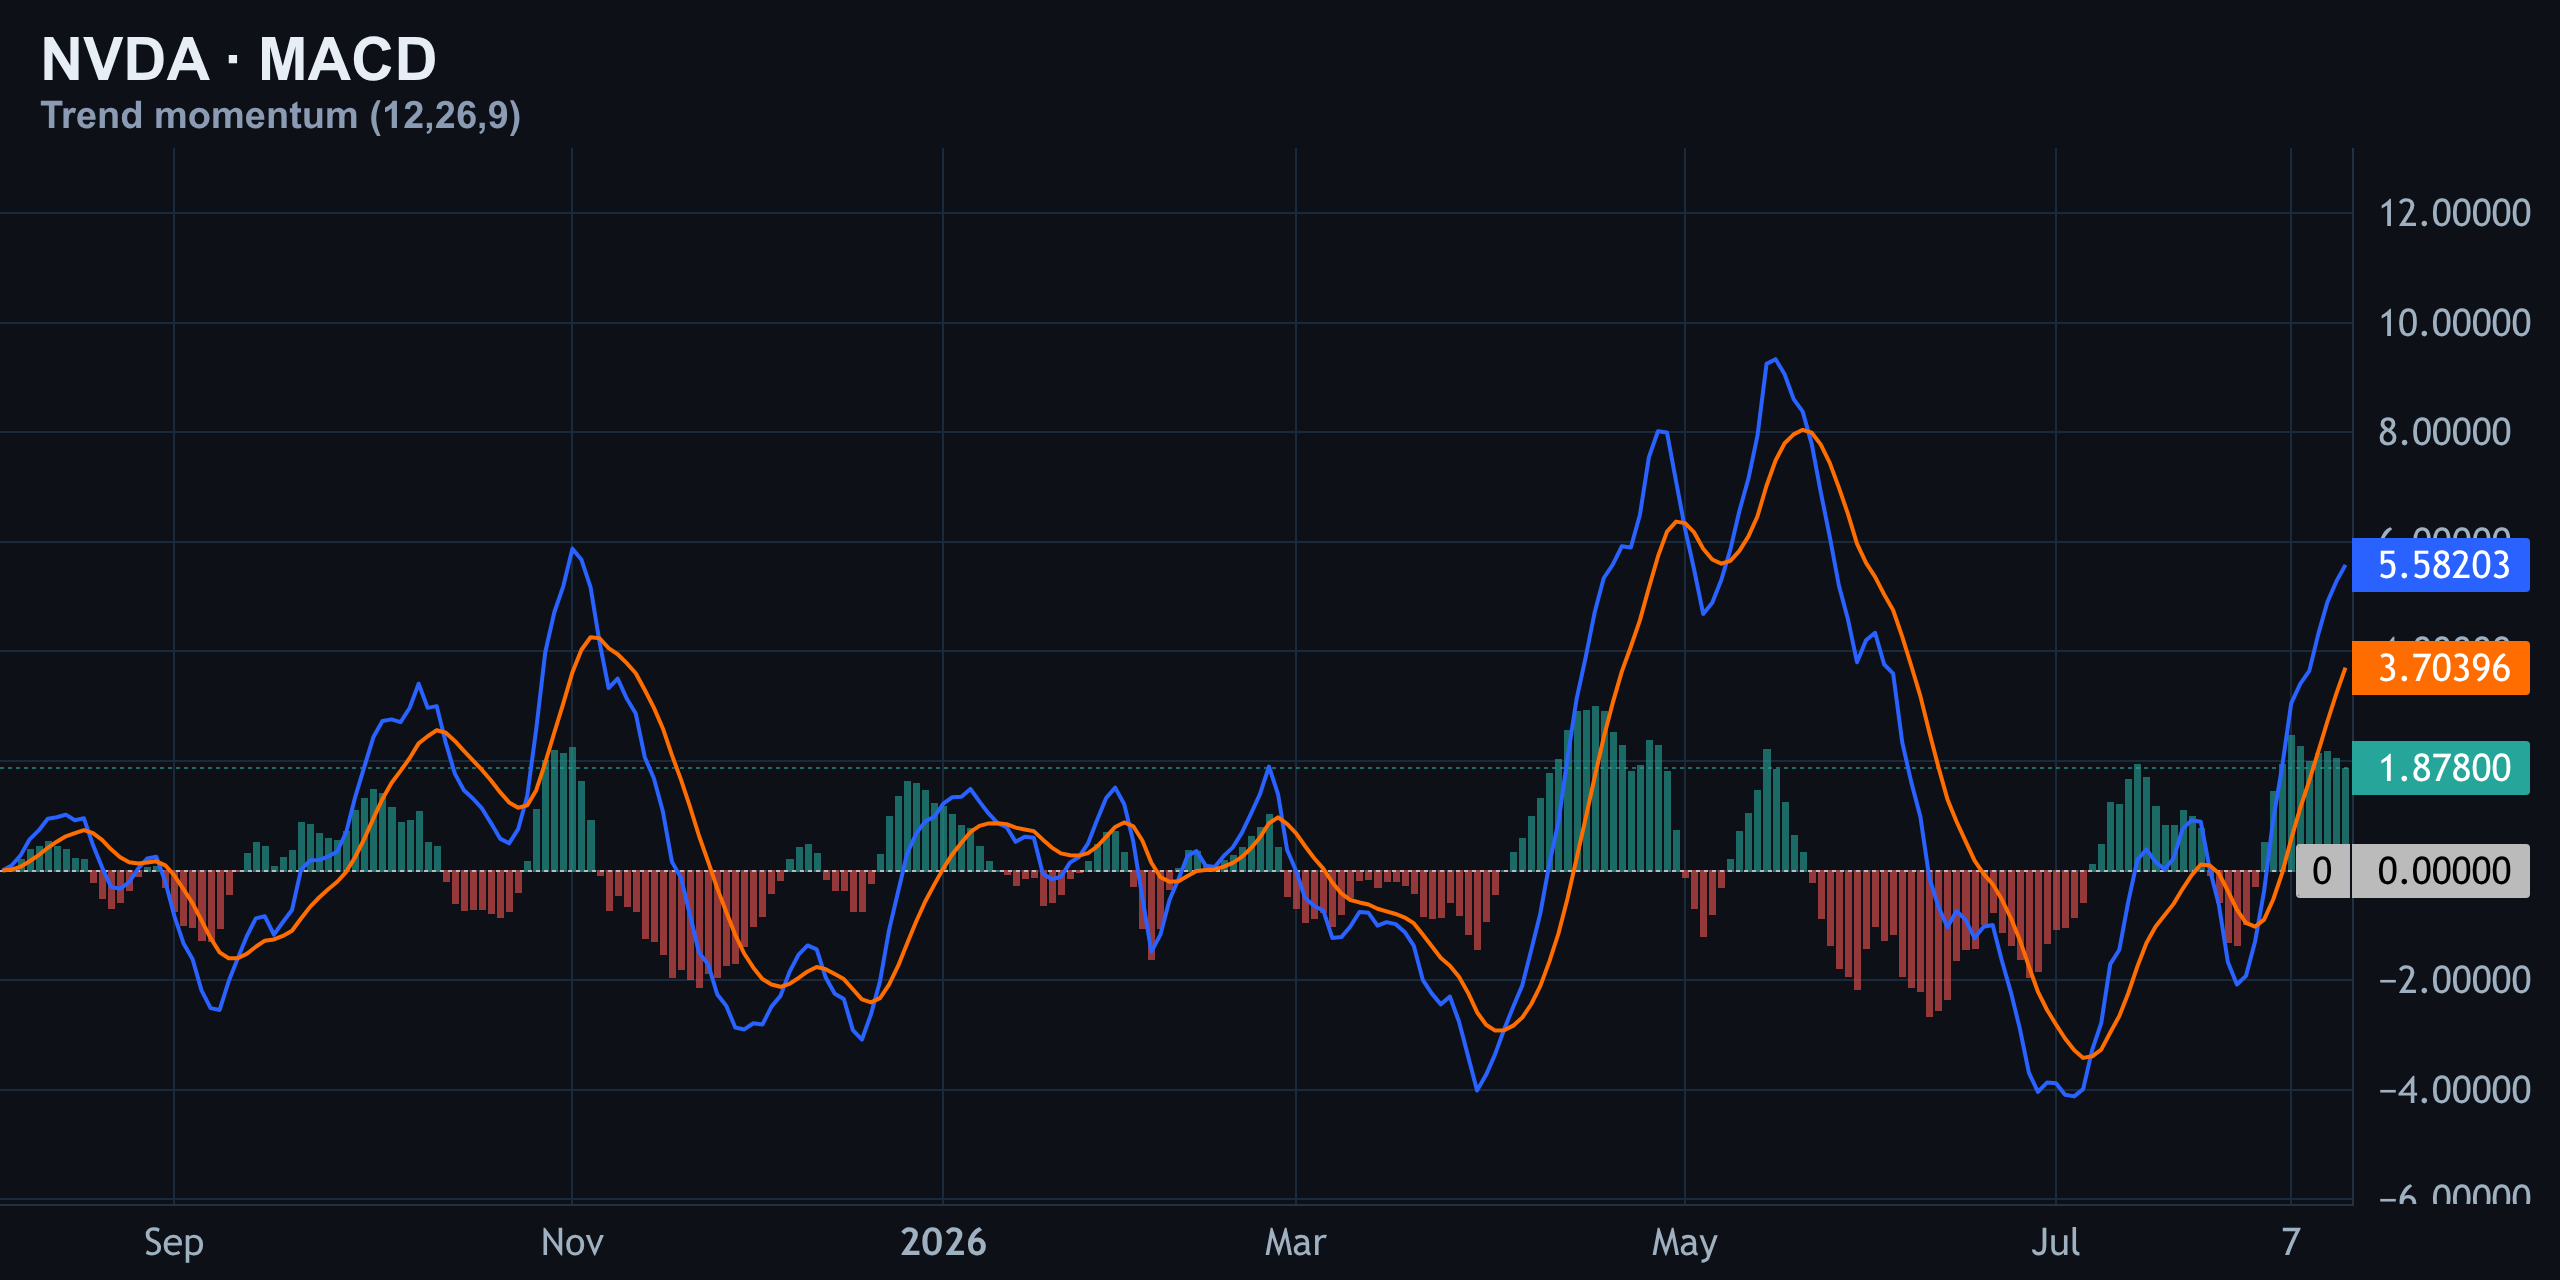
MACD confirms the same story: the MACD line sits above the signal line, and the histogram is positive, meaning momentum is still favoring buyers rather than fading. Taken together — price above both MAs, RSI at 63, MACD positive — every mainstream momentum tool agrees: this is a bull trend consolidating, not breaking down.
| Indicator | Reading | Signal |
|---|---|---|
| Price vs 50-day MA | $225.90 vs $206.64 | Bullish |
| Price vs 200-day MA | $225.90 vs $194.87 | Bullish |
| RSI (14) | 63 | Neutral-bullish |
| MACD | Above signal, histogram positive | Bullish momentum |
The Institutional Edge: Reading the Gamma Wall
This is the part retail traders usually skip — and it's arguably the most important piece right now. Options dealers currently hold positive gamma of roughly $1.94 billion per 1% move in Nvidia. When dealer gamma is positive and large, dealers hedge by selling into rallies and buying into dips, which mechanically compresses volatility and tends to pin price near major strikes.
The zero gamma flip sits at $220 — a pivot level. Above it, dealer hedging flows lean toward suppressing moves (selling rallies, buying dips), reinforcing a pinning dynamic. Below it, that dynamic can flip and amplify moves in either direction, which is why a drop back under $220 matters more than it might look on a normal chart.
Layer on the specific strikes: the heaviest call gamma sits at $230, acting as a magnet-turned-ceiling, while put gamma at $205 offers a nearby floor. The options market is pricing an expected move of about 1.3% into the next expiry via the straddle, and volatility is backwardated — near-term implied vol is elevated relative to longer-dated vol, a signature of short-term stress or an anticipated catalyst.
Levels to Watch
Here's the full level map, combining chart structure with the options-derived gamma levels, so you can track this setup without needing the terminal open all day.
| Level | Price | Why It Matters |
|---|---|---|
| Major resistance (swing high / Point B) | $236.26 | Prior high and weekly Elliott Wave B point |
| Gamma wall (call resistance) | $230 | Heaviest dealer call gamma — likely pin/ceiling |
| Zero gamma flip | $220 | Pivot between pinning and volatility-amplifying regimes |
| Current price | $225.90 | Consolidating just under the wall |
| Put gamma floor | $205 | Nearby dealer-driven support |
| Chart support (rising channel base) | ~$190 | Structural support building on daily chart |
| Key structural support | $164.09 | April swing low; trend invalidation zone |
The tightest, most actionable range for the next few sessions is $220 to $230 — lose the flip and dealer hedging can accelerate downside; clear the wall with volume and the path opens toward $236 and beyond.
The Takeaway
Nvidia remains technically bullish by every conventional measure — trend, moving averages, RSI, and MACD all agree. But the stock is currently trading inside a mechanical bottleneck created by options positioning, not sentiment. That's the nuance headlines miss: this isn't just "NVDA is strong" or "NVDA is overbought." It's a strong stock sitting exactly where dealers are financially incentivized to slow it down.
- Bullish case: clean break above $230 on volume, confirming the fresh-impulsive-wave count and opening a path toward $236 and new highs.
- Pin/consolidation case: price oscillates between $220–$230 as dealers hedge, chopping traders on both sides until the wall resolves.
- Bearish case: a break below $220 (the flip) and then $205 would favor the corrective Wave C count, with $190 and eventually $164 back in play.
Whichever way it resolves, the $230 level is the level that matters most over the next few sessions. Trade the level, not the narrative.
Key takeaways
- NVDA trades near $226, above both its 50-day ($206.64) and 200-day ($194.87) moving averages — trend remains bullish.
- Dealer positioning shows $1.94B in positive gamma per 1% move, with the heaviest call gamma capping price at $230 and the zero-gamma flip at $220 acting as the key pivot.
- Weekly Elliott Wave count is split between a fresh impulsive wave higher or a corrective Wave C — resolution likely hinges on how price handles $230–$236.
- RSI at 63 and a positive MACD histogram confirm momentum still favors buyers, without flashing overbought risk.
- The tightest actionable range for now is $220–$230; a clean break above the wall opens $236, a break below the flip risks a slide toward $205 and $190.
Frequently asked questions
What is a gamma wall and why does it matter for NVDA?
A gamma wall is a price level where options dealers hold heavy call gamma exposure — for NVDA that's $230. Dealers hedge by selling into rallies near that strike, which tends to cap or 'pin' price until buying pressure overwhelms the hedging flow.
Is NVDA bullish or bearish right now?
Structurally bullish: price sits above the 50-day and 200-day moving averages, MACD is positive, and RSI is 63. The near-term question isn't trend direction, it's whether dealer positioning at $230 delays the next leg higher.
What is the zero gamma flip level for NVDA?
Around $220. Above it, dealer hedging tends to suppress volatility (pinning price); below it, hedging flows can amplify moves in either direction, making it an important line for risk management.
What's the Elliott Wave outlook for NVDA?
The weekly count shows a completed five-wave advance followed by an A-B-C correction, with Point B at $236. Price is now consolidating just under that level, which could mark either the start of a fresh impulsive wave or Wave C of a larger correction still unfolding.
What are the key support and resistance levels to watch on NVDA?
Resistance sits at $230 (gamma wall) and $236.26 (prior swing high). Support sits at $220 (gamma flip), $205 (put gamma floor), ~$190 (chart support), and $164.09 (major structural support from the April low).