
Analysis
NVDA at $220: Bull Flag Breakout or Wave 5 Exhaustion?
Nvidia's Decision Point: $220 and the Max Pain Magnet
Nvidia just kissed its all-time high near $236.26 and is now coiling right at the options market's max pain zone. Is this the calm before a breakout past $236, or a trap before a slide back toward support? We've got Elliott Wave structure, options positioning, and three separate timeframes all lining up at the same decision point — so let's break it down layer by layer.
The short version: NVDA remains structurally bullish. Price is trading above both its 50-day and 200-day moving averages, RSI and MACD both lean constructive, and the ascending channel that's carried the stock since April is still intact. But the stock is also parked almost exactly at the price where option dealers have the least incentive to let it move — which is exactly why the next few sessions matter.
Daily Structure: The Ascending Channel Still Holds
On the daily chart, Nvidia carved out a clean ascending channel after bottoming near $164 in early April. From there, price rallied in a steady, orderly climb into a high of $236.26, pulled back, and is now pressing against resistance again near $220.
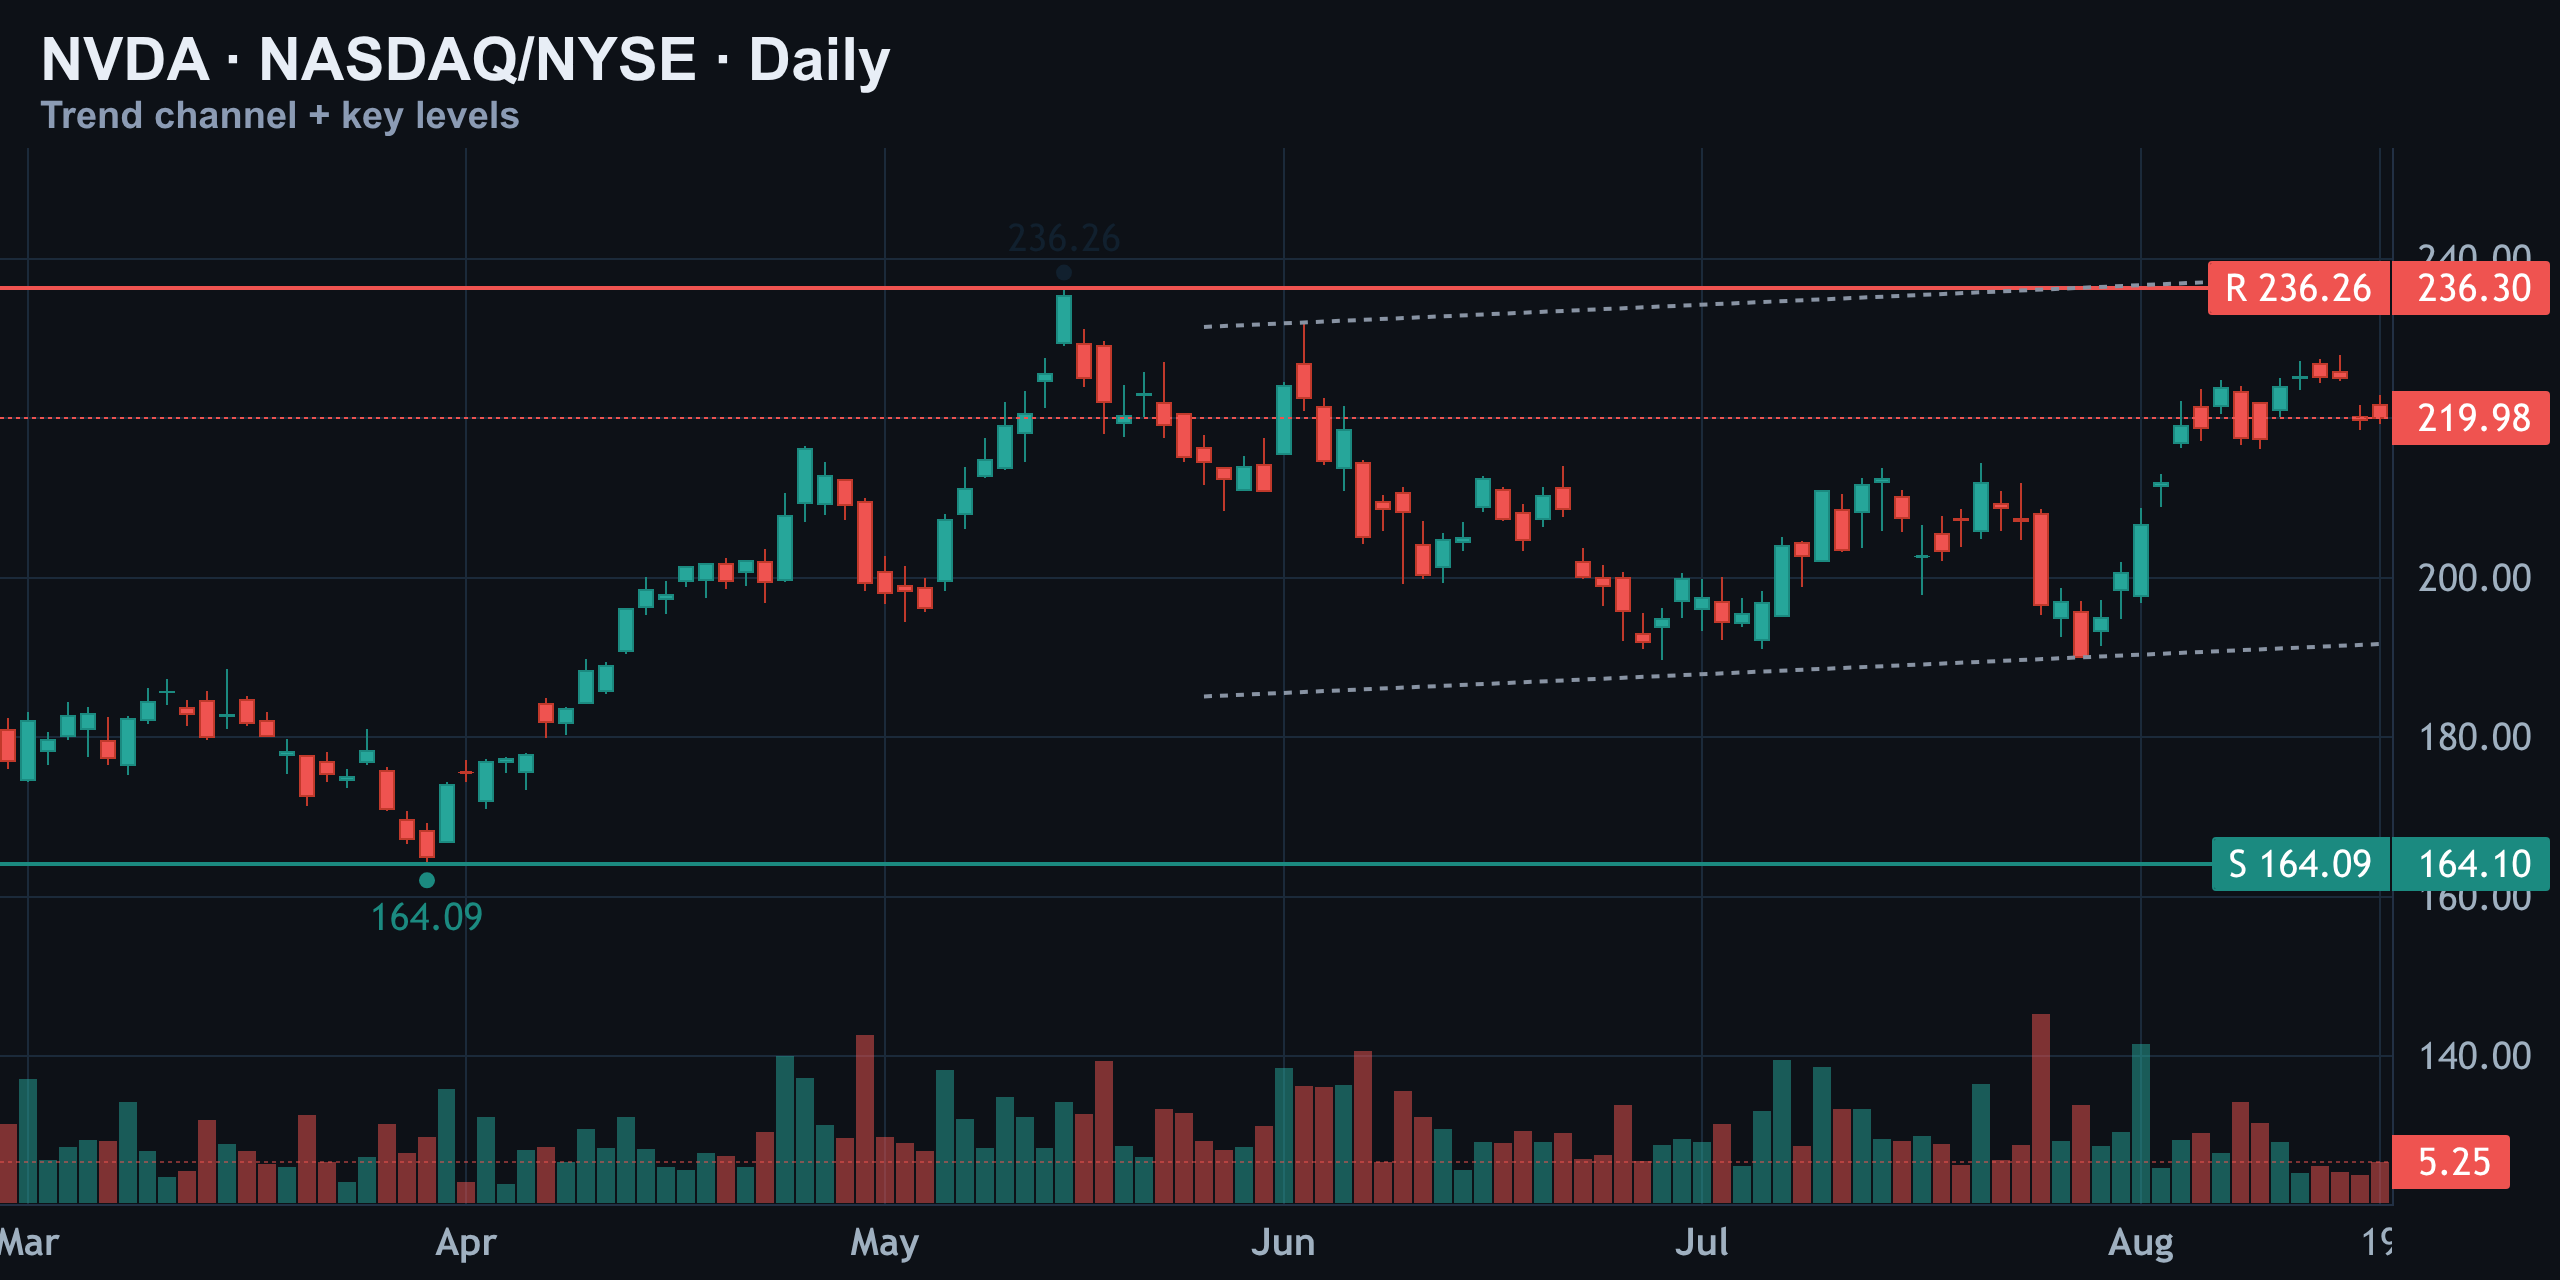
What stands out is the volume profile. Throughout the entire climb, volume has stayed moderate rather than explosive — a pattern more consistent with steady accumulation than with panic buying or a blow-off top. That's a meaningful distinction: exhaustion tops are usually accompanied by a volume spike as late buyers pile in. So far, that spike hasn't shown up.
1-Hour Structure: The Coil Beneath $220
Zooming into the hourly chart sharpens the picture. The move off the late-July low near $189 has unfolded in a tight rising channel — controlled, not chaotic. Price broke above $210 in early August and has spent the last two weeks consolidating just under $220.
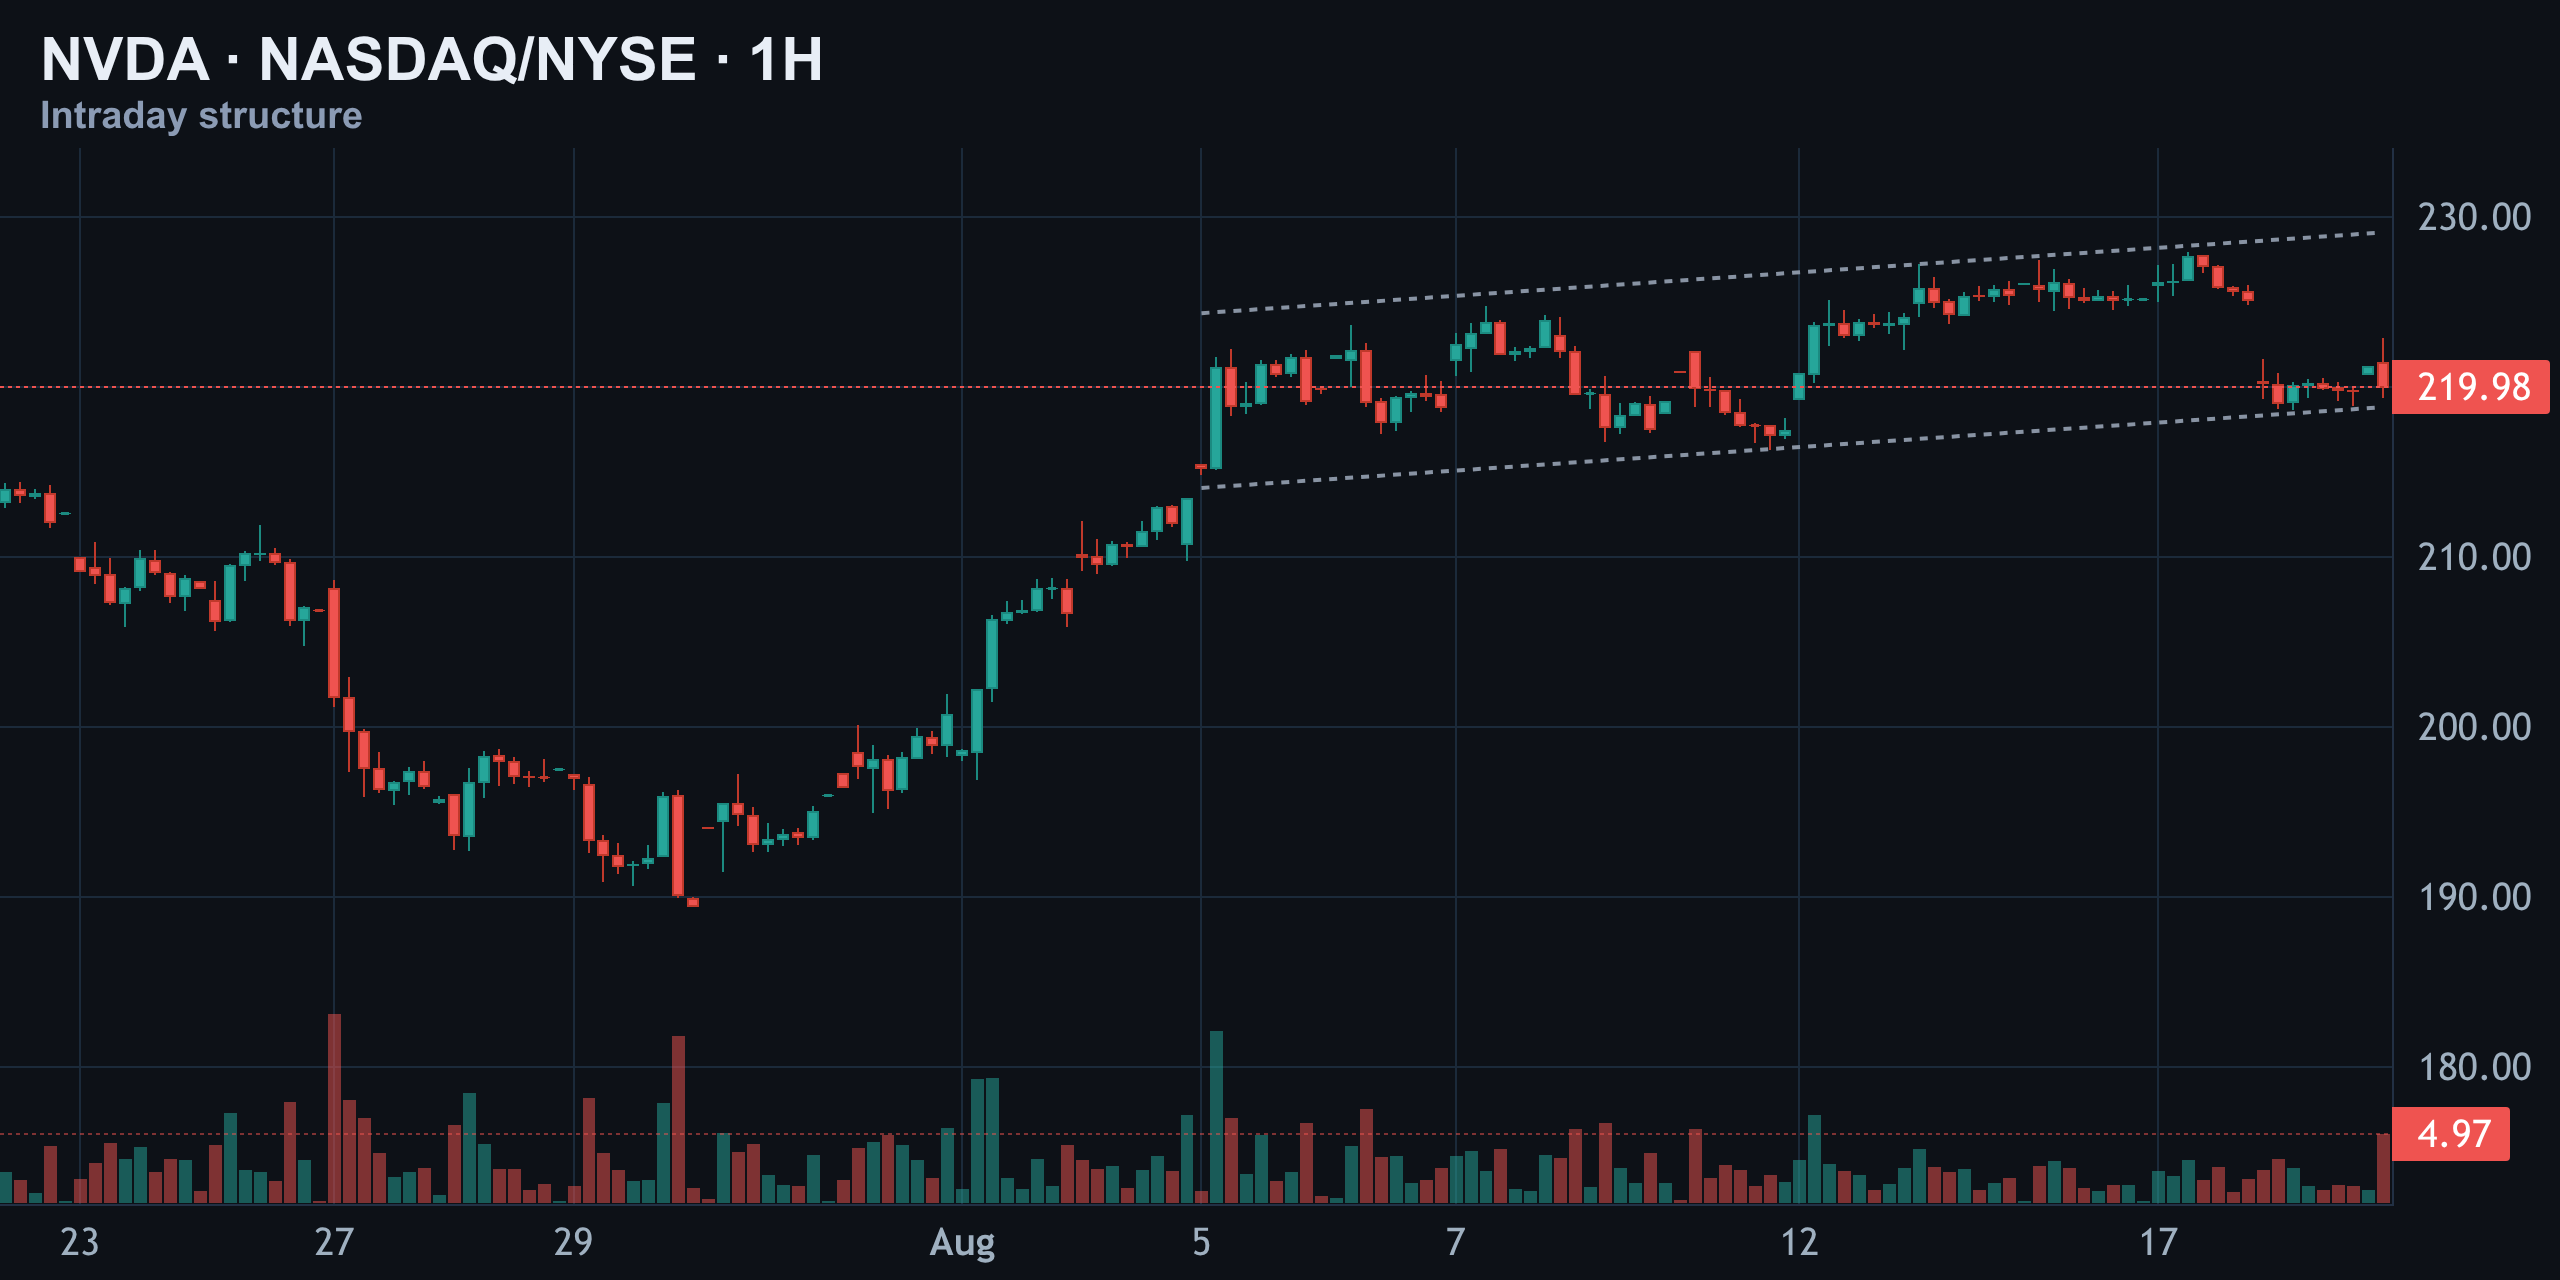
That sideways chop right at $219.98 looks a lot more like a pause than a reversal. Tight, low-range consolidation directly beneath a prior resistance level is a classic bull flag signature — the kind of pattern that typically resolves in the direction of the preceding trend, which in this case is up.
Weekly Chart & Elliott Wave: Bull Flag or Wave C in Progress?
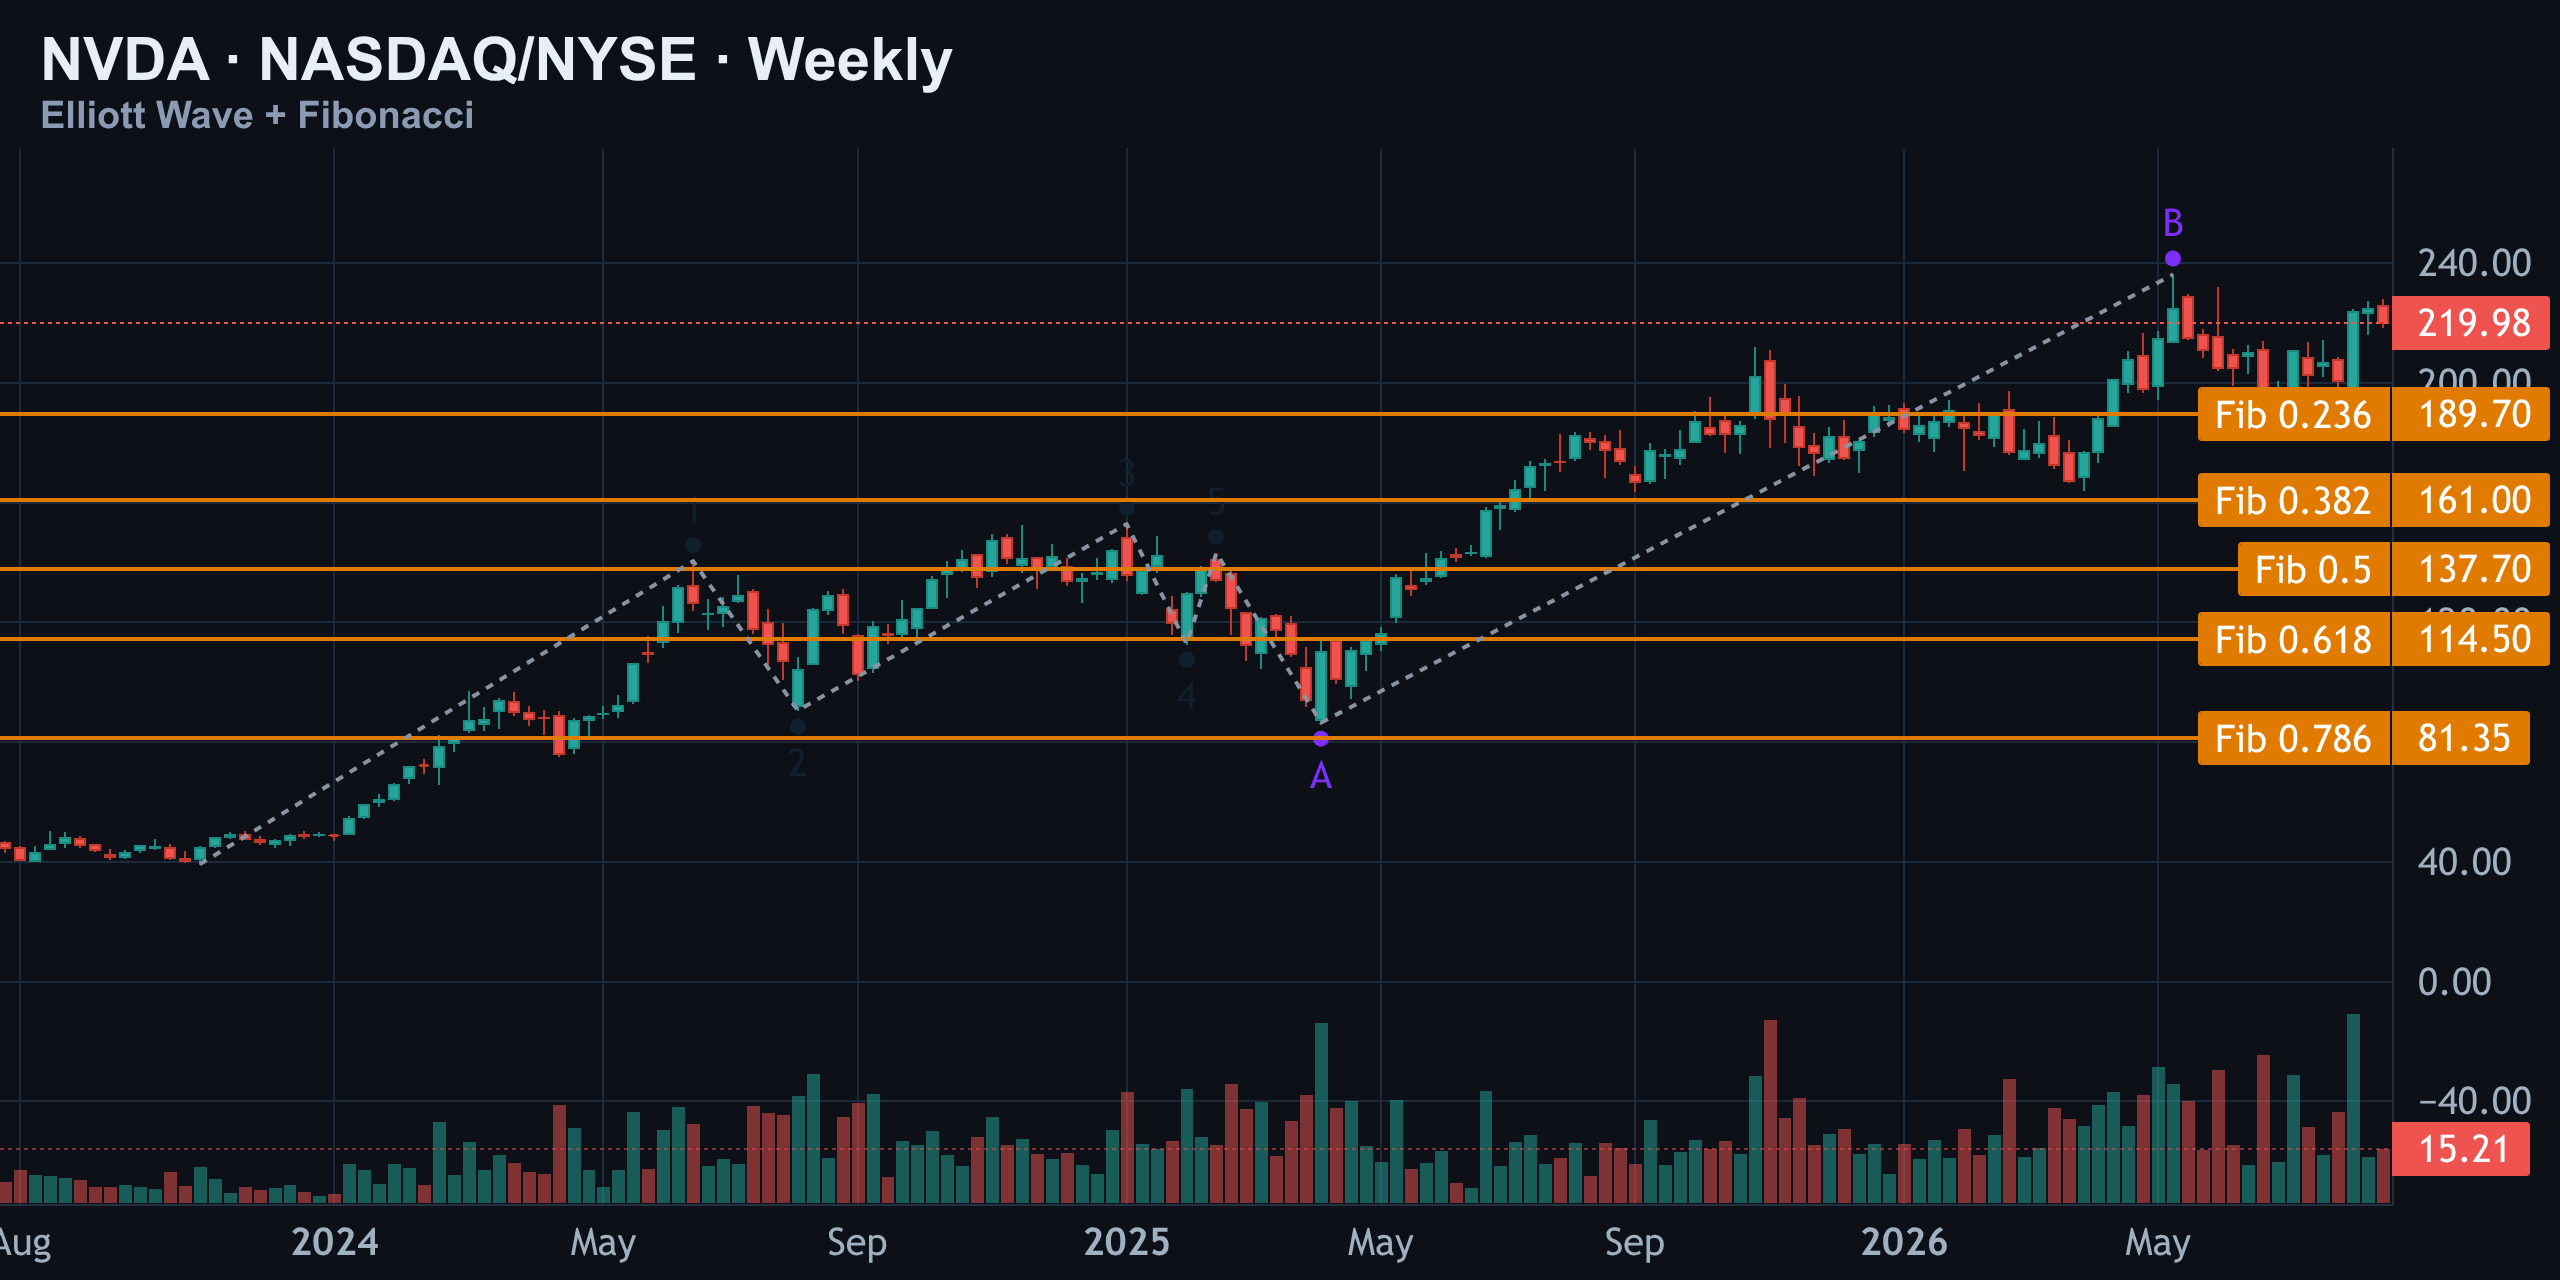
The weekly chart tells a longer story. It shows a five-wave impulse from around $90 up to $153, followed by an A-B-C corrective structure. Wave B just topped at $236.26, and price is now hovering near that fib zone again — which is precisely why this level matters so much.
Wave Count & Scenarios
The primary count shows a completed five-wave move from $140.48 up to $152.87, down to $112.86, and a fifth-wave push to $143.21. That impulse was followed by an A-B structure, with wave A bottoming at $86.50 and wave B topping at $236.26.
| Wave | Level | Description |
|---|---|---|
| Wave 1 high | $152.87 | Initial impulse leg |
| Wave 2 low | $112.86 | Corrective pullback |
| Wave 5 high | $143.21 | Impulse completion |
| Wave A low | $86.50 | Correction begins |
| Wave B high | $236.26 | All-time high, current resistance |
| Wave C (in progress) | $219.98 (current) | Either extending higher or reversing |
We're likely tracing out Wave C right now, and it can resolve two ways: if bulls take out $236, this becomes the early leg of a fresh impulsive move higher (the bull flag breakout scenario). If sellers defend that high, price could instead drag back toward the 0.5 Fibonacci retracement near $137.70 as a corrective Wave C completes to the downside.
Trend Health Check: Moving Averages, RSI, and MACD
Trend-following tools continue to back the bullish case, even as the stock sits at a pivotal level. Nvidia at $219.98 is trading above both its 50-day moving average ($207.14) and its 200-day moving average ($195.01) — a textbook bullish alignment where the shorter average sits above the longer one, and price sits above both.
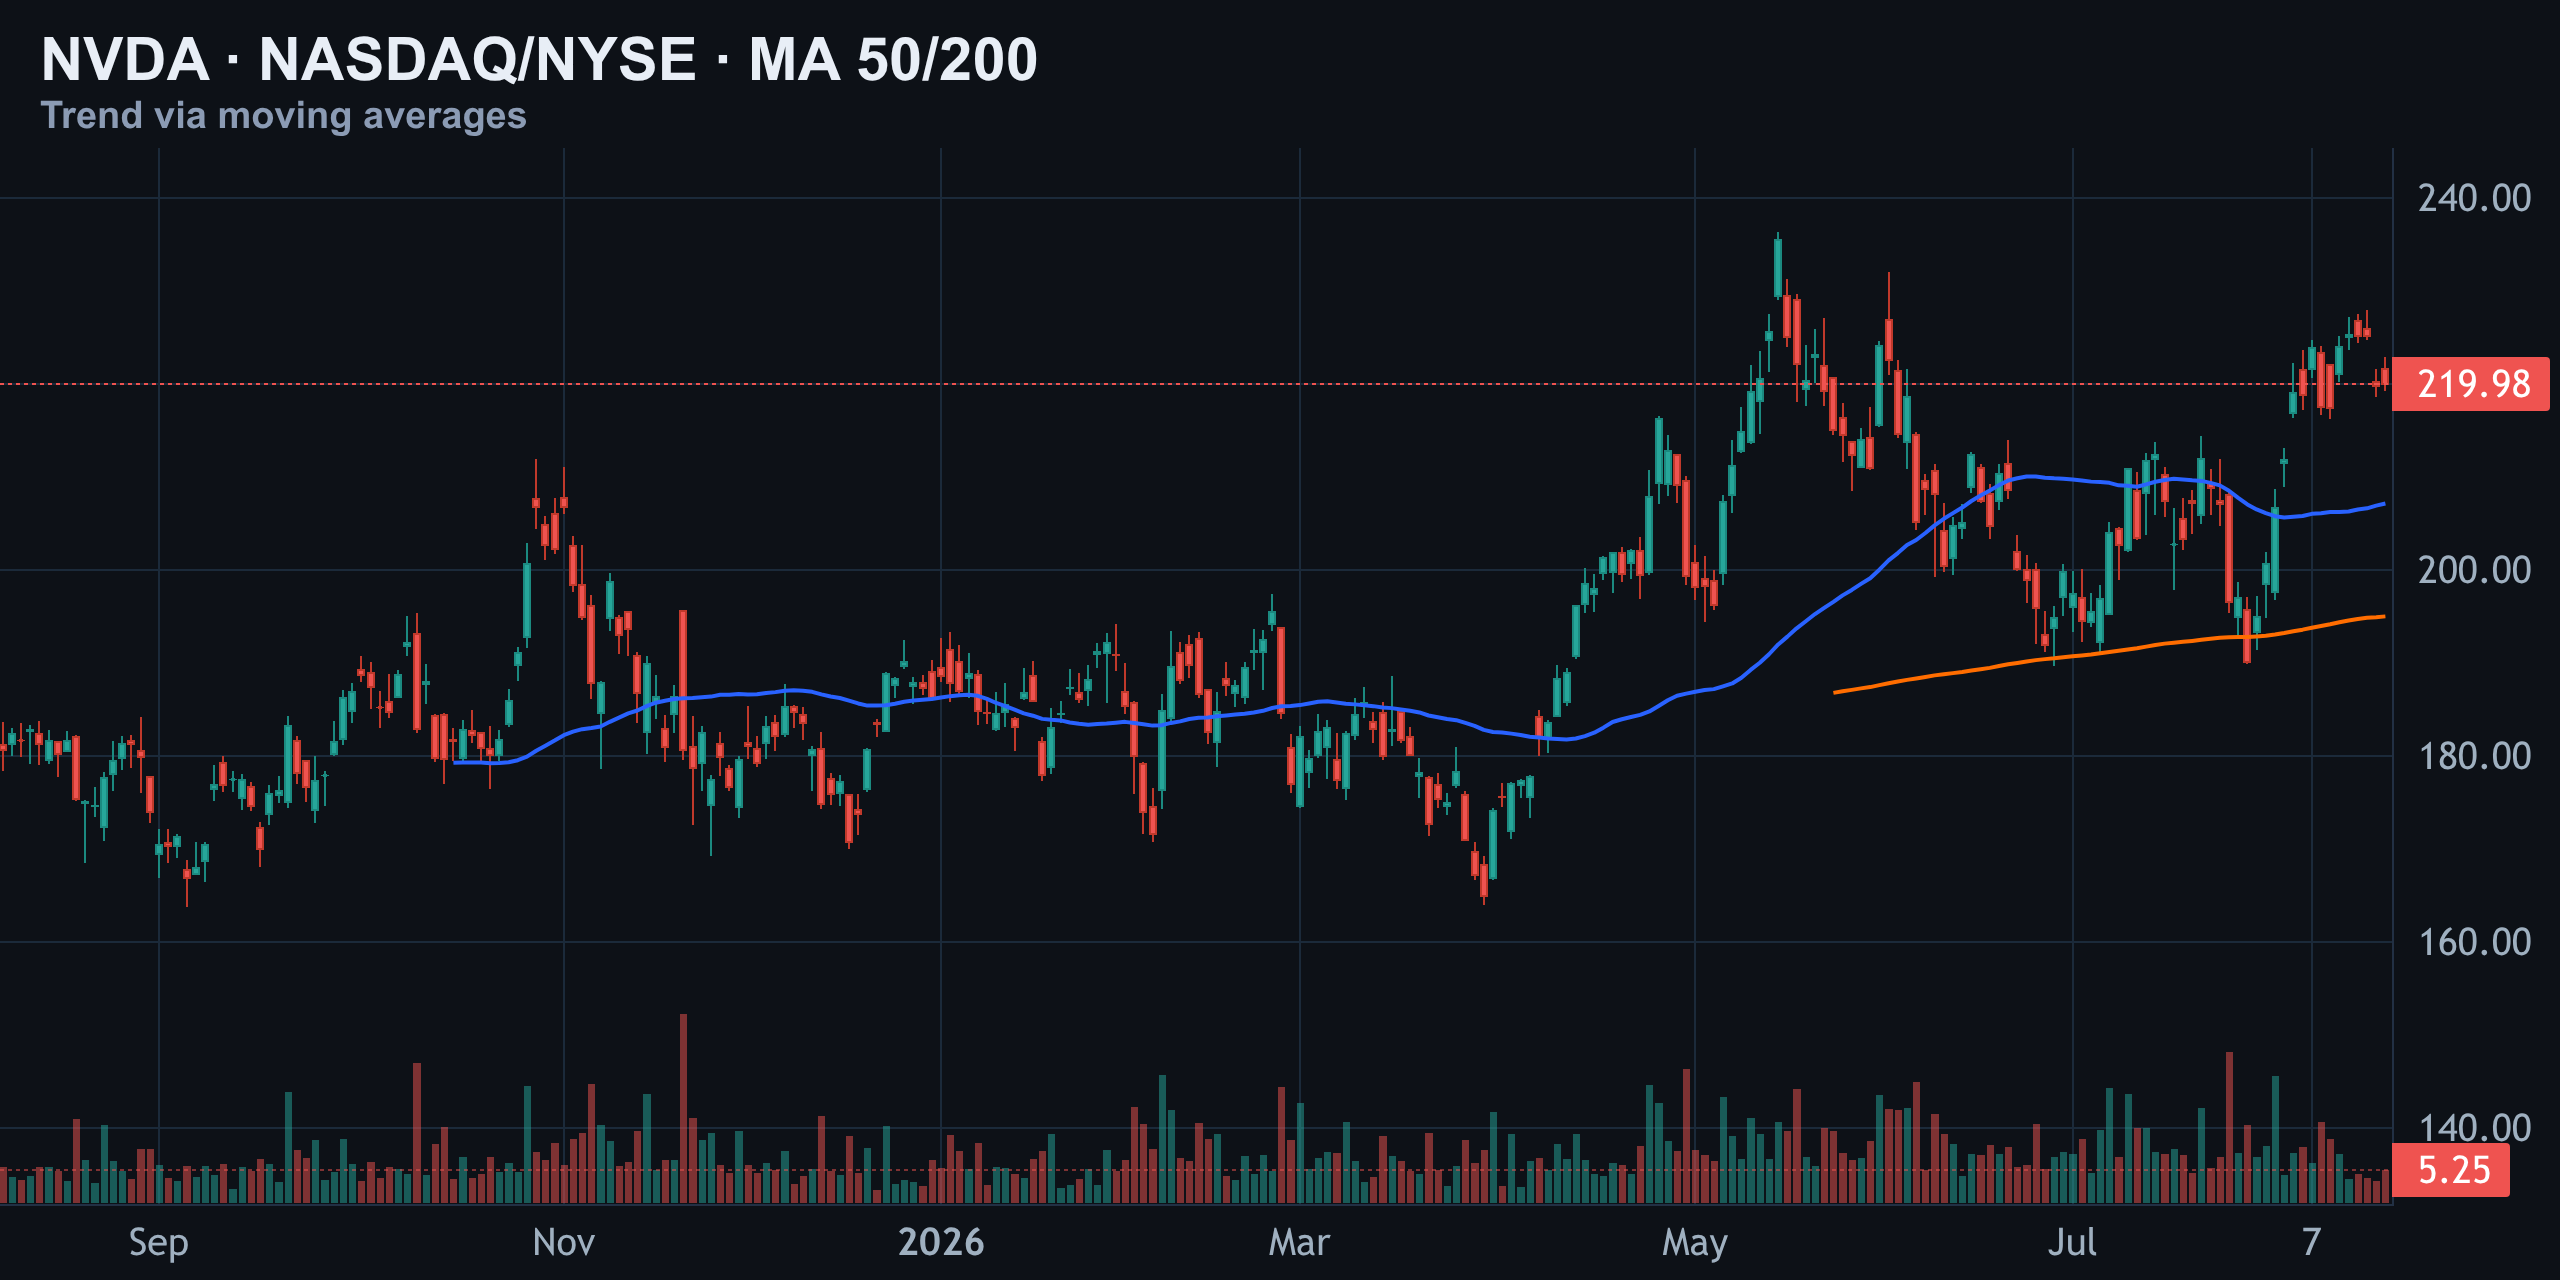
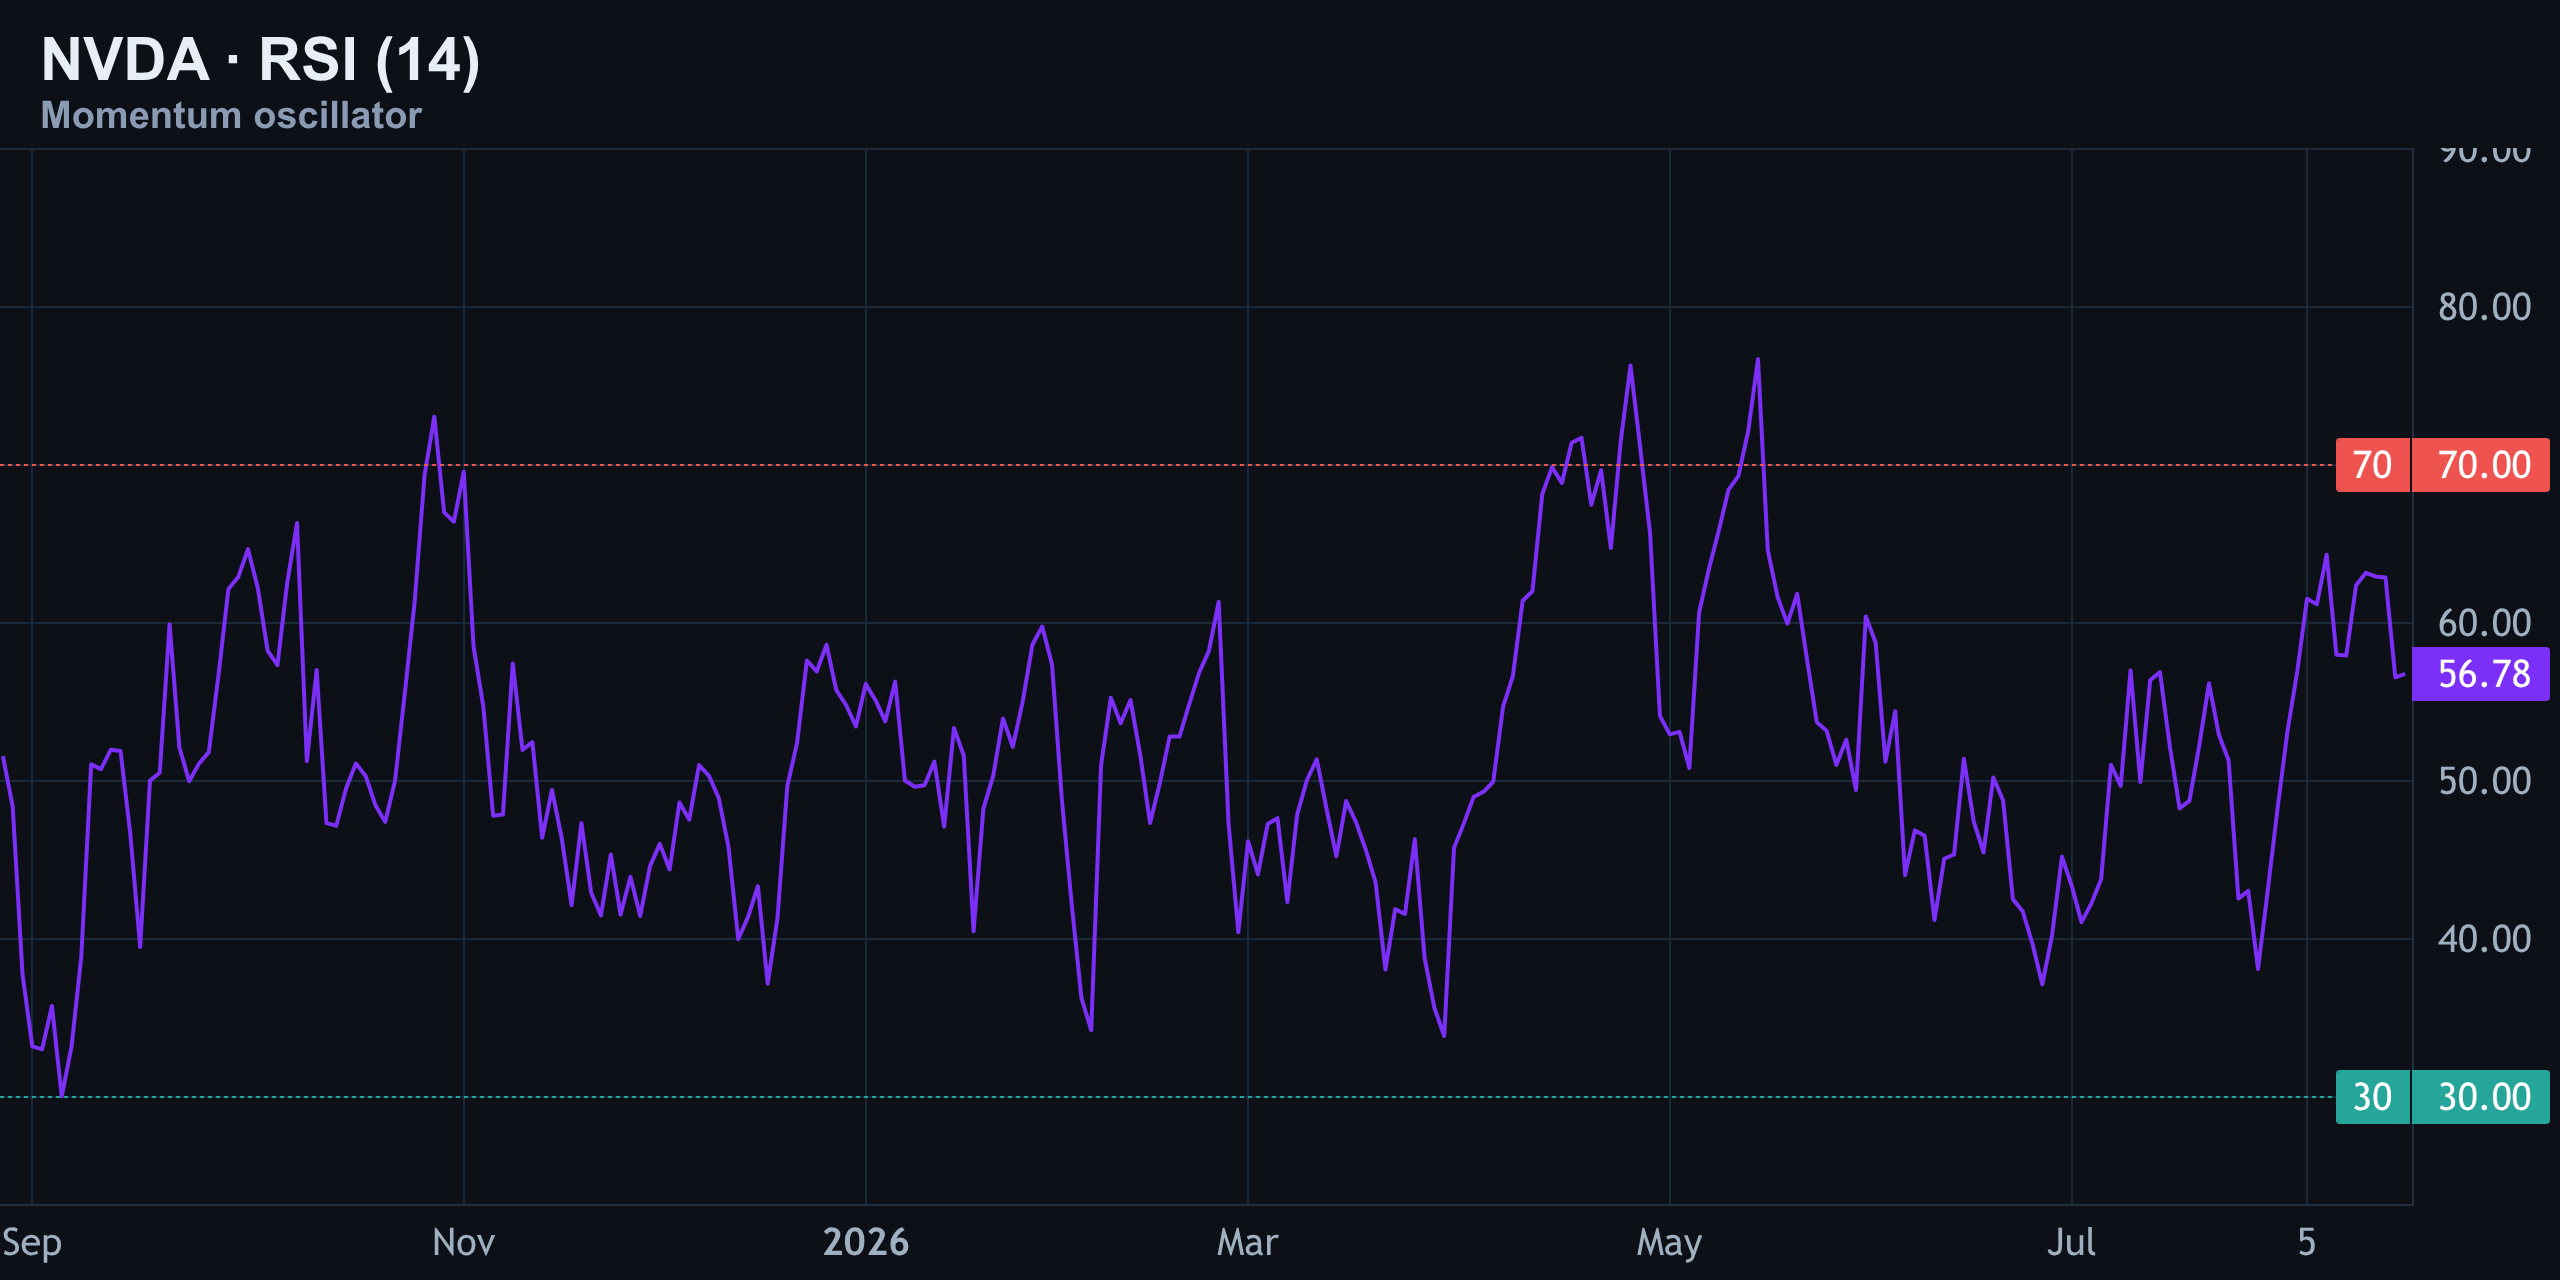
Momentum readings tell a similar story without flashing any warning signs of overheating. RSI(14) sits at 57 — comfortably neutral, well below the 70 level that would signal overbought conditions, and with plenty of room to run higher before hitting resistance on the oscillator itself.
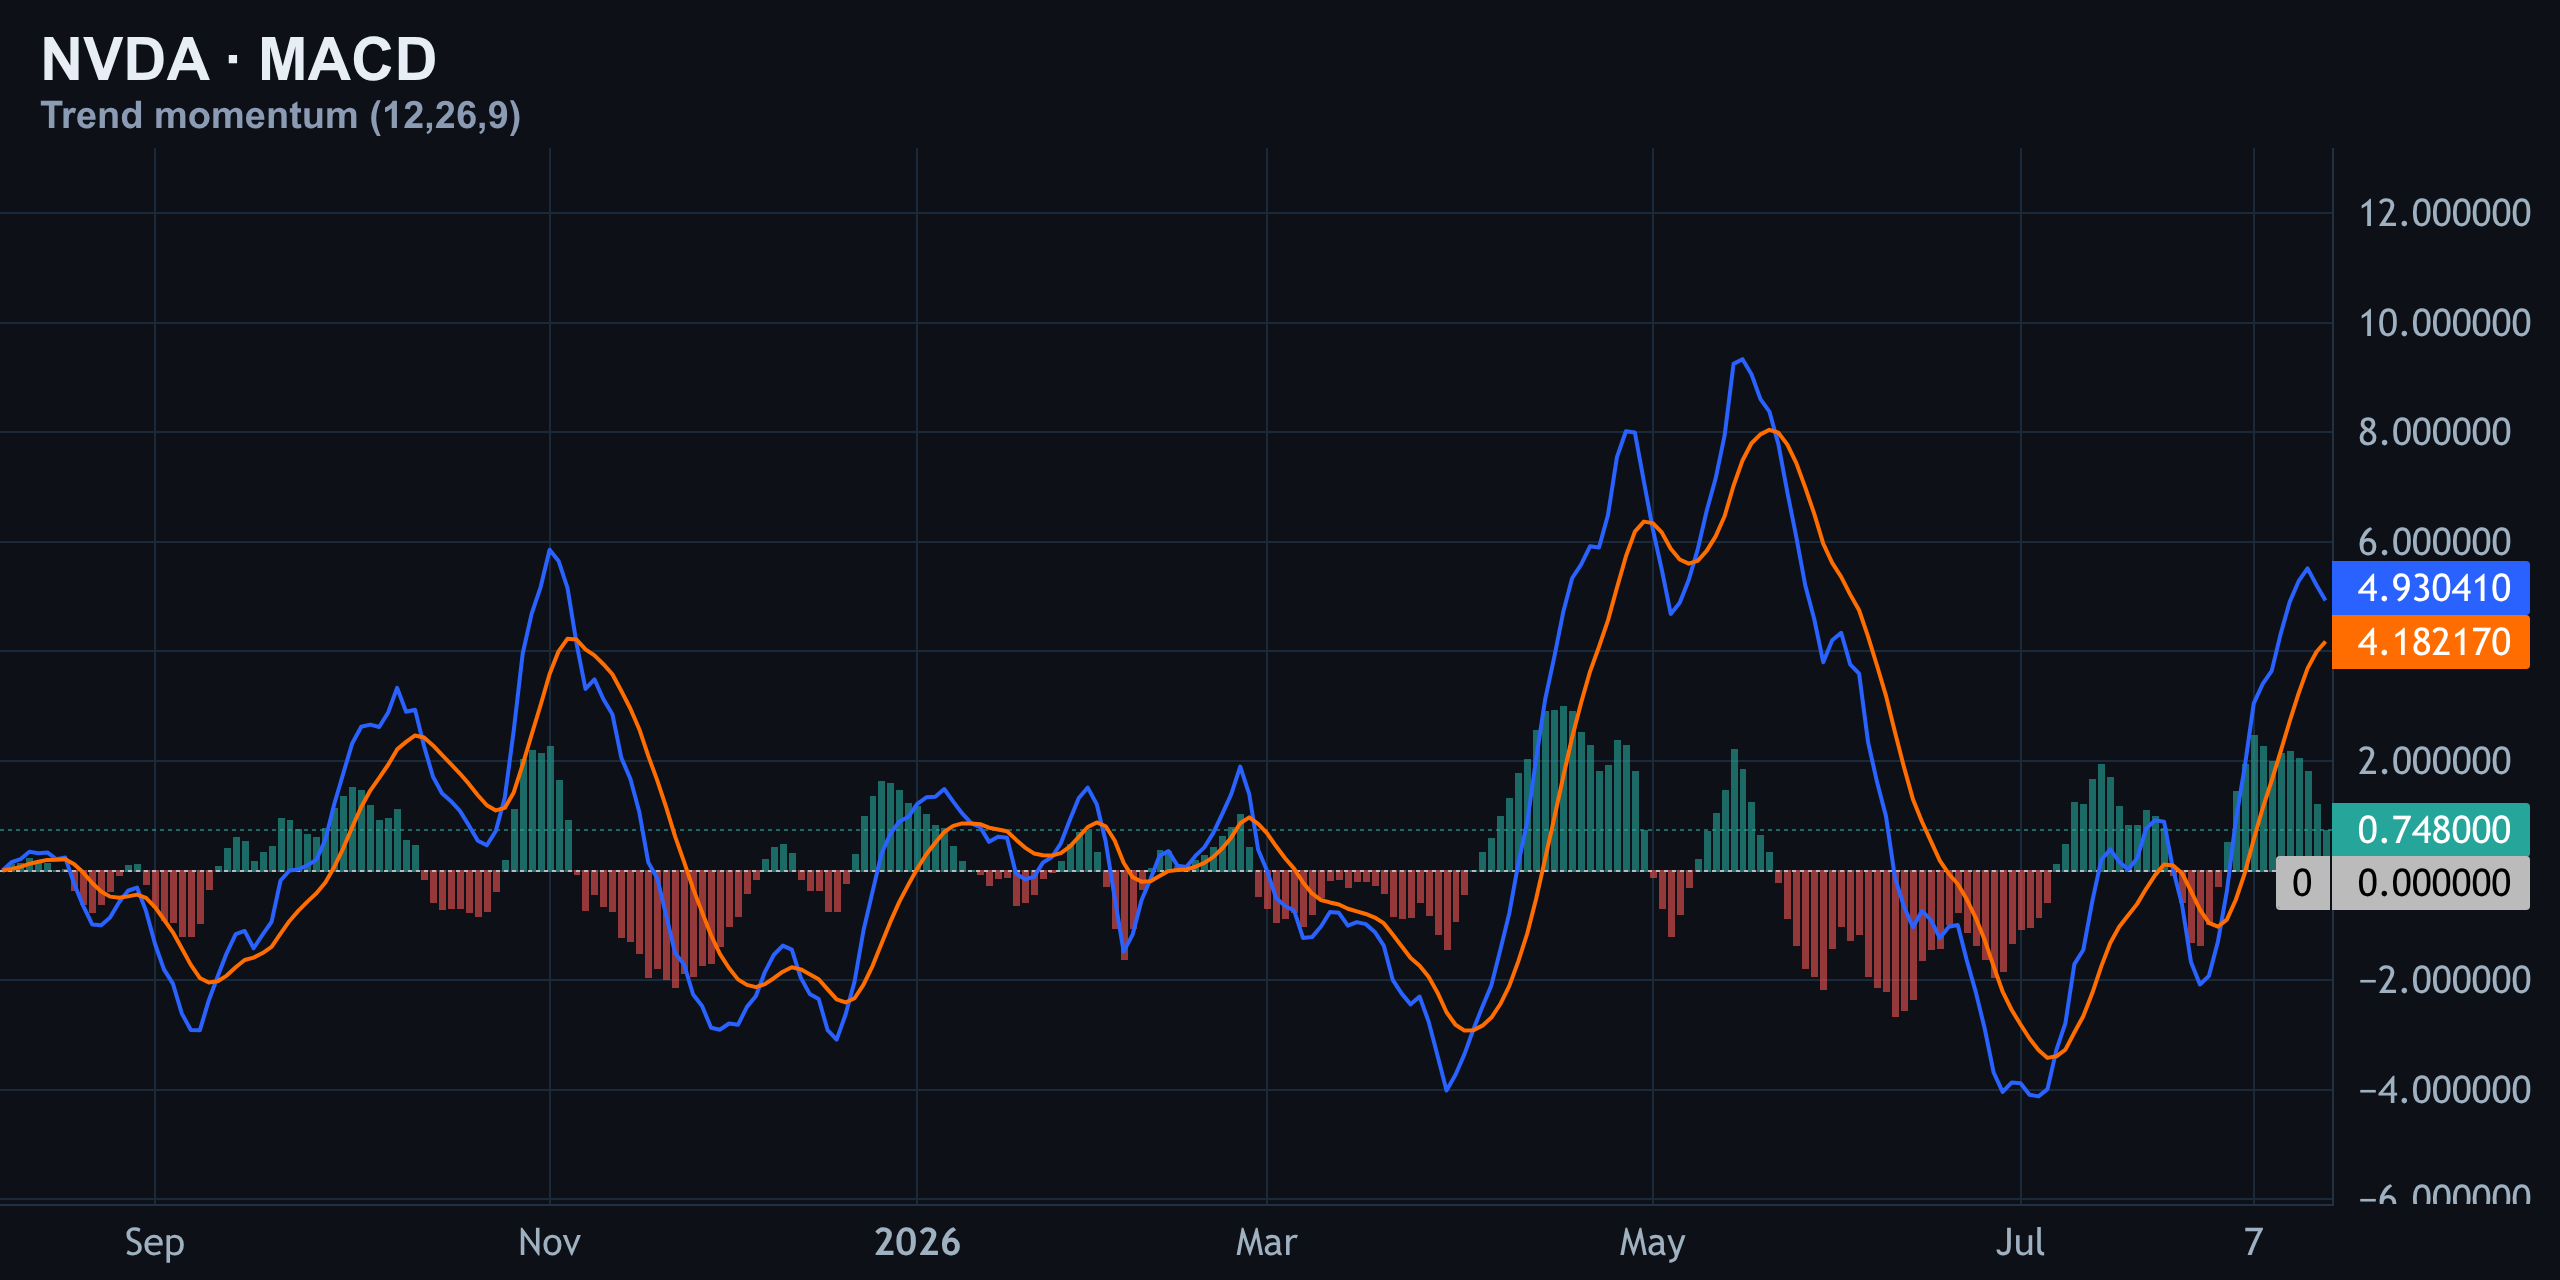
MACD is above its signal line with a positive histogram, confirming that upside momentum, while not explosive, remains intact and hasn't started rolling over.
| Indicator | Reading | Signal |
|---|---|---|
| Price vs MA50 | $219.98 vs $207.14 | Bullish |
| Price vs MA200 | $219.98 vs $195.01 | Bullish |
| RSI (14) | 57 | Neutral, room to extend |
| MACD | Above signal, histogram positive | Bullish, not overheated |
The Institutional Edge: Options Flow and Max Pain
This is where things get interesting. Options flow shows Nvidia trading around $221.90, with max pain sitting right at $220 — lining up almost perfectly with the current price. Max pain is the strike where the greatest number of options would expire worthless, and dealers often have an incentive to pin price near that level heading into expiration.
The put/call open interest ratio of 0.81 leans slightly bullish, suggesting dealers and traders aren't heavily positioned for a big downside move into the next expiration. In practice, that means the $220 level could act as a magnet in the short term — but the underlying positioning skew doesn't support an aggressive bearish thesis.
Levels to Watch
With price wedged between resistance and a magnet strike, having the key levels mapped out matters more than usual right now.
| Level | Price | Why It Matters |
|---|---|---|
| Major resistance / ATH | $236.26 | May all-time high; Wave B top and breakout trigger |
| Max pain / near-term resistance | $220.00 | Options pinning level, current price zone |
| 50-day MA (near-term floor) | $207.14 | Short-term trend support |
| 200-day MA | $195.01 | Longer-term trend support |
| Major support | $164.09 | April selloff low, structural floor |
| 0.5 Fib retracement (bear case target) | $137.70 | Downside target if Wave C turns corrective |
A clean daily close above $236.26 would confirm the bull flag breakout scenario and open the door to fresh price discovery. A failure here, followed by a break below the 50-day MA near $207, would shift the weight of evidence toward the corrective Wave C path targeting the $137.70 fib zone.
The Takeaway
Nvidia remains structurally bullish above its key moving averages, with steady accumulation on the daily chart, a tight bullish coil on the hourly chart, and momentum indicators that still have room before flashing overbought. But it's parked right at a decision point between $220 resistance and the options market's max pain zone — and the resolution of that standoff will likely determine whether this is a bull flag breakout or the start of Wave C's decline.
- Bull case: reclaim and hold above $236.26 to confirm a fresh impulsive leg.
- Bear case: rejection here followed by a break of the 50-day MA opens the path to $137.70.
- Neutral zone: continued chop between $207 and $236 keeps the Elliott Wave count unresolved.
Key takeaways
- NVDA trades above both its 50-day ($207.14) and 200-day ($195.01) moving averages — the trend remains bullish.
- Price is coiling in a tight bull-flag-like consolidation just under $220, directly at the options market's max pain level.
- Elliott Wave puts NVDA in Wave C of a larger A-B-C correction; a break above $236.26 favors continuation, a rejection favors a drop toward $137.70.
- RSI at 57 and a positive MACD histogram show momentum intact but not overheated, leaving room to run either direction.
- The $220–$236 zone is the key battleground — watch for a decisive daily close outside this range for directional confirmation.
Frequently asked questions
What is NVDA's max pain level right now?
Options flow data shows max pain sitting right at $220, almost exactly where Nvidia is currently trading, which can create short-term price pinning into expiration.
Is NVDA bullish or bearish based on current technicals?
The overall bias is bullish — price sits above both the 50-day and 200-day moving averages, RSI is neutral at 57, and MACD is positive — but the stock is at a key decision point near resistance.
What is the Elliott Wave count for Nvidia stock?
NVDA appears to be tracing Wave C of a larger A-B-C correction, with Wave B having topped at the all-time high of $236.26. The wave can resolve either as a fresh impulsive breakout or a corrective move toward $137.70.
What is the key resistance level for NVDA?
The critical resistance is $236.26, the all-time high set in May. A confirmed close above this level would validate a bull flag breakout scenario.
What is the major support level if NVDA breaks down?
The 50-day moving average near $207 is the near-term floor, while $164.09 — the April selloff low — represents the major structural support level.