
Analysis
NVDA at $225: Bull Flag Breakout or Fake-Out at $230?
NVDA Bias Snapshot: Bullish, But Boxed In
Nvidia closed near $225.30 as of the latest session, up roughly 0.5% on the day, sitting comfortably above both its 50-day and 200-day moving averages. That's the kind of positioning that usually reads as unambiguously bullish. But the setup right now is more nuanced than a simple 'line go up' story.
Price is pressing directly into one of the heaviest options walls on the board. The September $225 call strike alone has drawn enormous attention from options traders, and the broader chain shows a wall of resistance stacking up at $230. At the same time, a longer-term Elliott Wave read suggests the entire rally off the April lows could still be a corrective bounce rather than a fresh impulsive leg higher.
Daily Structure: A Full Round Trip Back to Resistance
Zoom out to the daily chart and Nvidia has effectively completed a full round trip since spring. Price bottomed near $164 in April, ripped to a high of $236 in May, and has spent the months since chopping sideways inside a well-defined range roughly between $190 and $225.
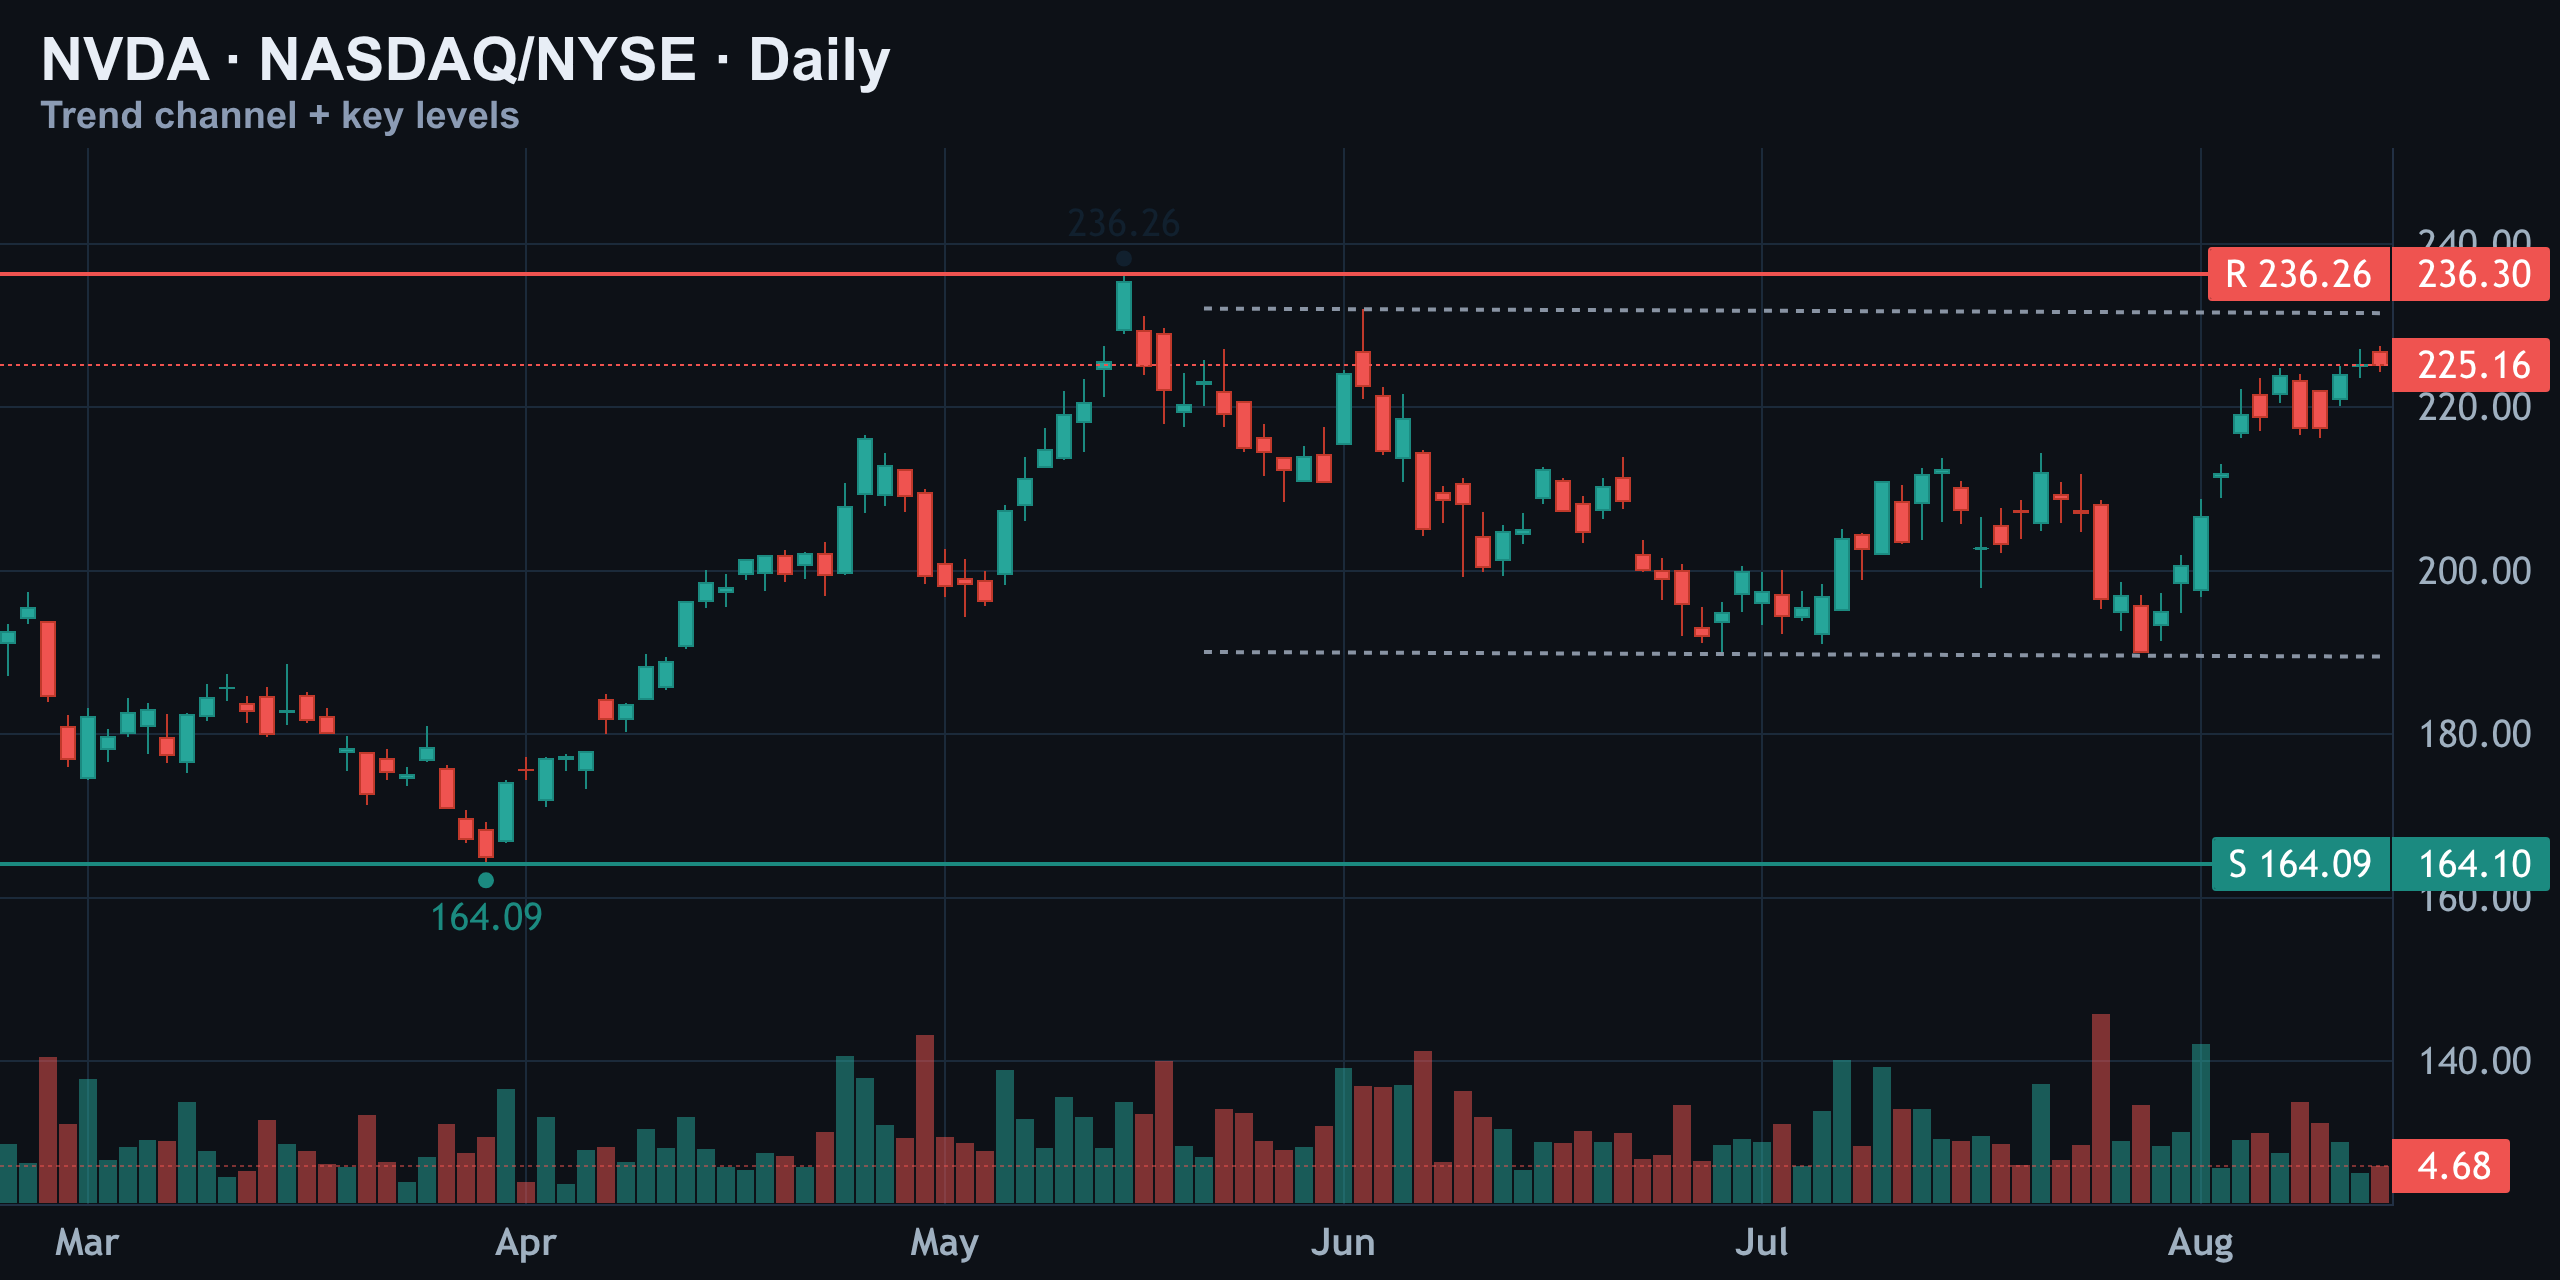
That $225 level isn't arbitrary. It's the ceiling of the recent consolidation range, and it's exactly where price is sitting today. A clean break and hold above it would flip this from 'range-bound chop' to 'range resolution to the upside.' Fail here again, and the range simply extends, with $190 remaining the floor to watch.
- April low: ~$164 — the launchpad for the current advance
- May high: ~$236 — the range's untested ceiling
- Current consolidation: ~$190–$225, now testing the top edge
1-Hour Structure: A Textbook Ascending Channel
Drop down to the hourly chart and the picture sharpens considerably. Since the July low near $189, NVDA has carved a clean ascending channel — higher lows, higher highs, and pullbacks that have been shallow and quickly bought.
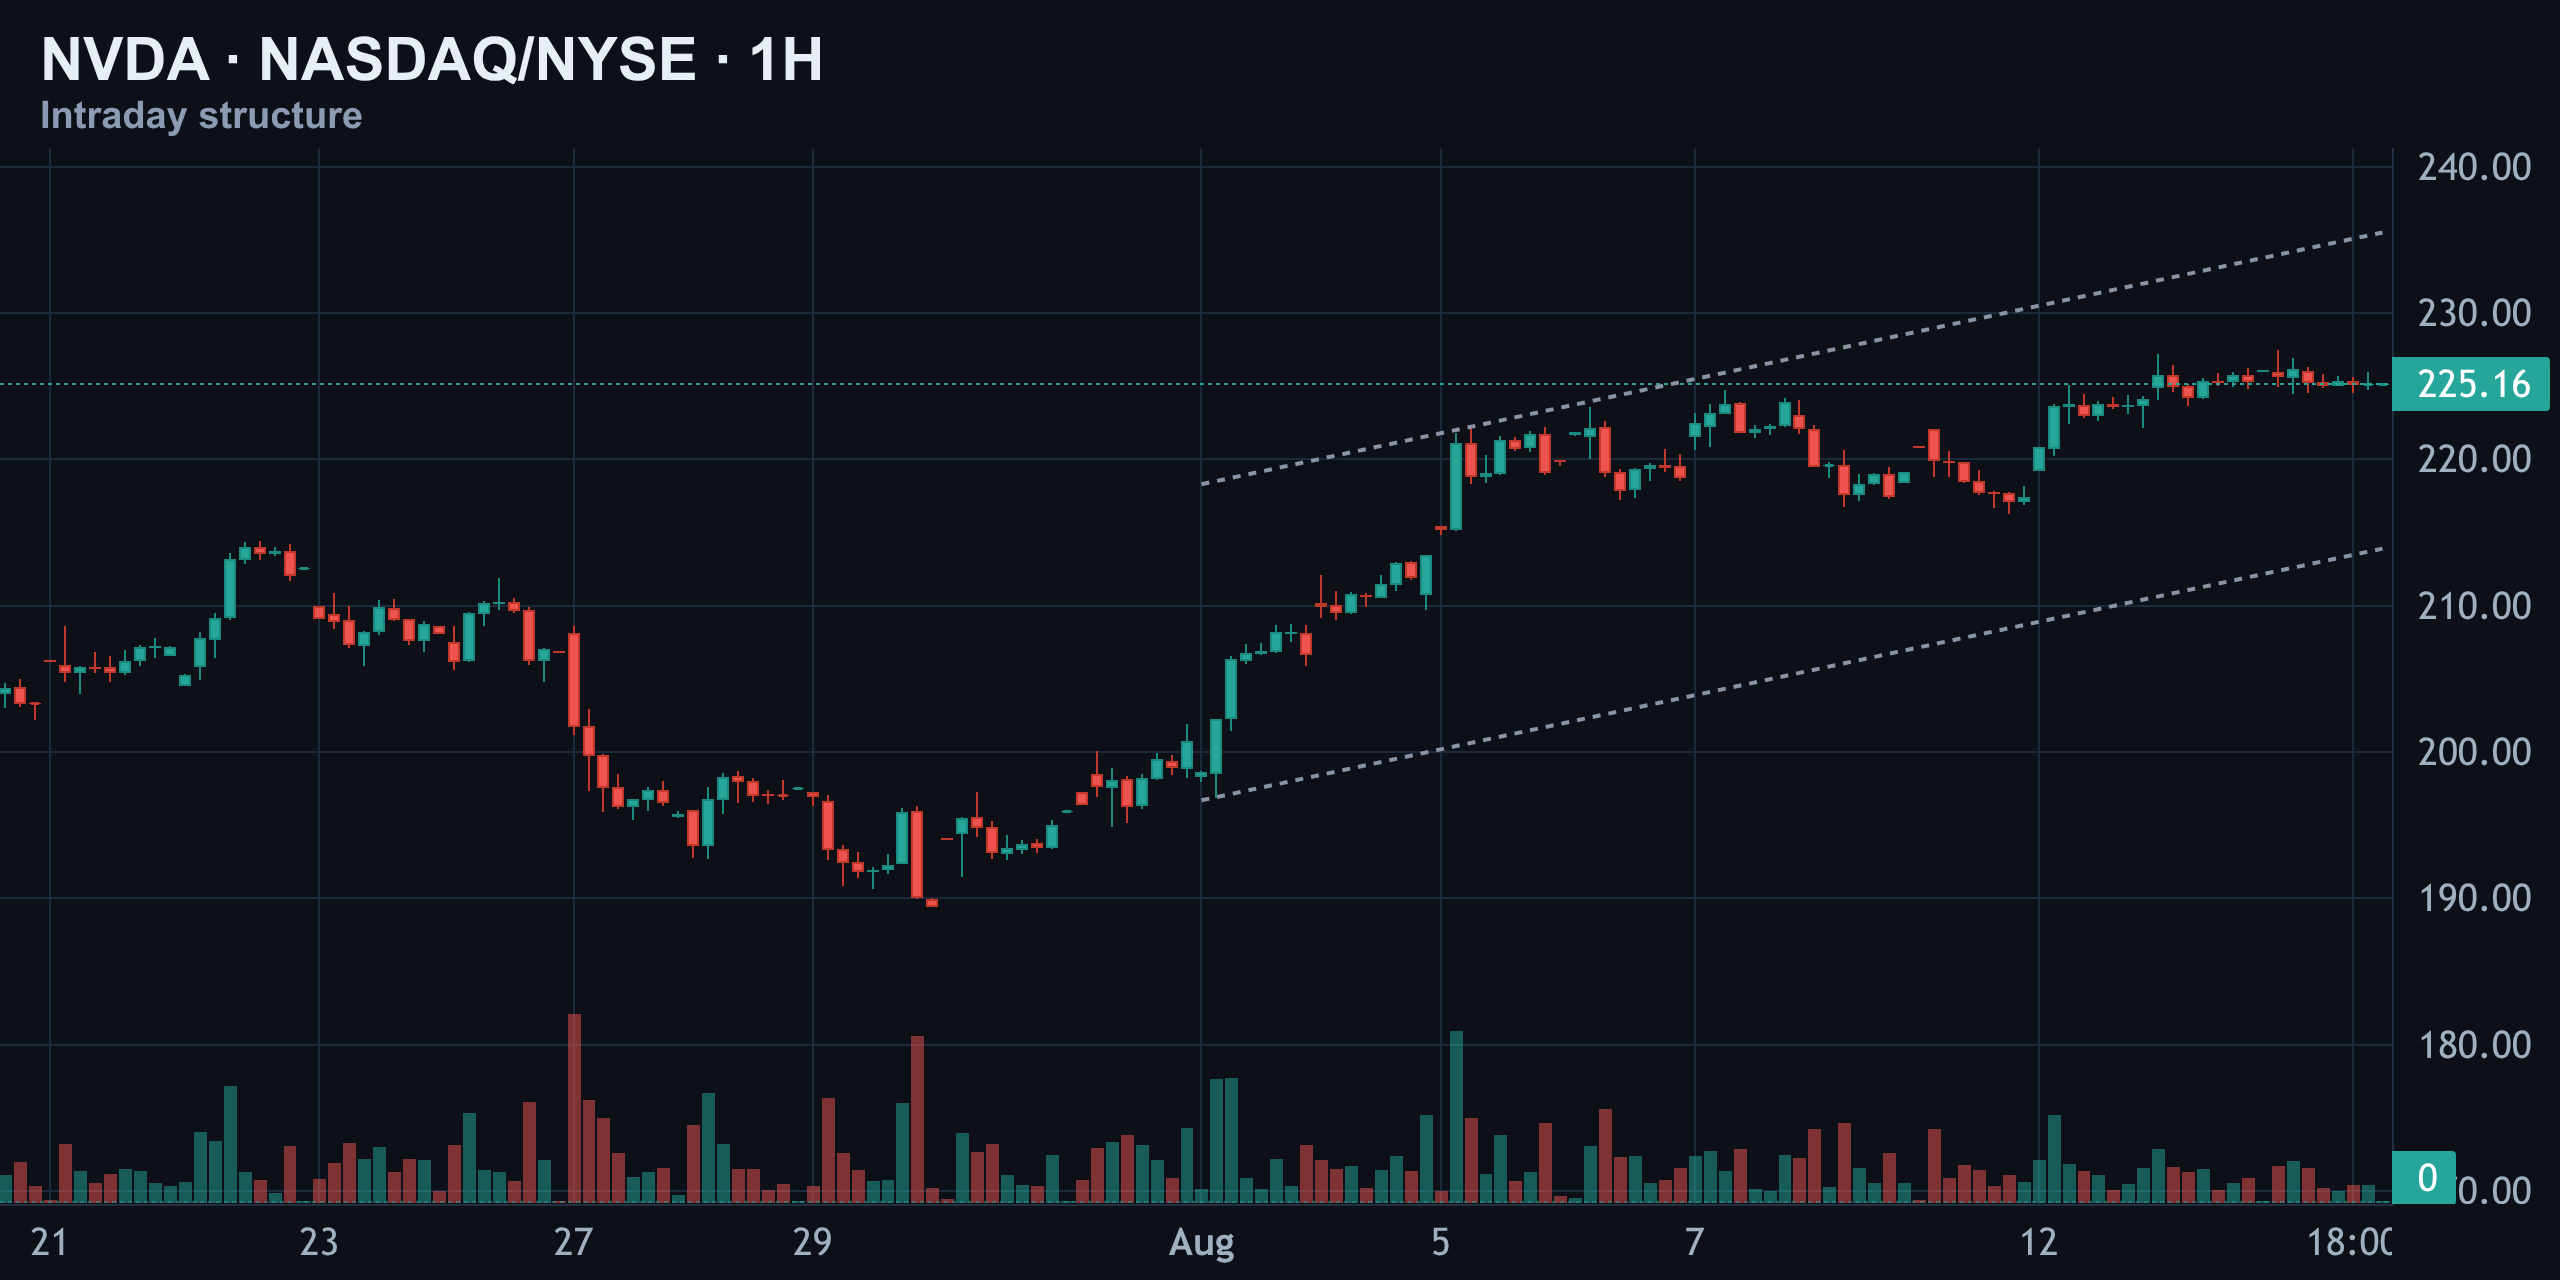
Price recently poked to fresh highs around $227 before settling back near $225, right against the upper rail of that channel. This is the classic bull-flag tension: momentum traders see continuation, while mean-reversion traders see an overextended move ripe for a pullback to the channel's midline. The tell will be how price behaves the next time it touches that upper rail — a shallow rejection keeps the channel intact, while a sharp break would suggest the tape is finally losing steam.
Weekly Elliott Wave: Is This Rally Actually a Wave B?
This is the part of the story that separates a casual chart read from a structural one. On the weekly timeframe, the 2023–2025 advance looks like a completed five-wave impulse, topping out near $143 at wave five. From there, the decline to roughly $86.50 counts as wave A of a larger corrective structure.
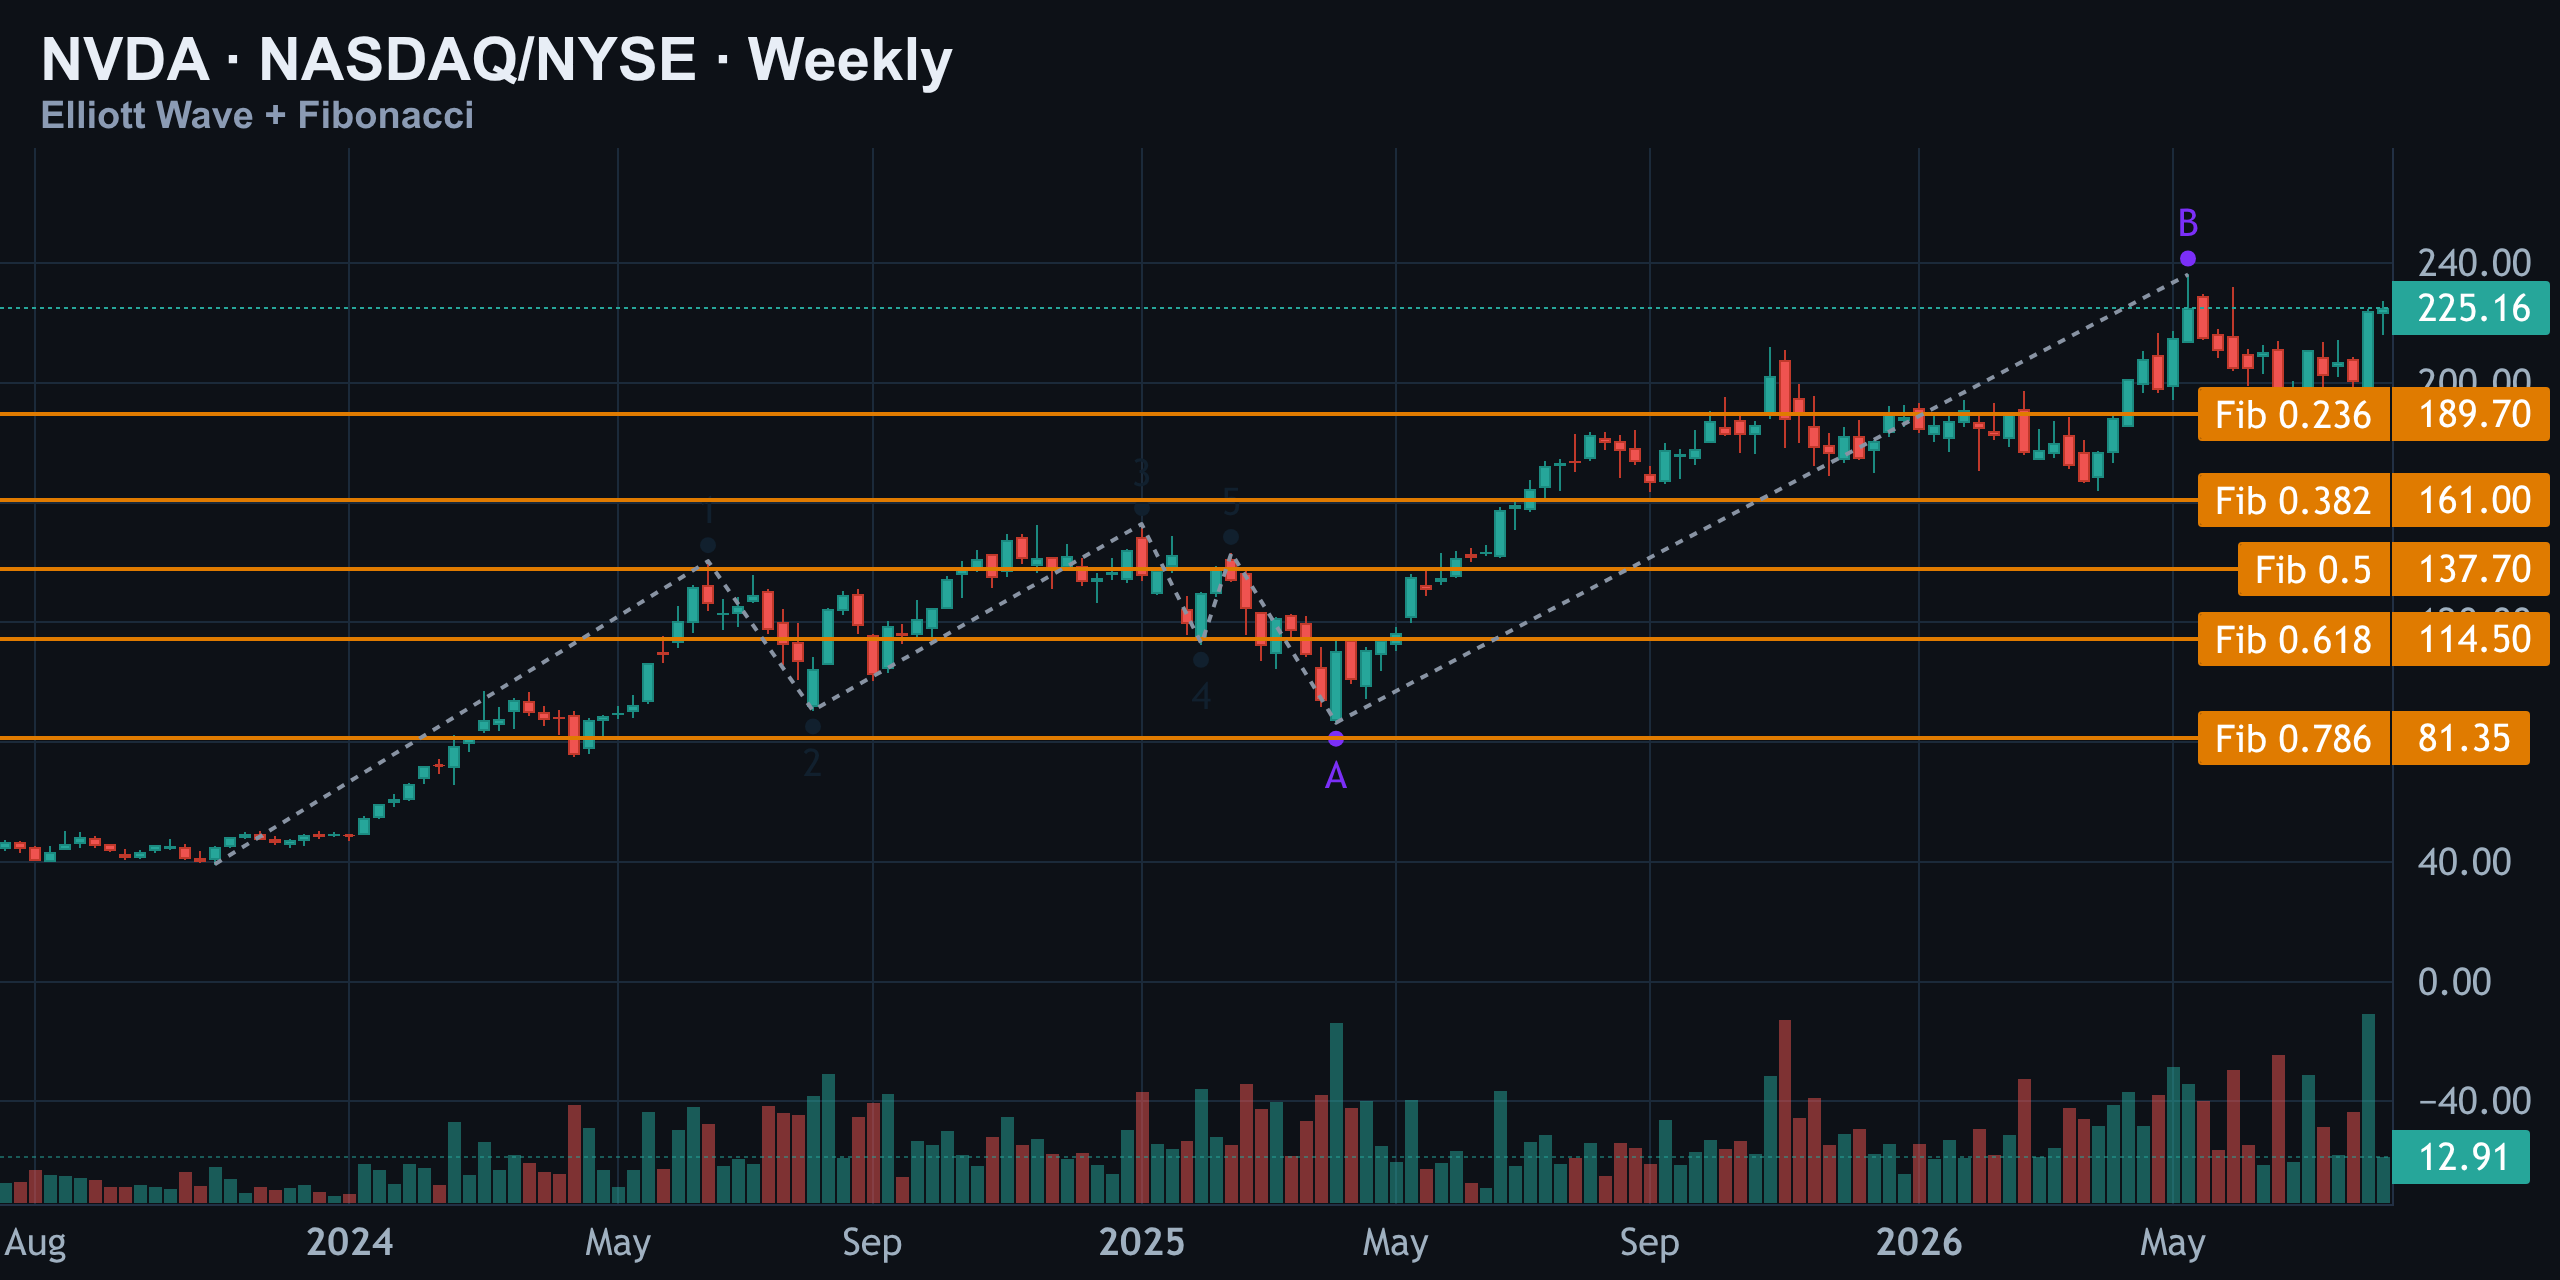
The powerful climb since then — the one that's carried NVDA from $86.50 all the way to the $236 high — is being labeled as wave B. If that count is correct, the market is technically still inside a larger corrective phase, not a fresh impulsive uptrend. That matters because wave B rallies, however convincing they look in real time, are typically followed by a wave C decline.
| Wave | Level / Range | What It Means |
|---|---|---|
| Wave 5 top (2023–2025 impulse) | ~$143 | End of the initial five-wave advance |
| Wave A low | ~$86.50 | First leg of the corrective structure |
| Wave B (current) | High of ~$236 | The rally in progress — likely corrective, not impulsive |
| Wave C downside risk (if B is topping) | ~$114–$138 | 50%–61.8% retracement zone of the wave A–B move |
Moving Averages, RSI & MACD: The Momentum Check
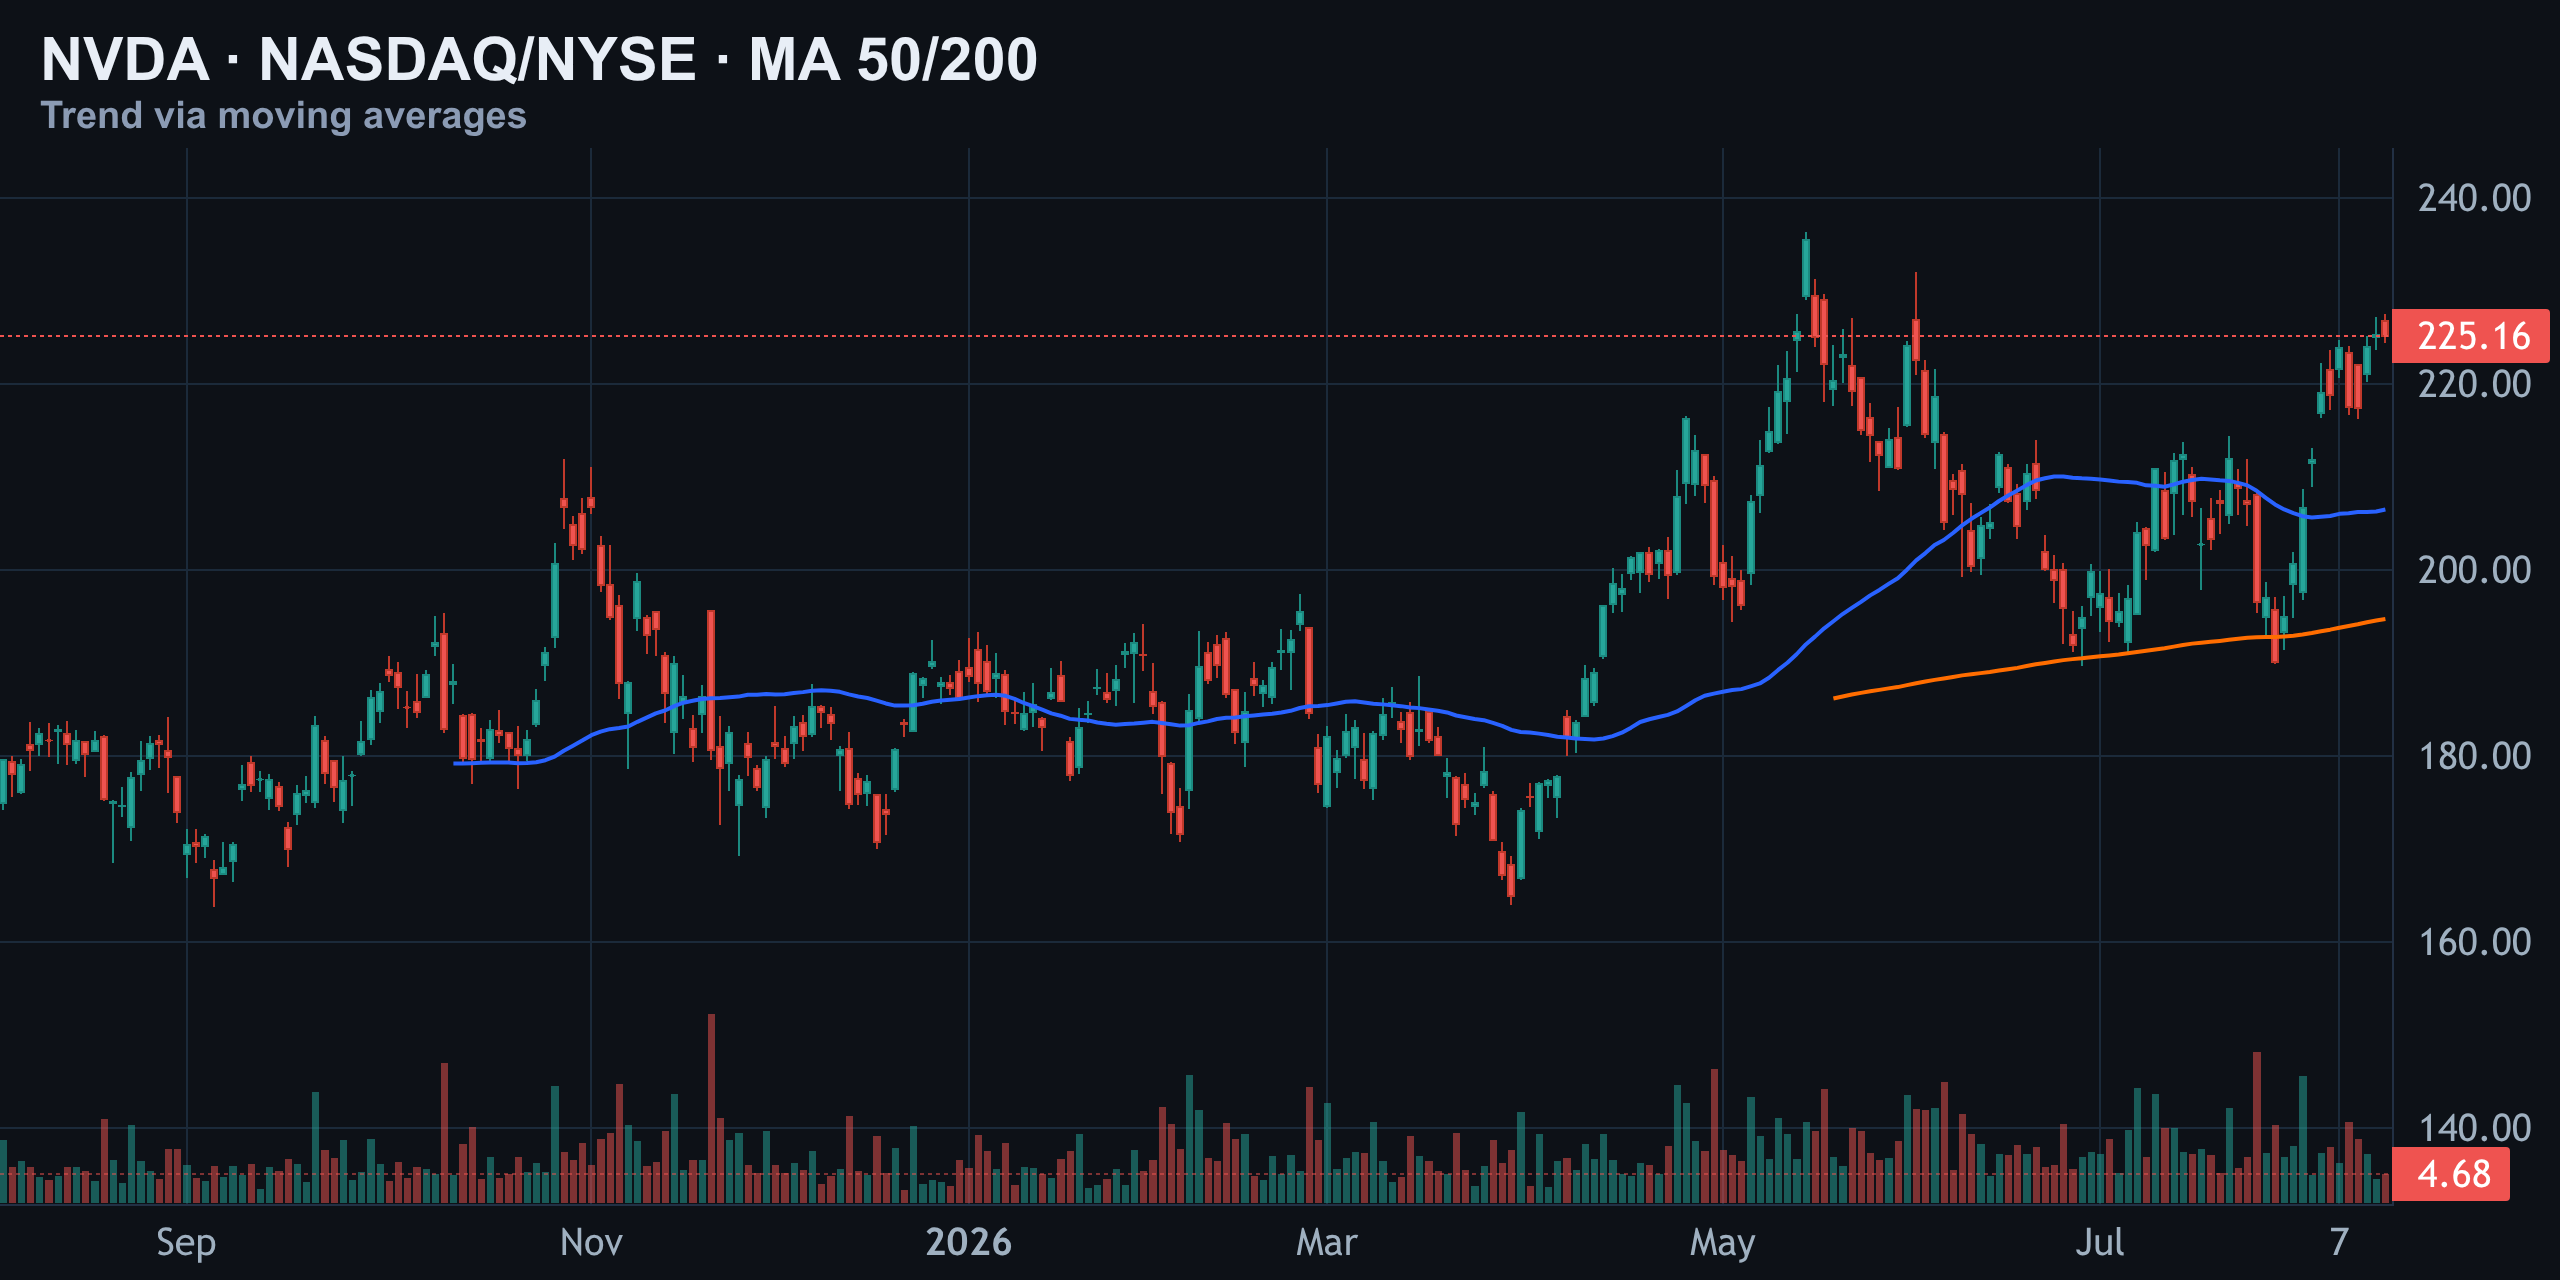
Stripping away the wave theory for a moment, the plain-vanilla momentum indicators are unambiguously constructive right now.
| Indicator | Reading | Interpretation |
|---|---|---|
| Price | $225.16 | Current spot, pressing the range ceiling |
| 50-day MA | $206.50 | Price trading well above — short-term trend bullish |
| 200-day MA | $194.74 | Price above — long-term trend intact |
| RSI (14) | 63 | Neutral-to-firm, not yet overbought |
| MACD | Above signal line, histogram positive | Momentum favors buyers |
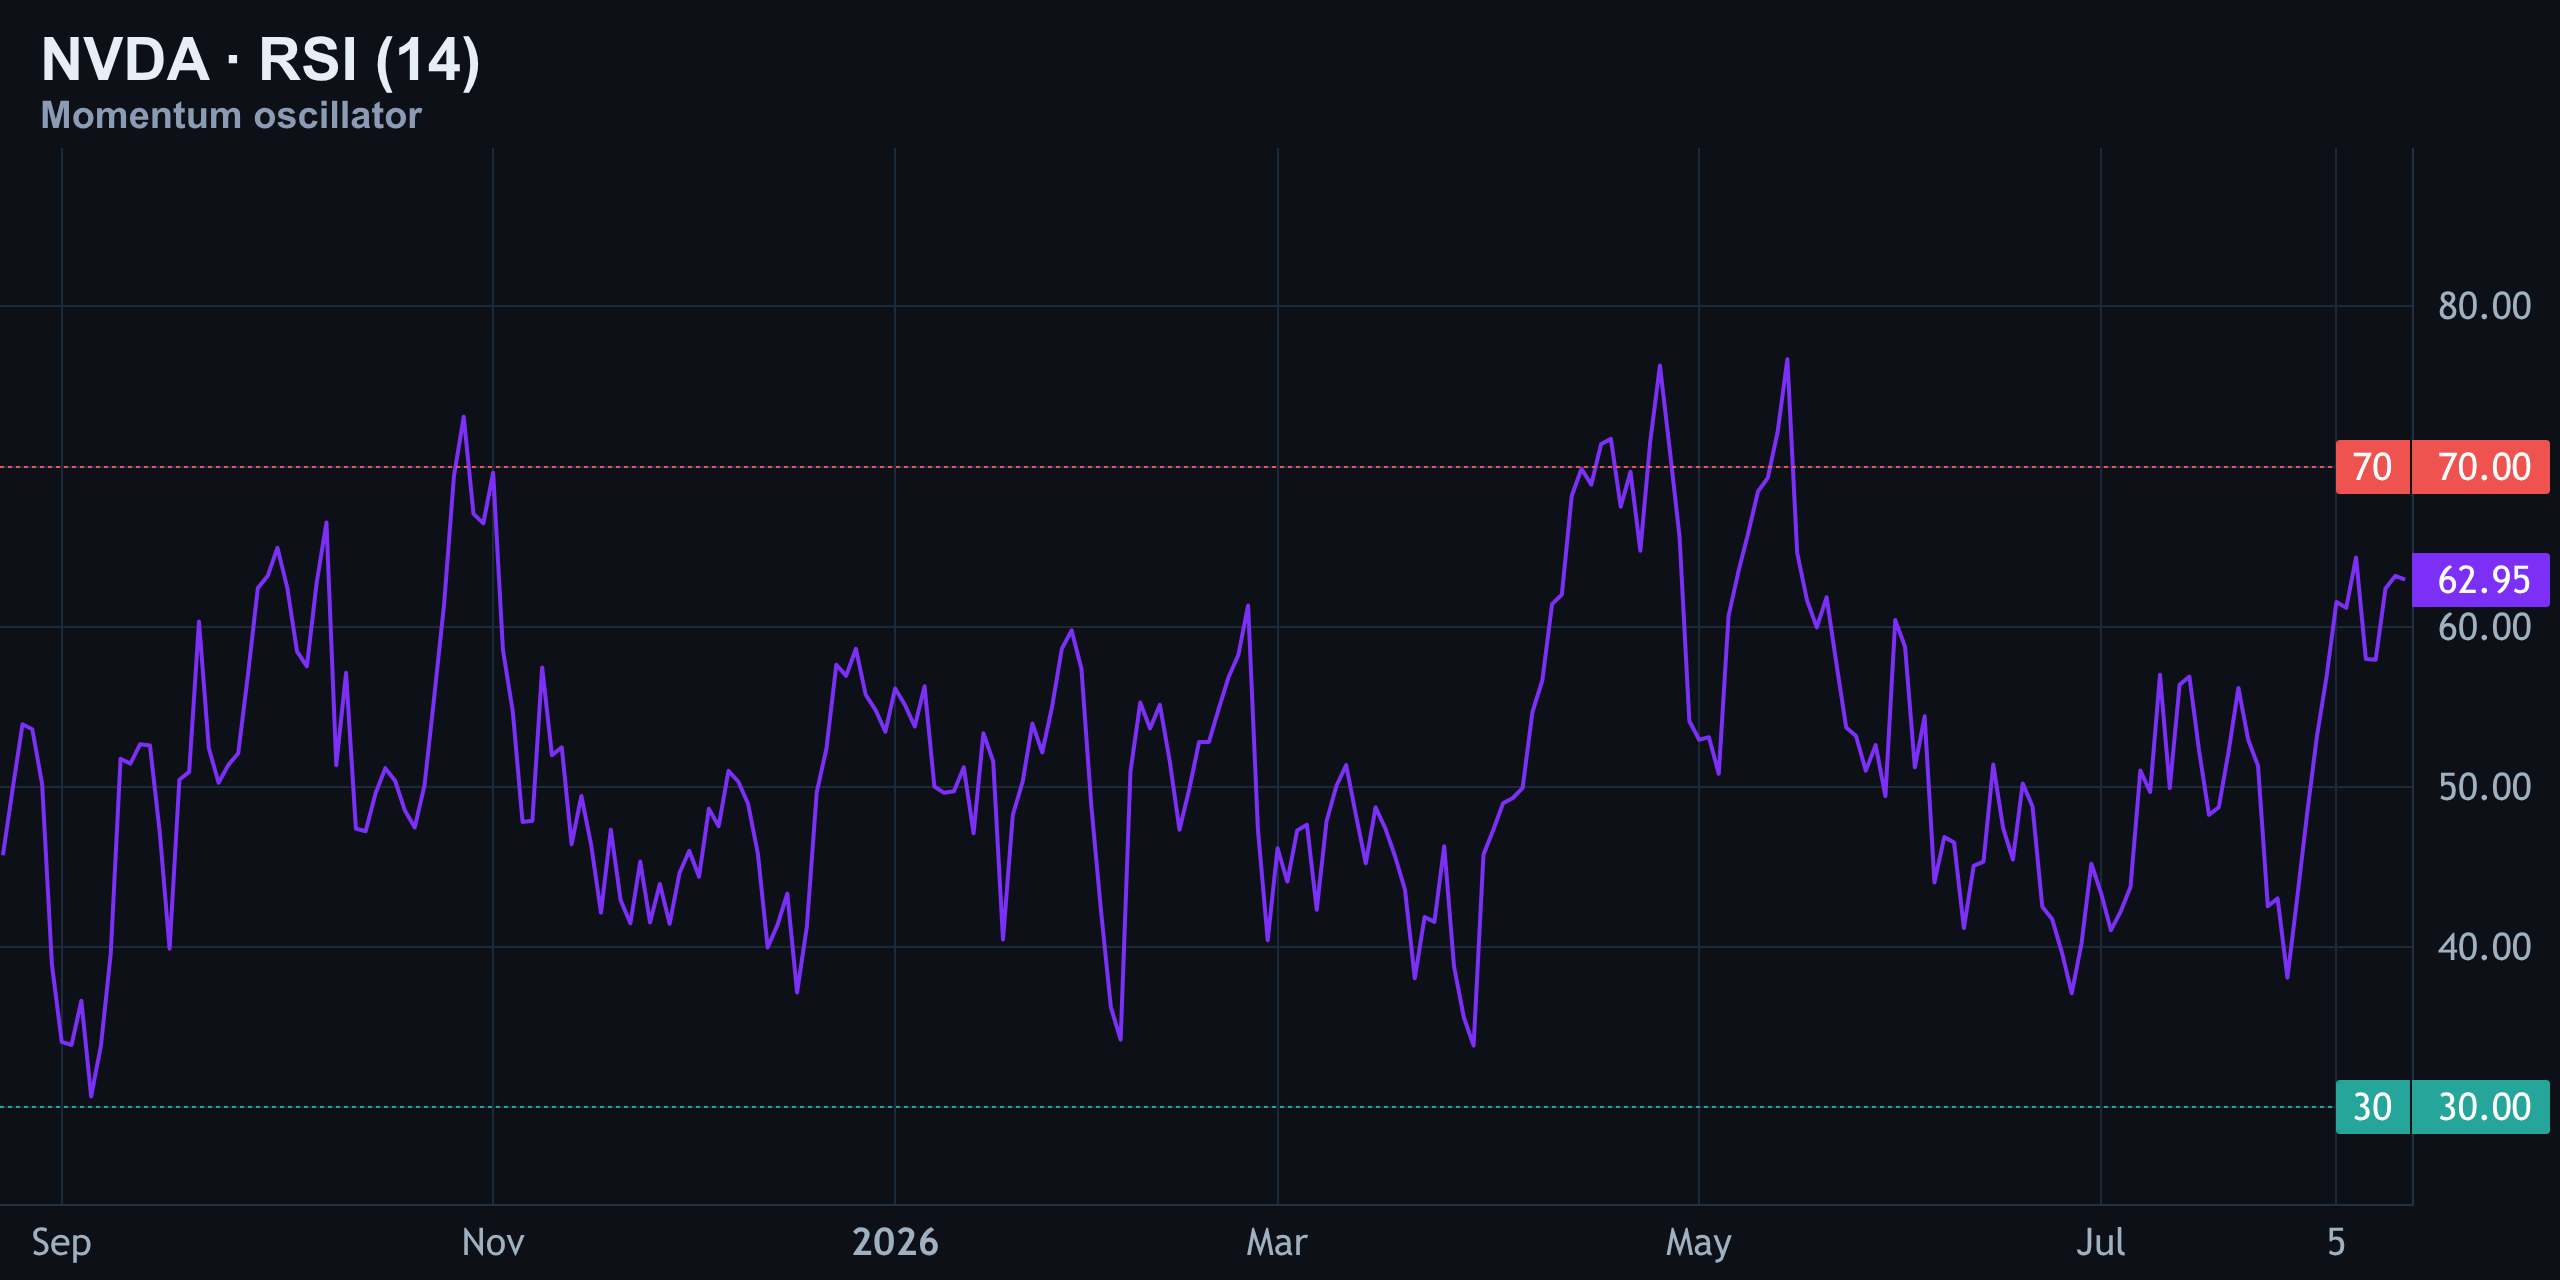
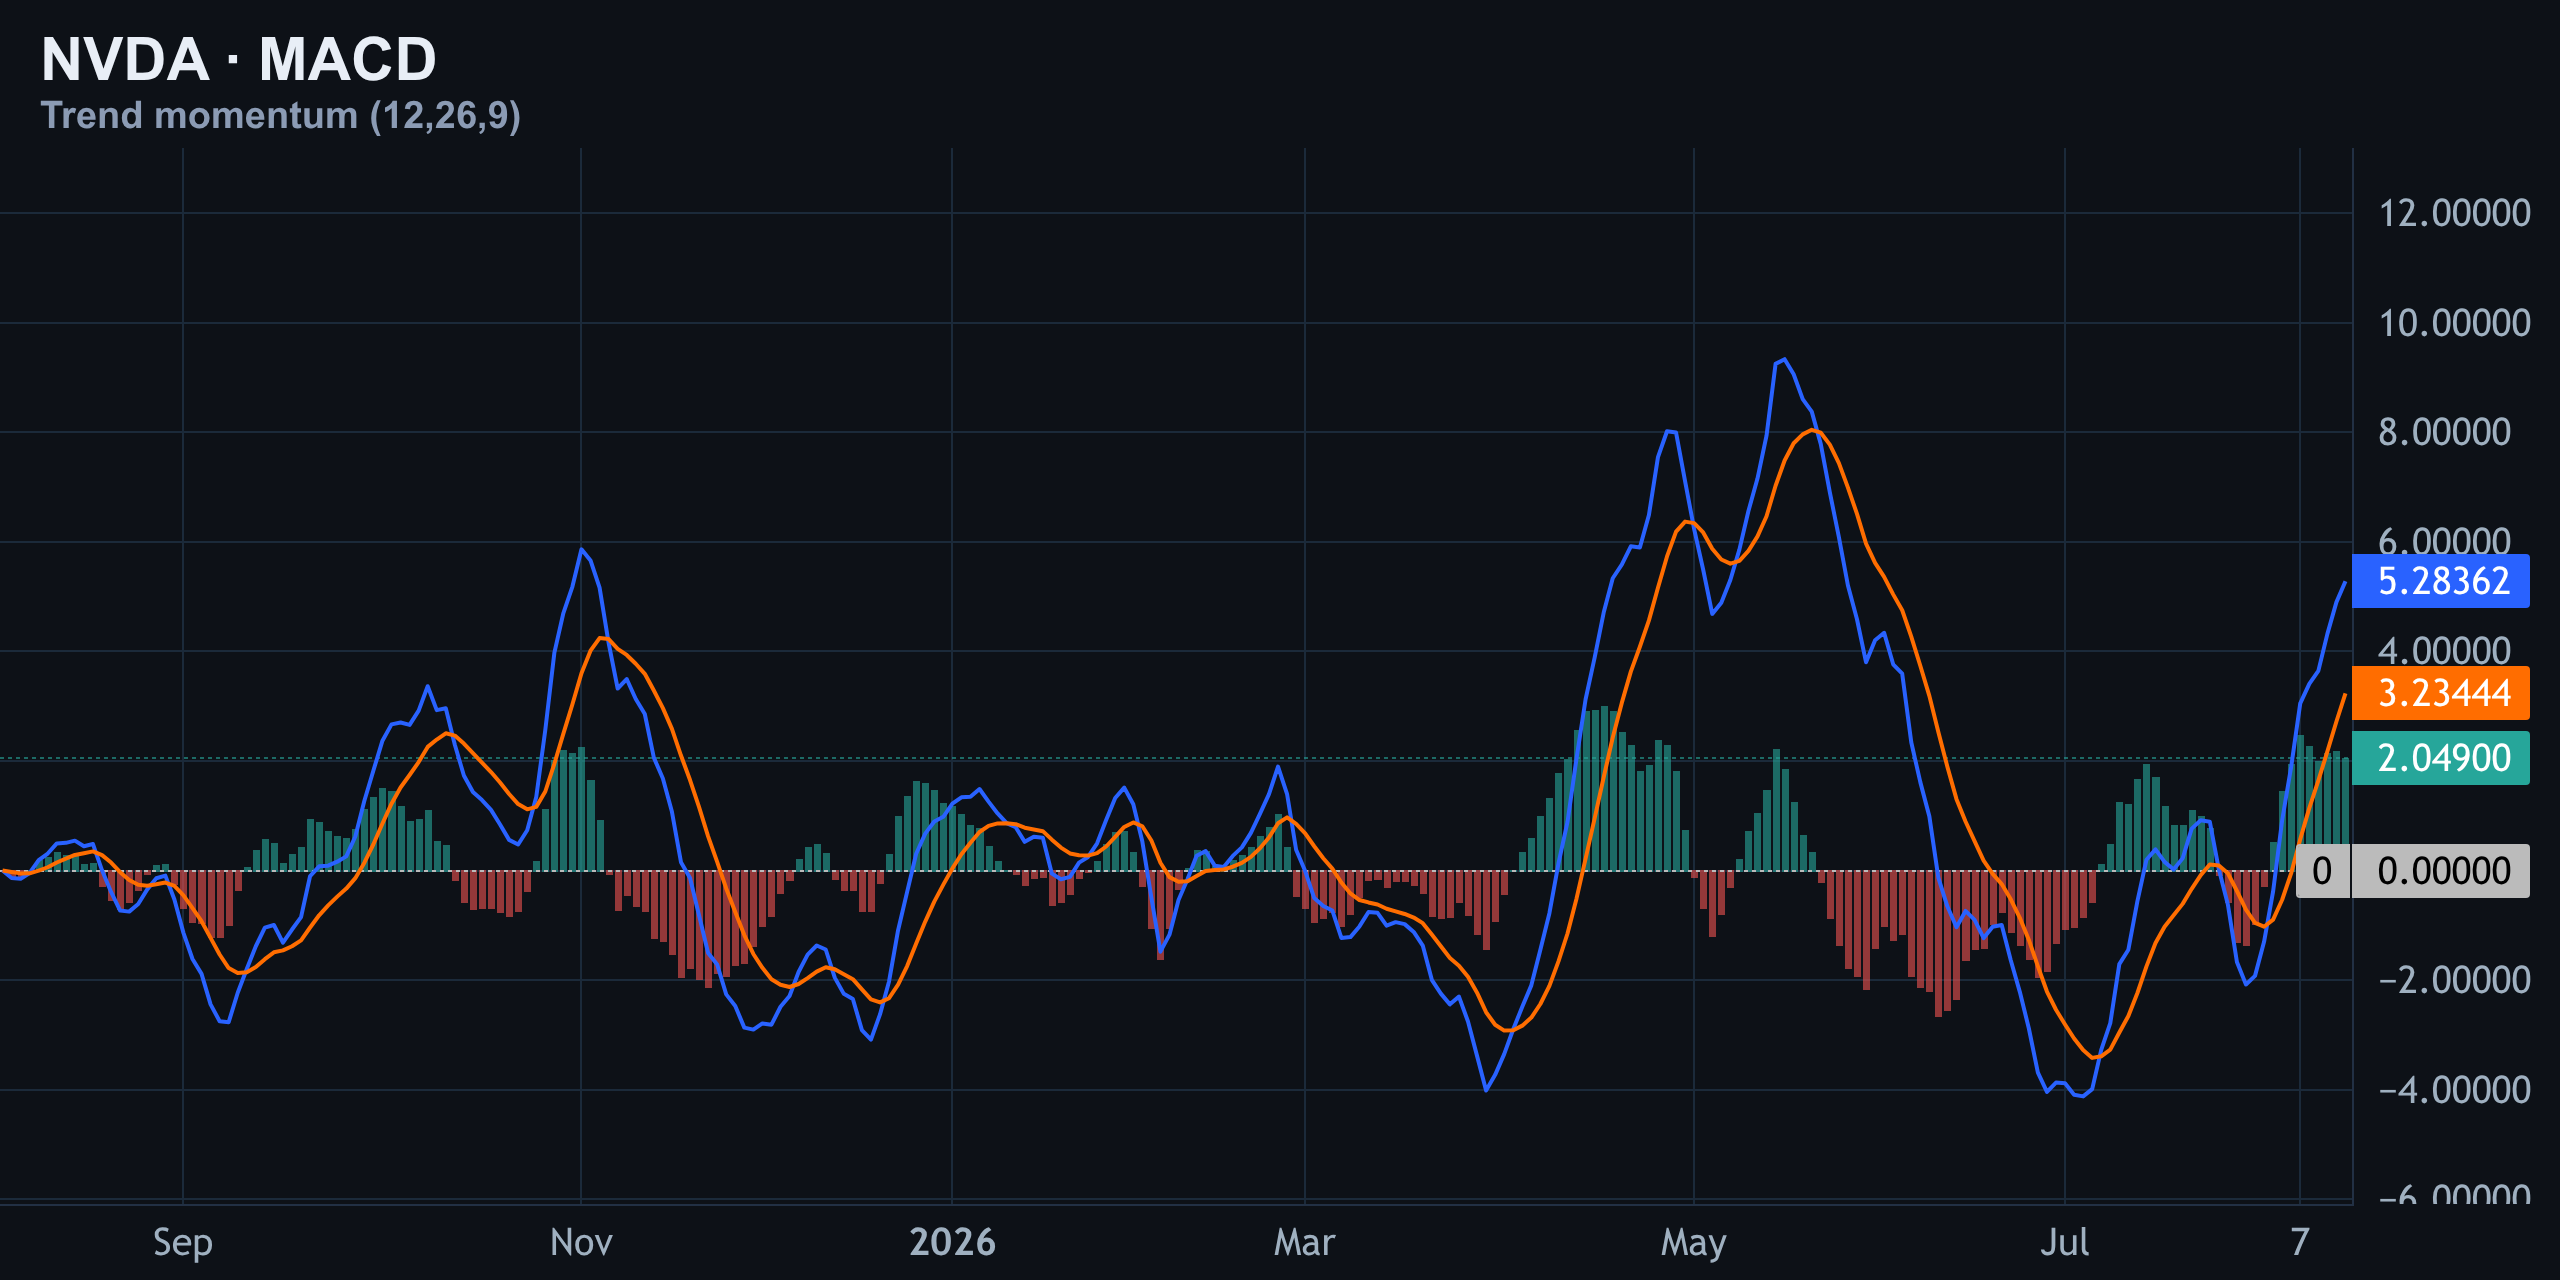
None of this is stretched. RSI at 63 is firm but nowhere near the 70+ overbought zone that typically precedes a momentum stall, and MACD's positive histogram confirms buyers are still in control on a short-term basis. The moving average stack — price above both the 50-day and 200-day — is about as clean a bullish setup as the indicator toolkit offers.
The Institutional Edge: Gamma, Call Walls, and What Dealers Are Doing
This is where the options market adds a layer most retail chart-watchers miss entirely. Dealer gamma is currently positive at an estimated $1.54 billion per 1% move, with the flip point sitting at $220. Above that flip, dealers are structurally positioned to dampen volatility — selling into rallies and buying into dips — which tends to keep price action orderly rather than explosive.
The heaviest call wall on the chain sits at $230, and it's substantial — open interest data across major options venues shows this strike absorbing enormous dealer hedging flow. That wall is effectively acting as a magnet-slash-ceiling: price gets drawn toward it, but breaking through cleanly requires enough buying pressure to force dealers to chase deltas higher, which is exactly the kind of volume surge that hasn't shown up yet.
On the downside, put support stacks up at $205, giving bulls a structural floor to lean on. Implied volatility sits around 20.5%, pricing a weekend move of roughly ±1.5% — and the term structure is in contango, meaning options markets aren't pricing in near-term panic or an imminent violent move in either direction.
| Metric | Value | Signal |
|---|---|---|
| Dealer gamma | +$1.54B per 1% move | Positive gamma dampens swings |
| Gamma flip point | $220 | Above = calmer chop; below = faster moves |
| Call wall (resistance) | $230 | Heaviest dealer hedging pressure, acts as ceiling |
| Put wall (support) | $205 | Structural floor for now |
| Implied volatility | 20.5% | Prices ~±1.5% weekend move |
| Term structure | Contango | No near-term panic priced in |
Levels to Watch This Week
Whether you're trading the bull flag or hedging against the wave B thesis, these are the numbers that actually matter right now.
| Level | Price | Why It Matters |
|---|---|---|
| Call wall / immediate ceiling | $230 | Heaviest call gamma; a clean break here with volume is the bull case confirmation |
| Gamma flip | $220 | Above it, dealer hedging suppresses volatility; below it, moves can accelerate |
| Current price | ~$225 | Sitting right at the top of the daily range and the hourly channel's upper rail |
| Put wall / floor | $205 | Structural support where dealer hedging flips protective |
| Range floor | ~$190 | Bottom of the multi-month consolidation |
| Wave C downside target (if applicable) | $114–$138 | 50%–61.8% retracement zone, only relevant if wave B has topped |
The Takeaway
Every short-term indicator on the board — moving averages, RSI, MACD, the ascending hourly channel — says NVDA's momentum favors the bulls. Price is above both key moving averages, MACD is positive, and RSI at 63 has room to climb before flashing overbought.
But the $230 call wall is a genuine obstacle, not a footnote. It's where the heaviest dealer hedging sits, and until volume forces a real break above it, the path of least resistance is more chop between $205 and $230 rather than a clean breakout. Layer on the weekly Elliott Wave count — which frames this entire rally as a possible wave B inside a larger correction — and the case for caution gets harder to dismiss, even for traders who are bullish near-term.
- Bulls want a decisive close above $230 on strong volume to invalidate the range and open a path back toward $236 and beyond.
- Bears/skeptics point to the wave B label and the $230 wall as reasons to expect another rejection back into the $205–$225 range.
- Either way, $220 is the pivot that likely decides whether the next move is calm or fast.
Key takeaways
- NVDA trades near $225, above both its 50-day ($206.50) and 200-day ($194.74) moving averages — a bullish short-term posture.
- The $230 strike is the heaviest call wall on the options chain; a volume-backed break above it is the key bullish confirmation signal.
- Dealer gamma flips at $220 — above it, moves stay calmer; below it, volatility can accelerate quickly.
- The weekly Elliott Wave count labels the entire 2025–2026 rally as a possible wave B, meaning a deeper wave C correction toward $114–$138 remains a longer-term structural risk.
- RSI (63) and MACD (positive, above signal) both support near-term bullish momentum without being overextended.
Frequently asked questions
Why is $230 such an important level for NVDA?
It's the strike with the heaviest call open interest, meaning dealers hold the largest hedging exposure there. That makes it act as both a magnet and a ceiling — price often gets drawn toward it but struggles to break through without a real volume surge.
What does the gamma flip at $220 actually mean for traders?
Above $220, dealers are in positive gamma, meaning they sell into rallies and buy into dips, which dampens volatility. Below $220, that dynamic can reverse, potentially accelerating moves in either direction.
Is NVDA still in a long-term uptrend according to Elliott Wave theory?
The weekly count suggests the 2023–2025 five-wave impulse already completed, and the current rally off the $86.50 low may be a corrective wave B rather than a new impulsive trend — implying a wave C decline toward $114–$138 remains a risk down the road.
What would confirm a genuine bull flag breakout for NVDA?
A decisive close above the $230 call wall on strong volume, ideally holding above that level on a retest, would confirm the breakout and open the path back toward the $236 May high.
What's the downside support level to watch if NVDA pulls back?
The $205 put wall is the nearest structural floor, with the broader range floor near $190 as a secondary support level.