
Analysis
NVDA at $225: Breakout Fuel or Gamma Trap Above?
Nvidia Is Sitting Right at the Line That Matters
Nvidia closed near $225.16 this week, right at the ceiling that capped the stock for most of the summer. That is not a random number. It is the exact level where price stalled repeatedly between May and July, and now it is also sitting on top of a dealer gamma flip point that options desks are watching closely.
The setup is simple to state and hard to trade: Nvidia is technically bullish on every timeframe we track, yet the options market is structurally positioned to slow the stock down right where it is. That tension is the whole story of this article.
Daily Structure: Buyers Just Reclaimed the Range Ceiling
Zoom out to the daily chart and the story is a slow grind higher interrupted by one long pause. Nvidia rallied hard from March into a peak of $236.26 in May, then spent June and July chopping sideways inside a range roughly bounded by $205 on the downside and $225 on the upside.
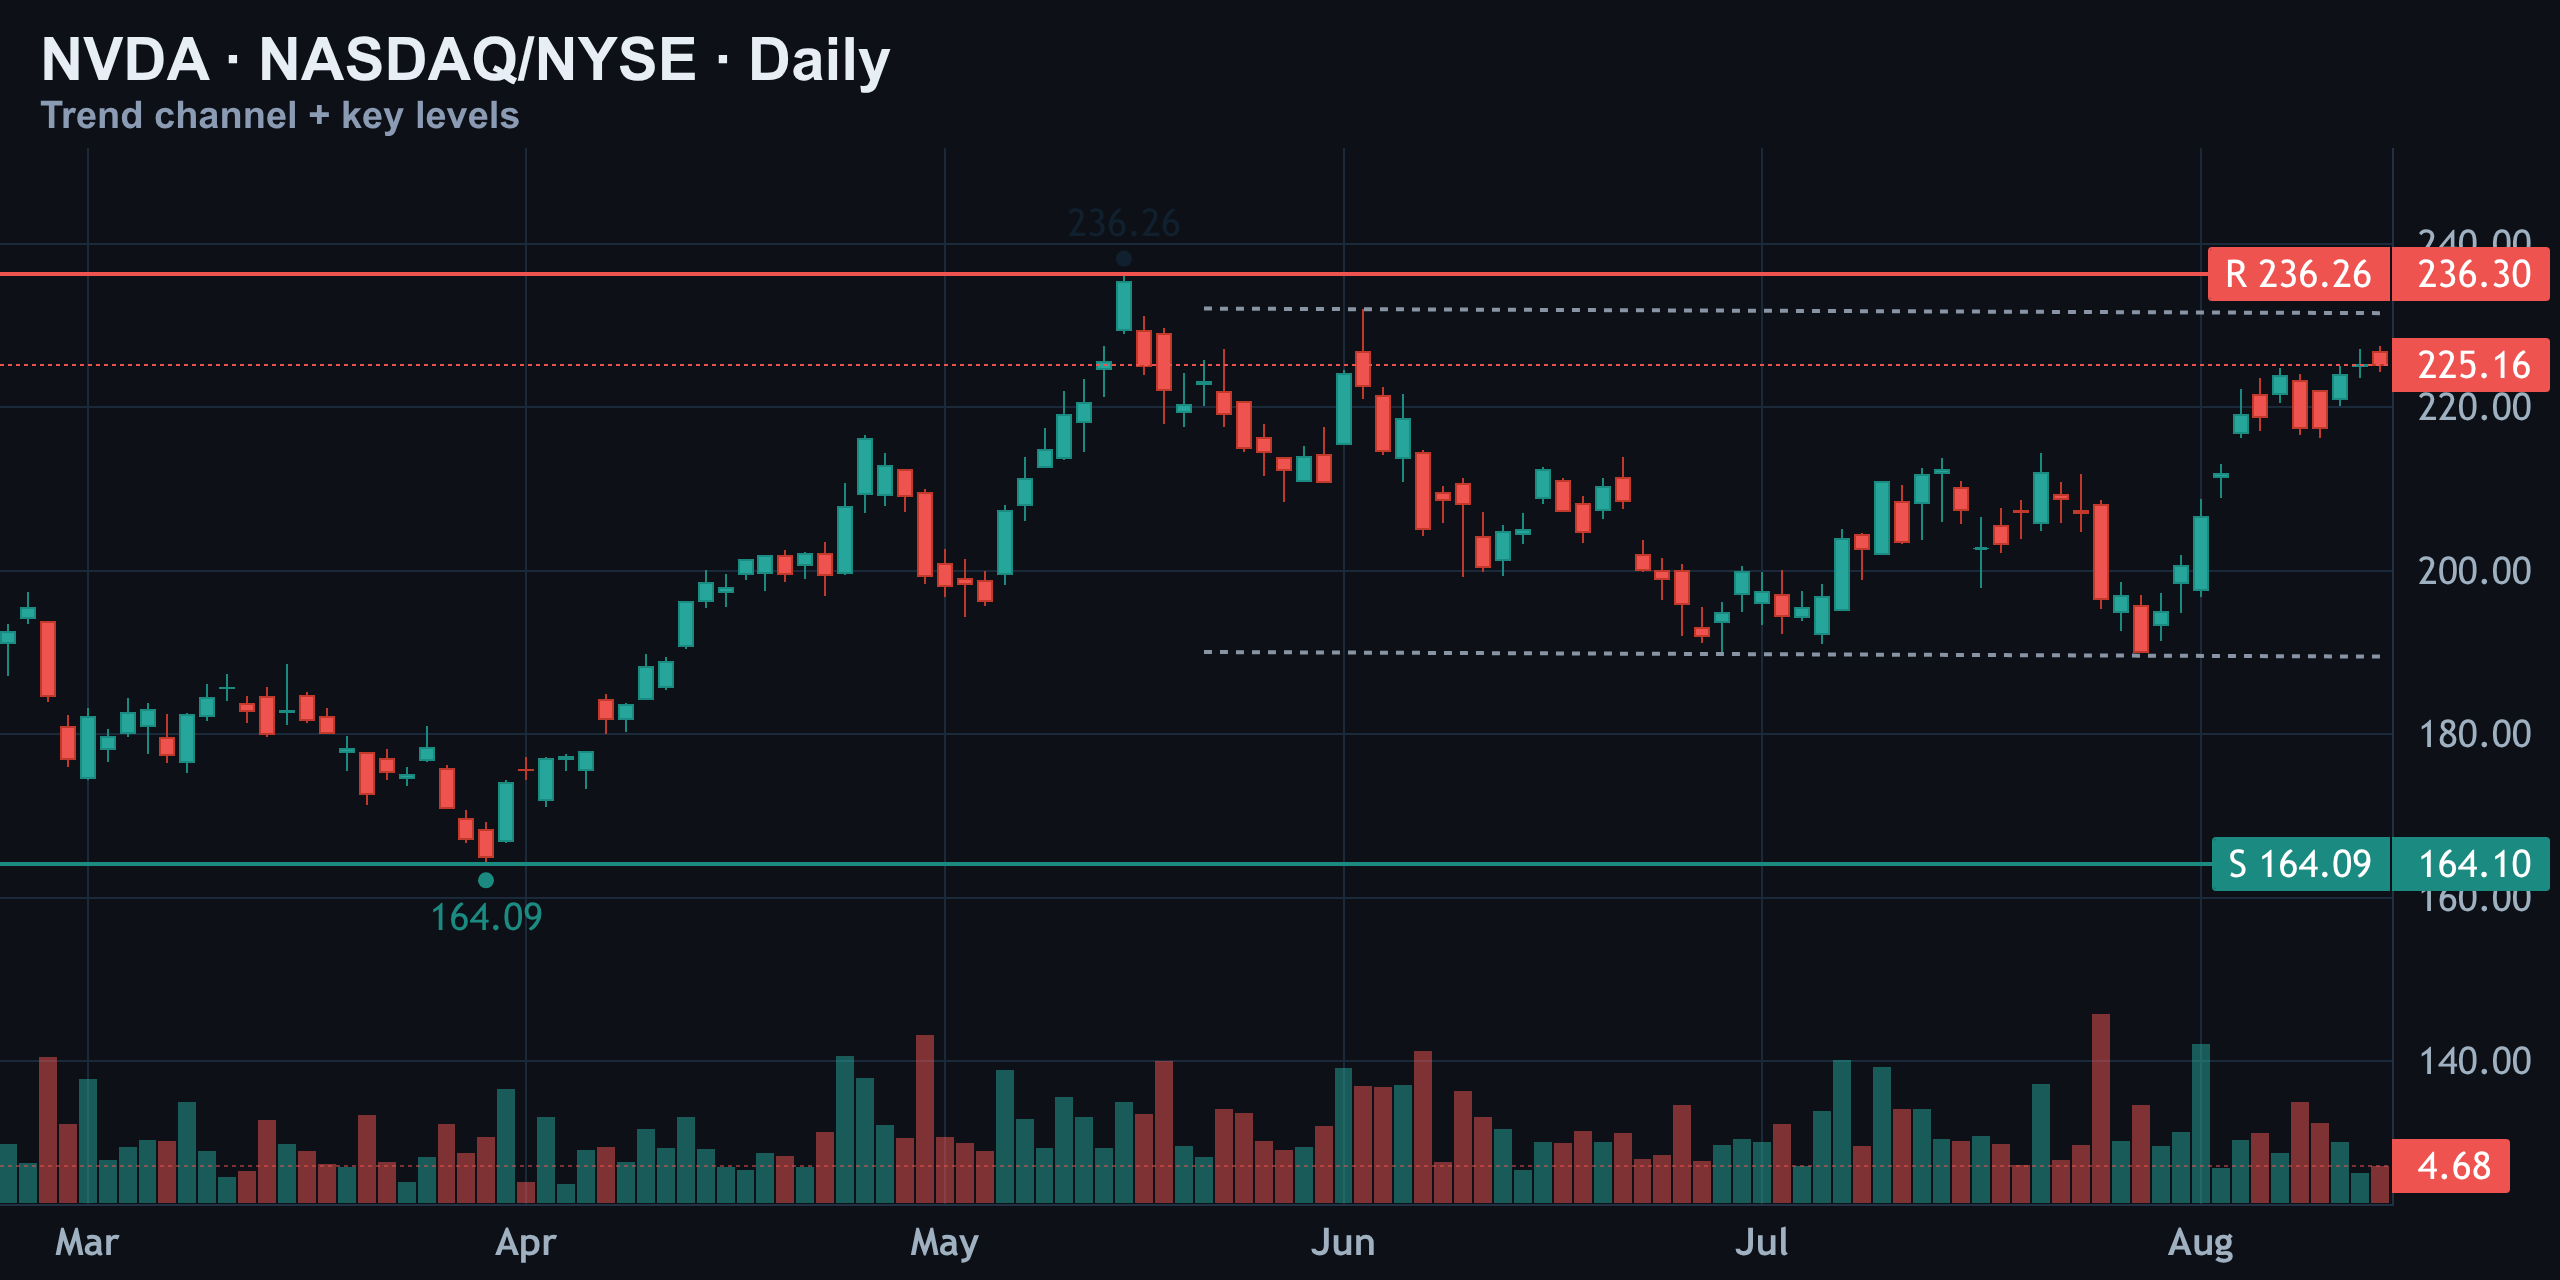
That's exactly what just happened. Price broke back above the upper dotted line of that range, which is a meaningful technical event — it tells you buyers absorbed months of overhead supply and are back in control. Historical closes confirm the grind: $225.16 on August 14, $225.30 on August 13, and $224.09 on August 12, a tight coil right under the range top before the push through.
- Range ceiling ($225) has now flipped from resistance to a level buyers are defending
- This is the first clean breakout attempt since the May peak
- A daily close that holds above $225 would confirm the range is over, not just tested
1-Hour Structure: Stretched, But the Trend Is Undeniable
Drop down to the hourly chart and the short-term picture gets even more interesting. Nvidia bottomed near $190 at the end of July and has since carved a textbook rising channel — a clean sequence of higher lows all the way into mid-August.
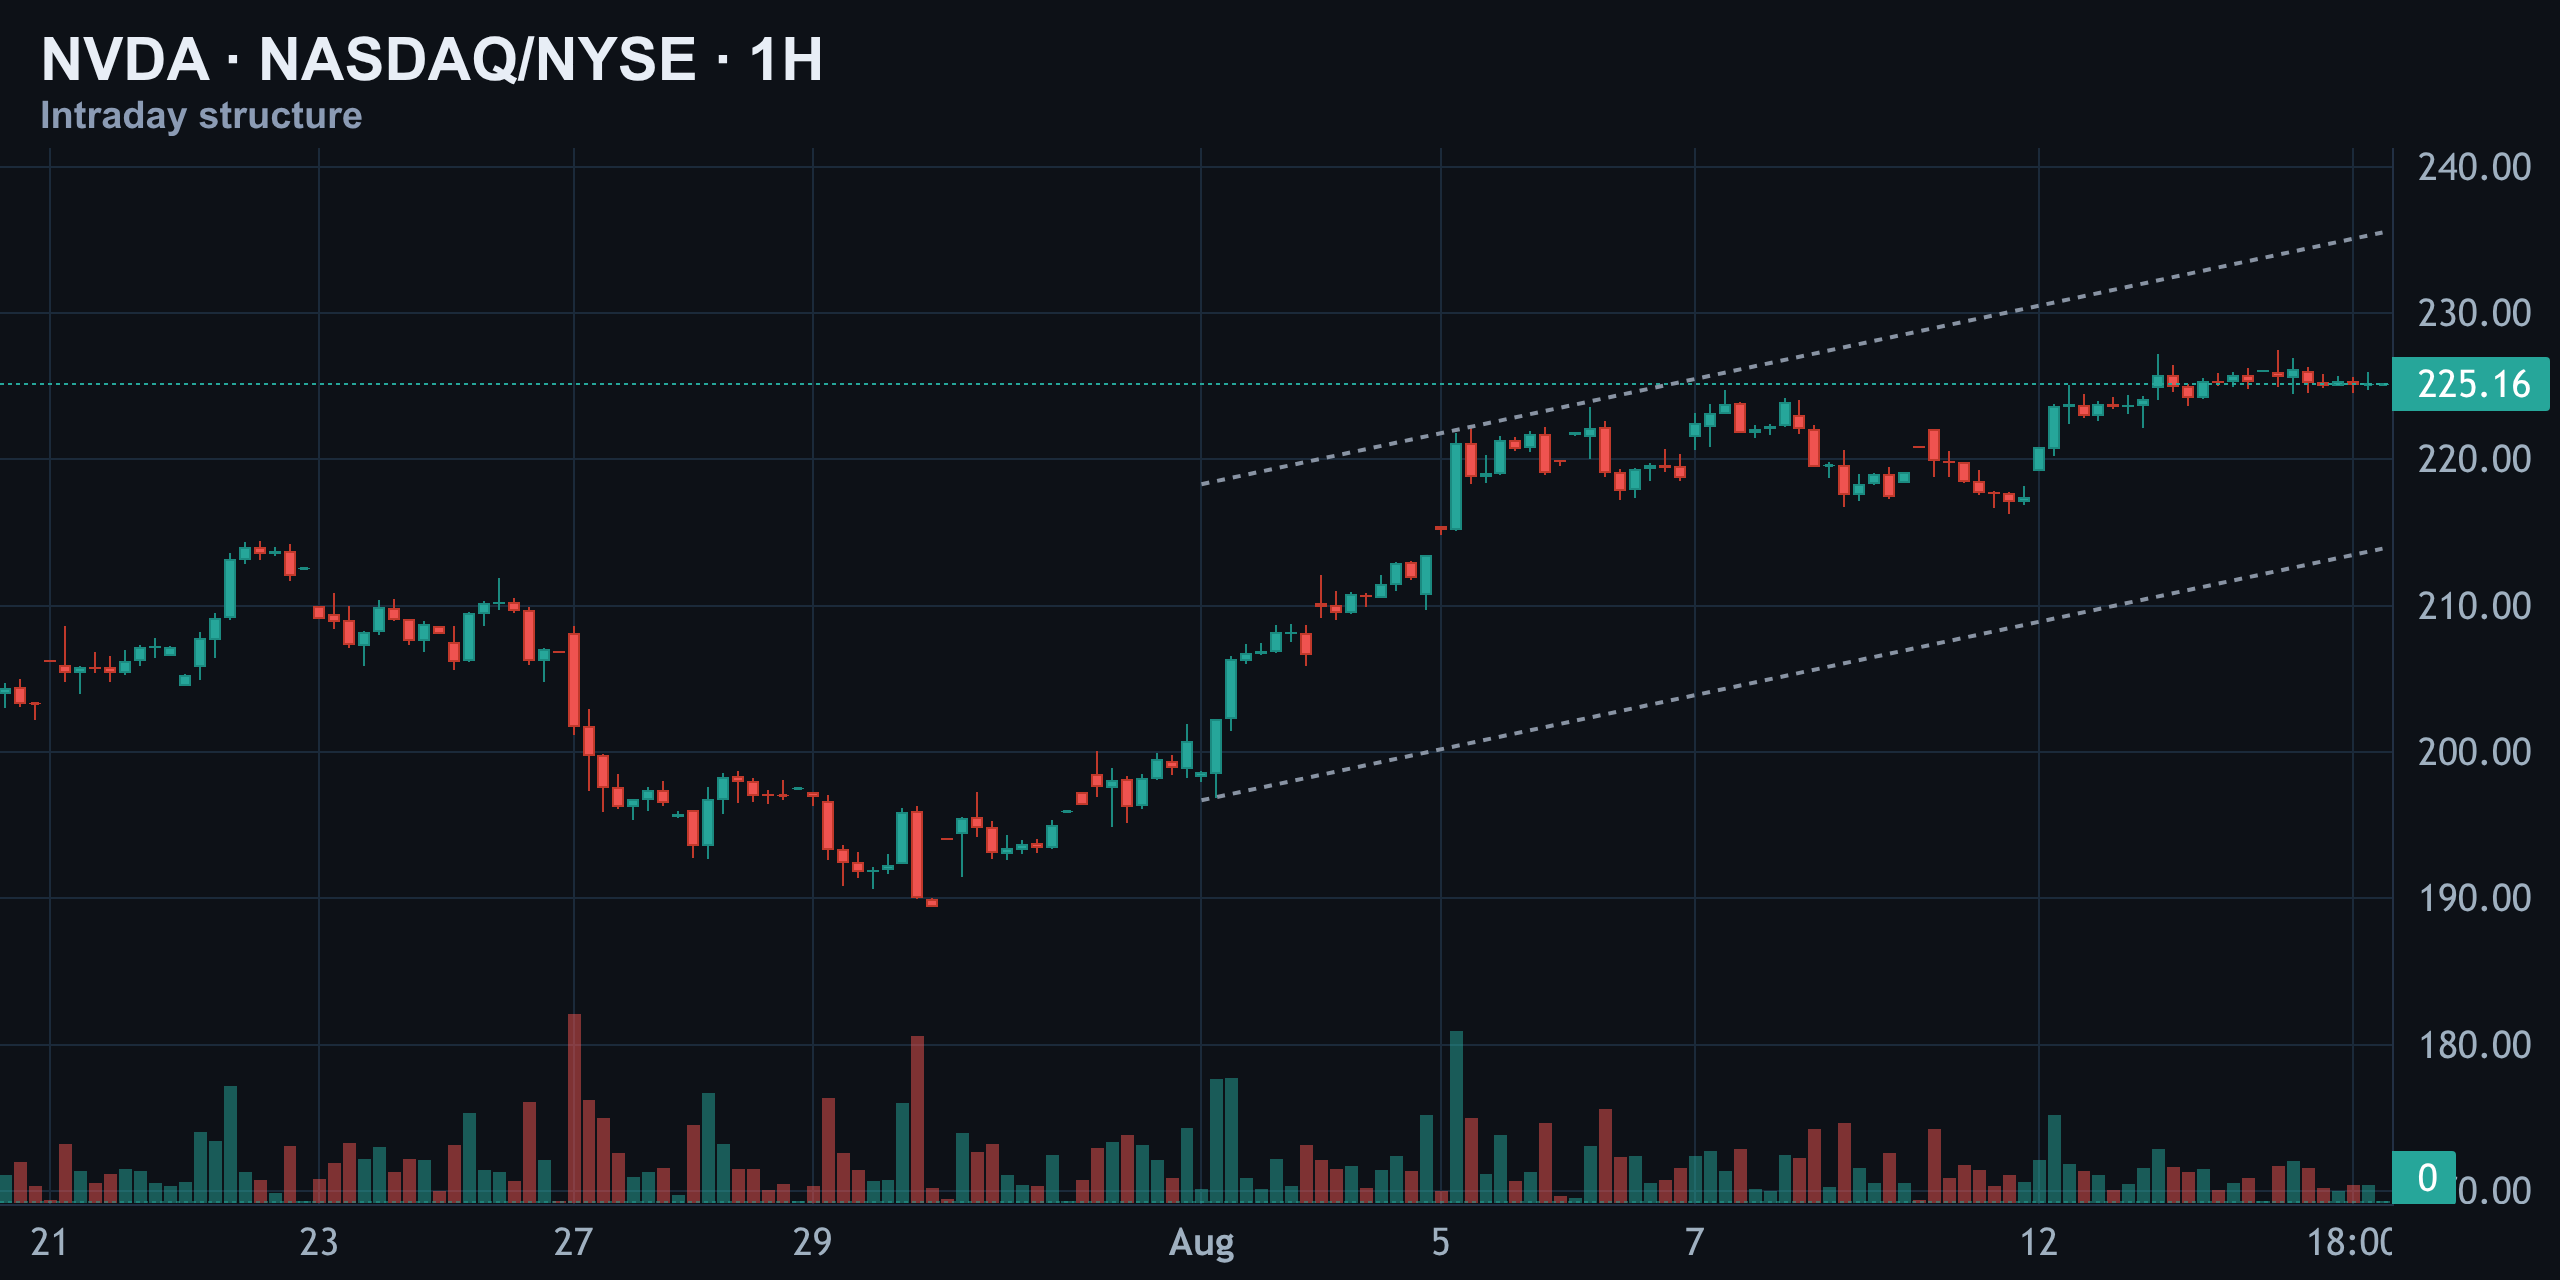
Price is now pressing directly against the top rail of that channel, right at $225. That combination — strong trend, but stretched against its own channel wall — is a classic setup for either a decisive breakout or a short-term cooldown back toward the channel's midline. Nasdaq's real-time tape shows the stock trading around $224.79 with active volume of roughly 3.47 million shares, consistent with a market still deciding which way to lean.
Weekly View and the Elliott Wave Count
On the weekly chart, the bigger structural story supports the bulls. The primary Elliott Wave count shows a five-wave advance from around $14 up to $152.87, followed by a sharp A-wave decline to $86.50, and then a powerful B-wave rally that clawed all the way back to match the old high at $236.26.
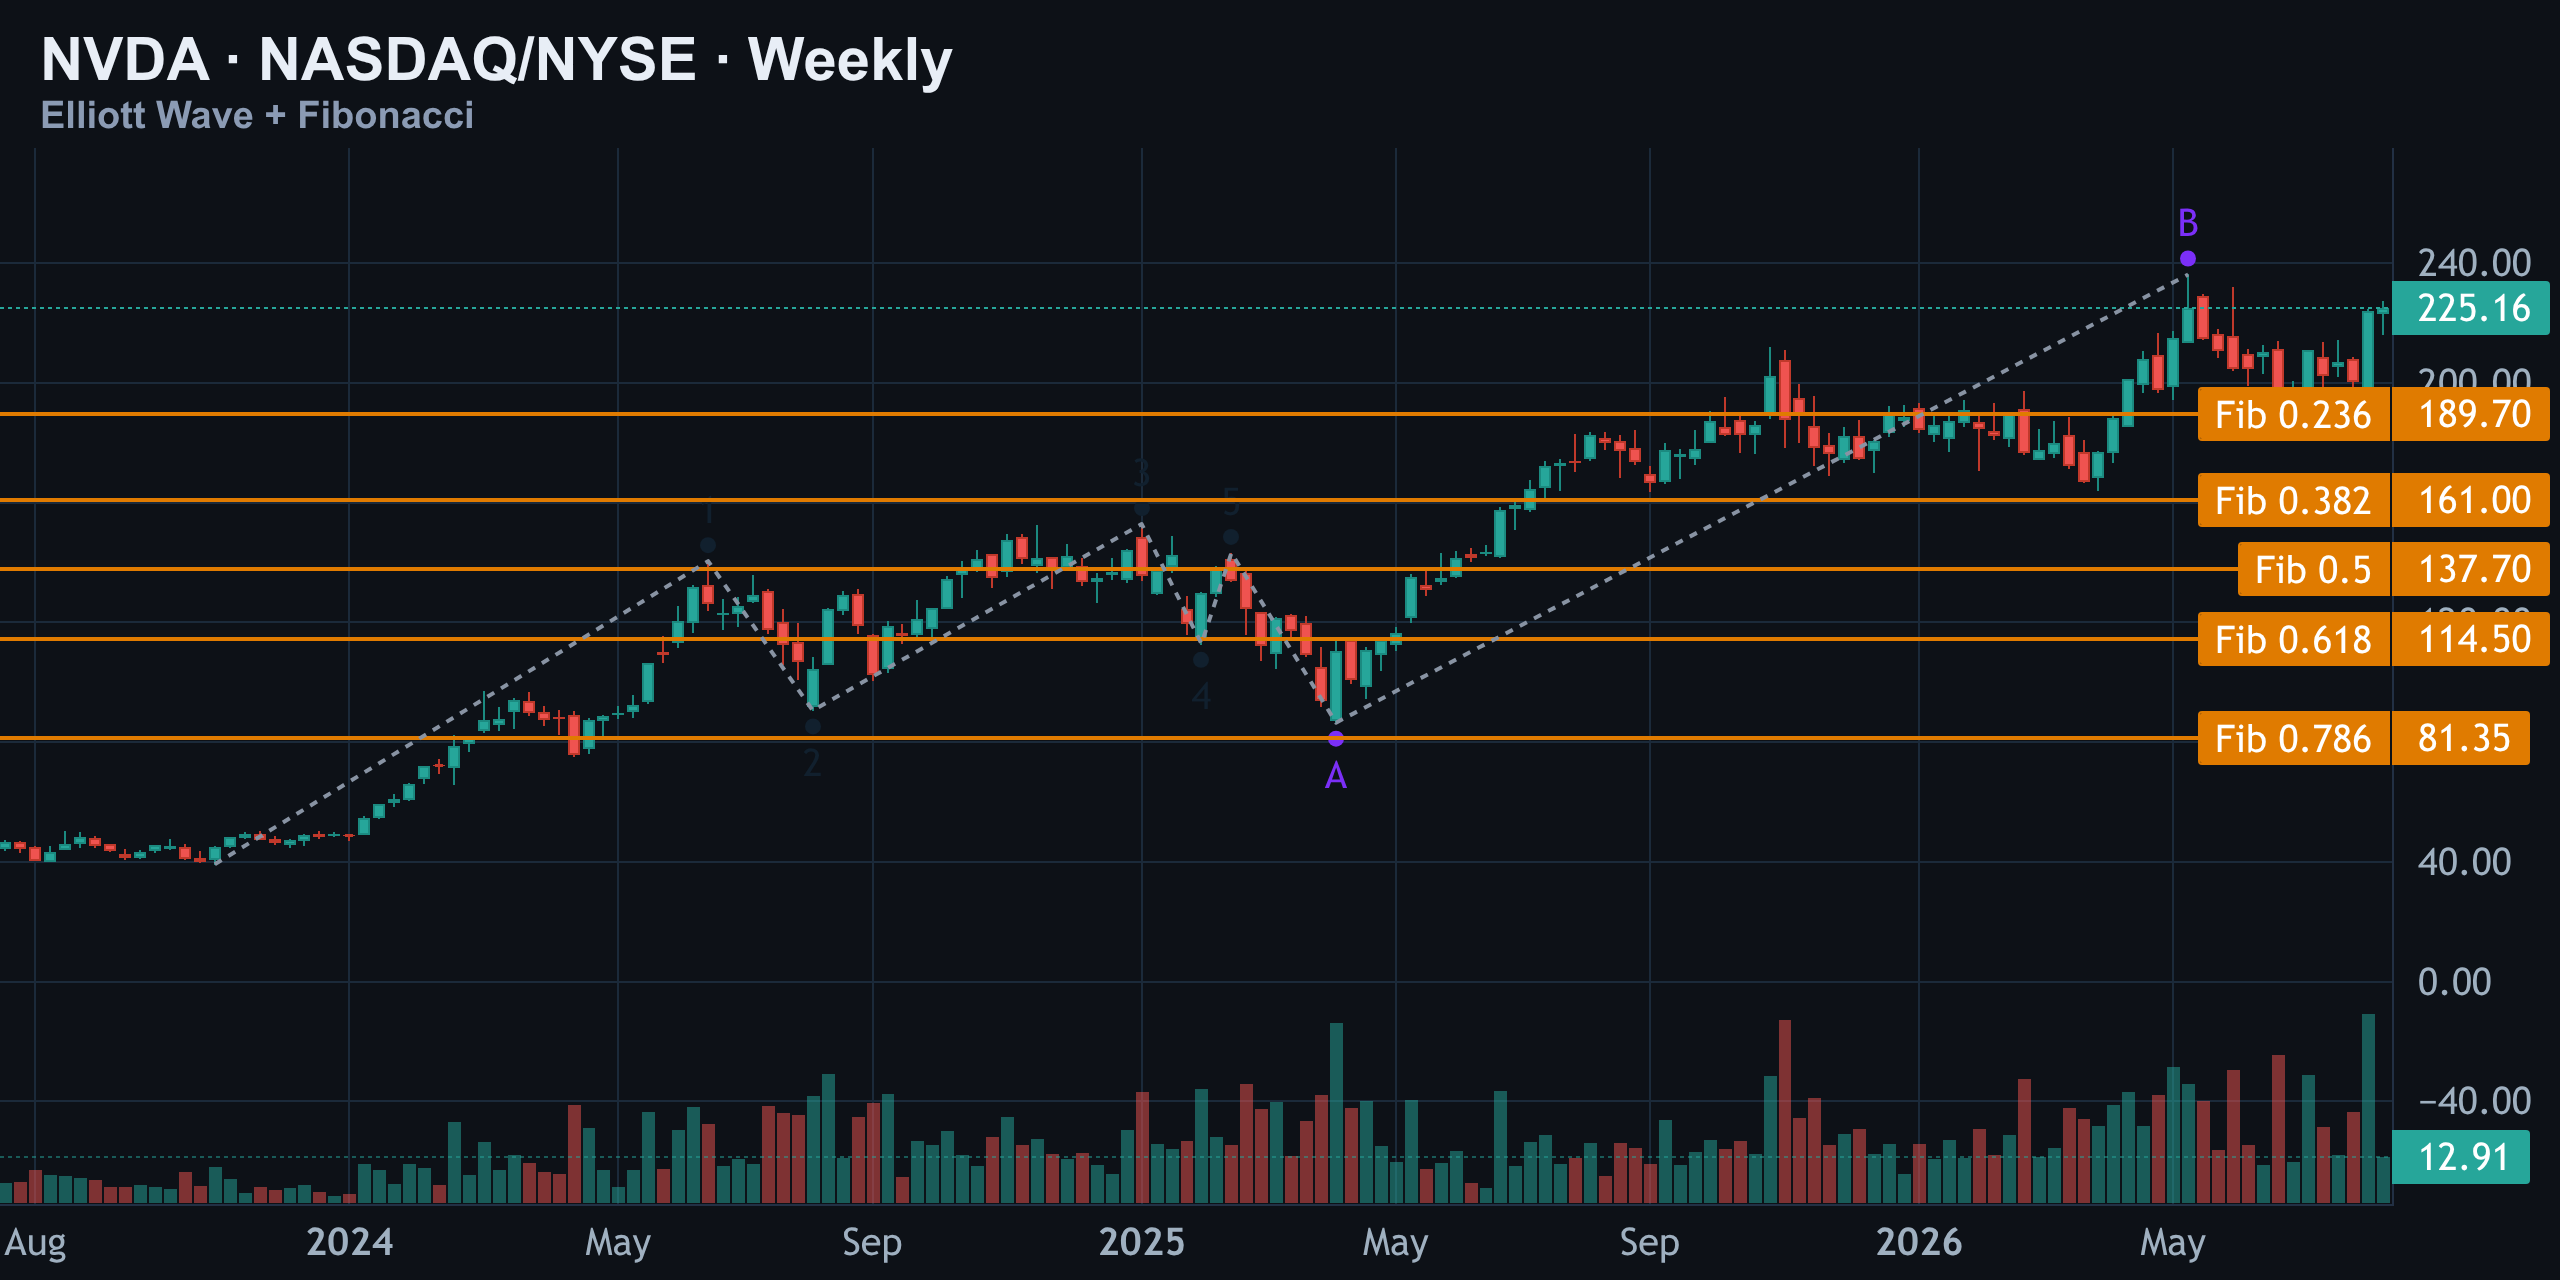
Price has since cooled off from that B-wave peak and is now sitting just under the 0.236 retracement level near $189.70 — which is well below current price and, importantly, confirms the broader uptrend is still intact. The open question for wave counters is whether this pullback resolves as a shallow C-wave dip before the next leg, or whether bulls simply push straight into a new five-wave extension above the old highs.
| Wave | Level |
|---|---|
| Wave 5 top (prior impulse) | $152.87 |
| A-wave low | $86.50 |
| B-wave high (matched prior ATH) | $236.26 |
| 0.236 retracement | $189.70 |
| Current price | $225.16 |
Moving Averages, RSI, and MACD: Momentum Without Panic
The moving average picture is unambiguous. Nvidia trades at $225.16 against a 50-day MA of $206.50 and a 200-day MA of $194.74 — comfortably above both, which is the textbook definition of a bullish trend structure.
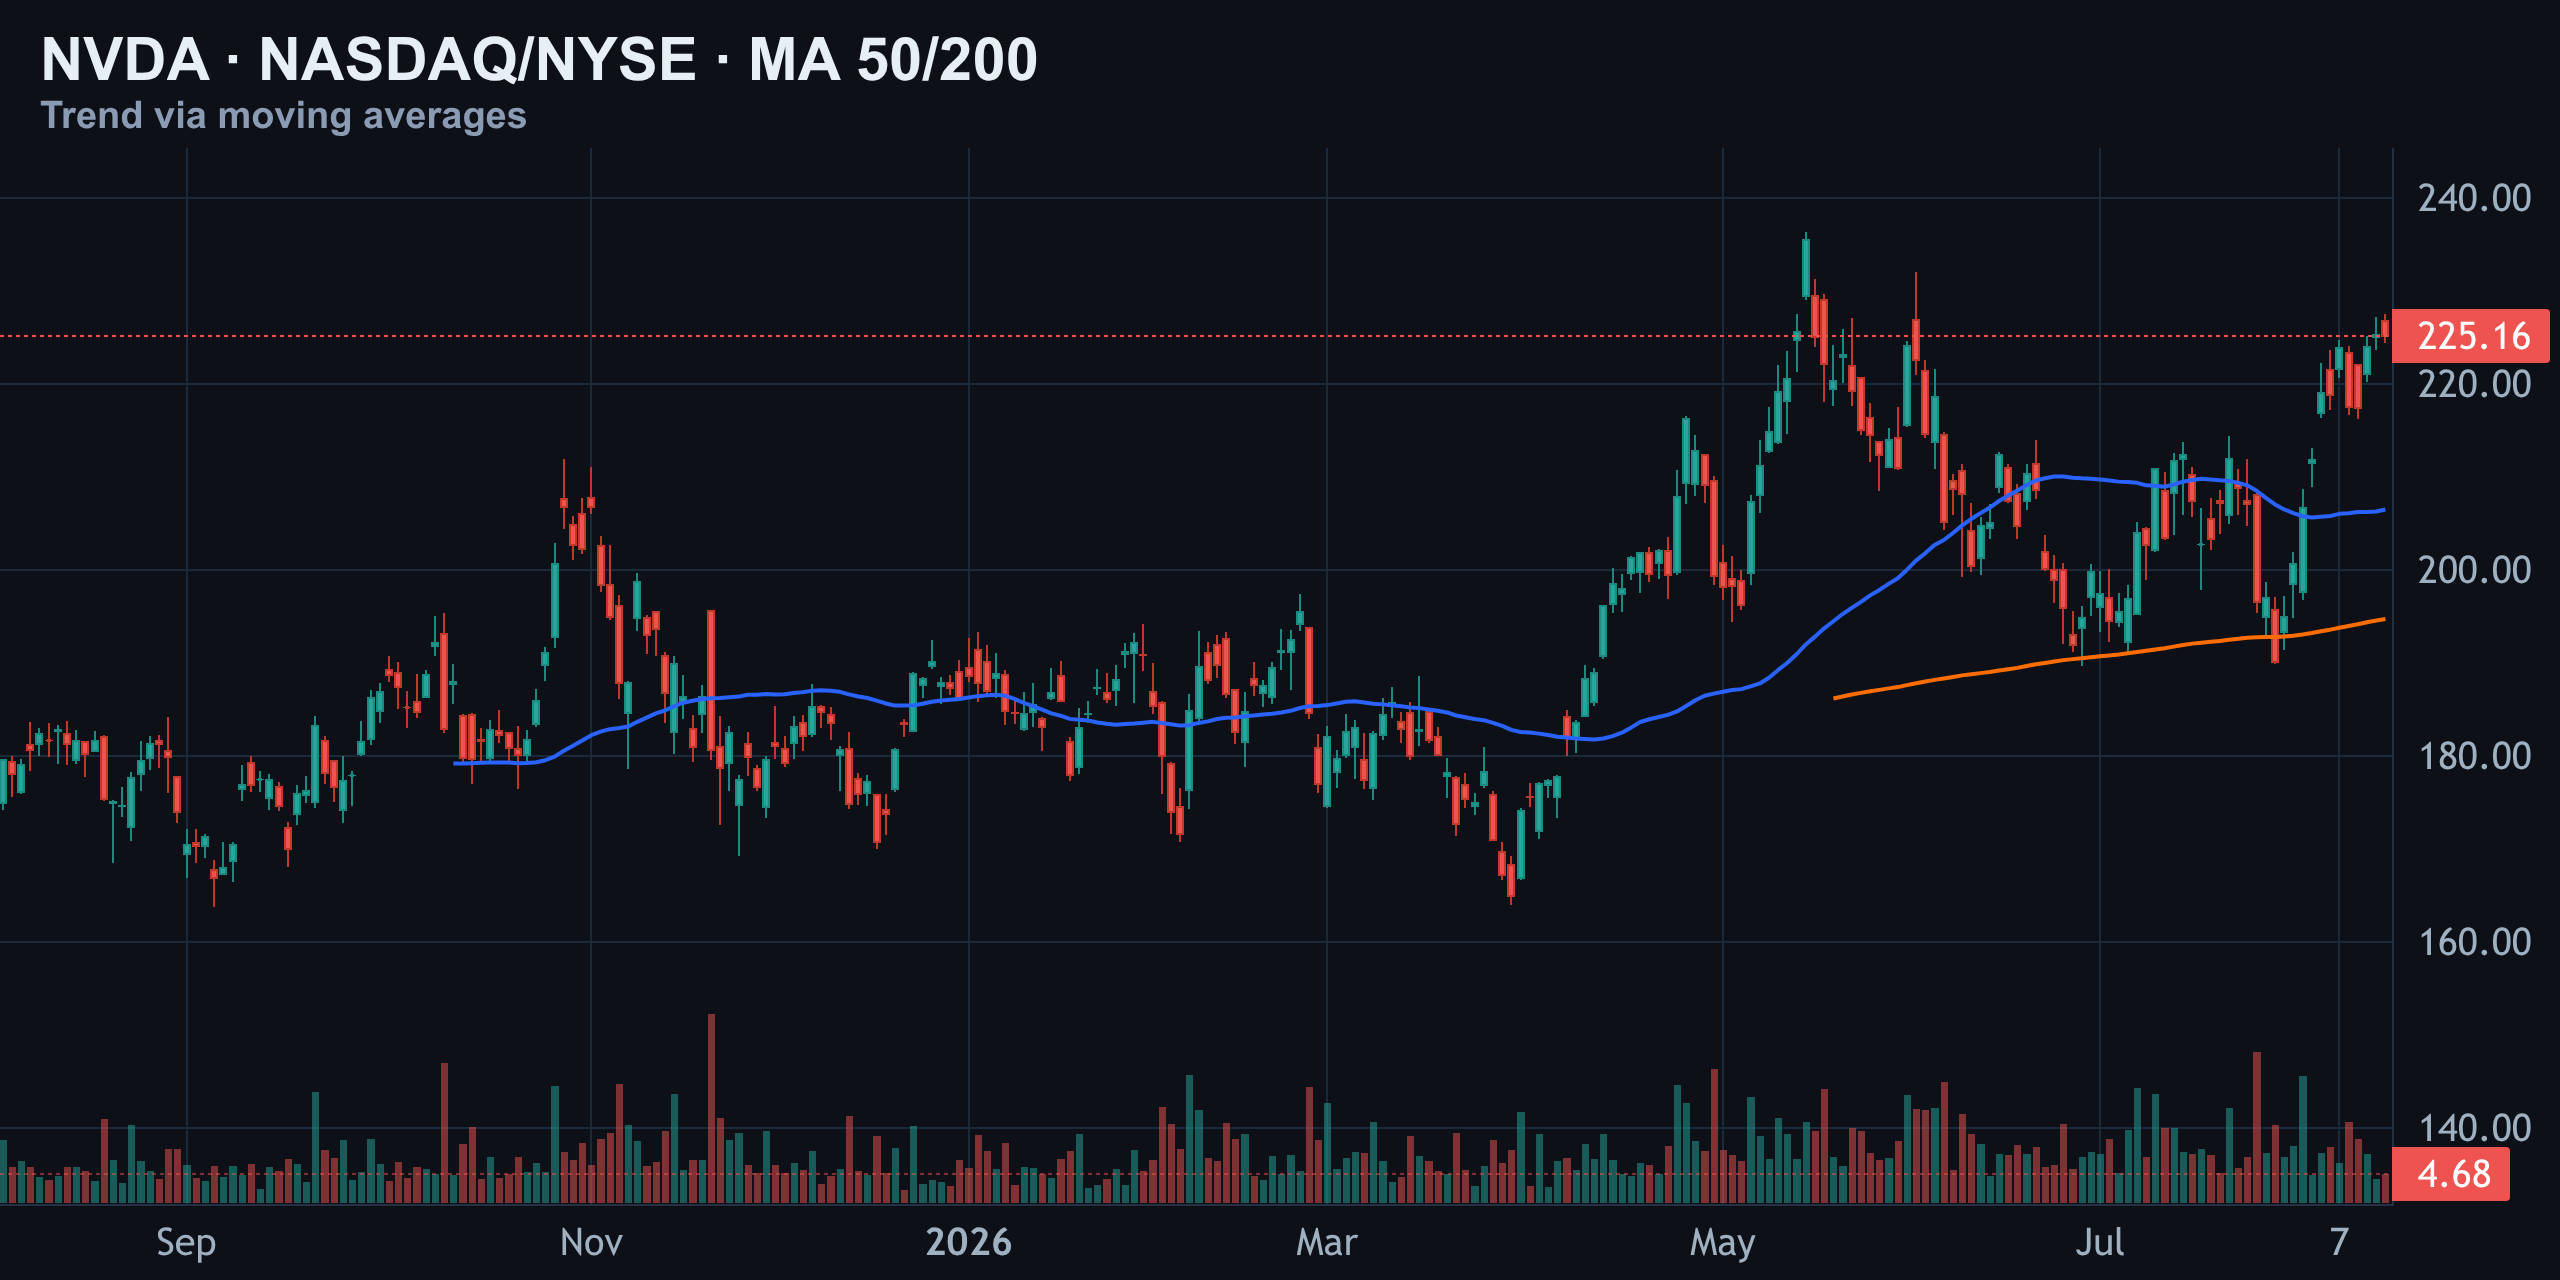
| Metric | Value | Read |
|---|---|---|
| Price | $225.16 | Above both MAs |
| 50-day MA | $206.50 | Bullish trend filter |
| 200-day MA | $194.74 | Long-term uptrend intact |
| RSI (14) | 63 | Neutral-to-strong, not overbought |
| MACD | Above signal line | Positive histogram, momentum building |
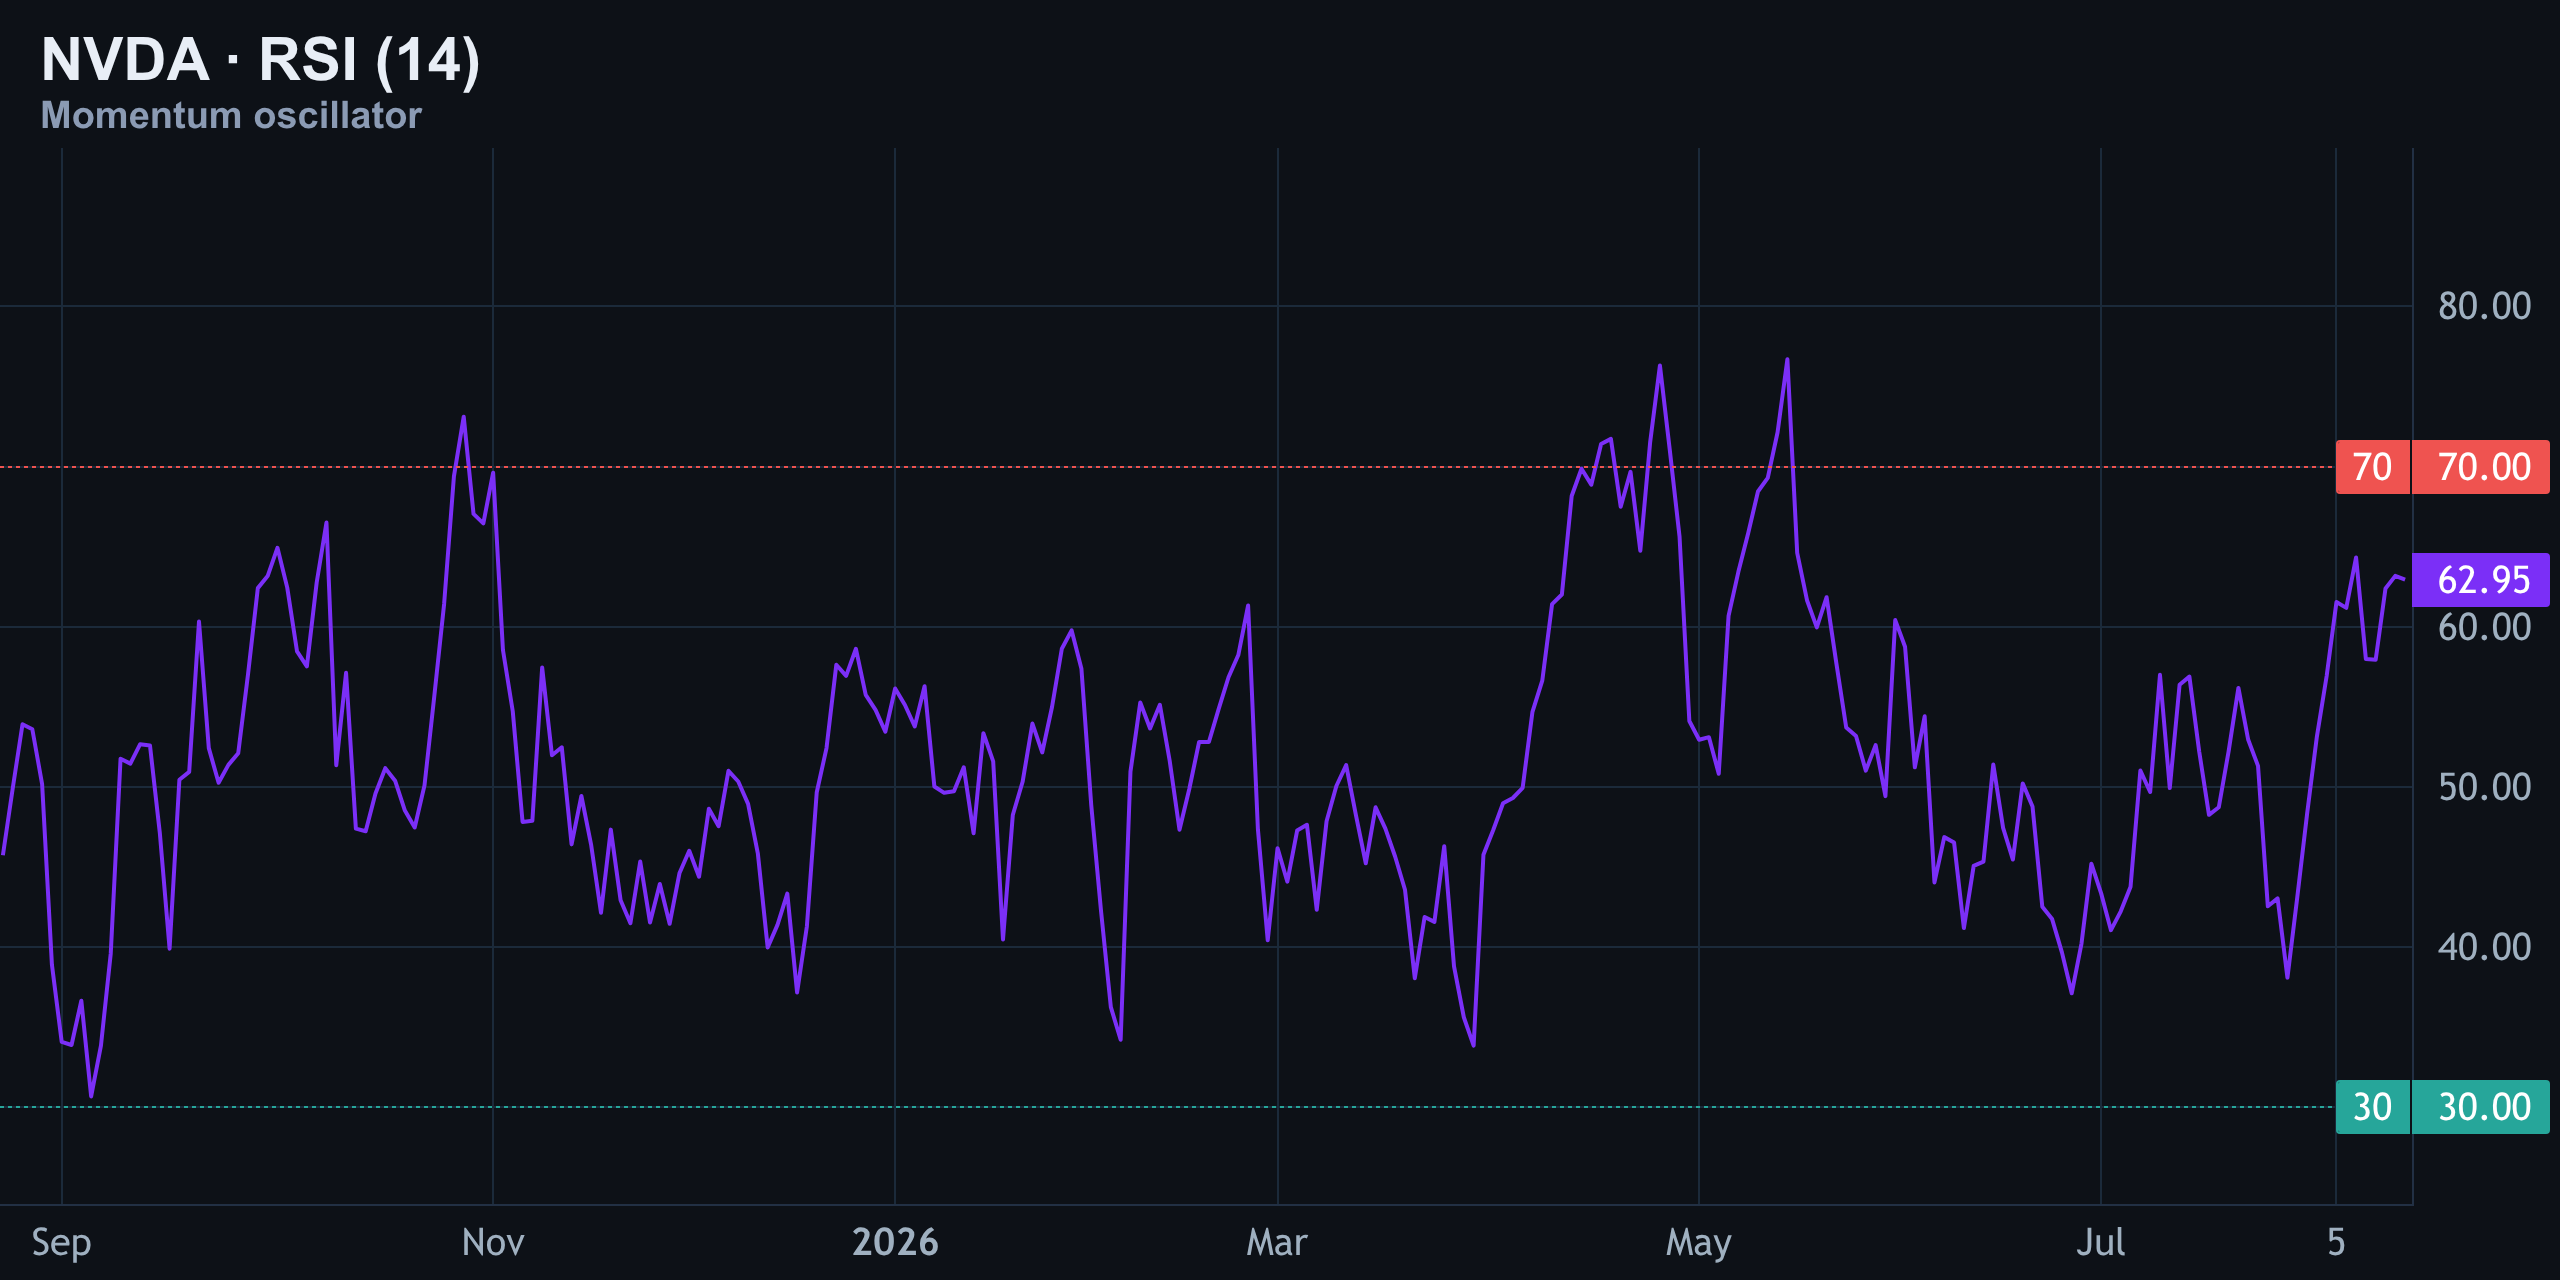
RSI at 63 is the detail that matters most for near-term risk. It's elevated enough to show real buying pressure, but nowhere near the 70+ zone that usually precedes sharp exhaustion pullbacks. That leaves room for the stock to keep climbing without immediately triggering overbought-driven selling.
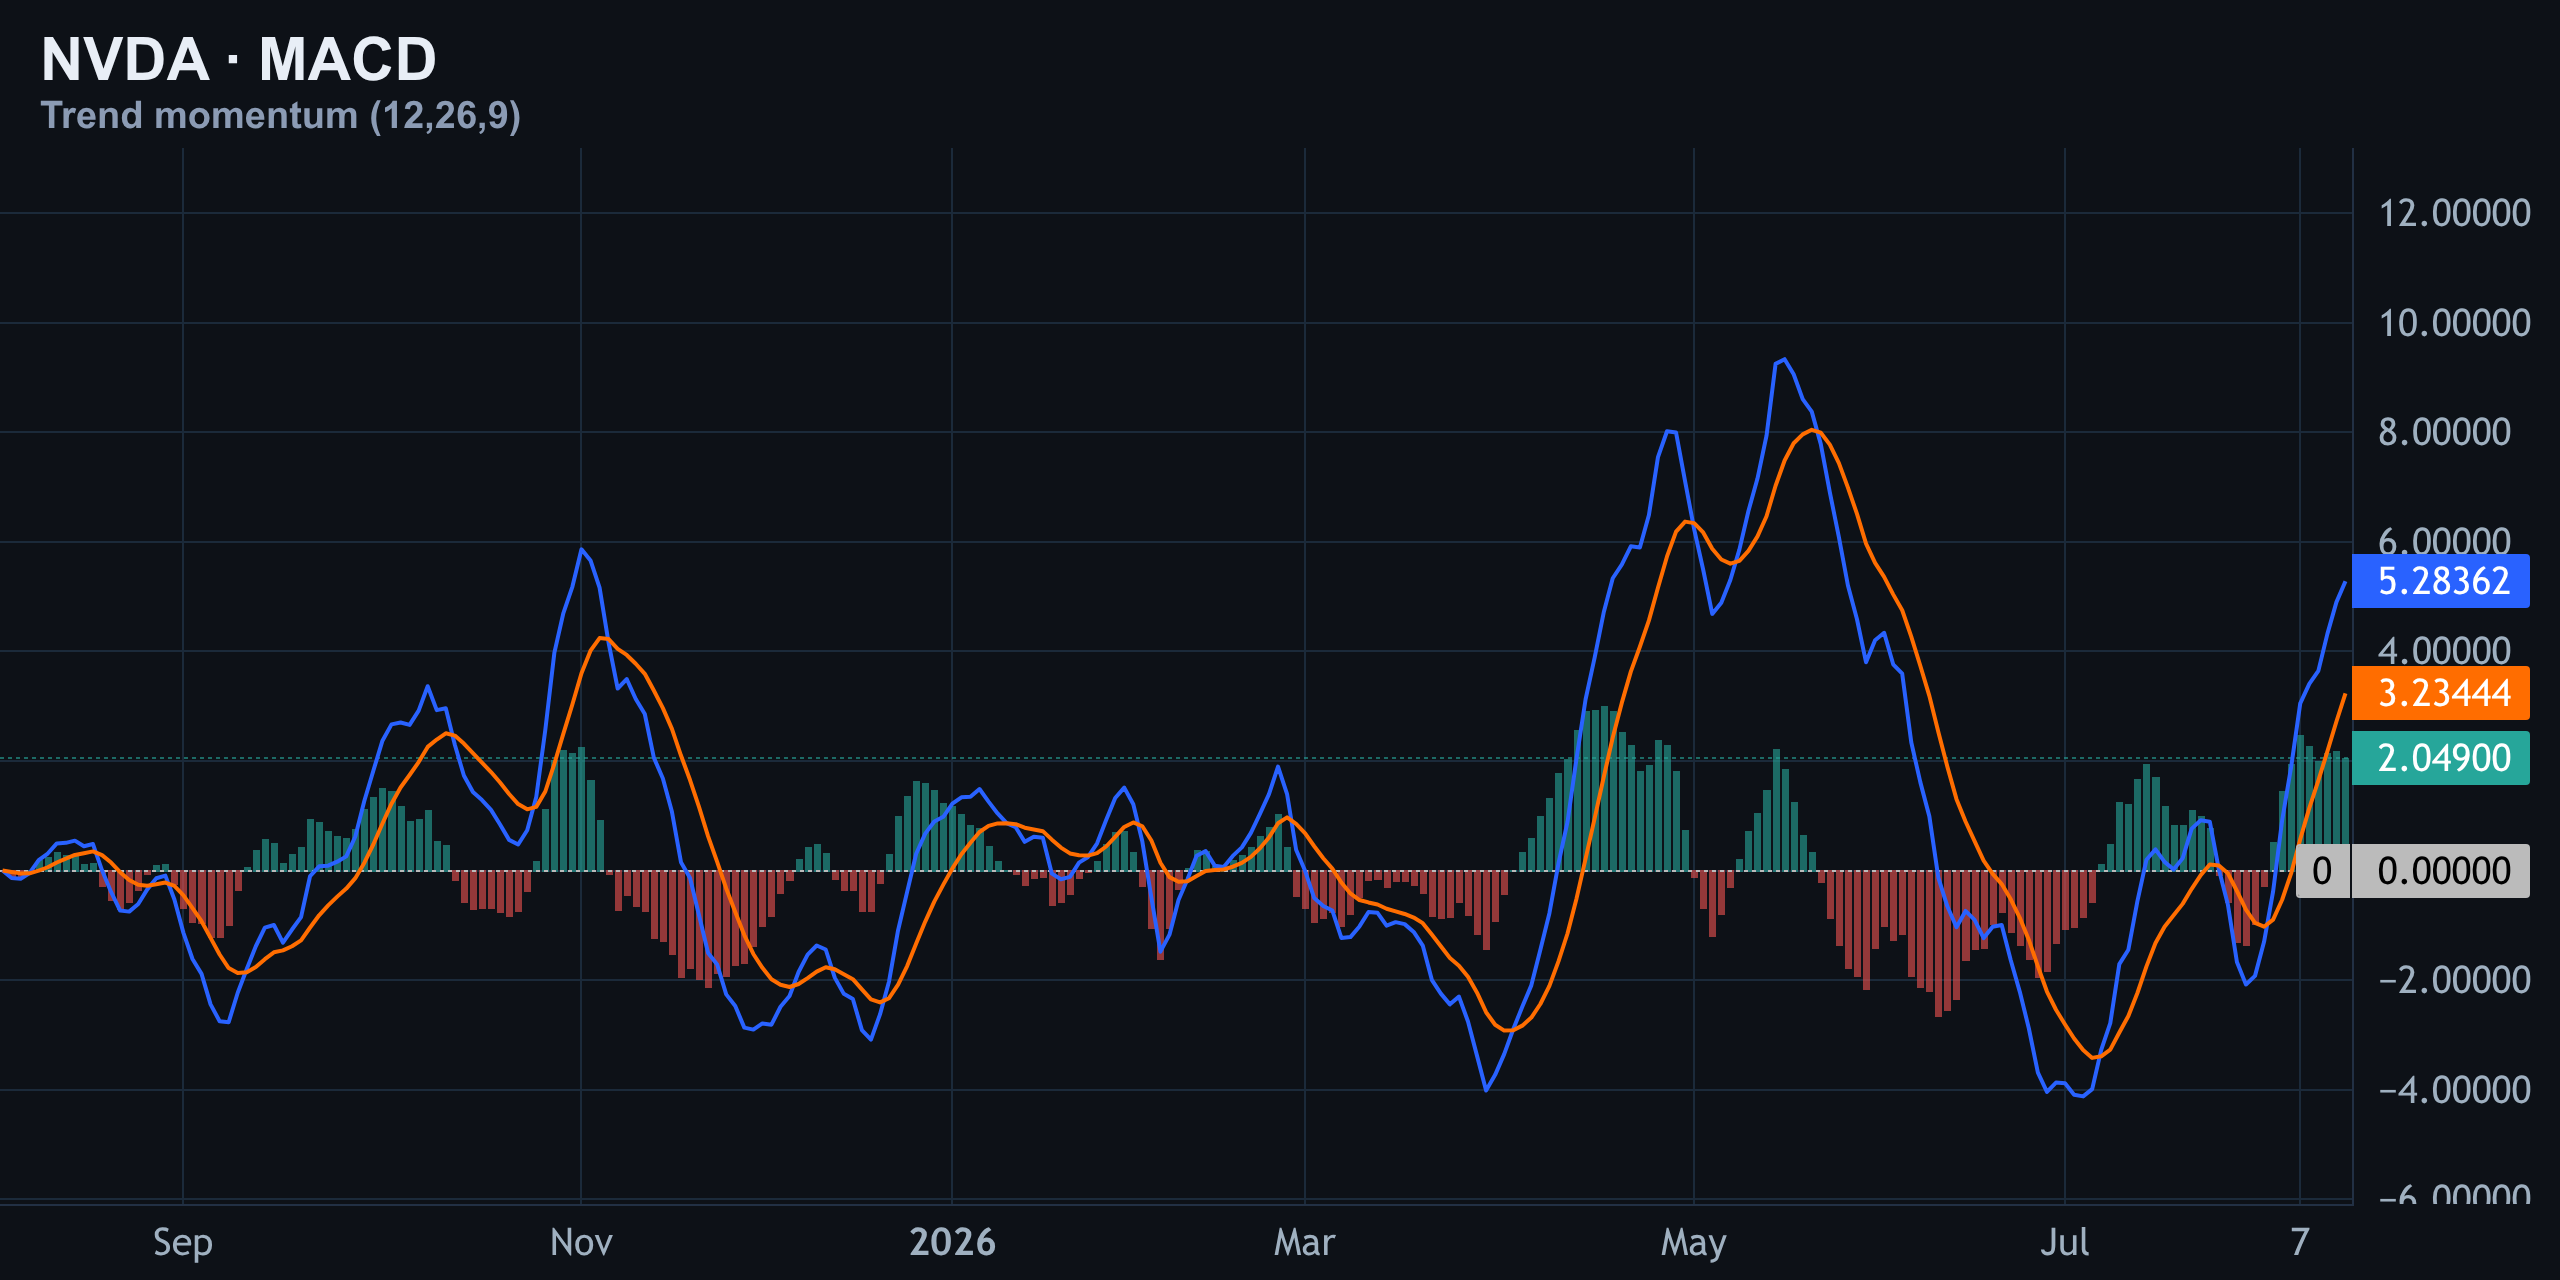
MACD confirms the same story: the line is above the signal with a positive histogram, meaning momentum is still building rather than fading. Nothing here screams exhaustion — but nothing screams runaway melt-up either. It's a controlled climb.
The Institutional Edge: Why $220 Is the Number That Actually Matters
Here's the part most retail chart-watchers miss entirely, and it's the real hinge of this whole setup. Options dealers are currently sitting on positive net gamma of roughly $1.54 billion per 1% move in NVDA, with the flip point sitting at $220.
In plain English: above $220, dealers who are long gamma tend to sell into rallies and buy into dips to stay hedged. That behavior mechanically dampens volatility and tends to pin price in a range — which lines up almost perfectly with the sideways chop we saw through the summer.
| Gamma Metric | Level / Value |
|---|---|
| Net dealer gamma | ≈ $1.54B per 1% move |
| Gamma flip point | $220 |
| Heaviest call wall | $230 |
| Heaviest put wall | $205 |
| Implied move into next close | ± ~1.5% |
Levels to Watch This Week
Between the technical structure and the options positioning, a handful of levels now define the next move. These aren't arbitrary lines — they're where real dealer flow and real chart history intersect.
| Level | Price | Why It Matters |
|---|---|---|
| Ultimate breakout trigger | $236.26 | Prior all-time high; a close above erases the last resistance |
| Call wall / near-term ceiling | $230 | Heaviest call gamma; dealers likely sell rallies into this zone |
| Current price | $225.16 | Sitting on the old range ceiling, now reclaimed |
| Gamma flip point | $220 | Below this, dealer hedging flips from stabilizing to potentially amplifying moves |
| Put wall / support shelf | $205 | Heaviest put gamma; the range floor that held for months |
The cleanest read: as long as NVDA holds above $220, the path of least resistance stays up, just capped by sellers near $230 until enough call gamma rolls off or gets overwhelmed by fresh buying. A daily close back below $220 would be the first real warning sign that dealer flows are starting to work against the bulls.
The Takeaway
Nvidia is technically strong across daily, hourly, and weekly timeframes — above its key moving averages, inside a rising channel, and backed by a bullish Elliott Wave structure that still points higher over the medium term. Recent trading action around $224-$227 reflects that steady grind rather than a decisive breakout or breakdown.
But strong trend structure and a friendly options market aren't the same thing right now. Heavy call gamma stacked at $230 is the real short-term governor on this move. Until that wall gets cleared with volume and conviction, expect NVDA to keep behaving like a stock that's being actively pinned rather than one that's freely trending.
Key takeaways
- NVDA trades above both its 50-day ($206.50) and 200-day ($194.74) moving averages, confirming a bullish trend across timeframes.
- RSI at 63 and a positive MACD histogram show building momentum without overbought exhaustion.
- Dealer gamma flips at $220 — above it, options desks tend to sell rallies and buy dips, pinning price into a controlled climb.
- The $230 call wall is the near-term ceiling; a close above $236.26 would confirm a genuine breakout past the prior all-time high.
- Weekly Elliott Wave structure still favors the bulls, with price holding well above the 0.236 retracement near $189.70.
Frequently asked questions
Why is $220 such an important level for NVDA right now?
$220 is the dealer gamma flip point. Above it, options dealers tend to sell into rallies and buy dips, which stabilizes and 'pins' price. Below it, that hedging dynamic can flip and amplify moves in either direction.
Is NVDA overbought at $225?
Not based on RSI, which reads 63 — elevated but well short of the 70+ level typically associated with overbought exhaustion, leaving room for further upside before a momentum-driven pullback becomes likely.
What would confirm a real breakout above $225?
A daily close that clears the $230 call wall with strong volume, ideally followed by a push toward the prior all-time high of $236.26, would confirm buyers have absorbed the overhead gamma.
What is the Elliott Wave count suggesting for NVDA?
The weekly count shows a completed five-wave impulse to $152.87, an A-wave decline to $86.50, and a B-wave rally matching the old high at $236.26. Price holding above the $189.70 retracement keeps the broader uptrend intact.
Where is the key downside support if NVDA pulls back?
The $205 level is the heaviest put wall and the range floor that held for months between May and July, making it the first major support shelf below current price.