
Analysis
NVDA at $236: Bull Flag Breakout or Wave B Trap?
NVDA Bias at a Glance: Bullish Surface, Nervous Undertone
Nvidia is doing something it hasn't done since May: sitting right on top of its old all-time high and daring the market to make a decision. Every short-term signal on the board says keep buying — price is above both the 50-day and 200-day moving averages, MACD is positive and rising, and RSI(14) at 57 still has plenty of runway before it flags overbought. That's the textbook setup for a bull flag breakout continuation.
But zoom out to the weekly chart and a different story starts to form. The Elliott Wave count suggests this entire rally off the April low could be nothing more than a corrective wave B — a bull trap dressed up as a breakout, sitting one tag away from a much larger wave C decline.
Daily Structure: The Cup, the Channel, and the Ceiling at $236.30
On the daily chart, Nvidia has carved out a textbook cup formation — basing from the April low near $164 up to the May high of $236.30, then sliding back into a rising channel defined by two dashed trendlines. That channel has held for months, and price is now pressing directly into resistance at the old high.
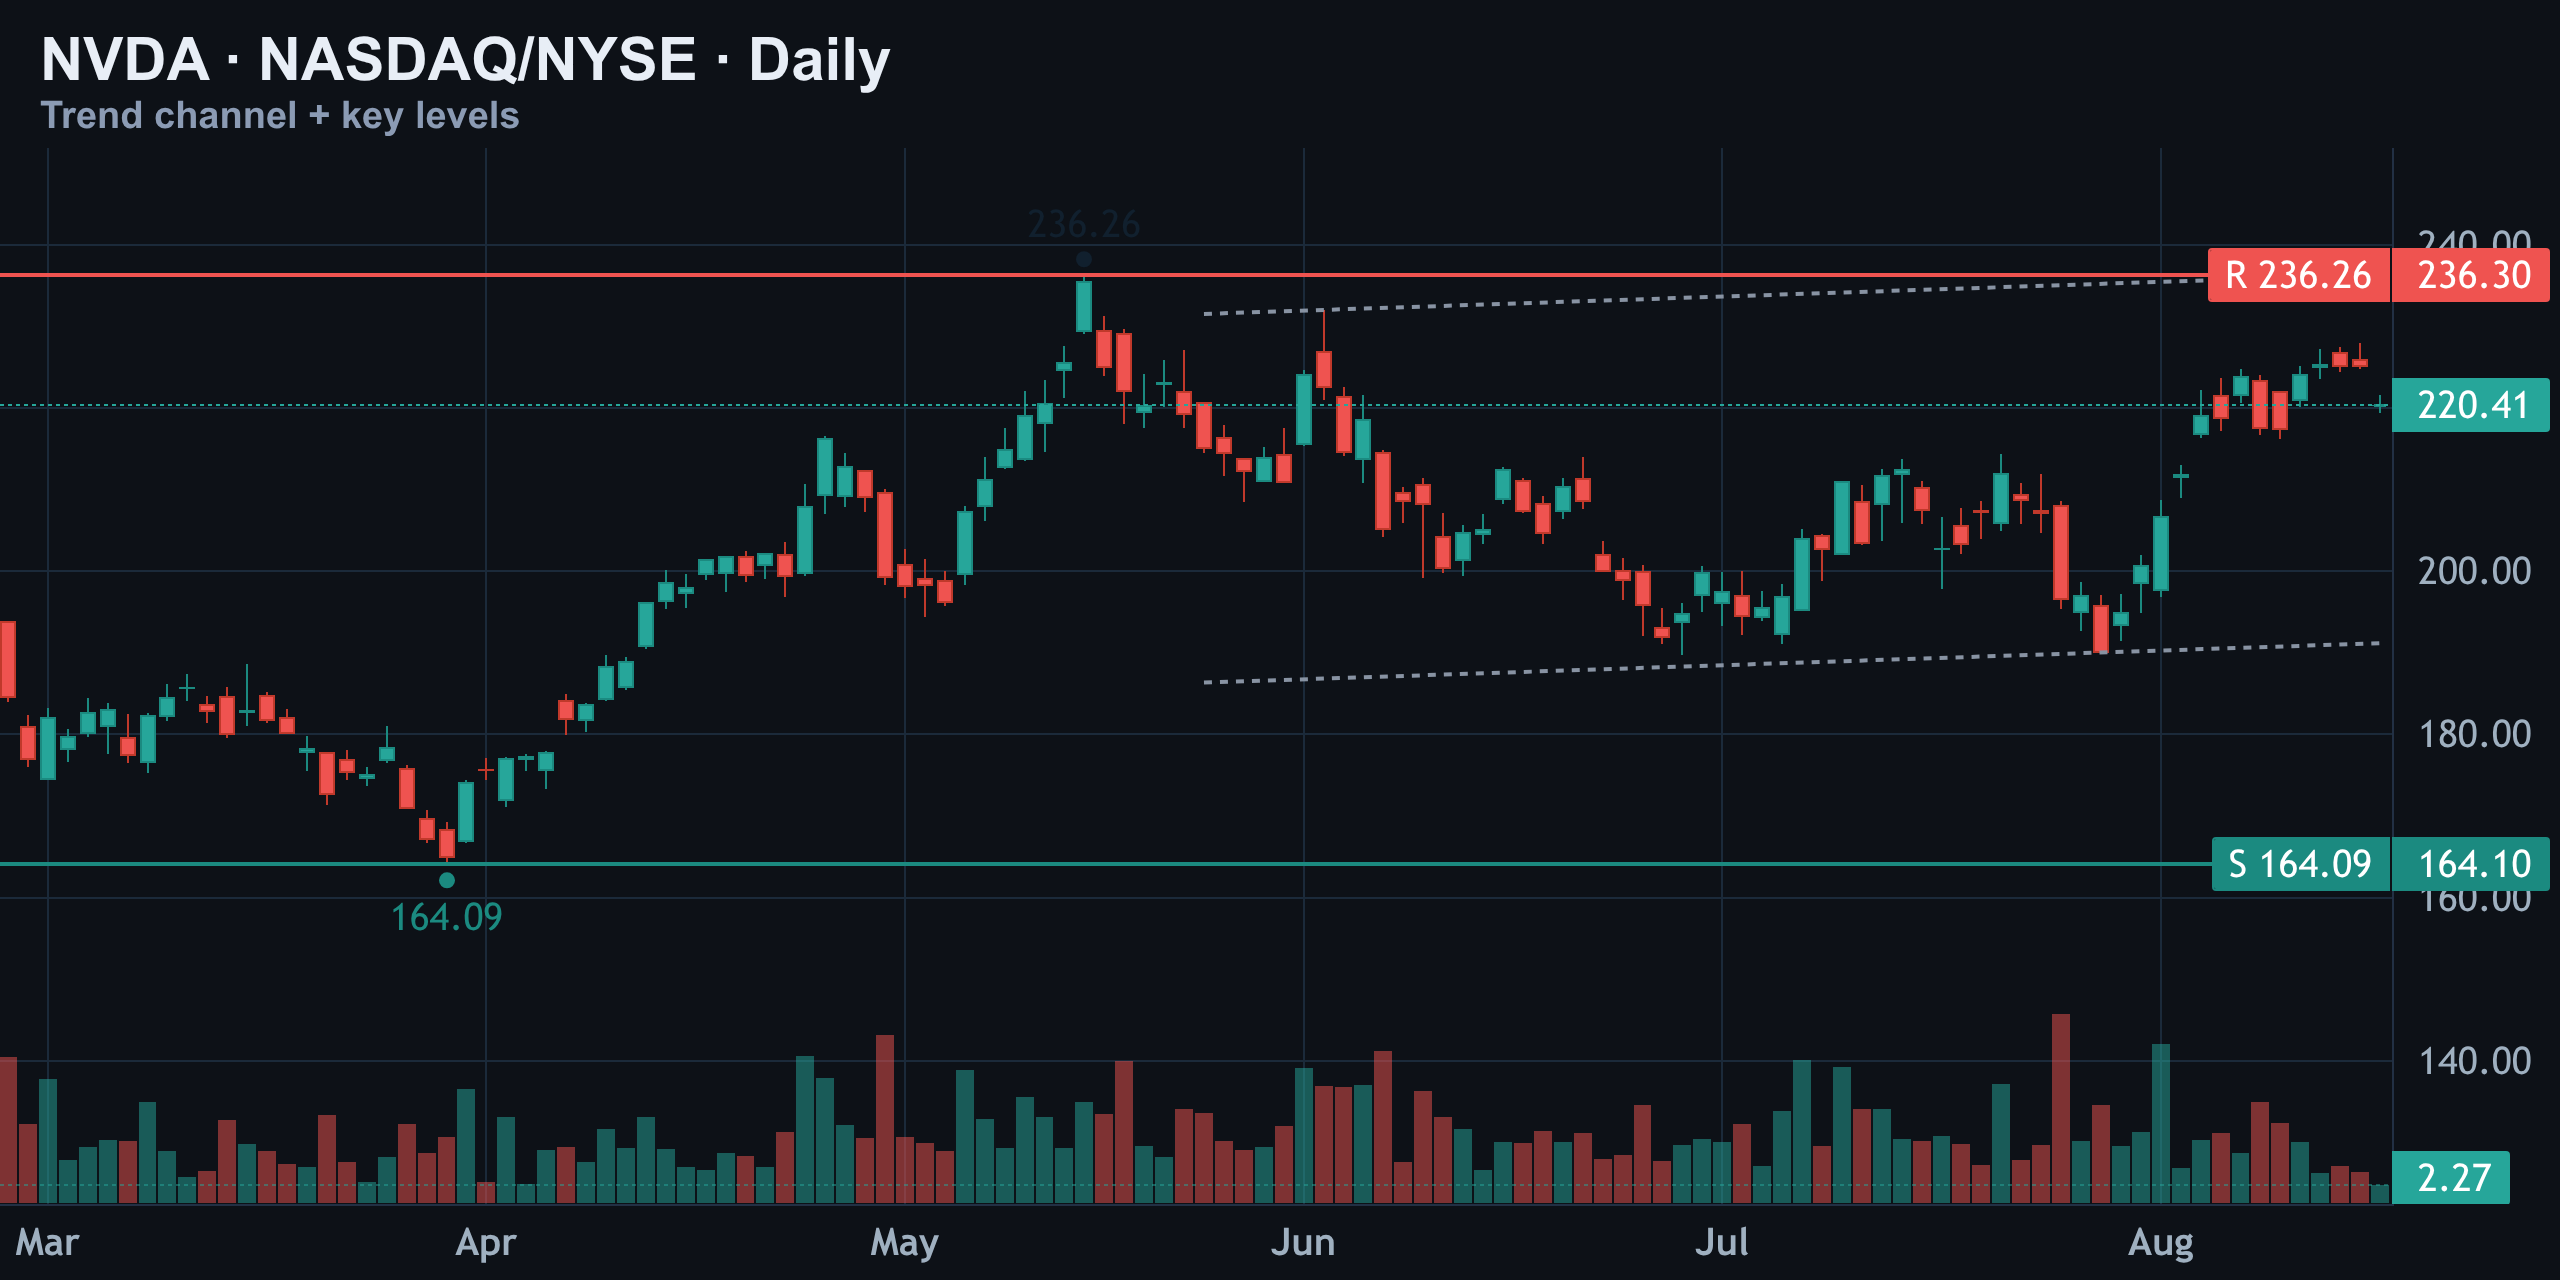
The mid-channel pivot at $220.41 is the level to watch if this pulls back — it's acted as a magnet for price on the way up and would be the first real test of trend health on the way down. Below that, the April low near $164.10 remains the broader floor for the entire structure.
| Daily Level | Price | Role |
|---|---|---|
| Resistance / ATH | $236.30 | Breakout trigger |
| Mid-channel pivot | $220.41 | First support |
| Cup base / major floor | $164.10 | Structural low |
Hourly Structure: The Ascending Channel Stalls at the Top
Drop down to the 1-hour chart and the near-term picture sharpens. NVDA spent most of July grinding sideways in the $190 area before finally breaking out into a clean ascending channel. That breakout pushed price through $220, and it's now testing the upper rail of the channel.
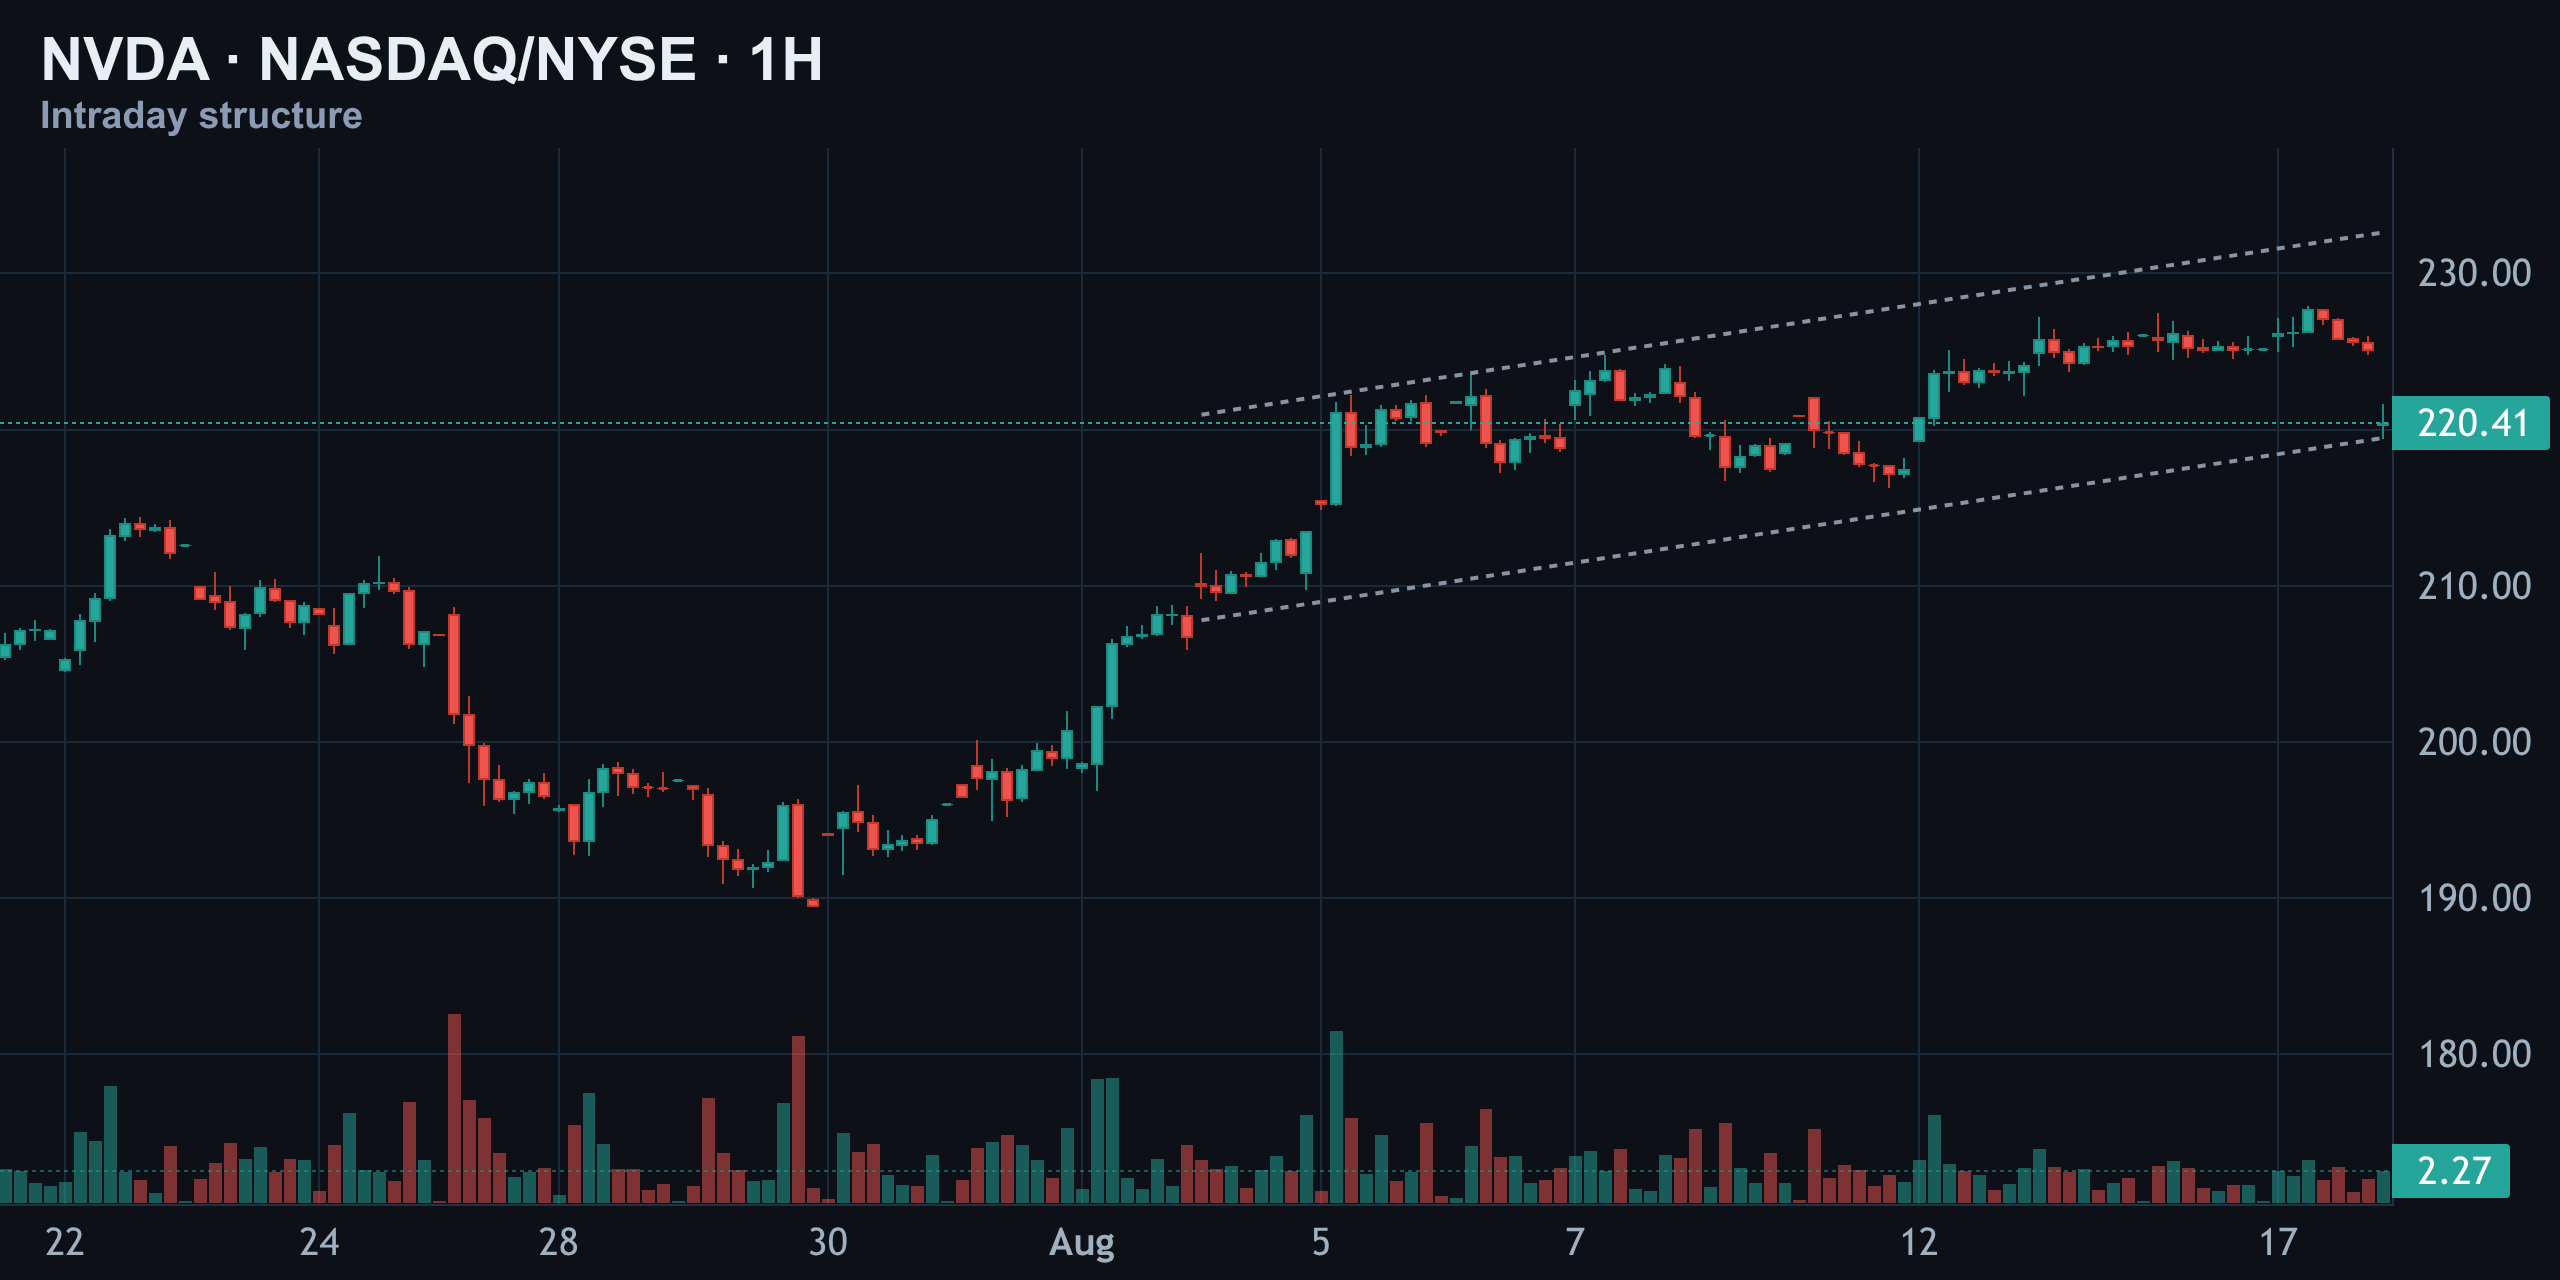
Here's the nuance worth flagging: the last two candles are showing a slight stall right at the top of that channel. That's not a reversal signal on its own, but it is the kind of hesitation you'd expect either right before a breakout squeeze — or right where a wave B rally runs out of gas. Watch how price behaves at this rail over the next few sessions; a clean push through with volume favors the bulls, while repeated rejection here would tilt the odds toward the bearish weekly count.
Weekly Elliott Wave: A Wave B Rally Knocking on the Old High
The weekly chart is where the real tension lives. Nvidia's move off the 2023 lows traces out as a five-wave impulse, topping in the $150s area, correcting into wave 4, and then extending into a wave 5 high before a sharp A wave decline slammed price down to $86.50.
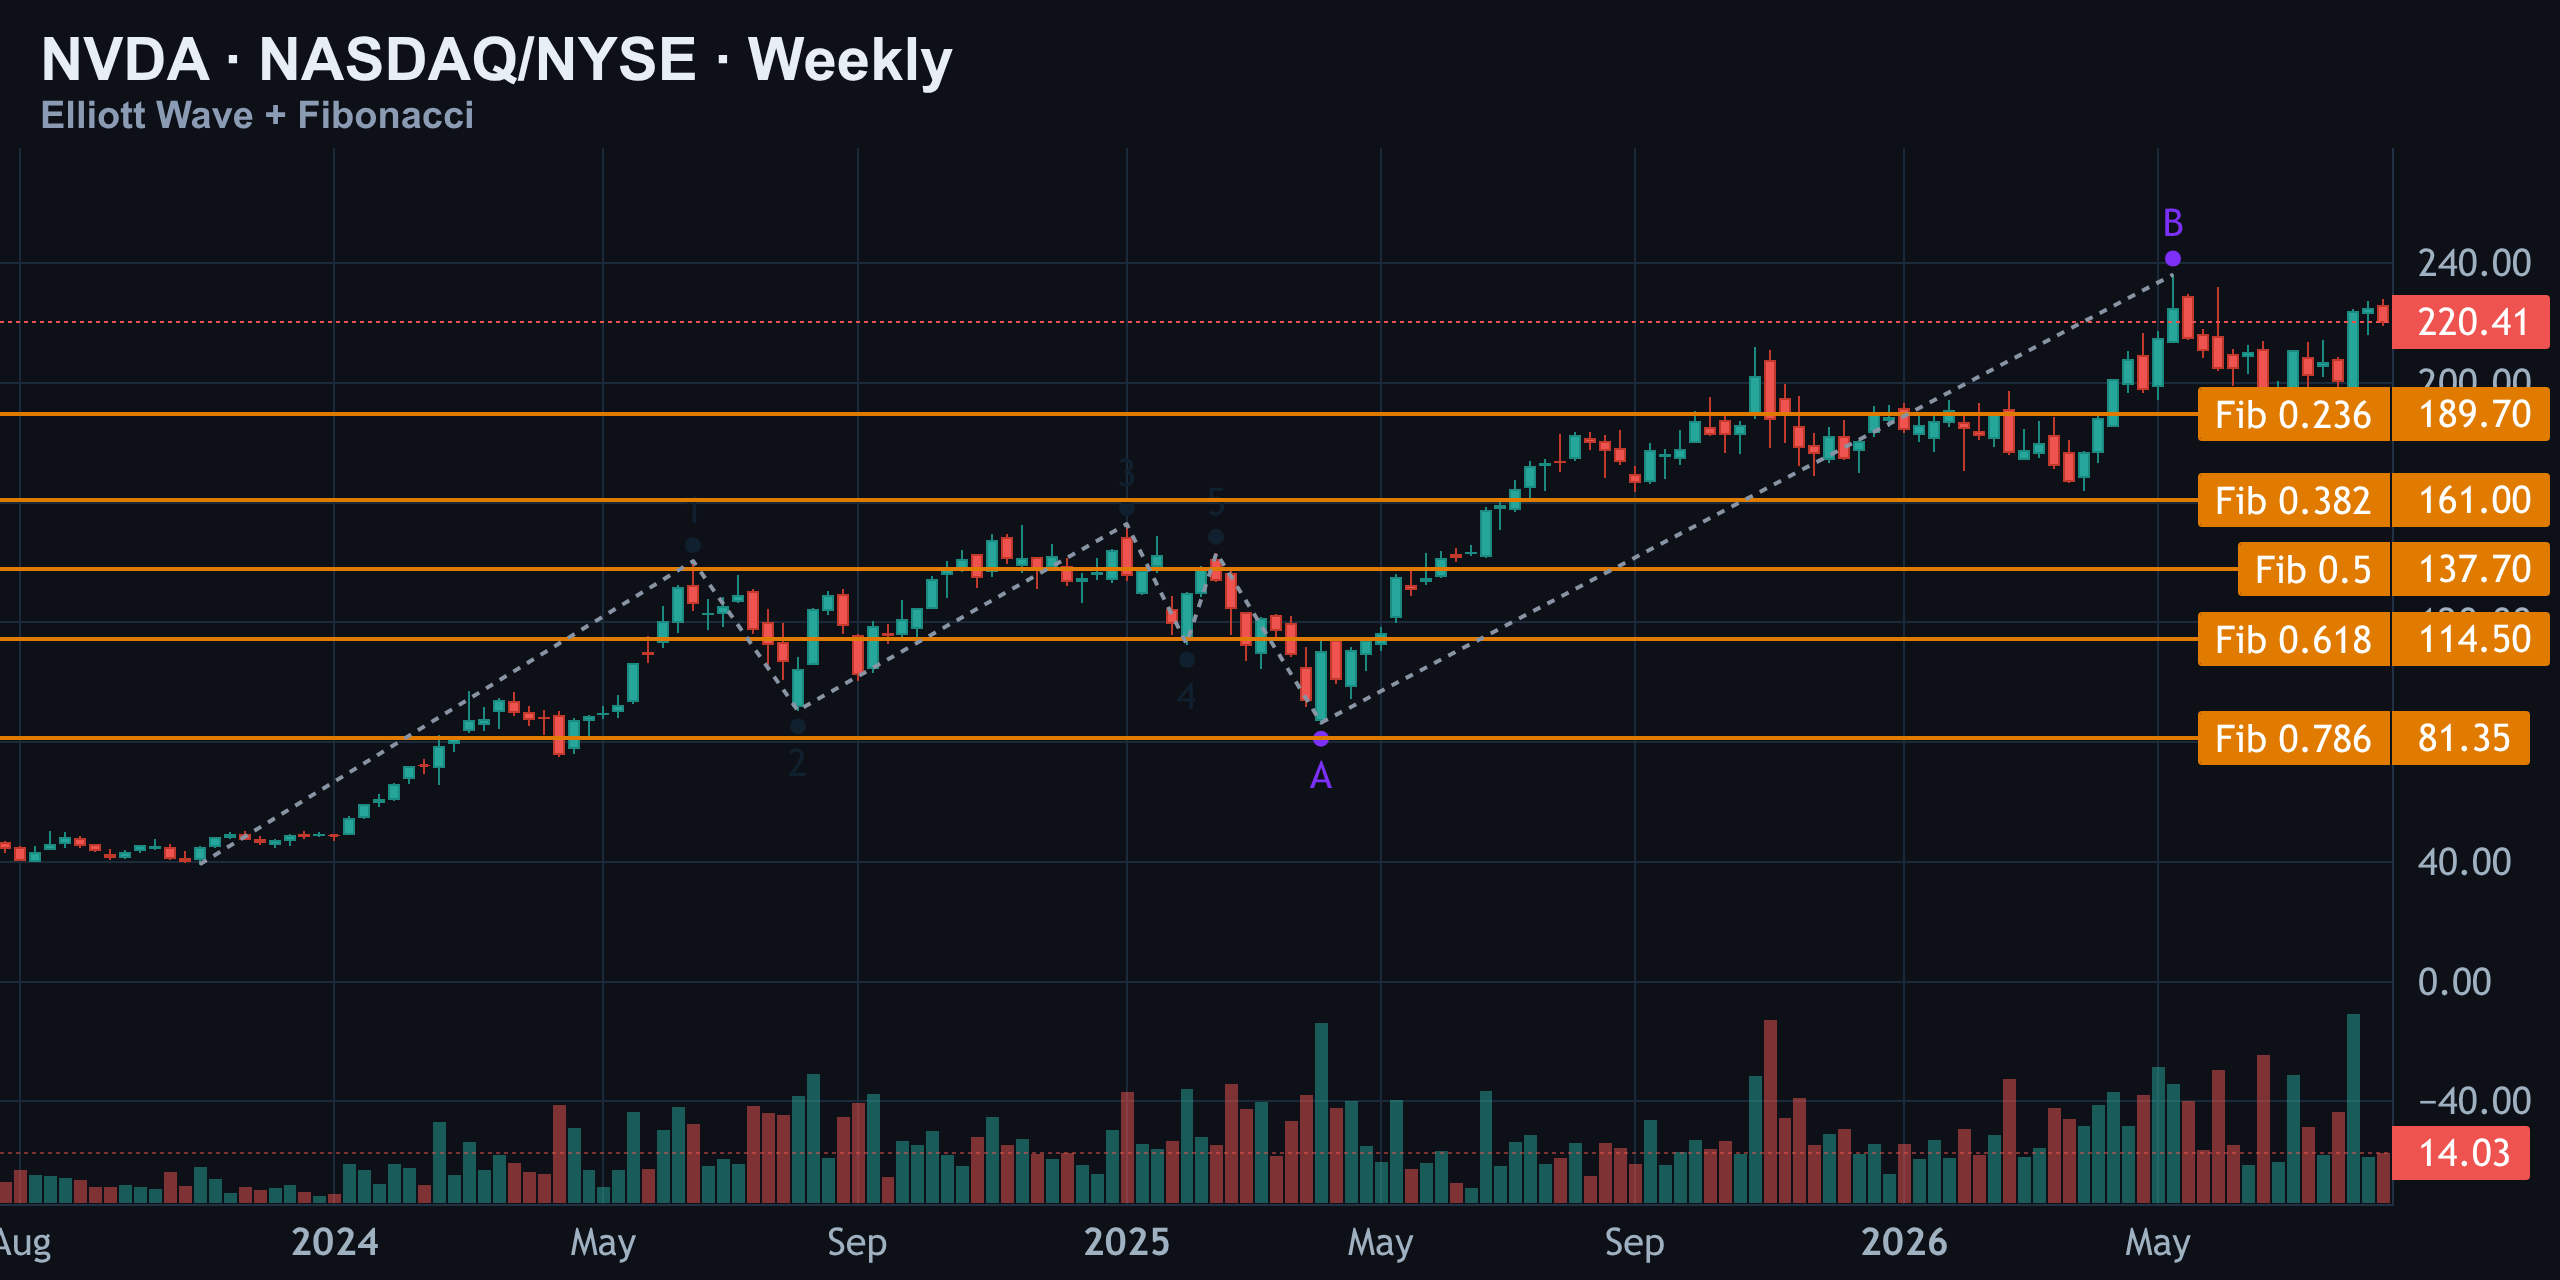
Since that $86.50 low, price has rallied hard — and that rally has already matched the prior all-time high at $236.26. In classic Elliott Wave terms, a corrective rally that retraces this deep and this fast after an A wave crash is exactly what a wave B looks like. The danger with wave B rallies is that they often look identical to genuine breakouts right up until they fail — which is precisely the setup NVDA is in right now.
Wave Count & Scenarios: Bull Flag Breakout vs. Wave C Trap
This is the fork in the road. Two scenarios are live, and both start from the exact same price level.
- Bull flag breakout: Price clears $236.30 on strong volume, the rising daily channel resumes, and NVDA pushes into new all-time-high territory. This scenario treats the recent consolidation as a pause within a healthy uptrend, not a corrective wave.
- Wave B trap: Price stalls or fails at $236.30, confirming the rally since $86.50 was corrective. A wave C decline then follows, targeting the 50% and 61.8% Fibonacci retracement levels of the entire advance.
| Scenario | Trigger | Target Zone |
|---|---|---|
| Bull flag continuation | Clean break above $236.30 | New highs above $236.30 |
| Wave C decline (50% fib) | Rejection at $236.30 | ≈ $137.00 |
| Wave C decline (61.8% fib) | Rejection at $236.30 + channel break | ≈ $114.50 |
Trend & Momentum Check: Moving Averages, RSI, and MACD
Strip away the wave count for a moment and just look at trend and momentum in isolation — this is where the bullish case is strongest right now.
Moving Averages (50/200)
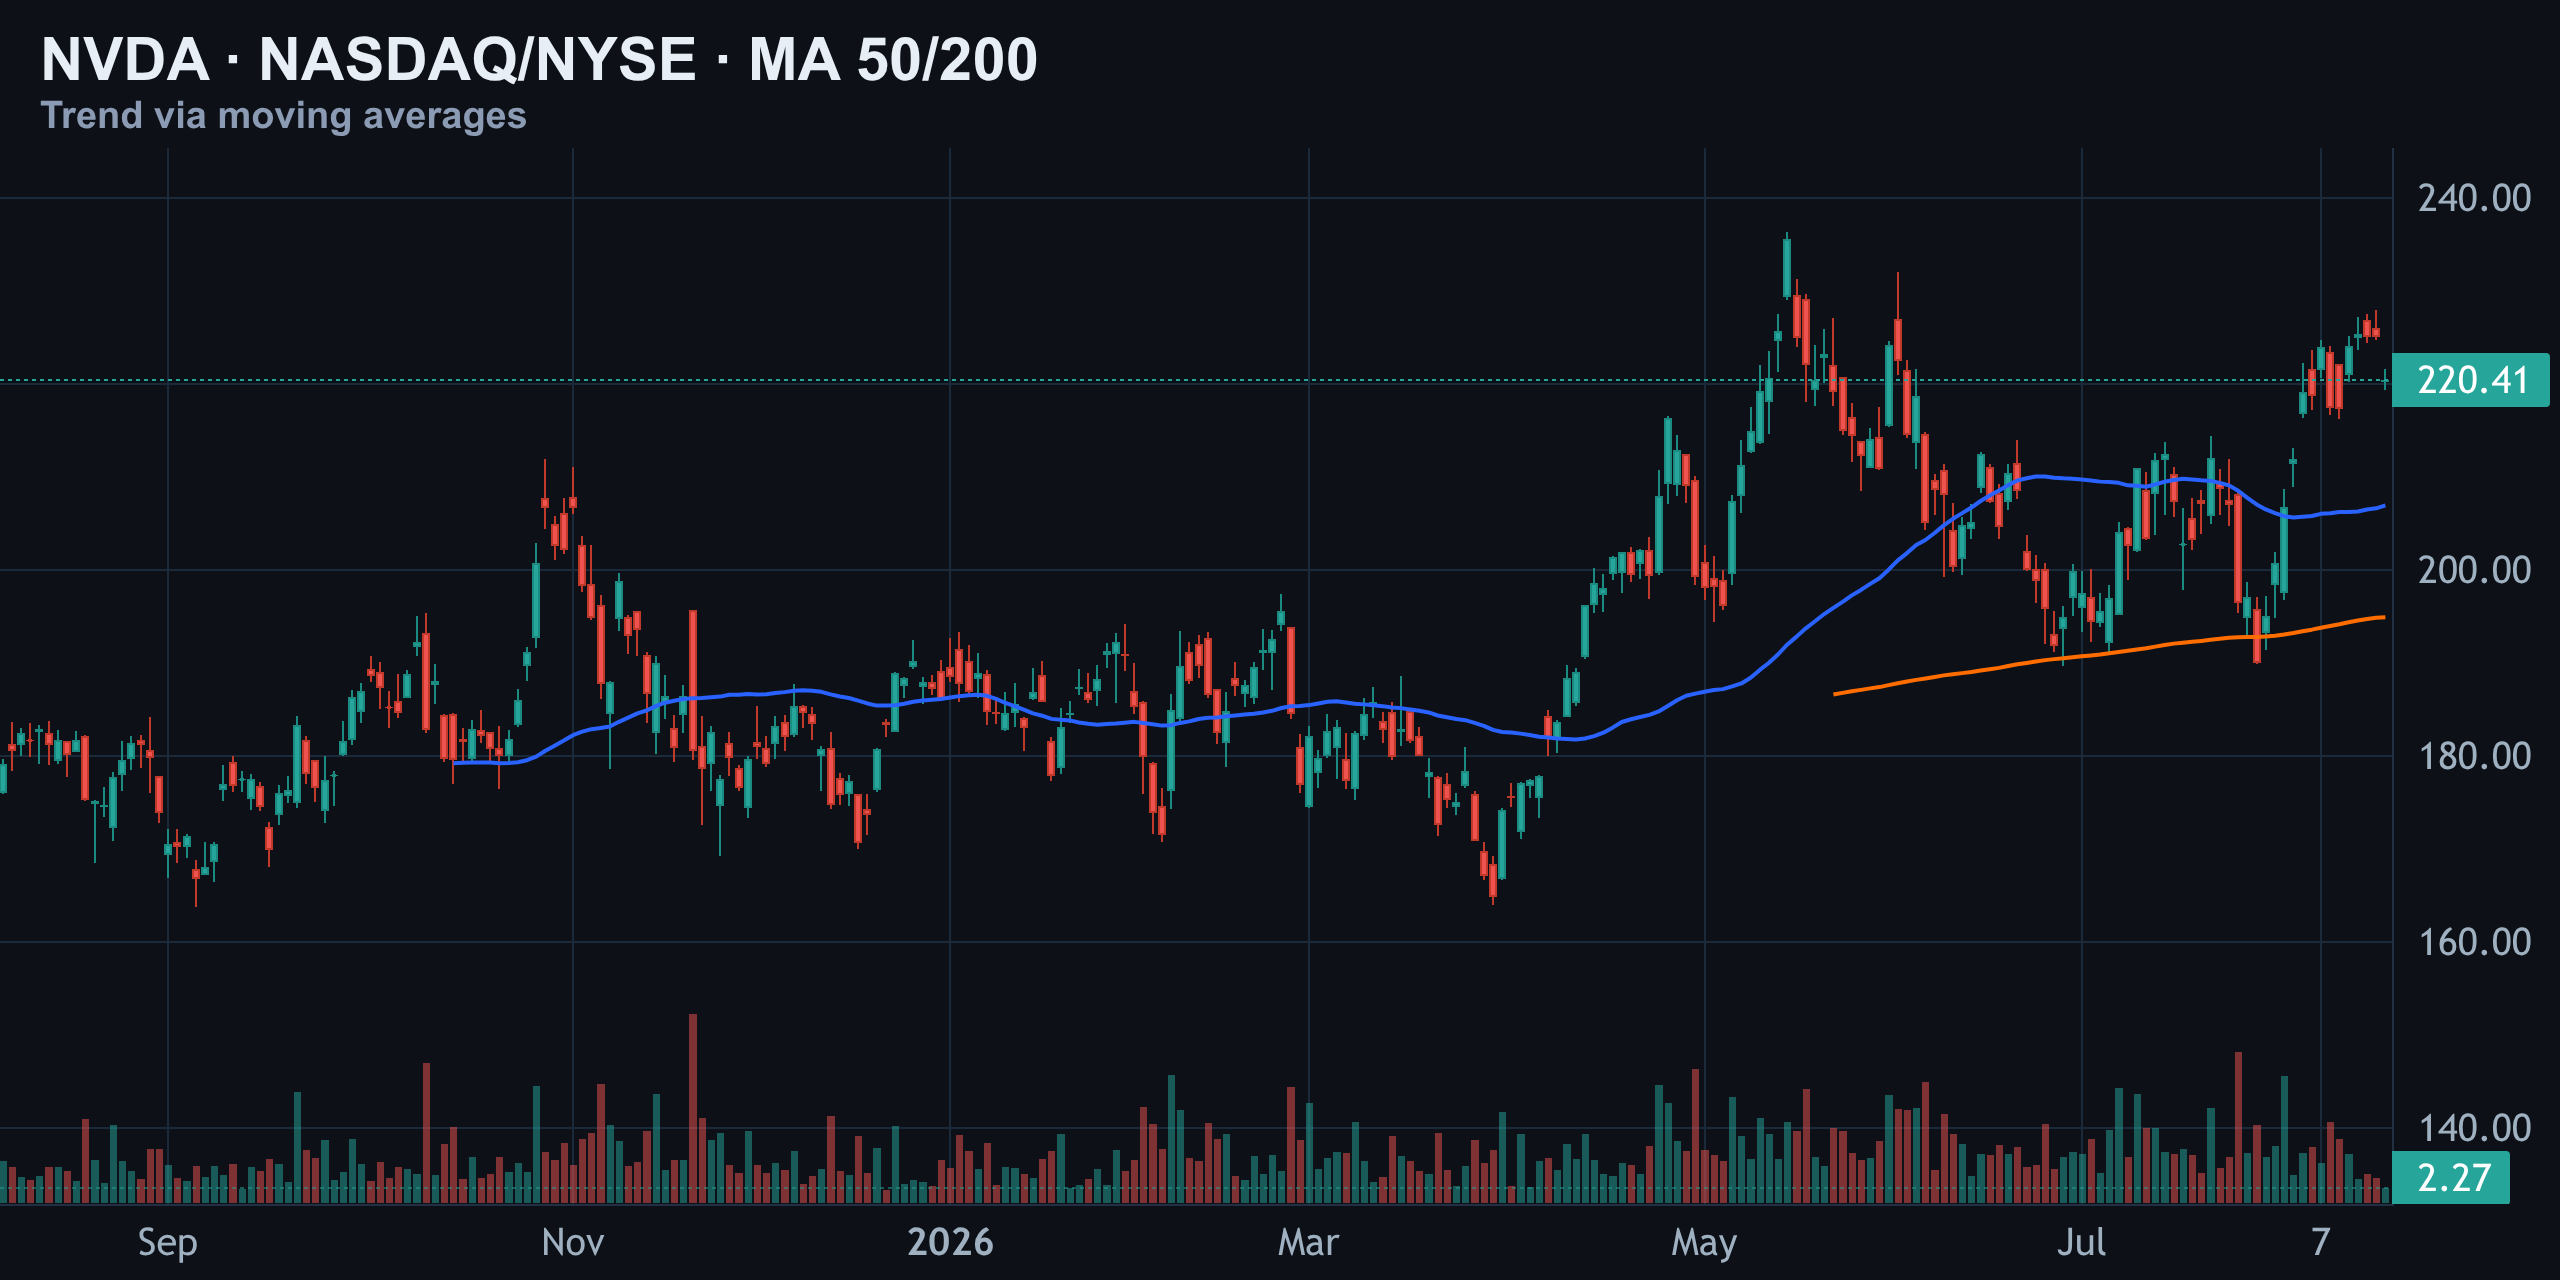
Price at $220.41 is trading above both its 50-day moving average ($206.93) and its 200-day moving average ($194.93). That's a textbook bullish alignment, and the gap between price and both averages shows the uptrend has real separation, not just a marginal cross.
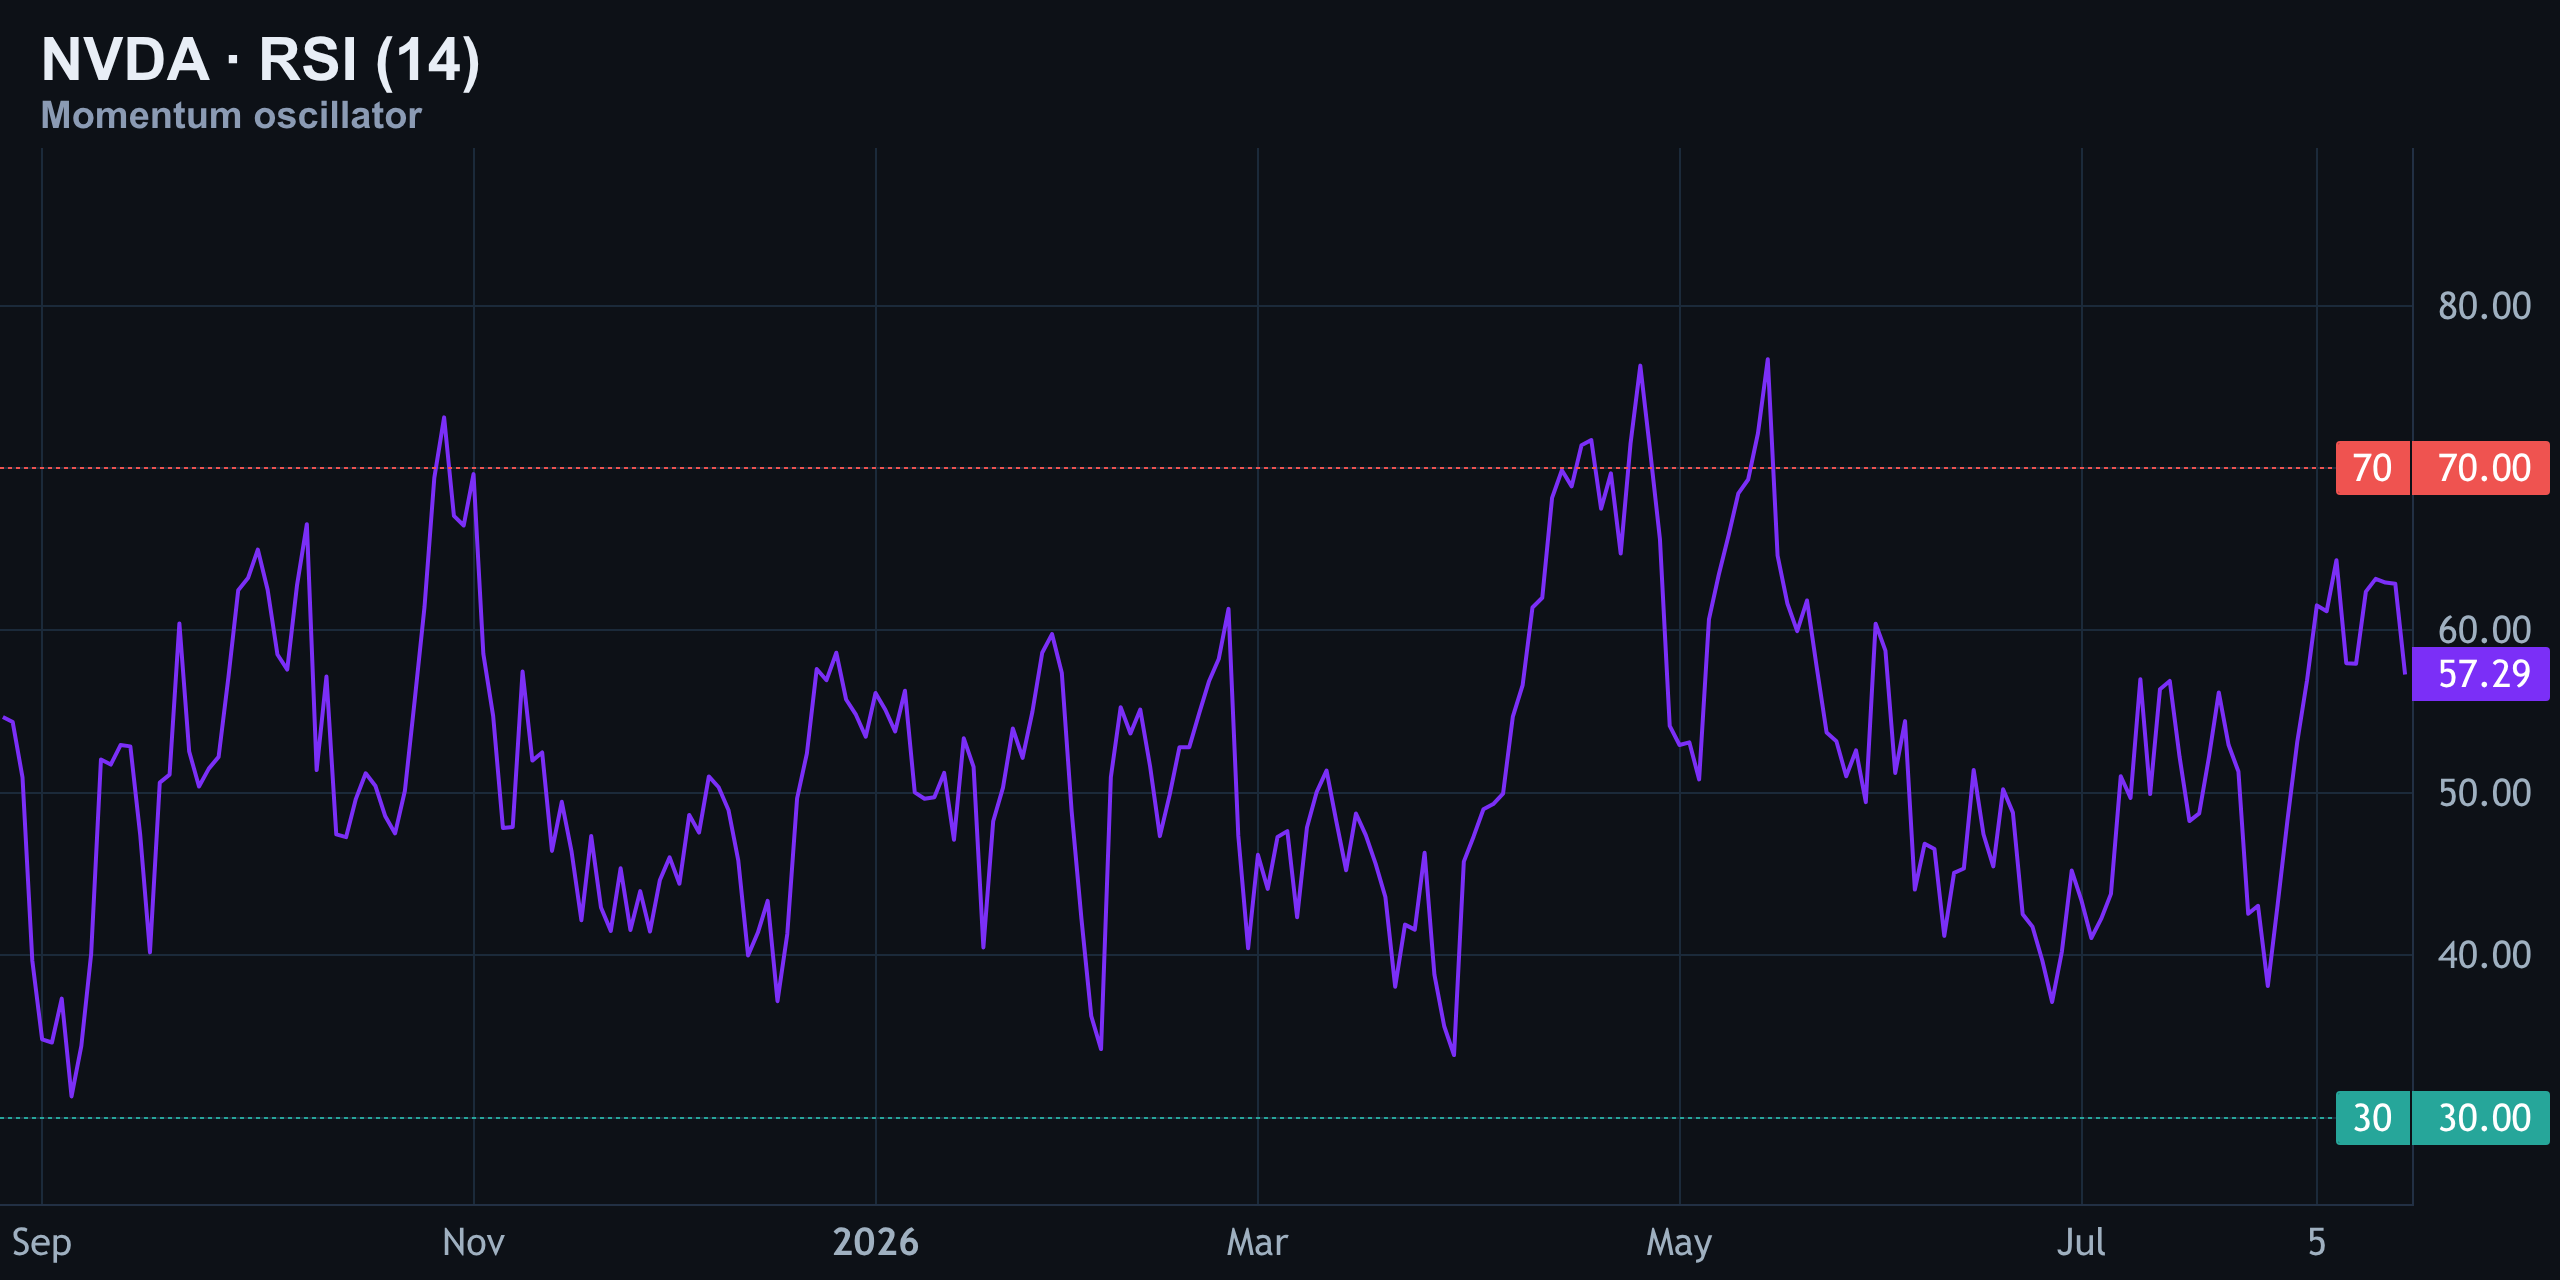
RSI (14)
RSI(14) reads 57 — solidly neutral-to-bullish, well short of the overbought 70 line. That leaves room for price to climb further before momentum itself becomes a headwind, which is a point in favor of the breakout case over the trap case in the very near term.
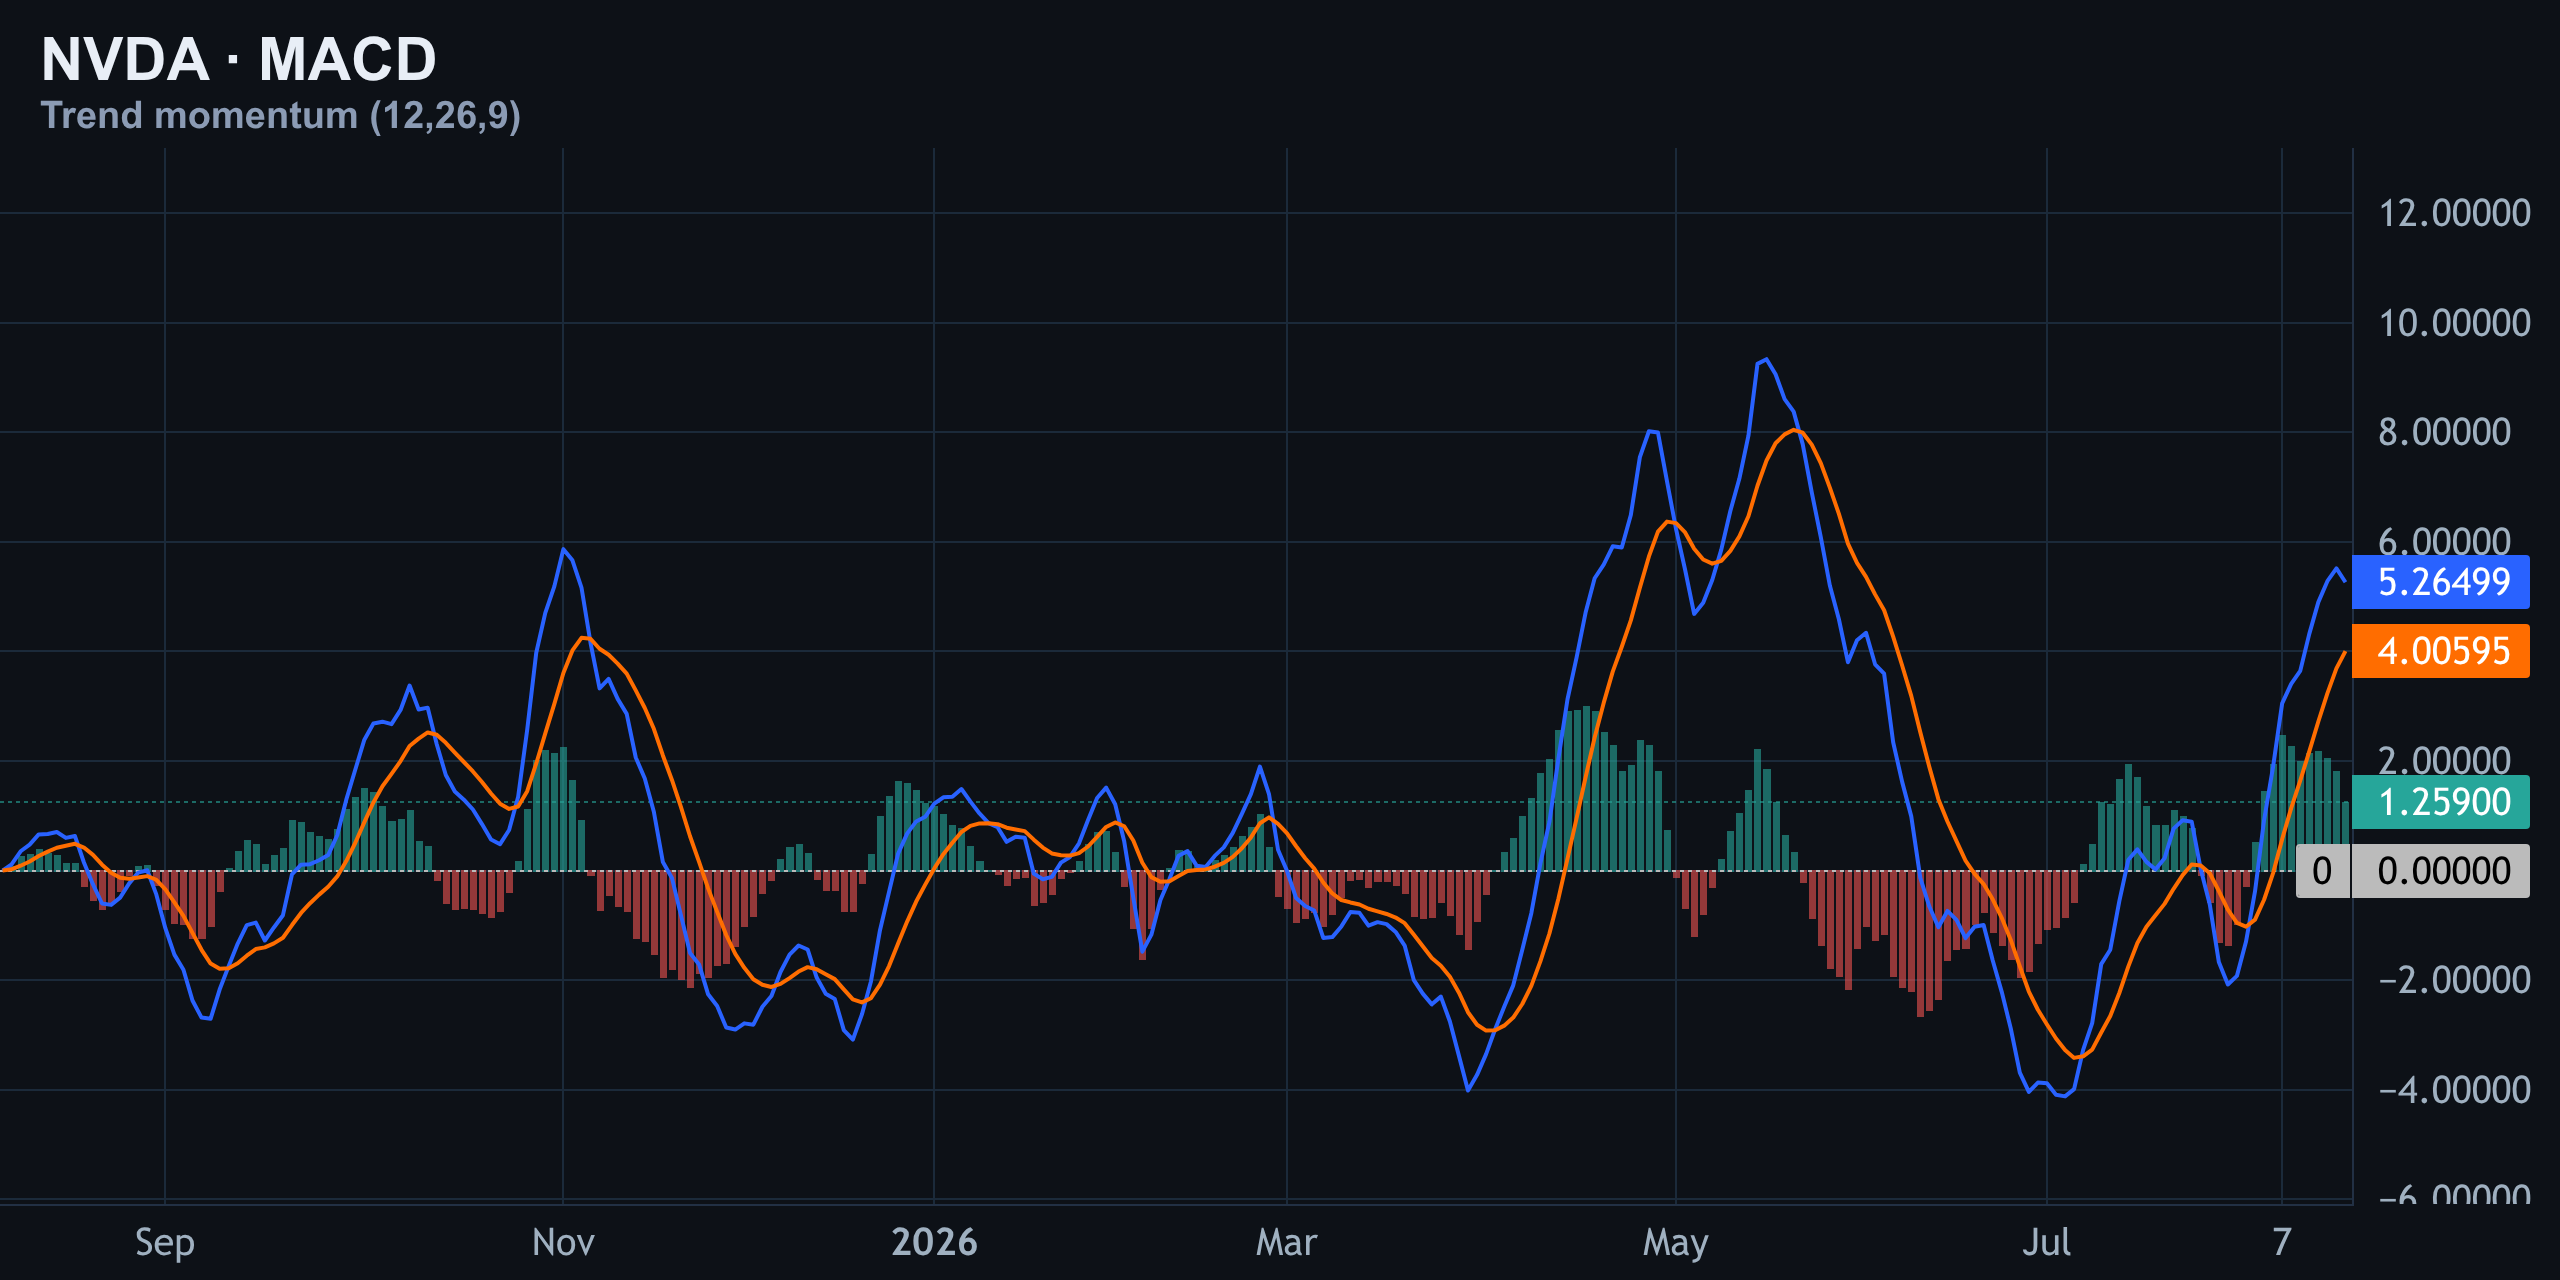
MACD
MACD is above its signal line with a positive histogram, confirming that short-term momentum is still pointed higher. None of the standard momentum tools are showing divergence or exhaustion yet — which is exactly why this setup is tricky. The daily and hourly indicators are bullish; it's only the weekly wave structure that's raising the flag.
| Indicator | Reading | Signal |
|---|---|---|
| Price vs MA50 | $220.41 vs $206.93 | Bullish |
| Price vs MA200 | $220.41 vs $194.93 | Bullish |
| RSI (14) | 57 | Neutral, room to run |
| MACD | Above signal, histogram positive | Bullish |
The Institutional Edge: What Options Flow Is Saying
The options desk offers a quieter but useful clue. The put-to-call open interest ratio currently sits at 0.81, meaning calls dominate positioning — traders are leaning bullish into this expiry. But max pain, the price where the largest number of options expire worthless, sits at $225.
That max pain level lines up almost exactly with the $220–$236 resistance zone already visible on the daily chart. When max pain clusters this tightly with a major technical level, it's common for dealers to lean on price and keep it pinned nearby heading into expiry — which could explain the stall showing up on the hourly chart right now.
| Options Metric | Value | Read |
|---|---|---|
| Put/Call OI ratio | 0.81 | Calls dominate |
| Max pain | $225 | Pins near resistance zone |
Levels to Watch and the Takeaway
Every scenario in this analysis pivots around one number: $236.30. That's the May all-time high, and it's the line in the sand for the entire bull-versus-trap debate.
| Level | Price | Significance |
|---|---|---|
| Key resistance / ATH | $236.30 | Breakout trigger, wave B target |
| Options max pain | $225 | Potential expiry pin |
| Mid-channel pivot | $220.41 | First support / current price |
| 50-day MA | $206.93 | Trend support |
| 200-day MA | $194.93 | Trend support |
| Wave C target (50% fib) | ≈ $137.00 | Bearish downside target |
| Wave C target (61.8% fib) | ≈ $114.50 | Bearish downside target |
| Major floor / April low | $164.10 | Structural support |
Nvidia is bullish on the surface — price above both moving averages, momentum tools pointed up, and a rising channel still intact. But the weekly Elliott Wave count is the one voice in the room warning that this could be a wave B trap forming right under the old high, with a wave C decline toward $137 and $114.50 waiting if $236.30 fails to break cleanly.
Key takeaways
- NVDA is retesting its $236.30 all-time high with bullish daily/hourly structure but a cautionary weekly Elliott Wave count.
- Price sits above both the 50-day ($206.93) and 200-day ($194.93) moving averages, with MACD positive and RSI at a non-overbought 57.
- The weekly count reads the rally since the $86.50 low as a corrective wave B — a break above $236.30 confirms continuation, a rejection opens the door to wave C targets near $137 and $114.50.
- Options max pain at $225 lines up with the $220–$236 resistance zone, suggesting dealers may pin price into this expiry.
- $236.30 is the single most important level on the chart right now — everything else is downstream of what happens there.
Frequently asked questions
Is NVDA in a bull flag right now?
The daily and hourly structure both resemble bull flag setups — price is above key moving averages with positive momentum. Confirmation requires a clean break above $236.30 on strong volume.
What is the wave B trap scenario for NVDA?
It's the idea that the rally from the $86.50 low is a corrective wave B, not a new impulsive uptrend. If it fails near the old $236.30 high, a wave C decline toward $137 and $114.50 could follow.
What does NVDA's options max pain level suggest?
Max pain sits at $225, right inside the $220–$236 resistance zone, which can mean dealers lean on price to pin it near that area into expiry.
What is the key level to watch for NVDA right now?
$236.30 — the May all-time high. A confirmed break above favors continuation; rejection here supports the wave B trap thesis.
Are NVDA's moving averages bullish or bearish?
Bullish. Price at $220.41 trades above both the 50-day ($206.93) and 200-day ($194.93) moving averages, a classic uptrend alignment.