Bitcoin Today: The $65,056 Wall Holding a Coiled Market
Where We Left It: Yesterday's Range-Bound Call Still Holds
Since yesterday's update, Bitcoin has actually slipped about 0.7%, drifting from $65,350 down to roughly $64,866 before stabilizing near $64,996 this morning — up a little over half a percent on the day but still boxed inside a tight range.
There was no trade to score either way yesterday. We stood aside, citing a range-bound stall between the 50-day and 200-day moving averages, and that call held up perfectly. No stop triggered, no target hit — just a market that's still going nowhere fast.
Options Positioning: The Walls Boxing In Spot
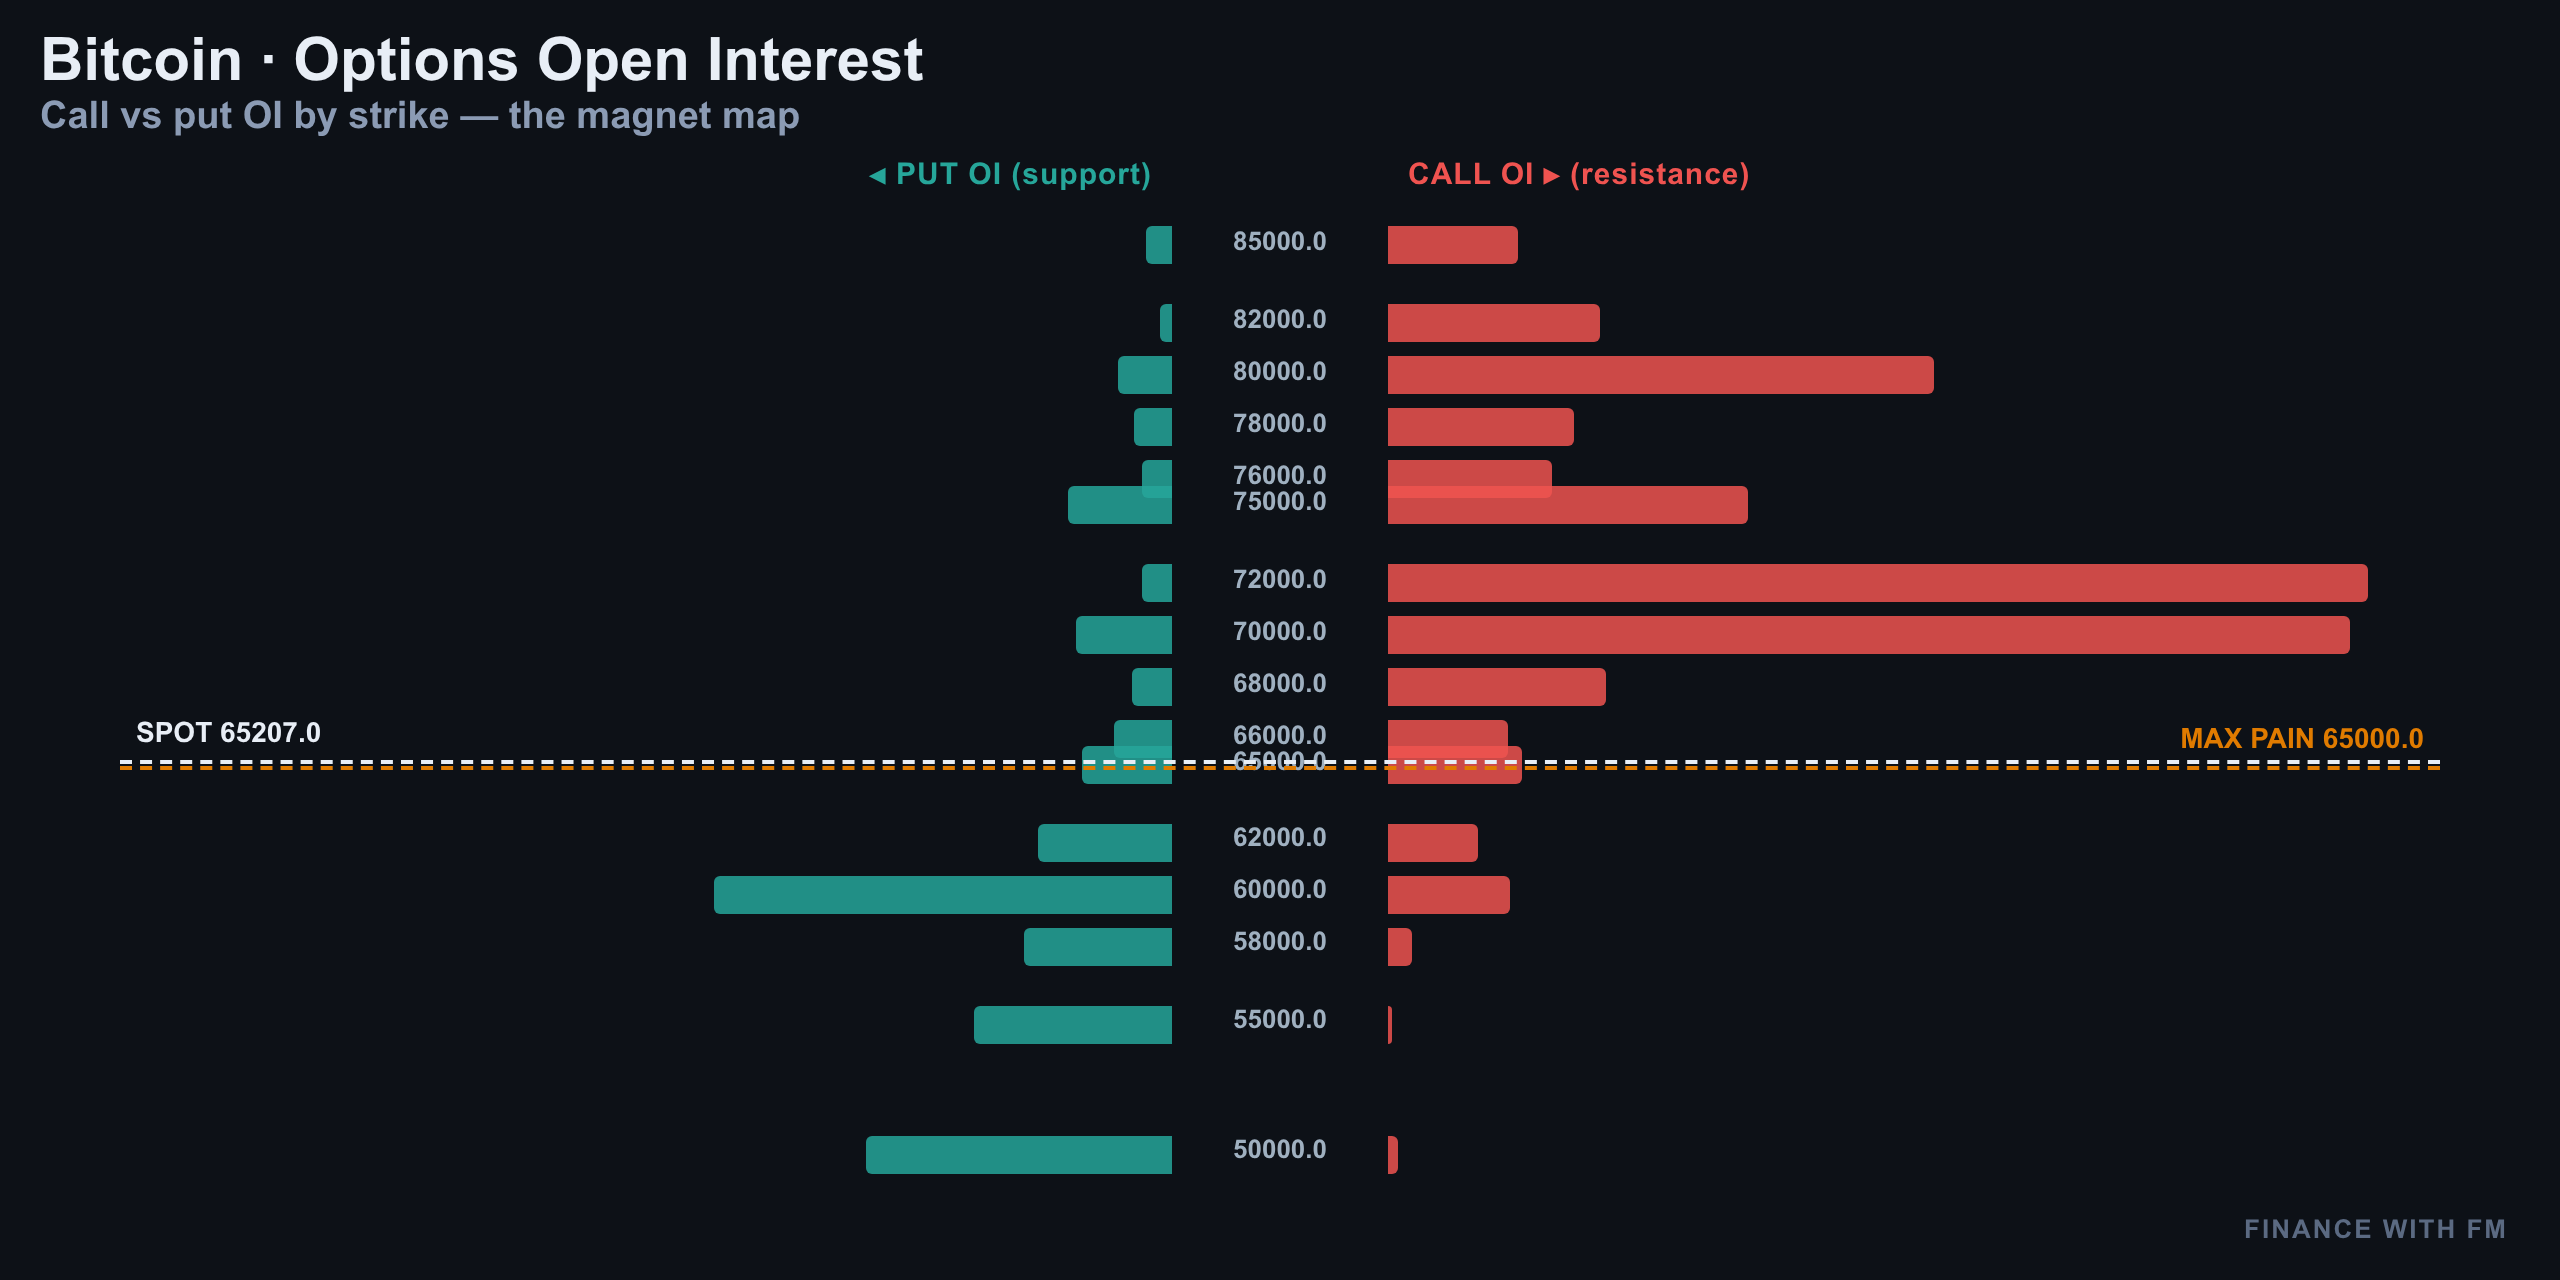
The options board is telling a nuanced story. The put-call ratio by open interest sits at 0.42, which on paper looks bullish-leaning. But the volume ratio today is higher at 0.51, showing fresh hedging activity picking up in real time — traders aren't as complacent as the headline OI ratio suggests.
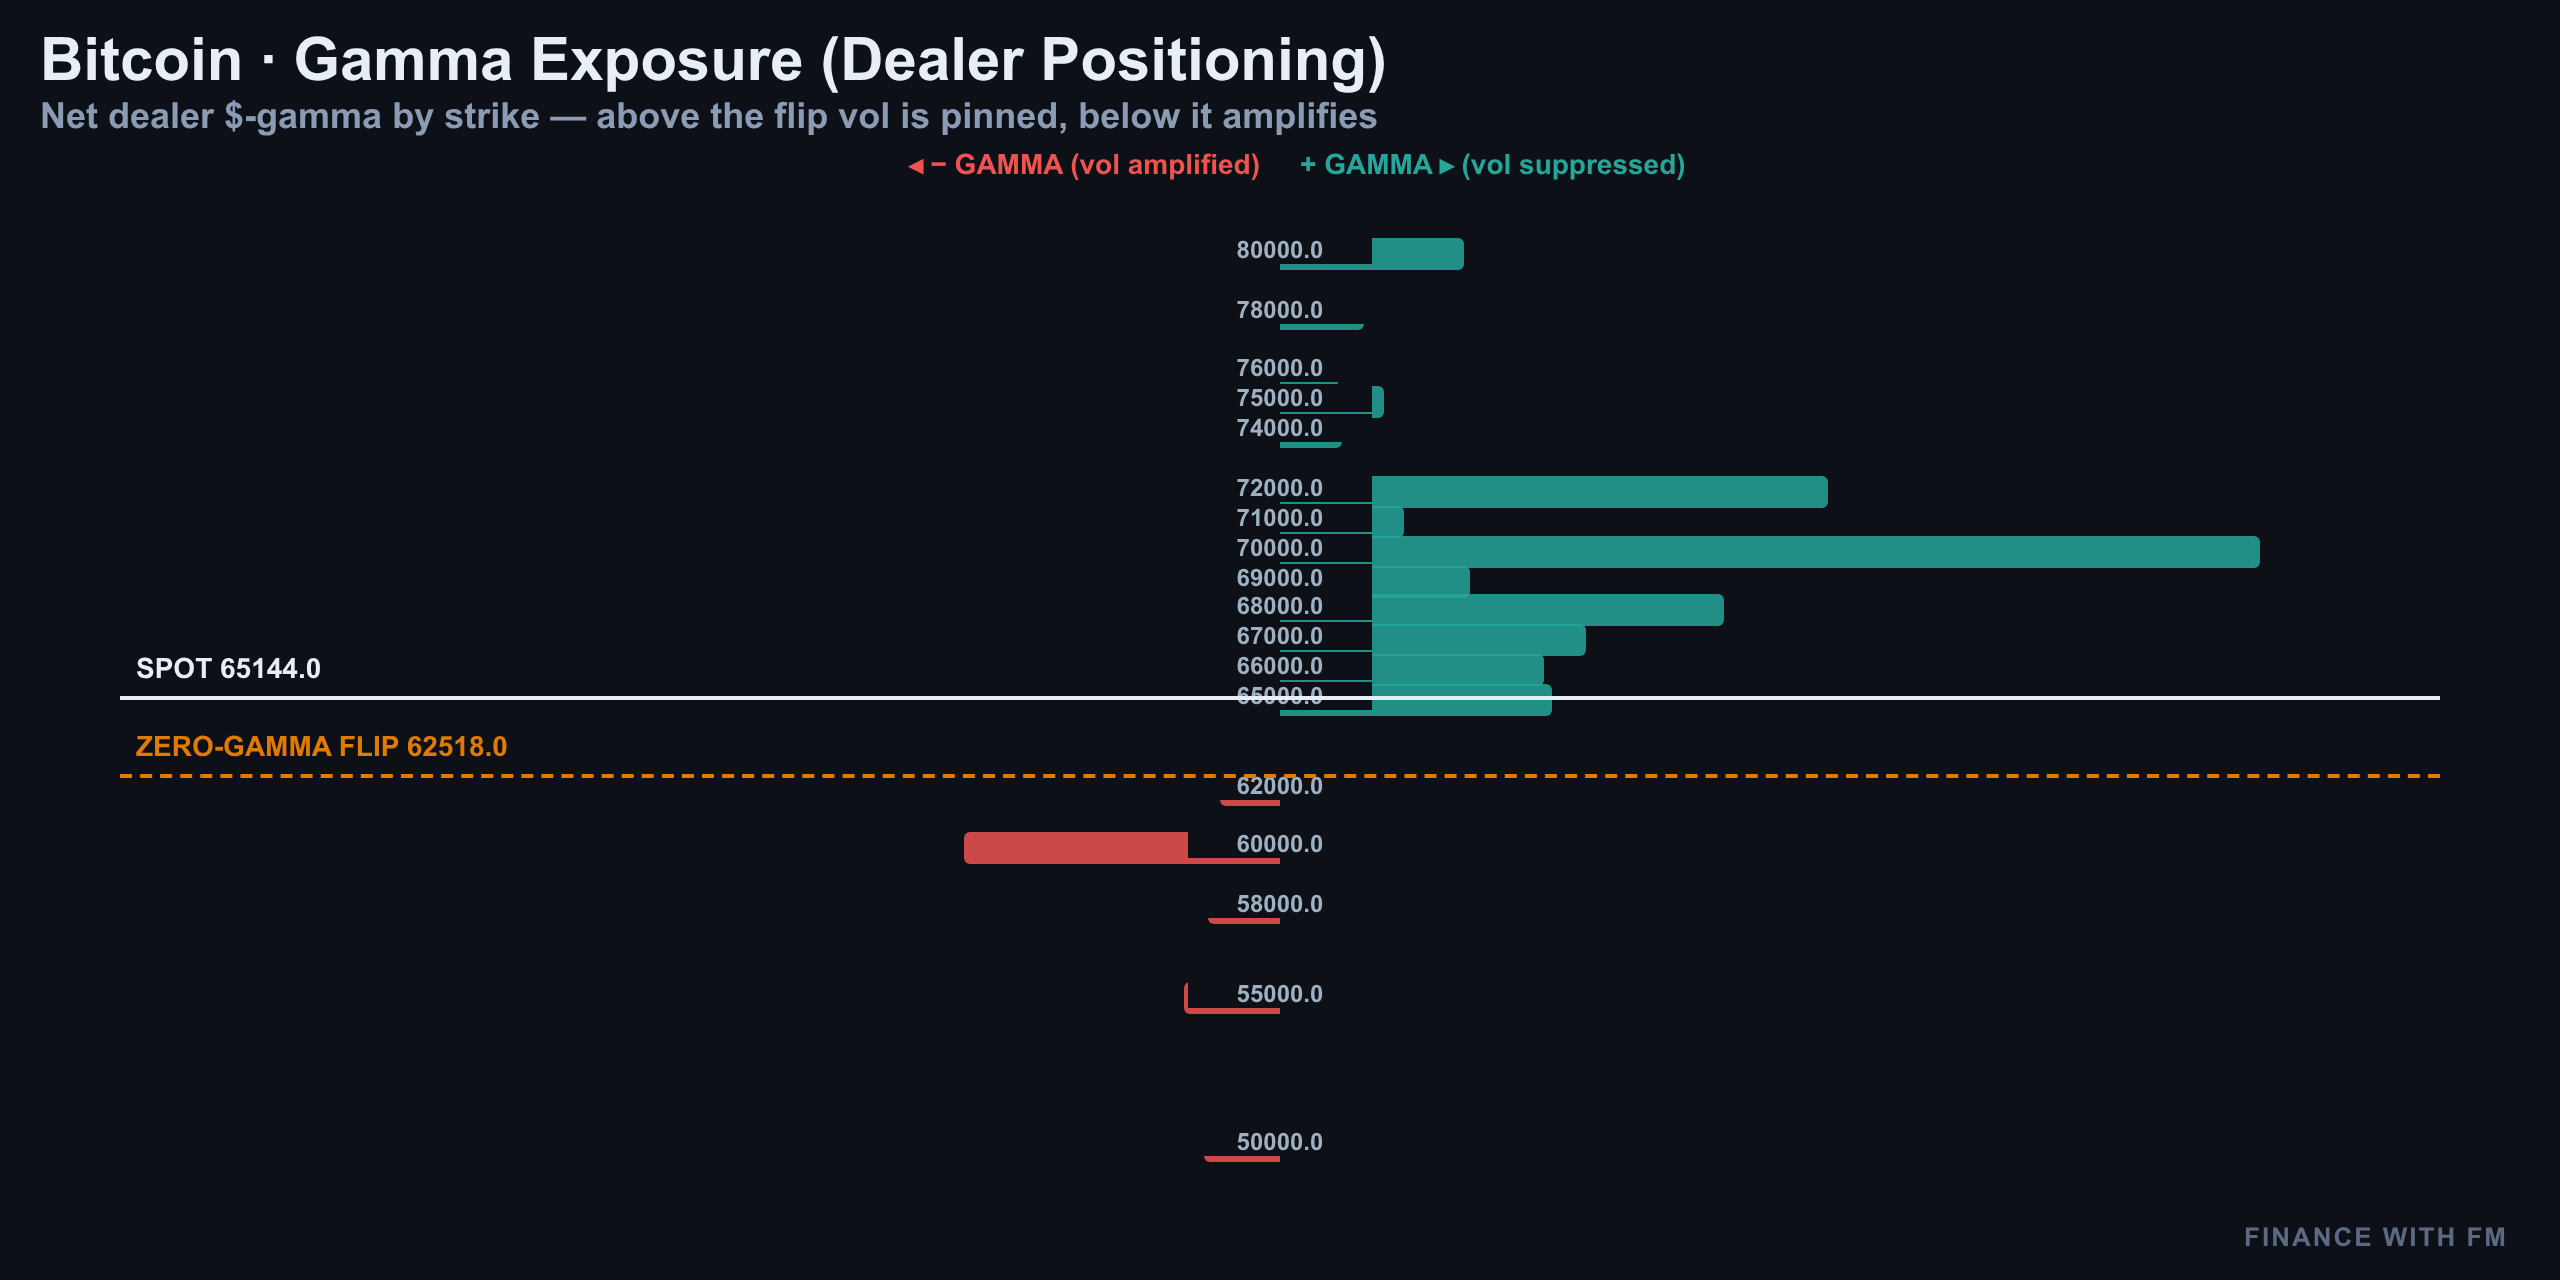
Max pain for the nearest expiry sits right at $65,000 — a magnet pulling price toward that pin as expiry approaches. Overhead, the biggest call wall sits way up at $72,000, capping any near-term breakout dreams. Below, the put wall at $60,000 is the floor dealers are actively defending.
| Metric | Value |
|---|---|
| Put/Call Ratio (Open Interest) | 0.42 |
| Put/Call Ratio (Volume) | 0.51 |
| Max Pain | $65,000 |
| Call Wall | $72,000 |
| Put Wall | $60,000 |
Net read: options positioning favors containment, not a breakout. Every strike cluster above and below spot is acting like a magnet or a wall — not a launchpad.
Volatility & Skew: Options Are Pricing Fear, Not Panic
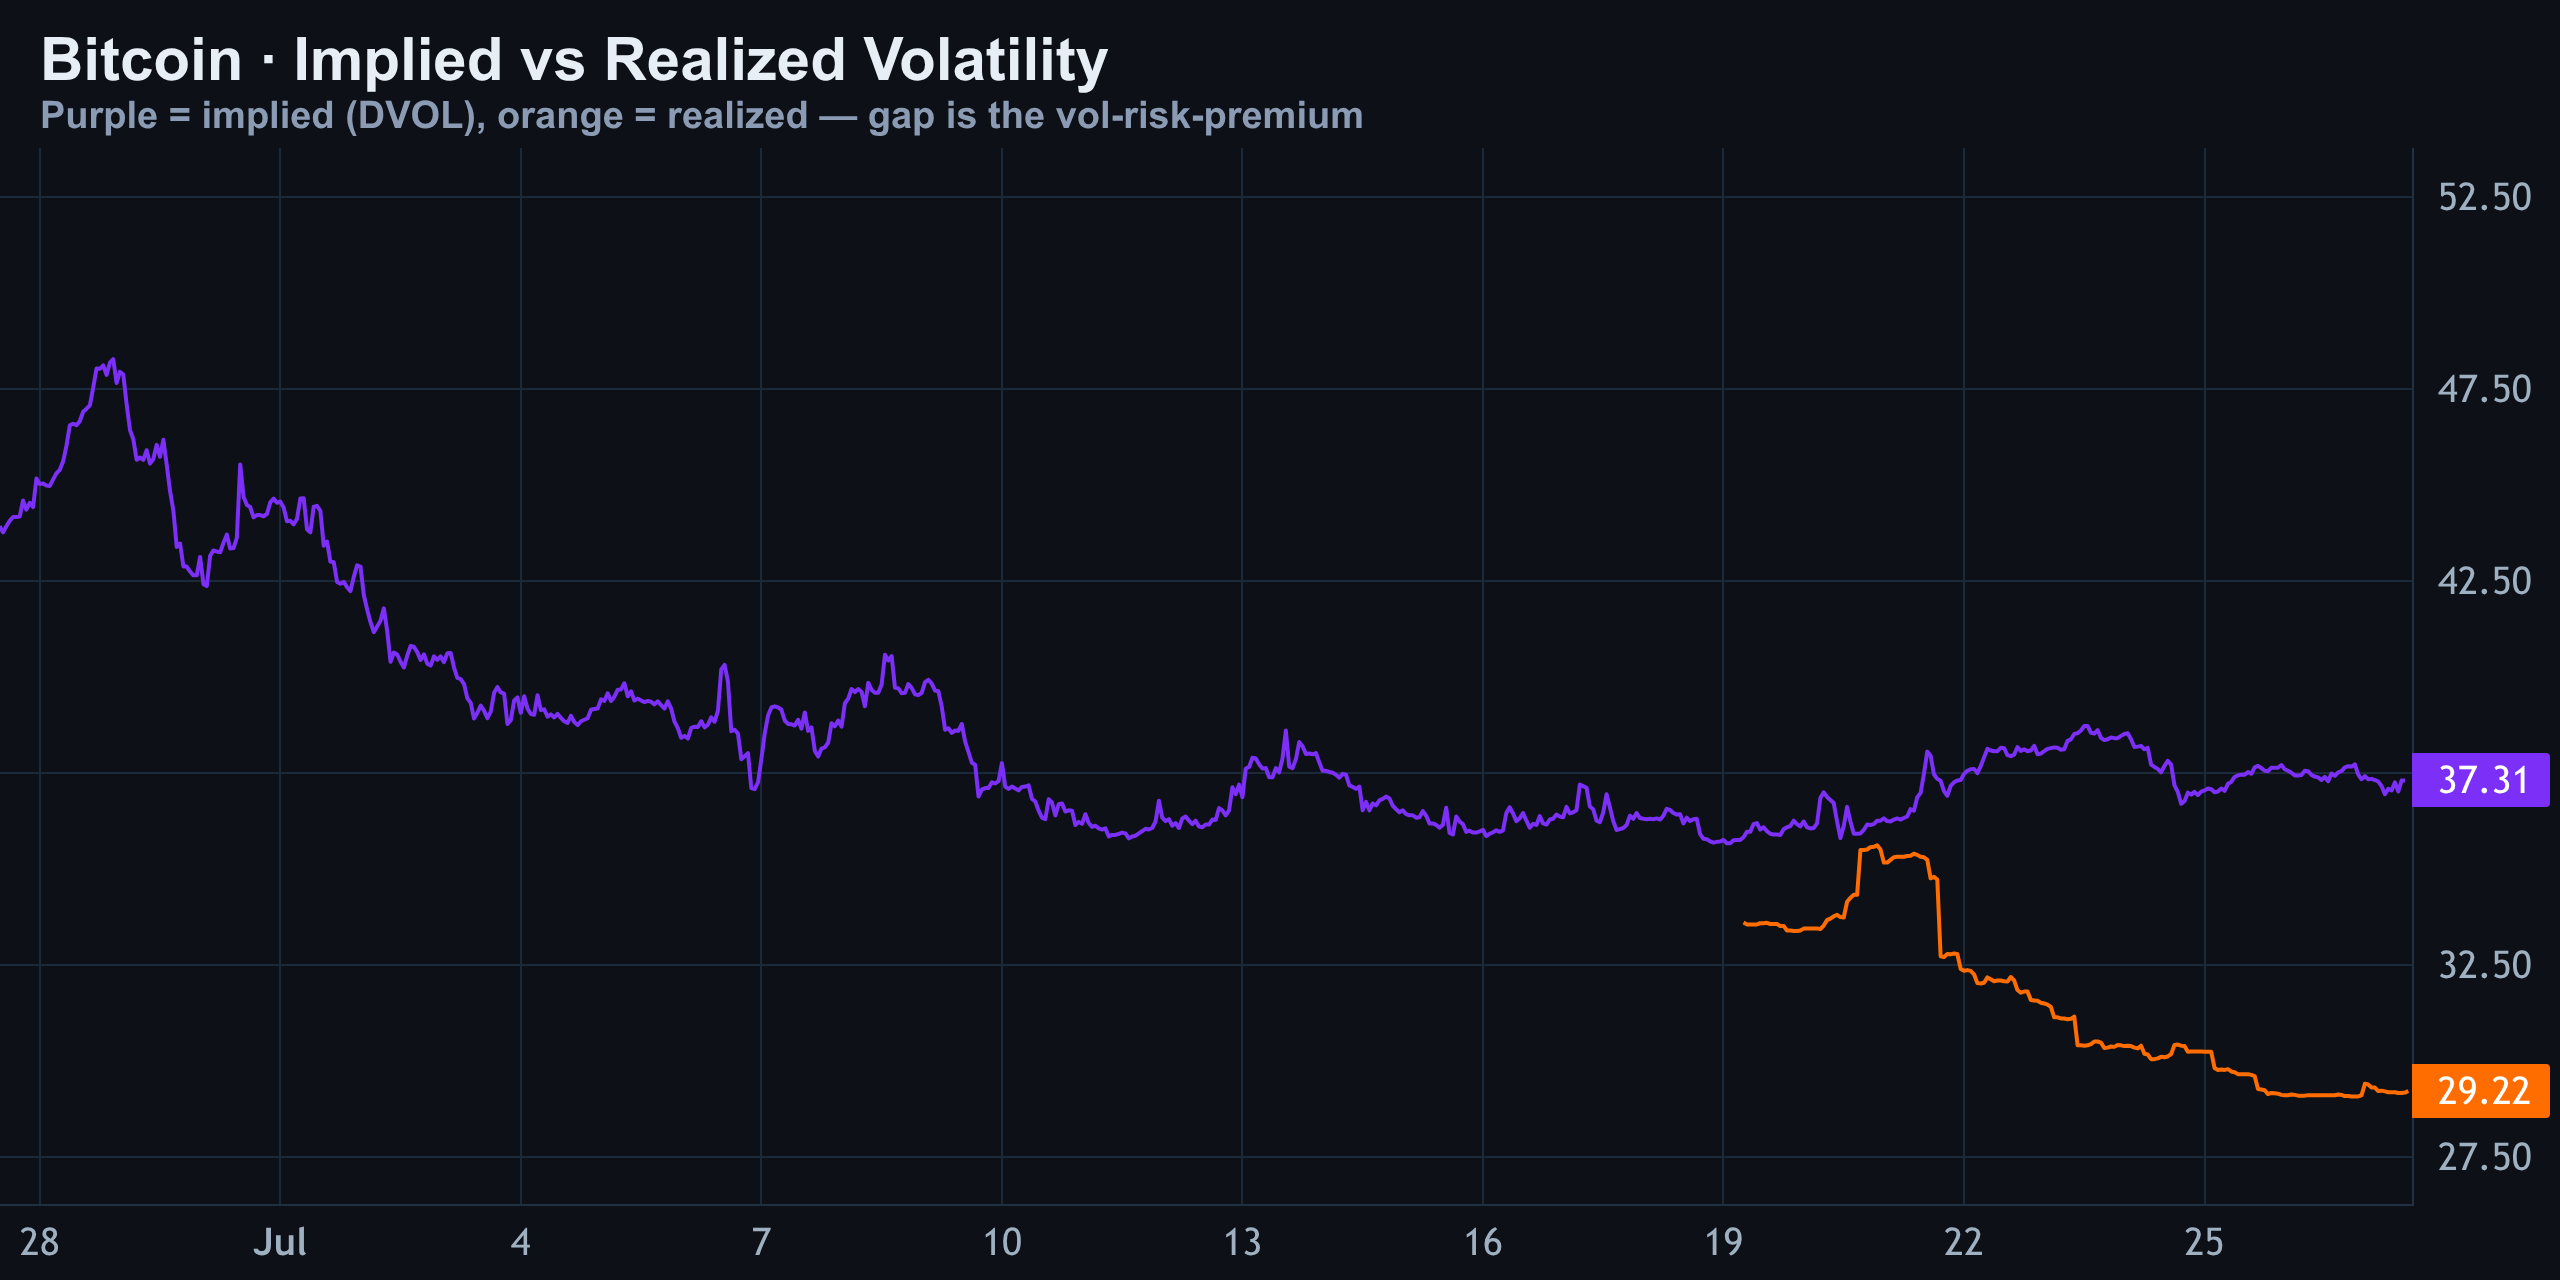
Implied volatility (DVOL) reads 37.3, while realized volatility is only 29.2. That gap — a vol-risk-premium of about 8.1 points — means options are pricing in more movement than Bitcoin is actually delivering. In plain terms, options are running expensive right now relative to what price is doing.
The 25-delta skew sits at +12.2%, meaning puts are bid harder than calls at equal distance from spot. That's classic downside fear baked into pricing — dealers and buyers are paying more for protection below the market than for upside exposure.
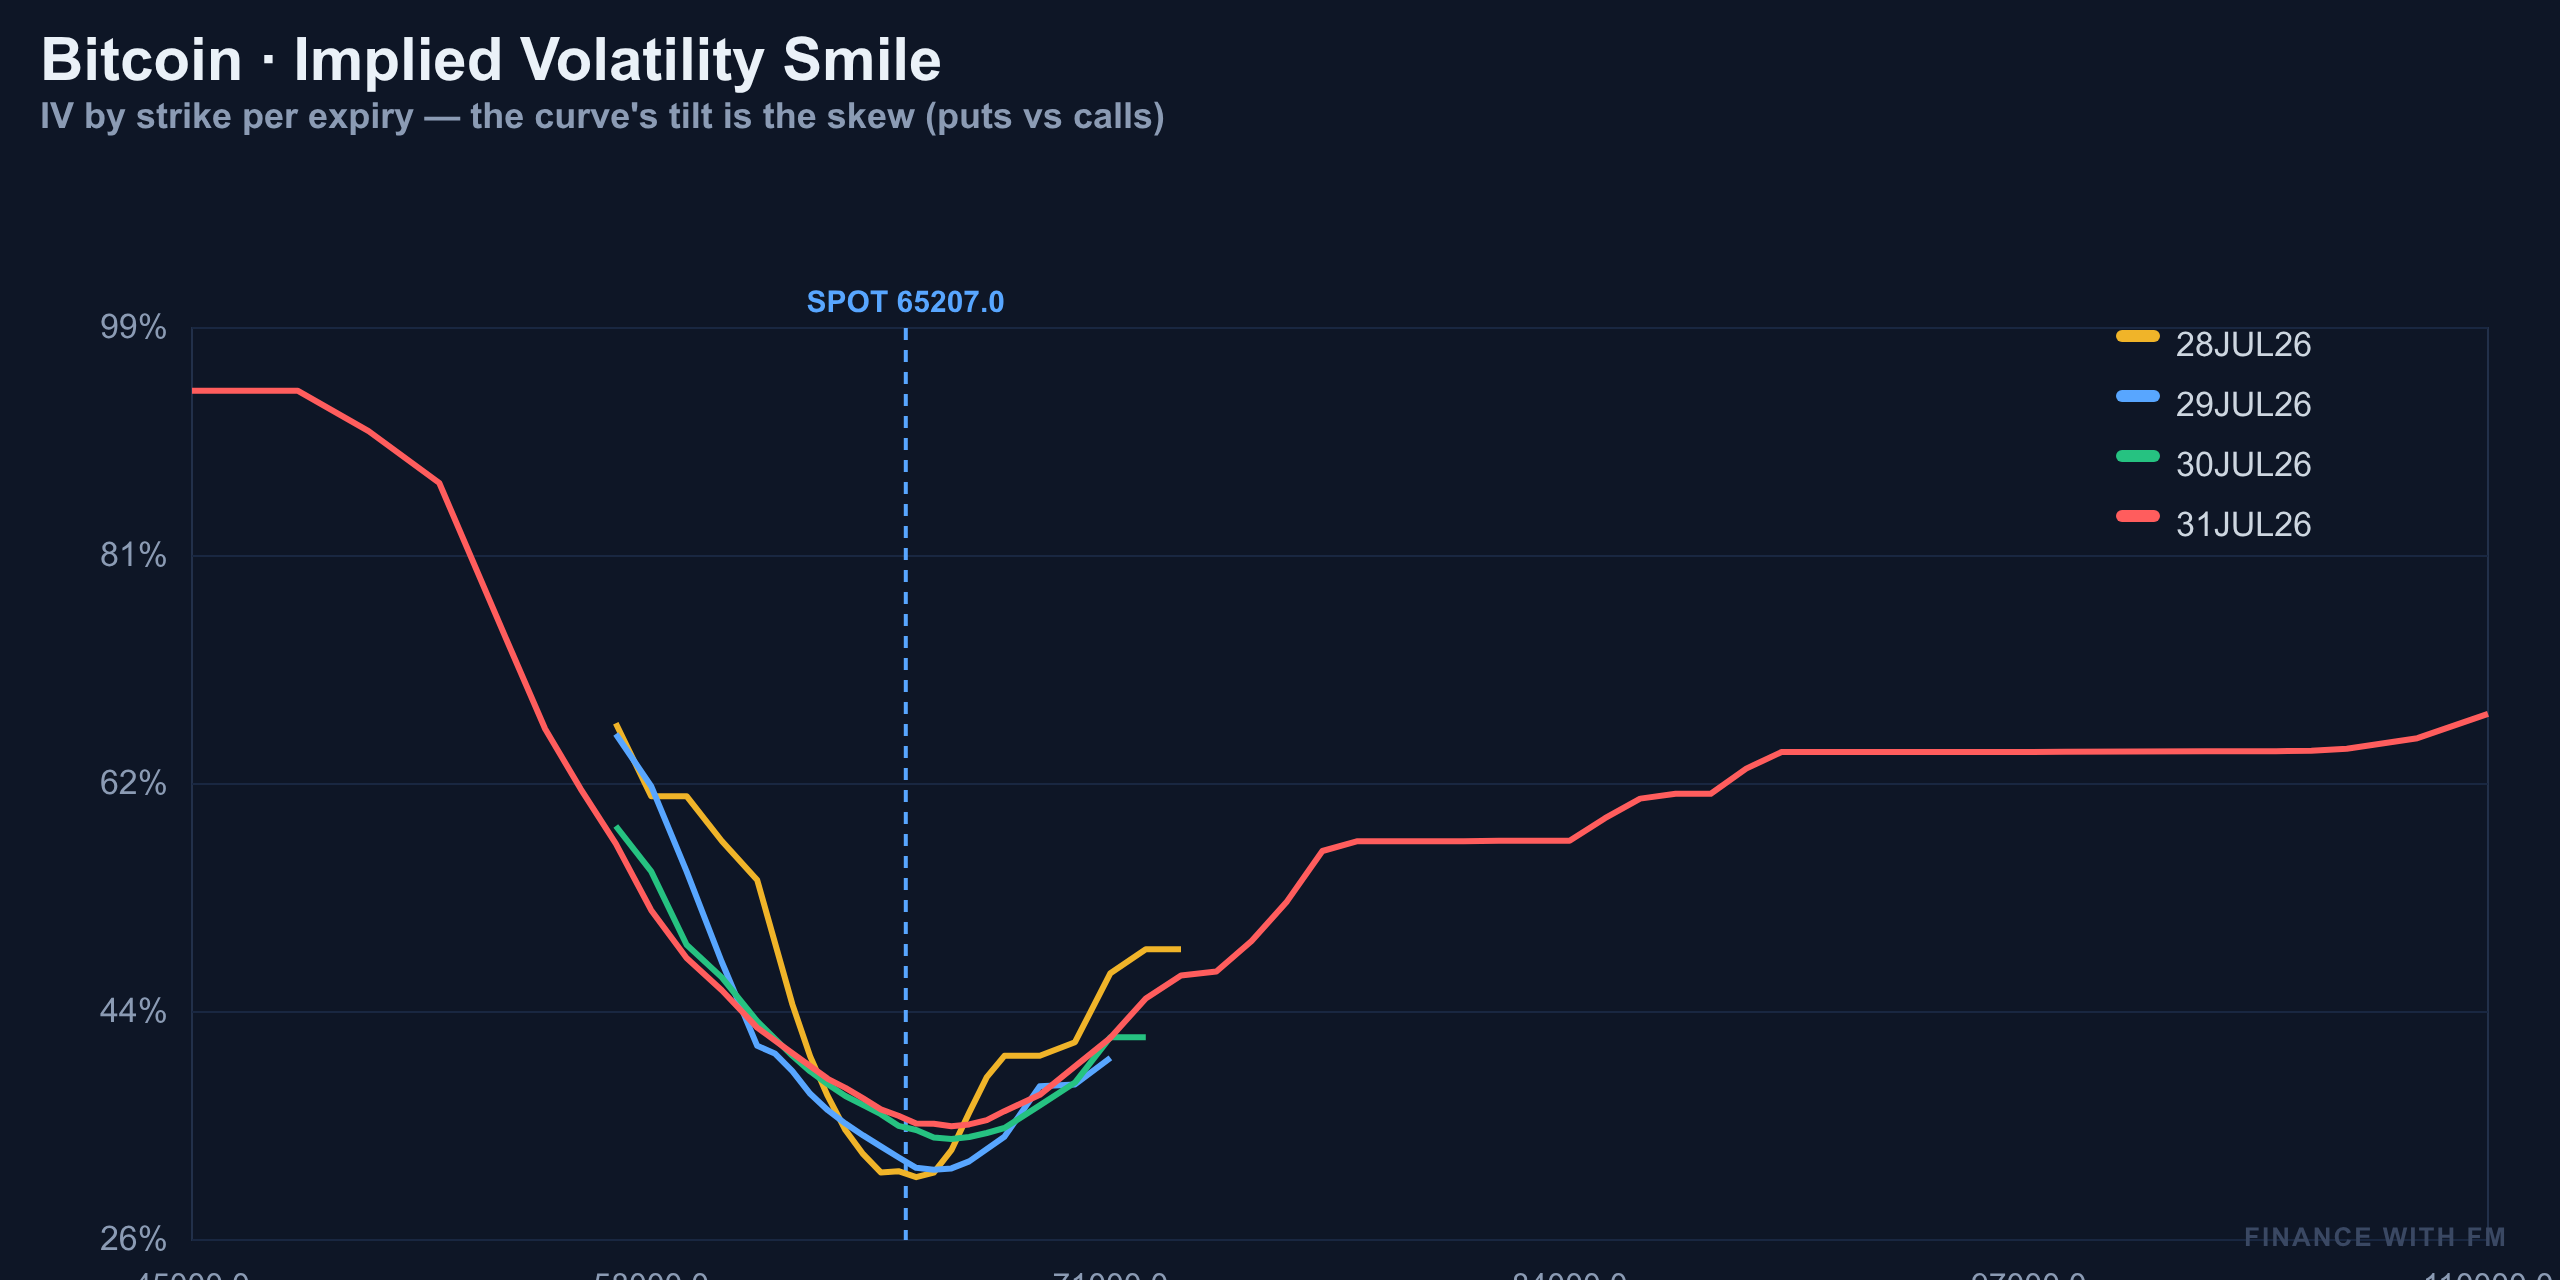
For traders, this combination says selling premium into this calm could pay off — but don't ignore that the market is still nervous underneath the surface. It's not panic-level skew, but it confirms the options market is leaning defensive rather than positioning for a breakout higher.
The Probability Math: What the Market Actually Expects
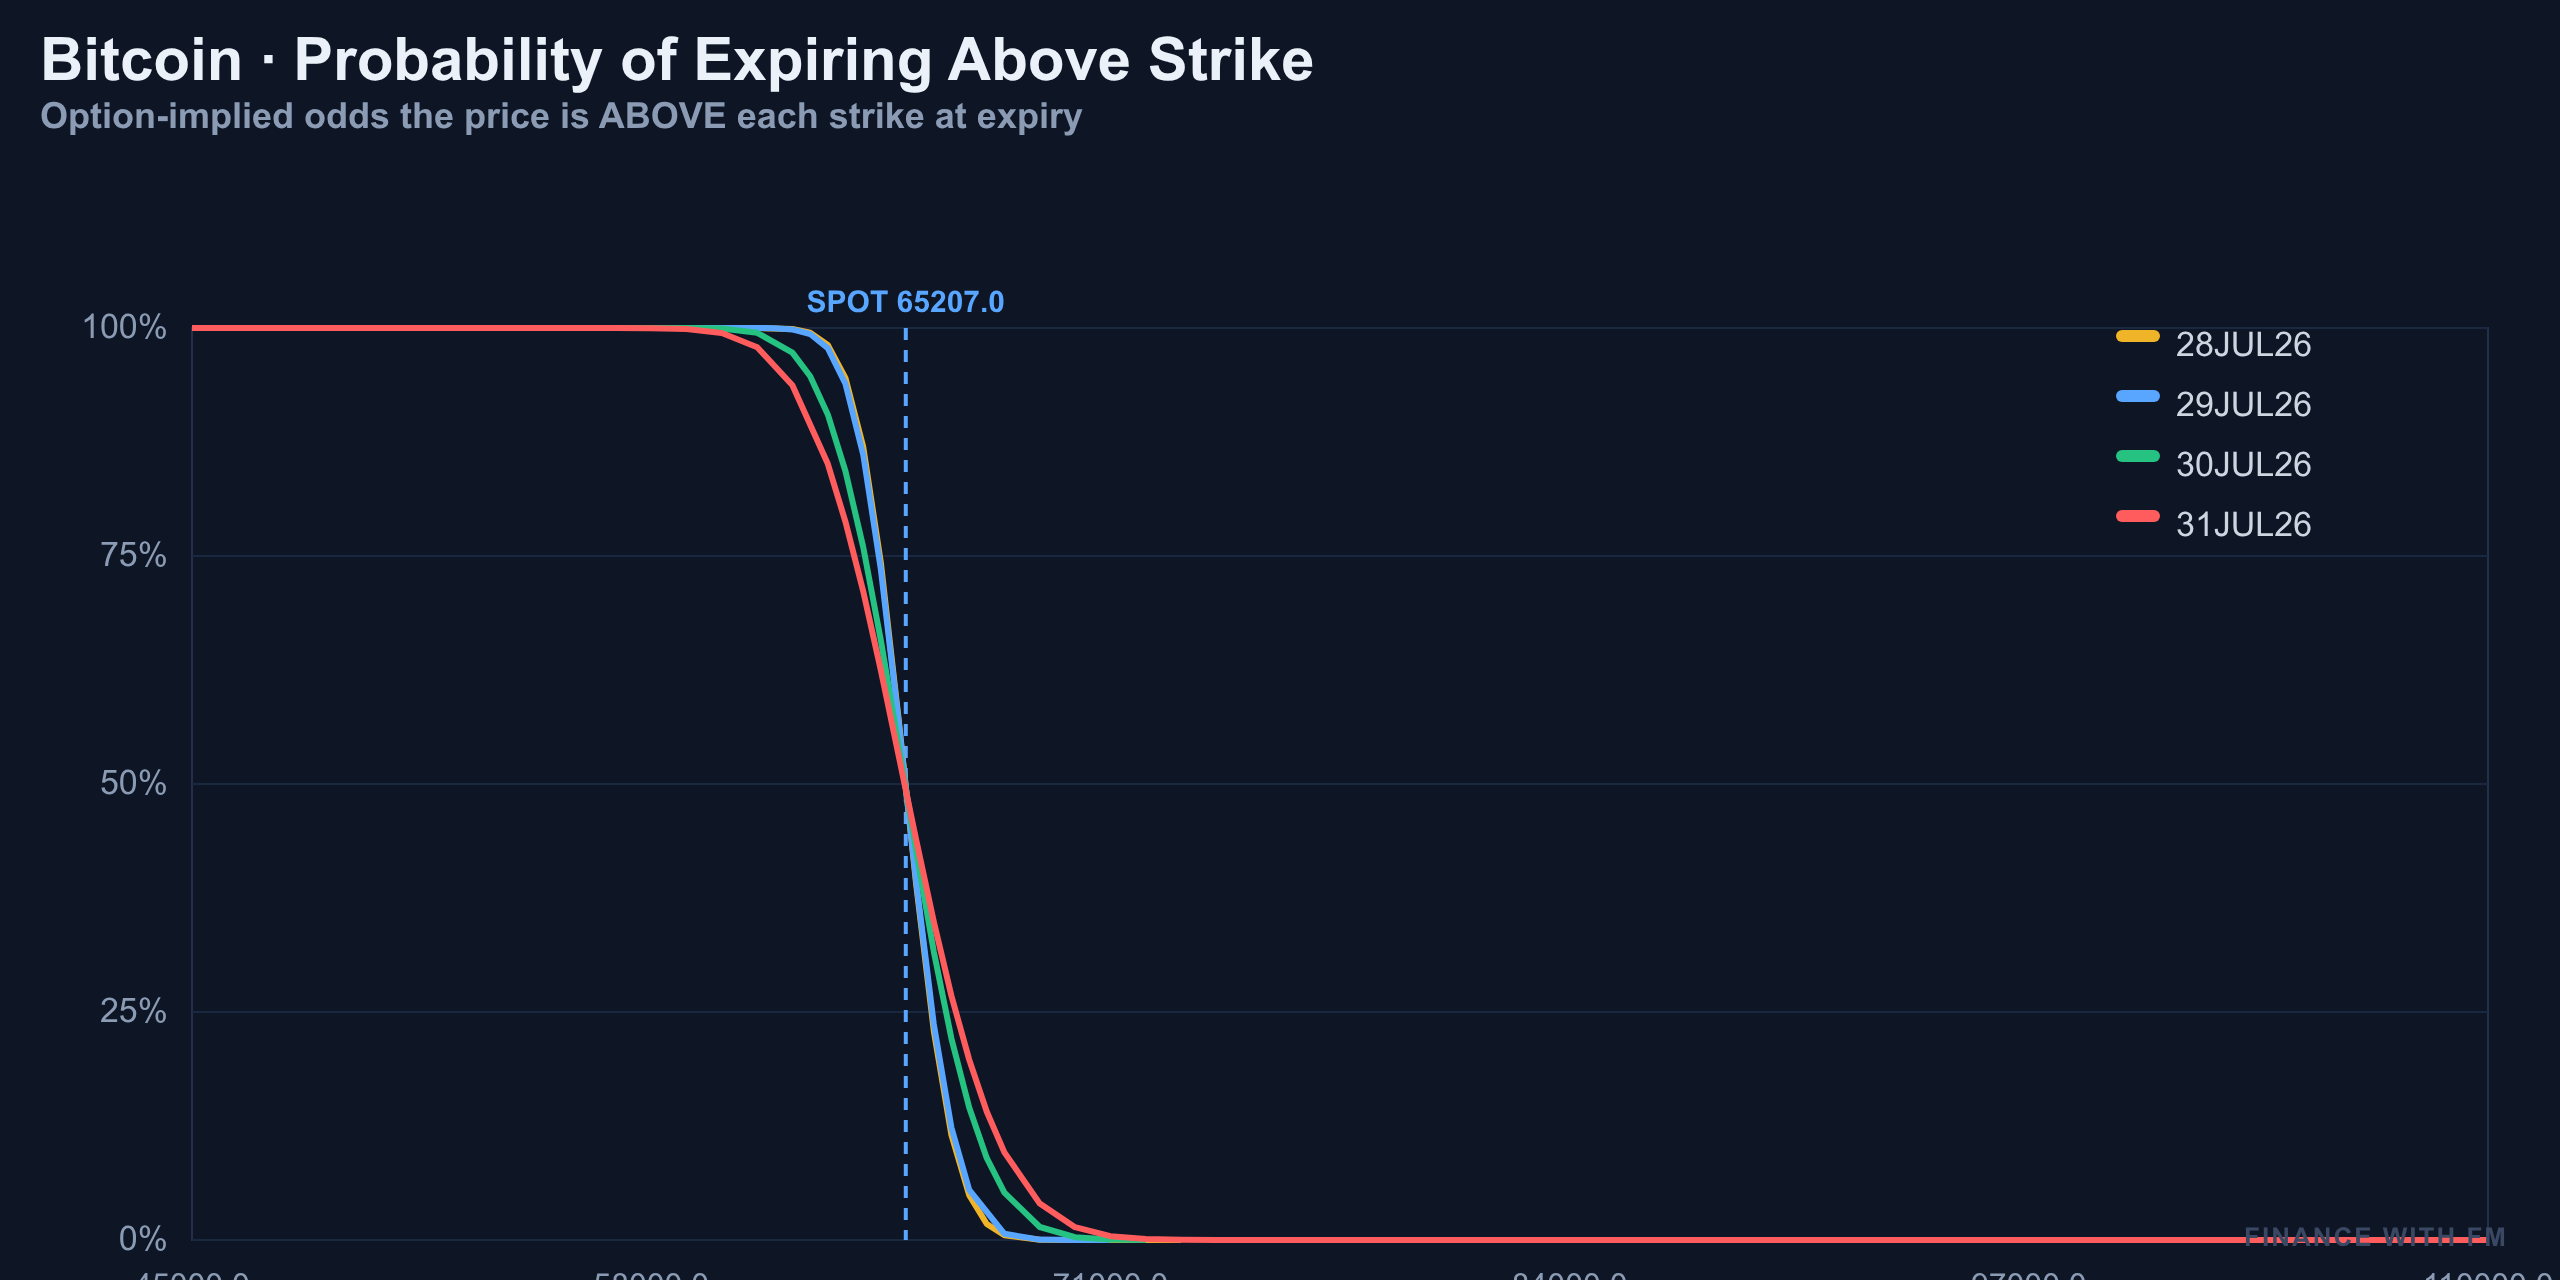
By the end of July, the options market prices essentially zero percent chance Bitcoin closes above $72,000 — that call wall is basically untouchable from here. Closer in, the one-sigma expected move for the next-day expiry spans a fairly tight band, meaning roughly two-thirds odds price stays inside it.
| Range | Band | Confidence |
|---|---|---|
| 1-Sigma (Next-Day) | $63,800 – $66,500 | ~68% |
| 2-Sigma (Next-Day) | $62,400 – $67,800 | ~95% |
| Month-End Above $72,000 | N/A | ~0% |
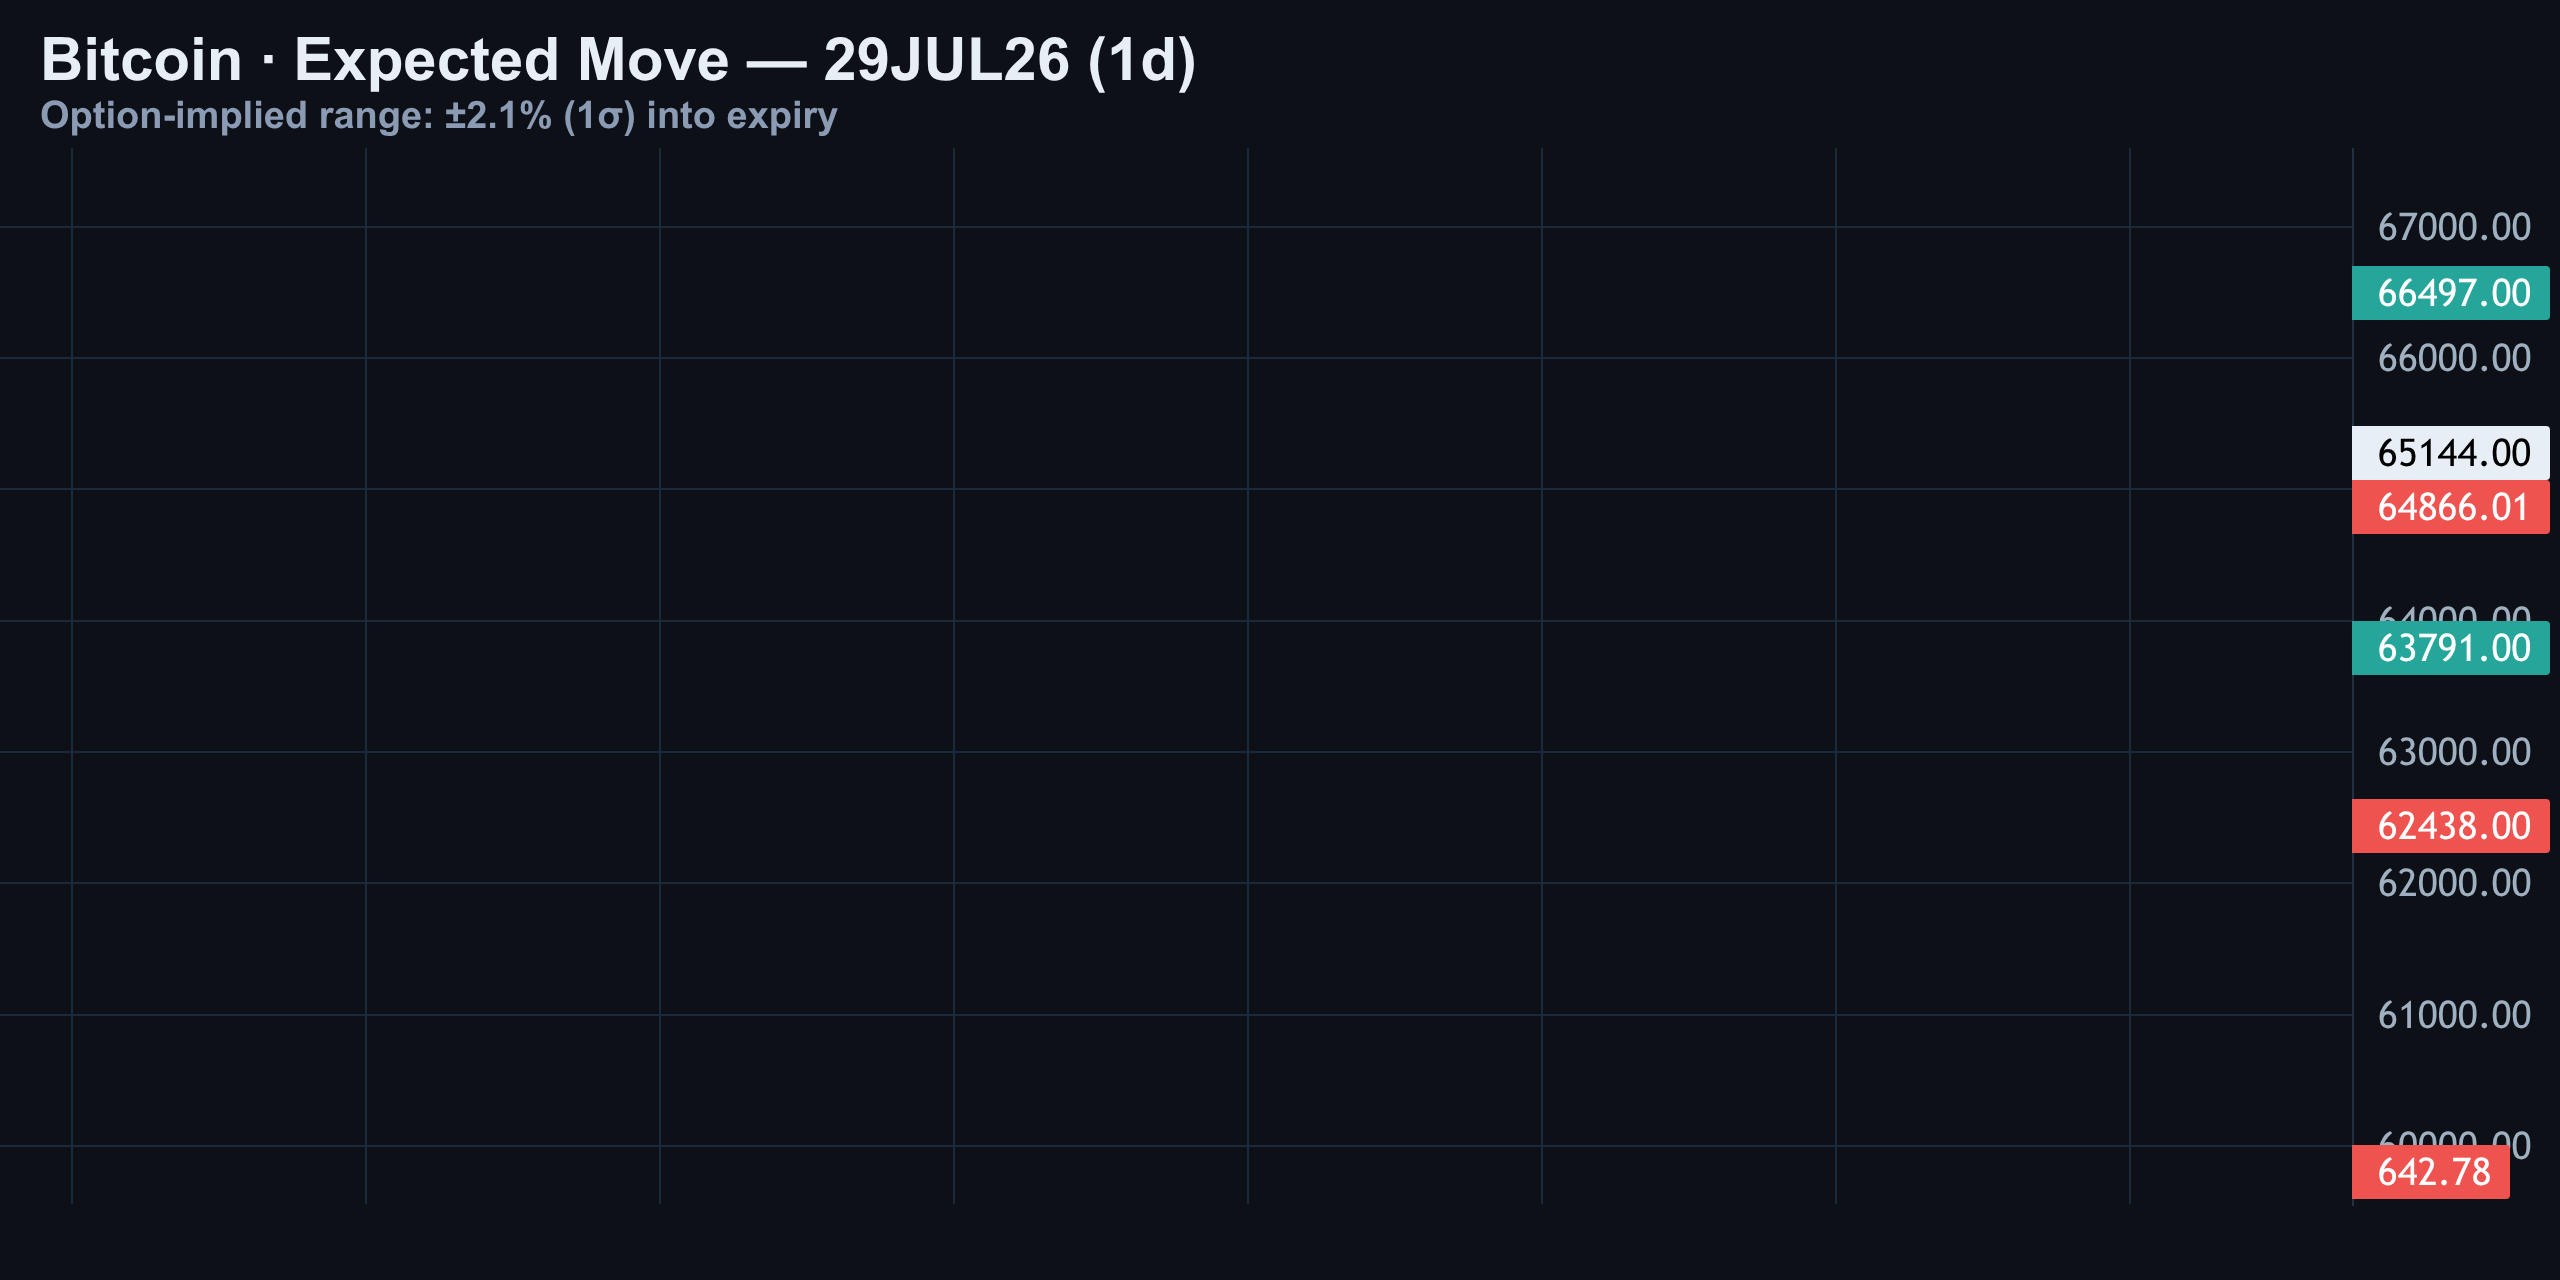
Translation: a big move in either direction is still the low-probability bet. The options market is telling you this is a range to fade, not a breakout to chase — at least until one of these bands gets violated with volume.
Whale Watch: Block-Trade Flow Leans Quietly Bearish
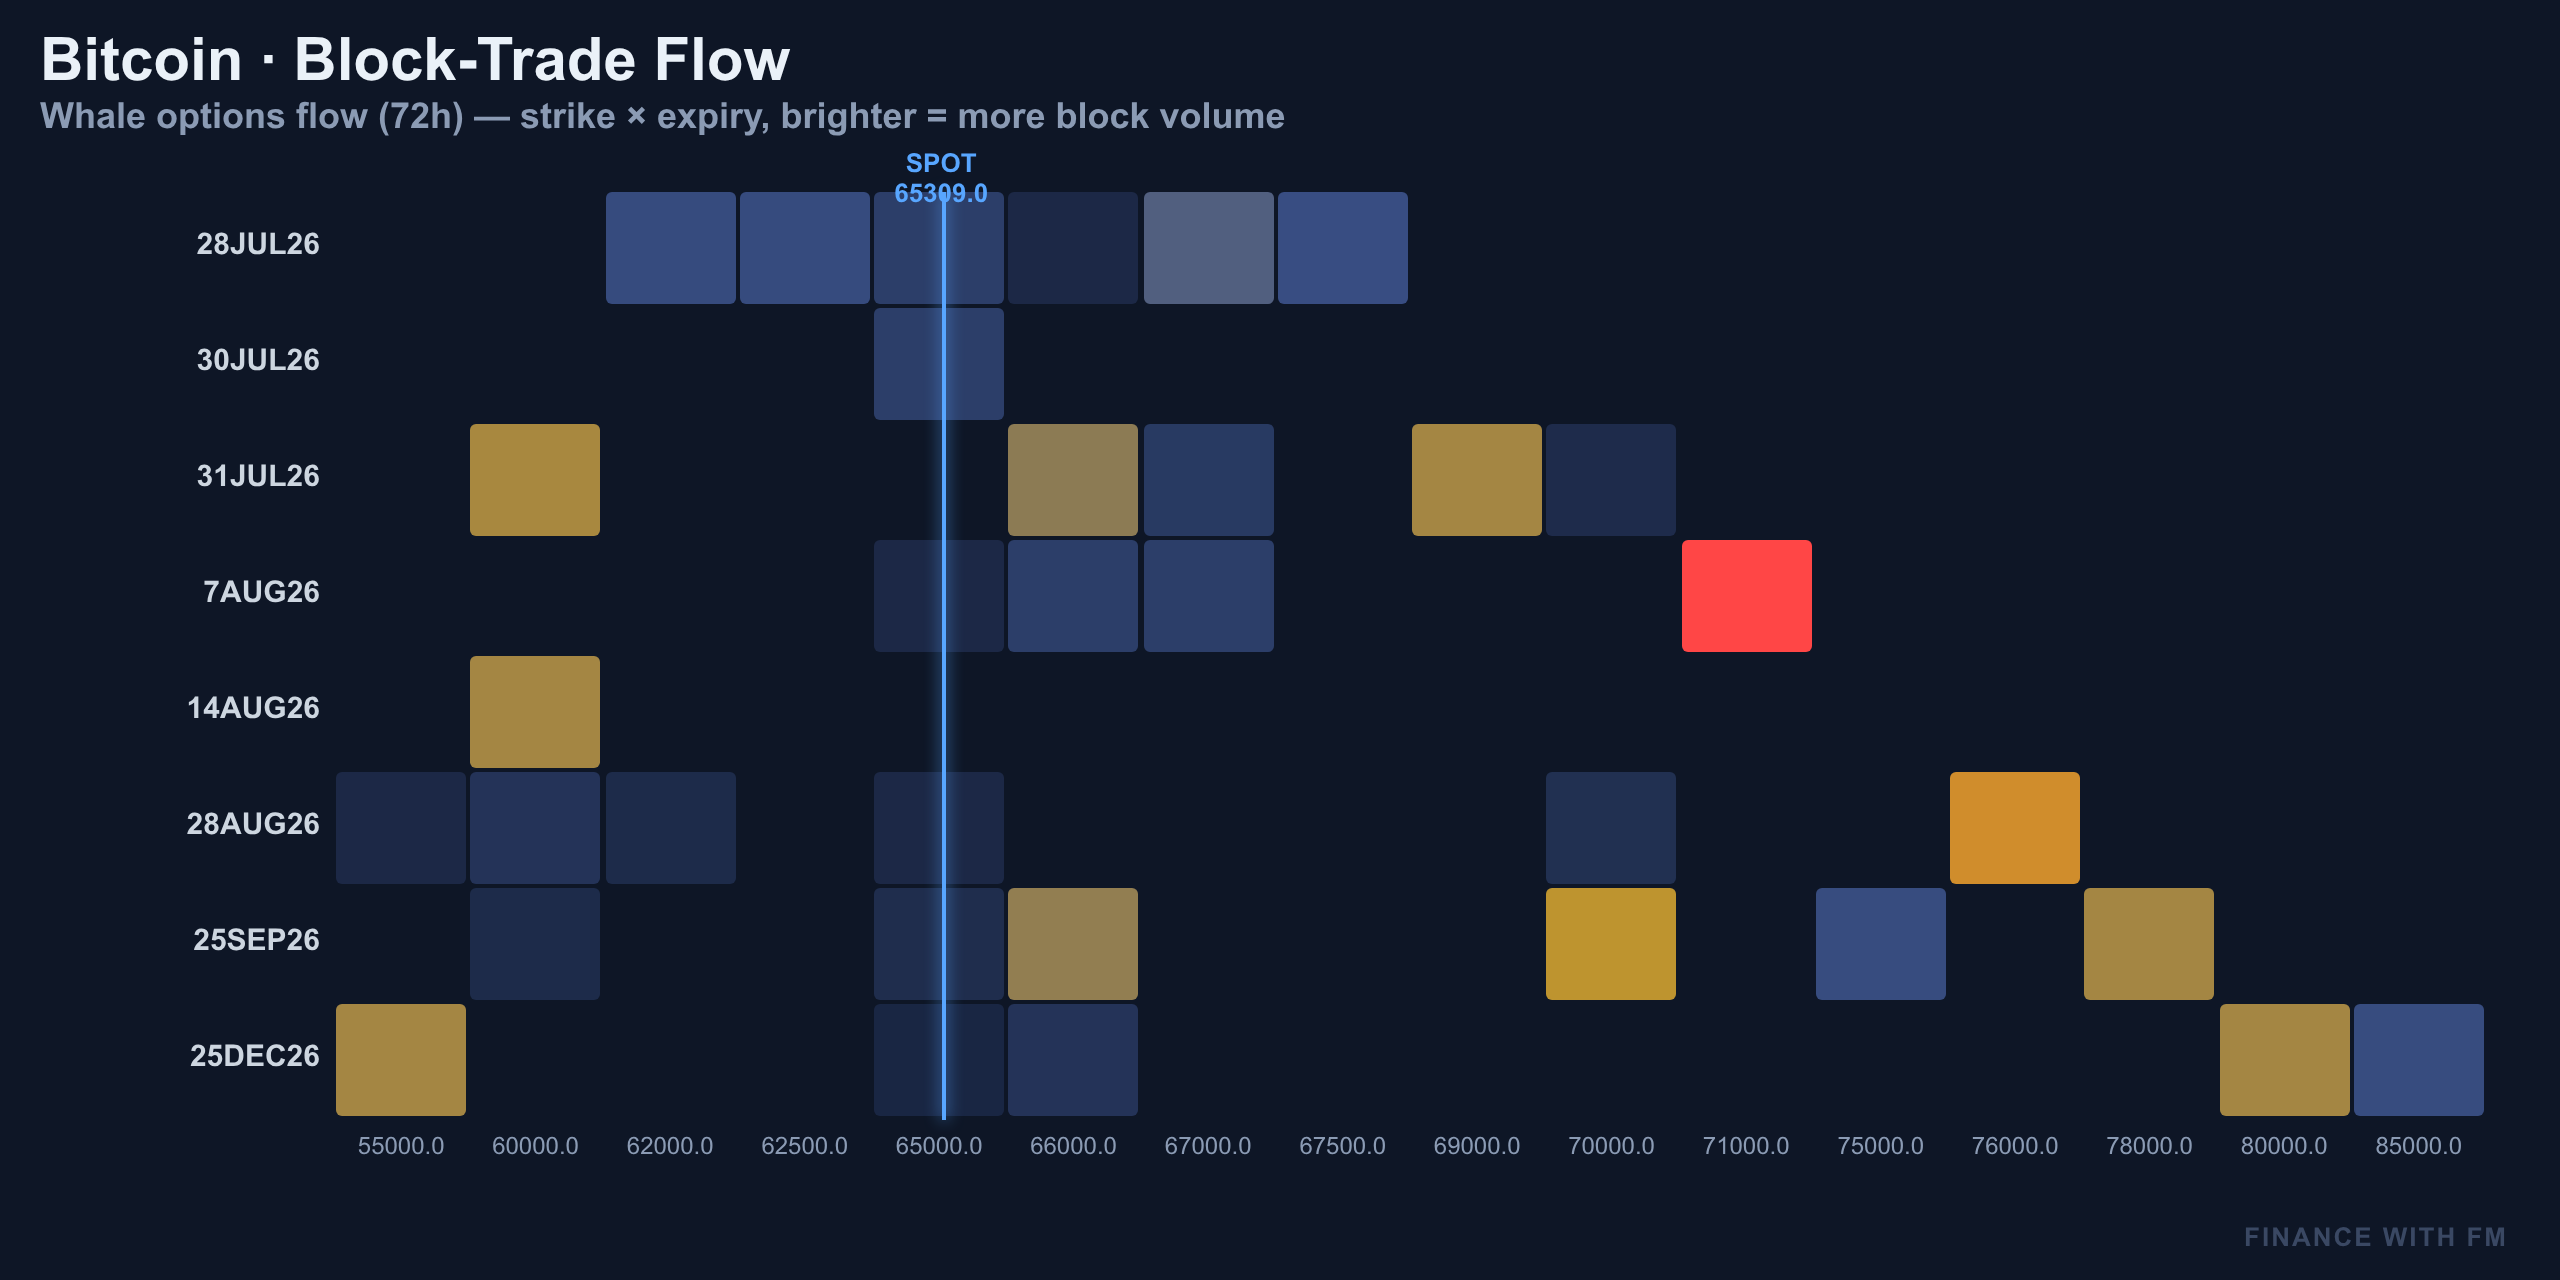
The block flow tells a subdued but directional story. Whales bought about 1,800 calls but sold over 2,300, while buying 560 puts against selling 665. Net, that's calls being sold and puts being bought — a bearish lean from the smart money, even if it's not a loud one.
| Instrument | Bought | Sold | Net Lean |
|---|---|---|---|
| Calls | 1,800 | 2,300+ | Bearish |
| Puts | 560 | 665 | Bearish (hedging) |
The heaviest block trades cluster out at $71,000 on the August 7 expiry and $76,000 on the August 28 expiry. Even the longer-dated whale bets are hedged higher up, not chasing this range lower down — meaning the smart money is positioning for eventual upside optionality, not betting on it happening this week.
Technical Structure Across Timeframes: Coiled, Not Trending
15-Minute: Coiling Inside a Rising Channel
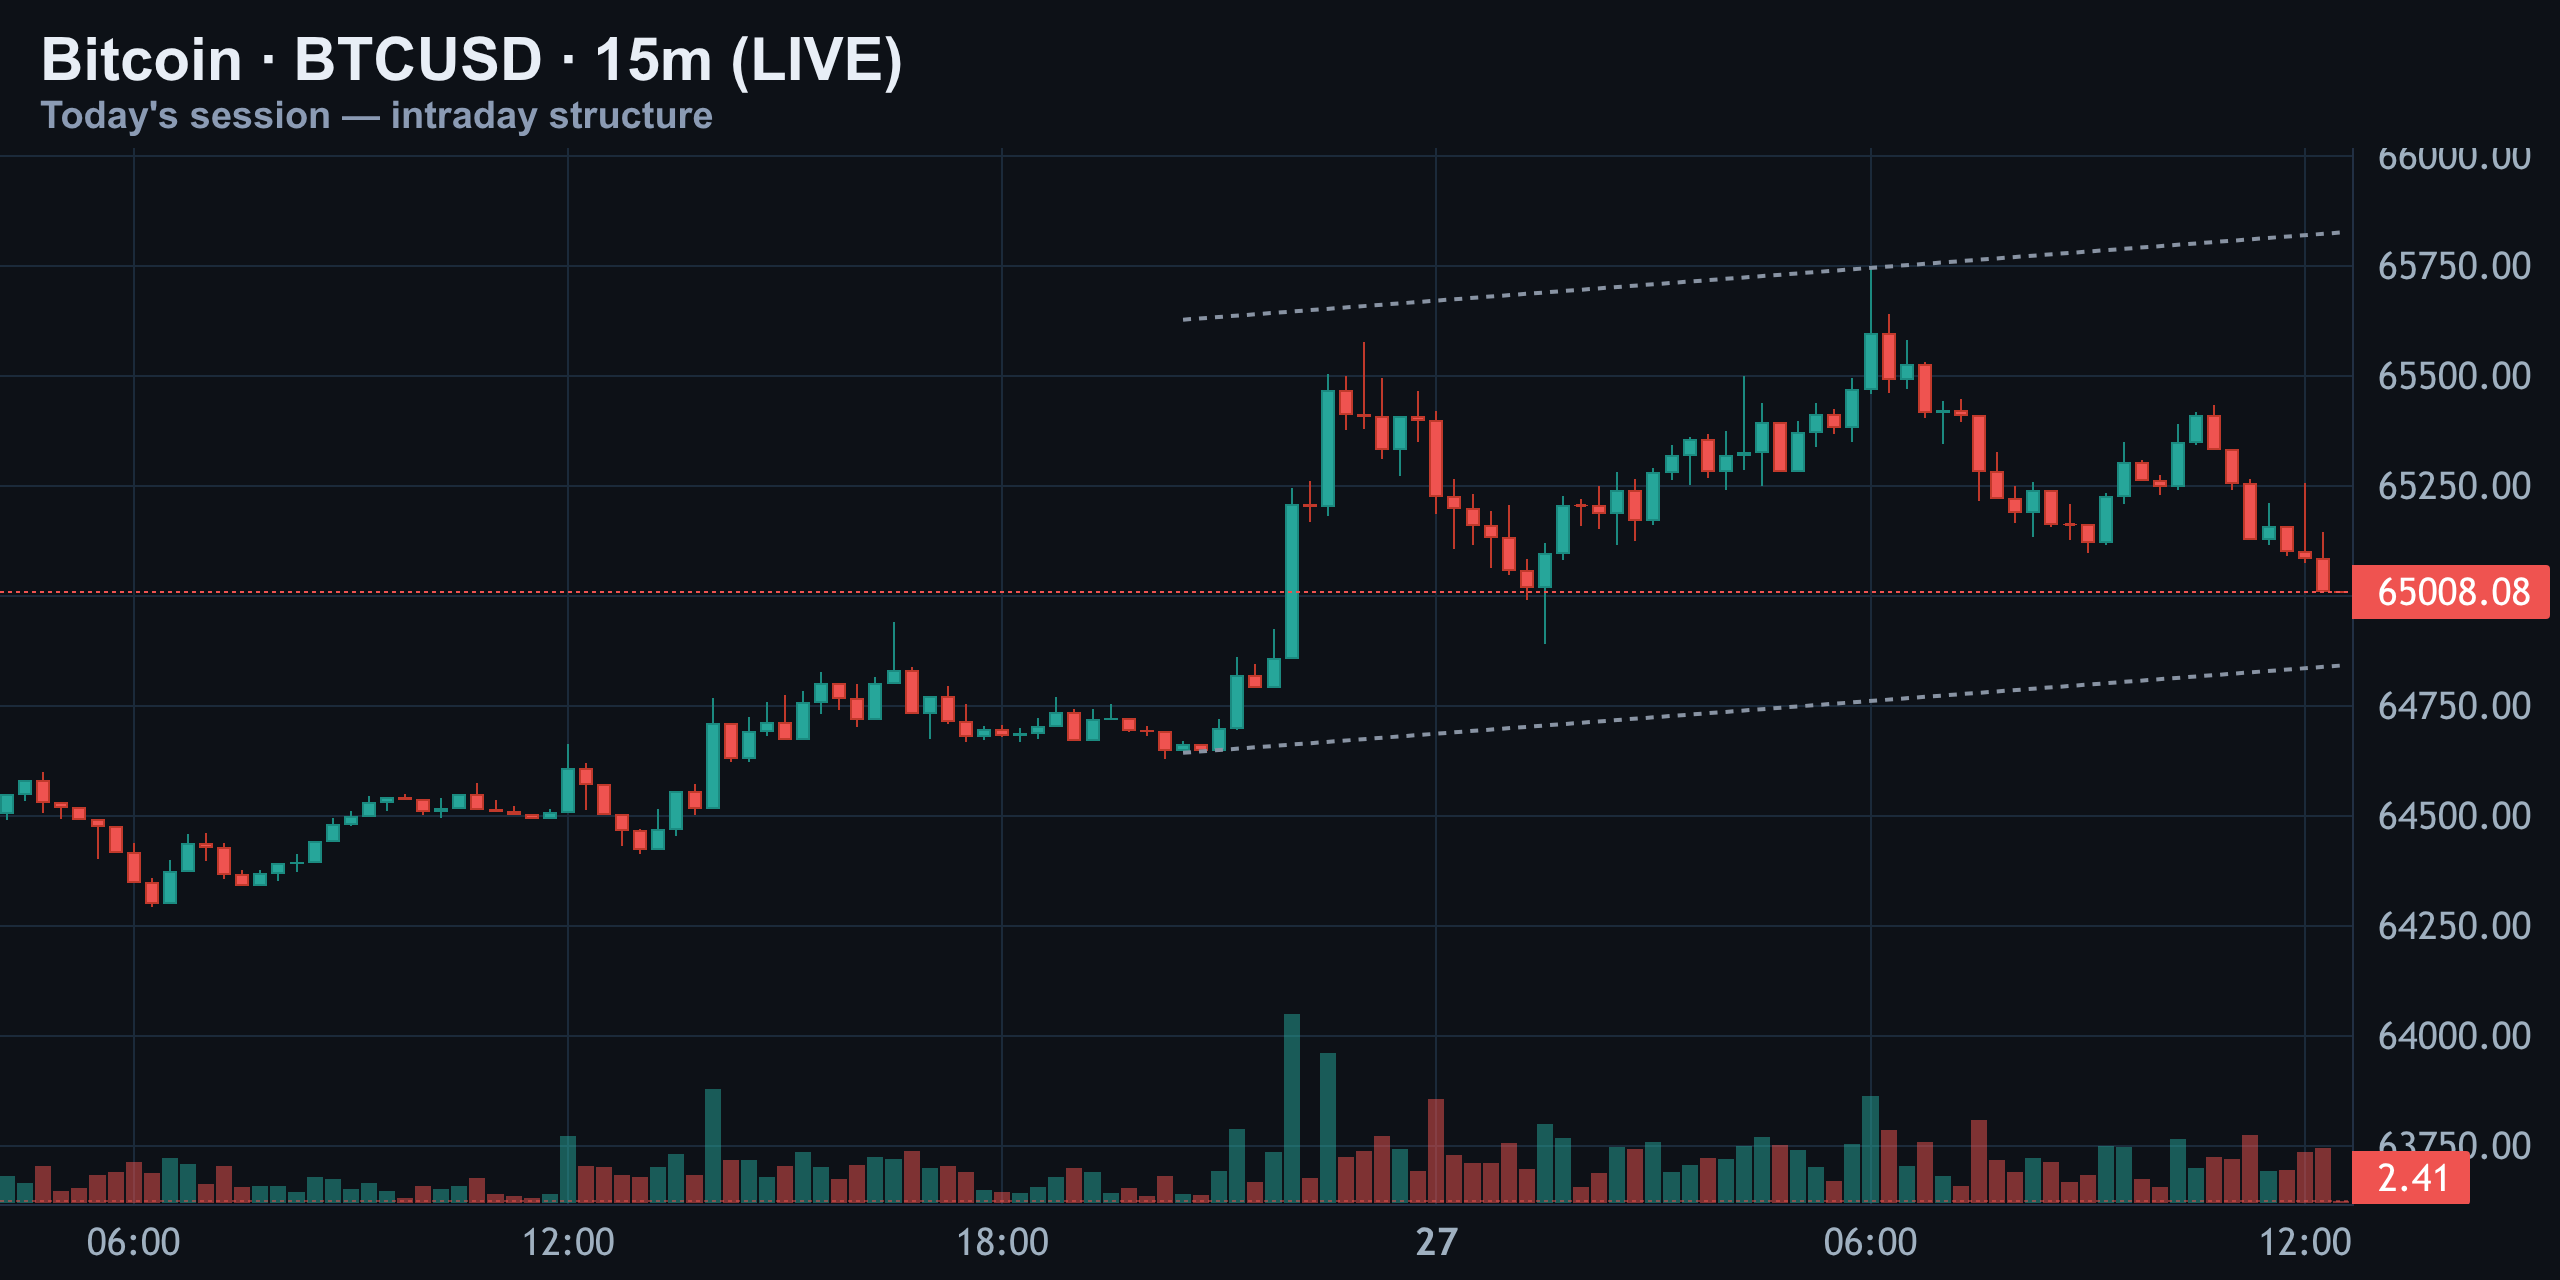
On the 15-minute chart, Bitcoin has been climbing inside a clean ascending channel since yesterday, bouncing off the lower rail near $64,700 and stalling under the upper rail close to $65,900. Price is currently sliding back toward $65,008 — today's pivot line. Volume on the pullback is light, which usually signals profit-taking rather than a real trend reversal.
4-Hour: A Range Between $63,000 and $67,000
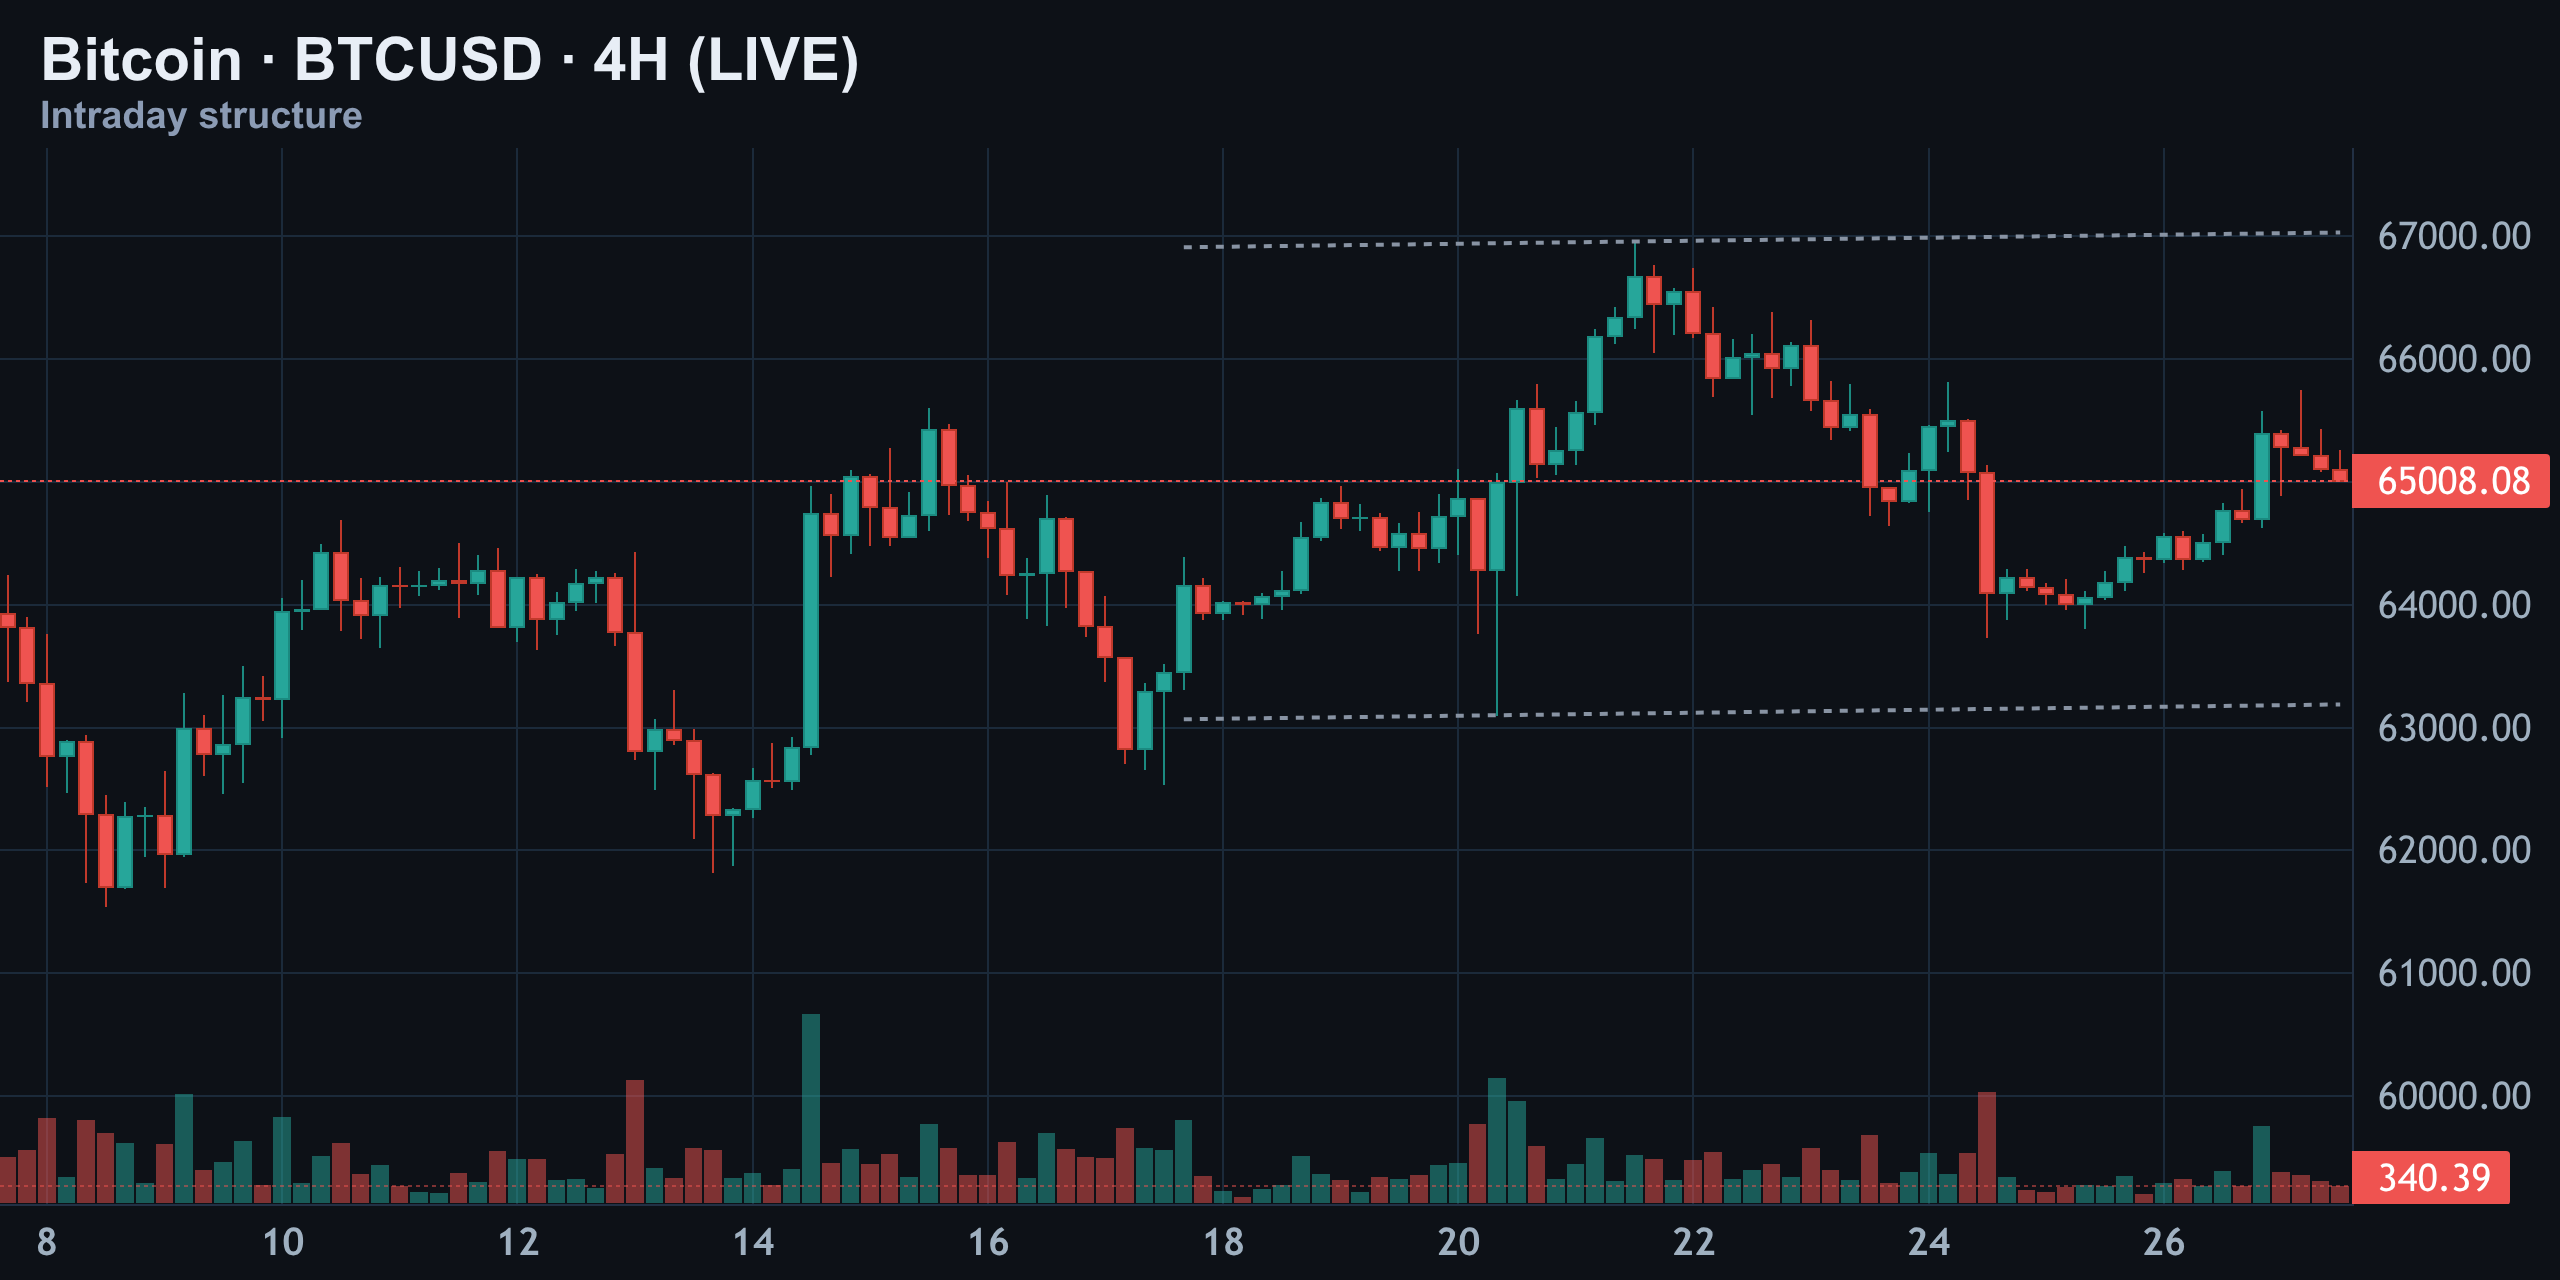
Zoom out to four hours and the picture is a range, not a trend. Bitcoin tapped just under $67,000 twice this week and got sold both times, while buyers kept defending a rising floor near $63,000–$64,000. Price sits almost exactly in the middle of that box right now.
Daily: Trapped Between Support and Resistance
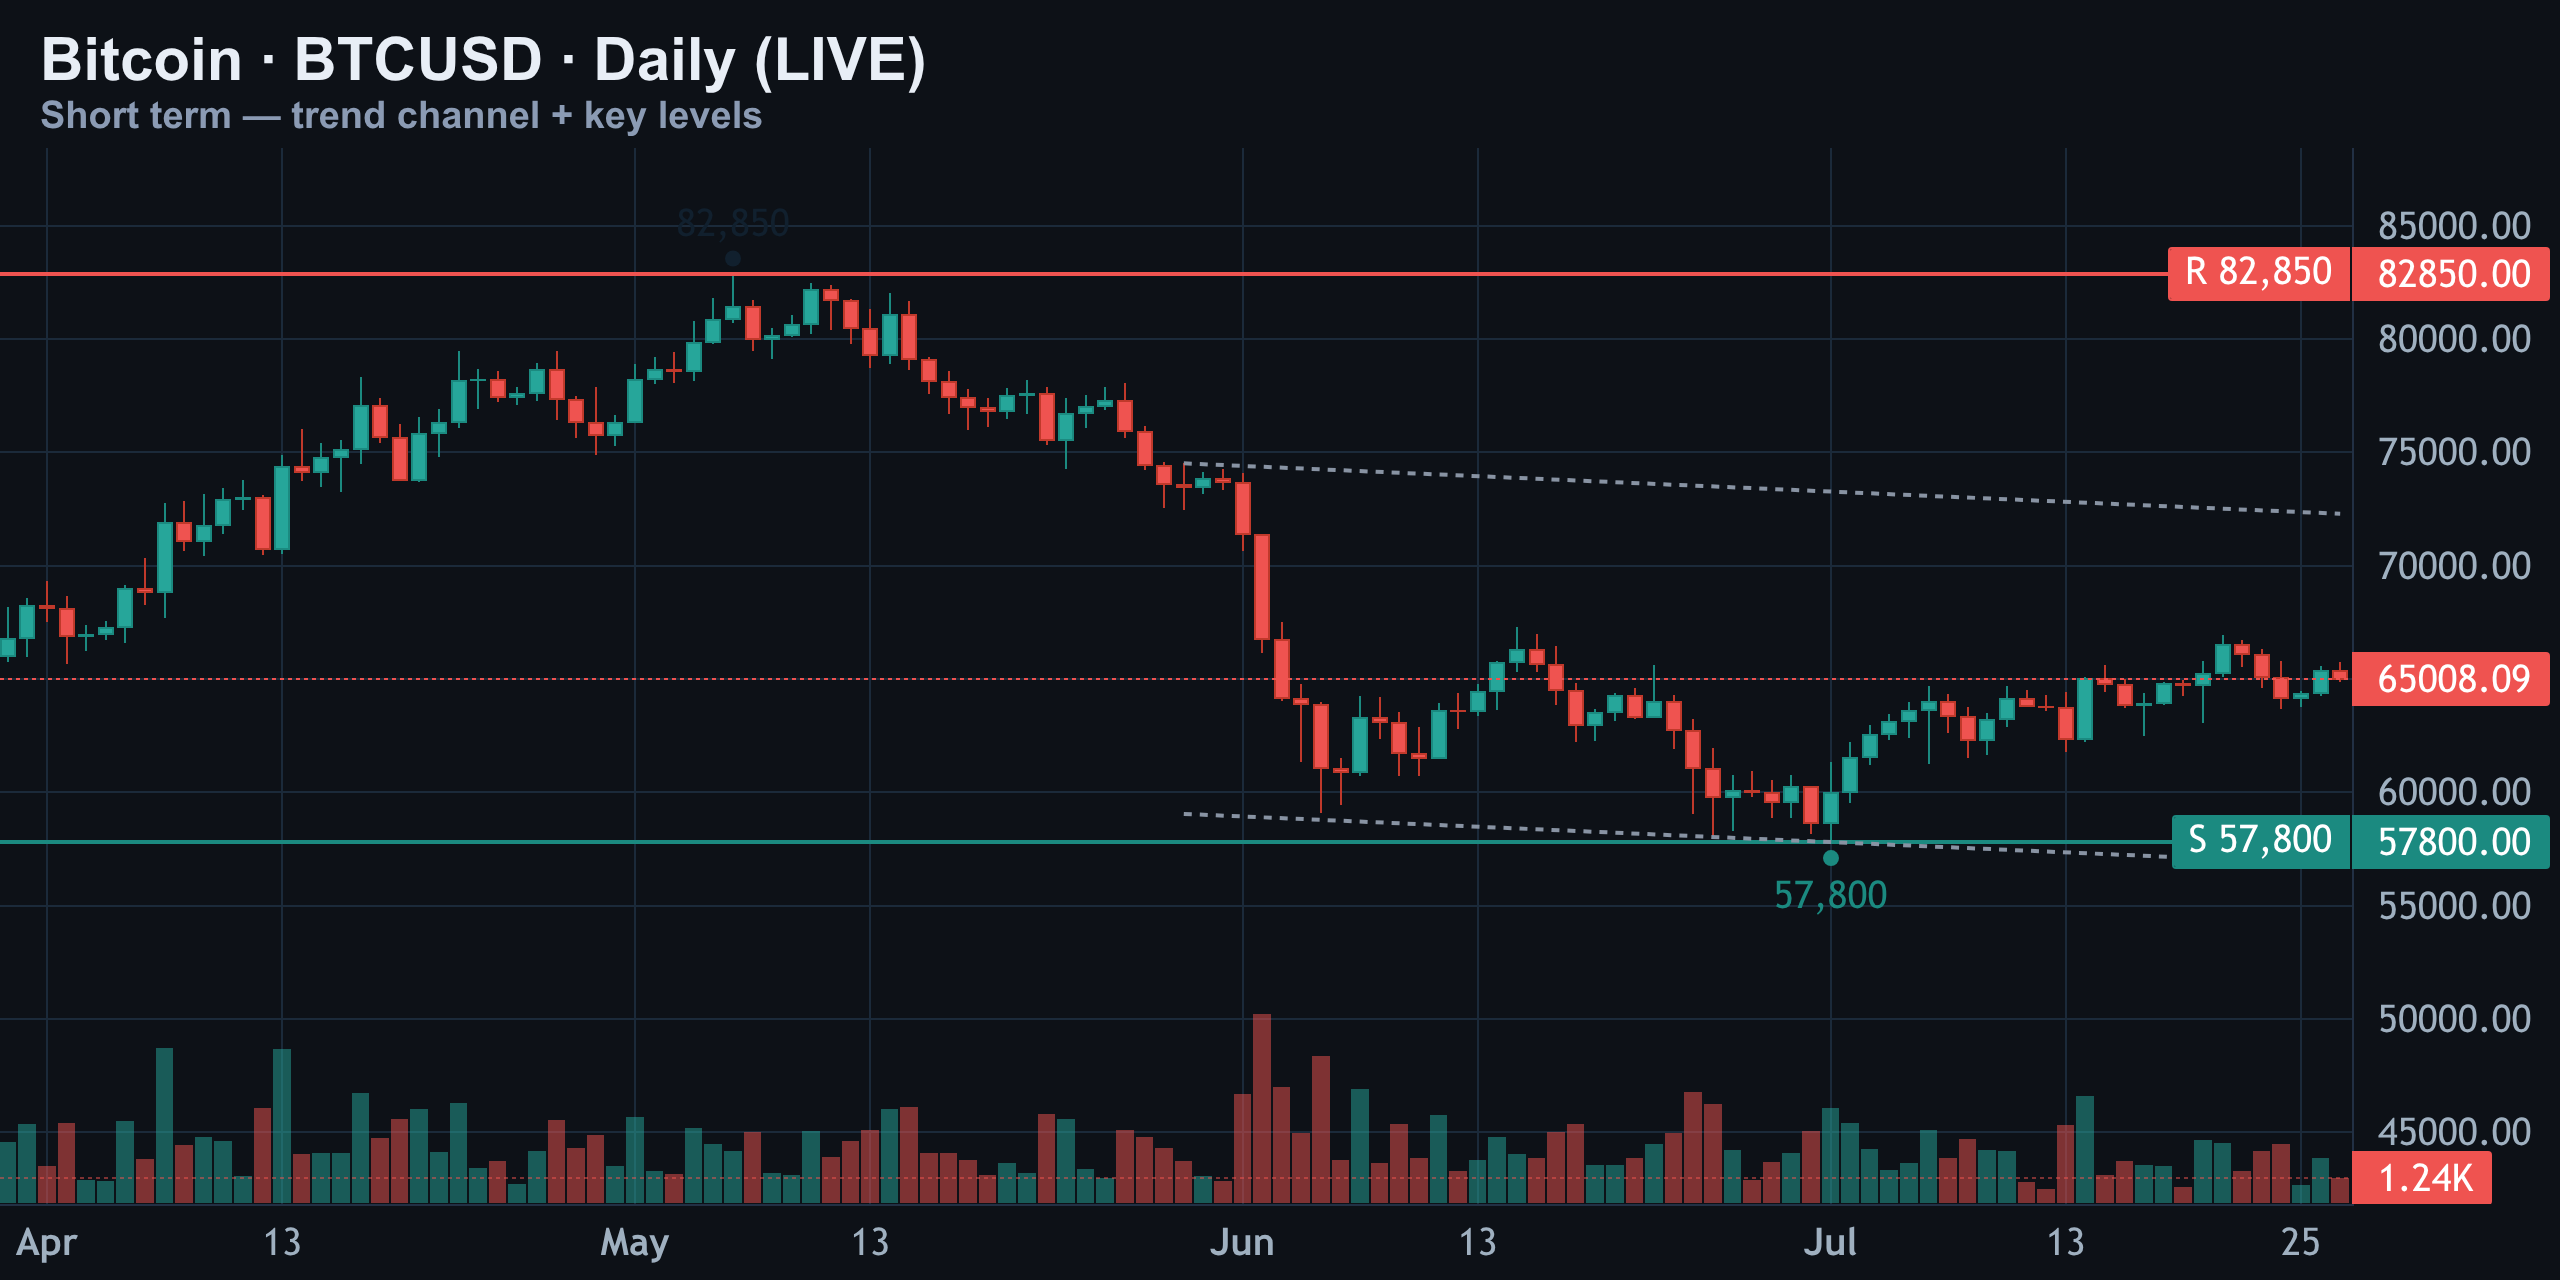
On the daily timeframe, Bitcoin remains trapped between the 50-day and 200-day moving averages — the same structural stall that kept us on the sidelines yesterday. Nothing about the daily close changes that picture.
Momentum: RSI and MACD Offer No Edge
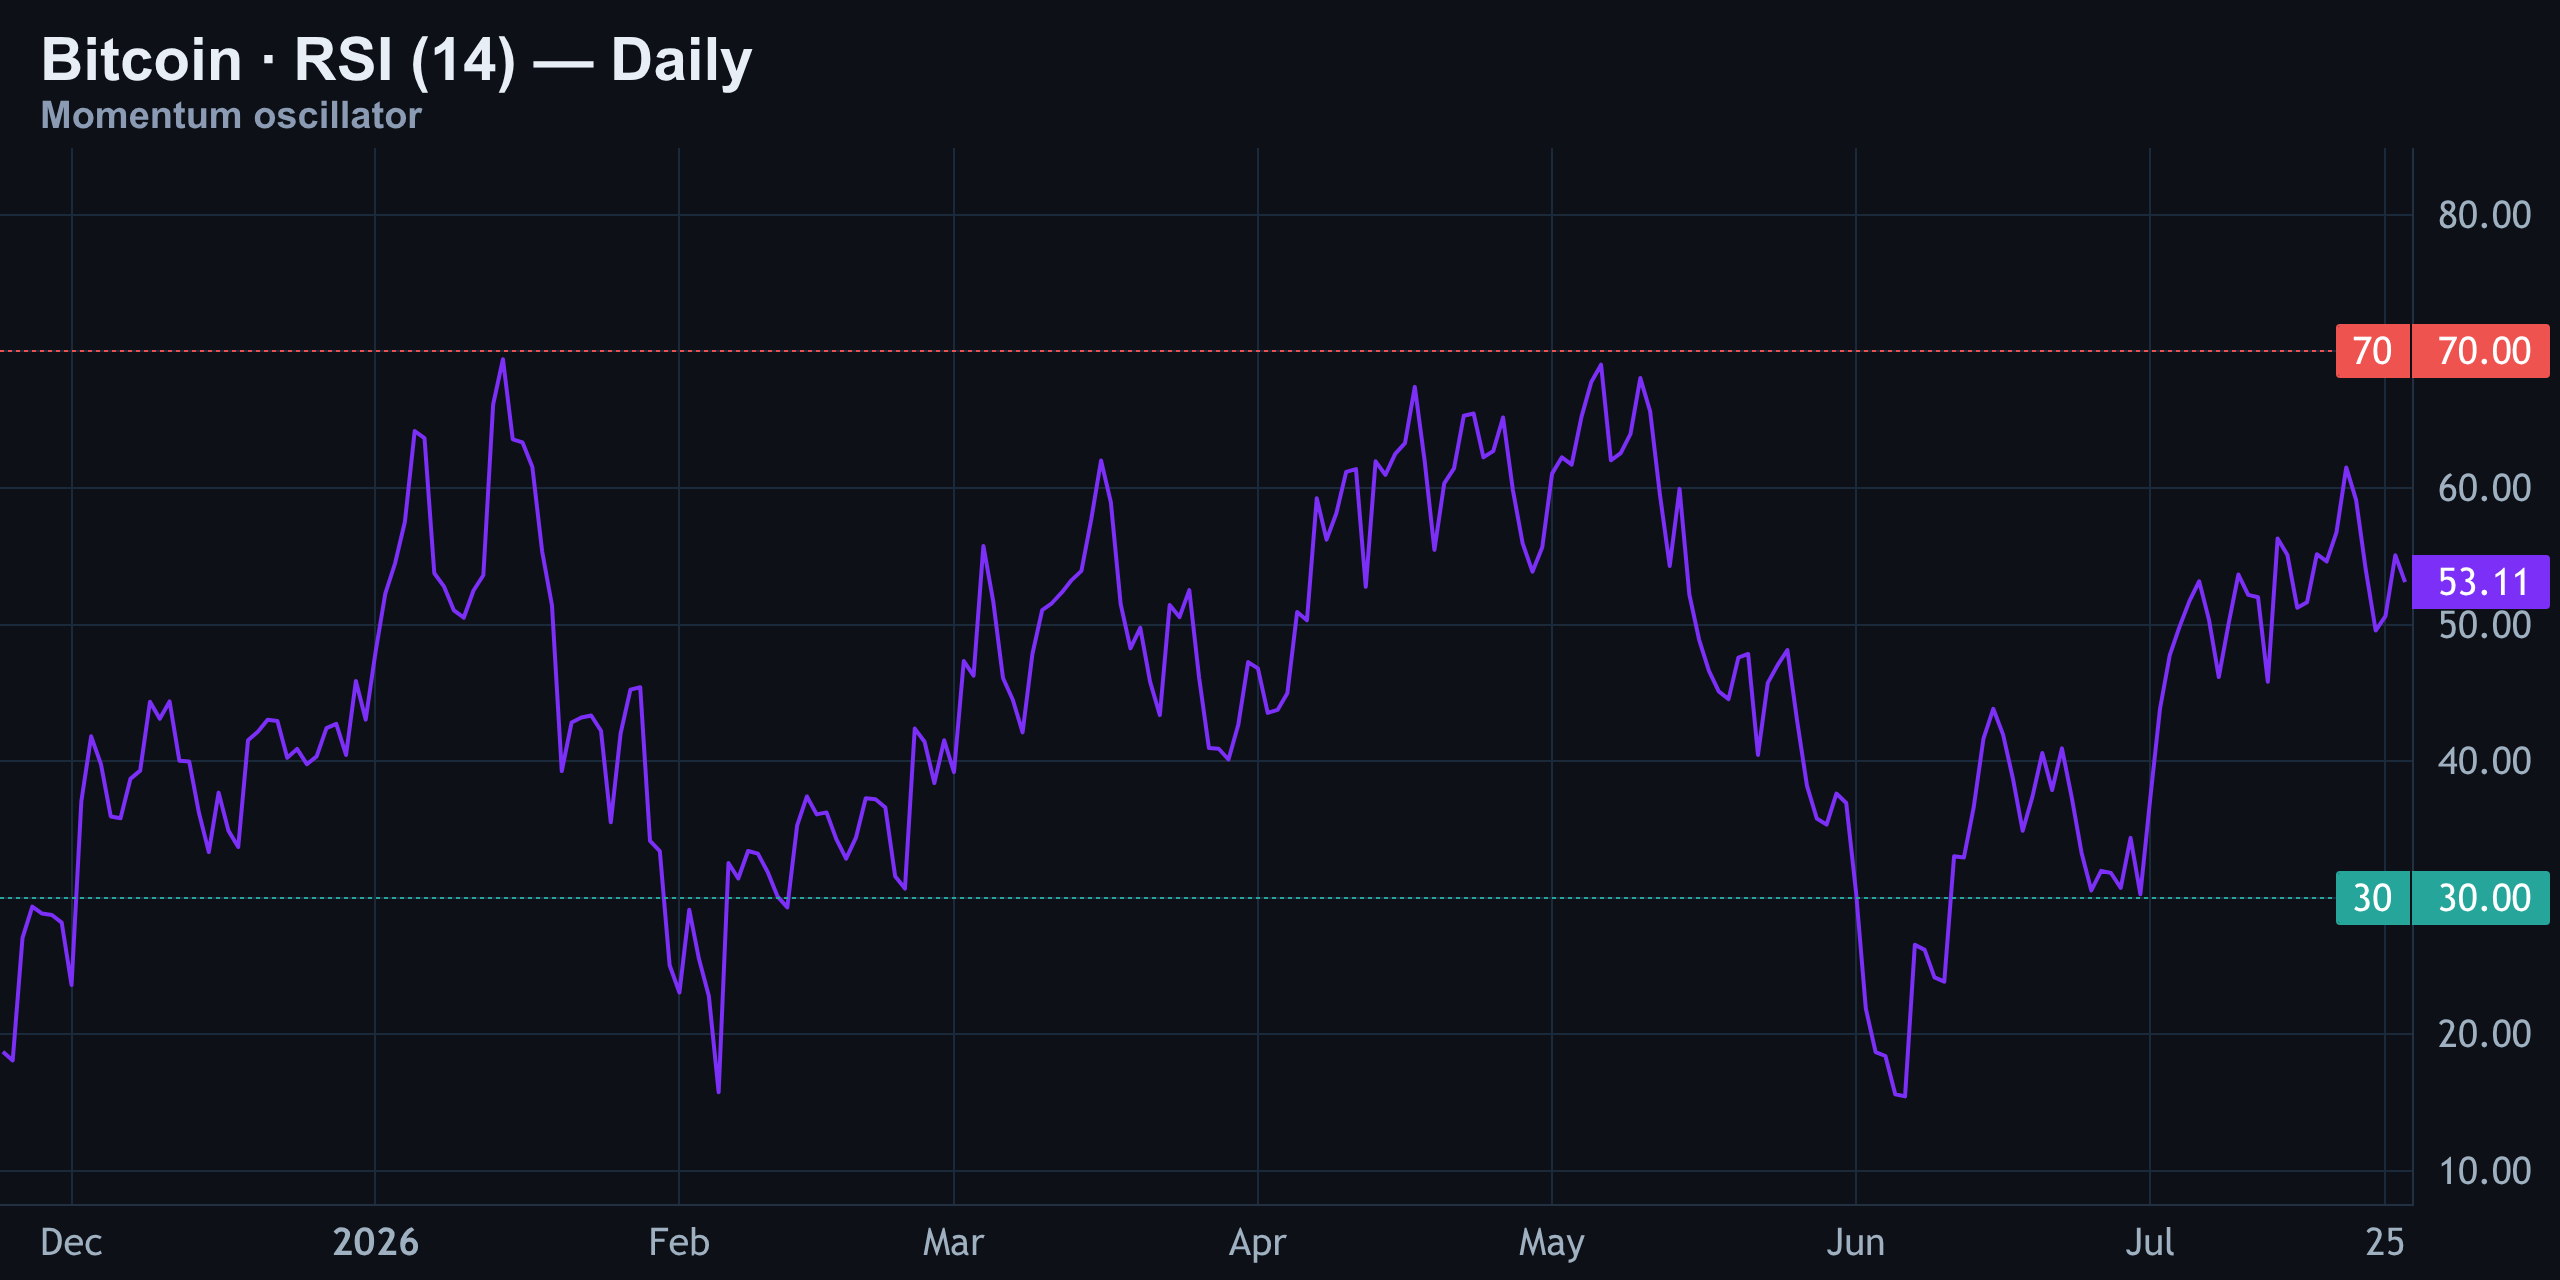
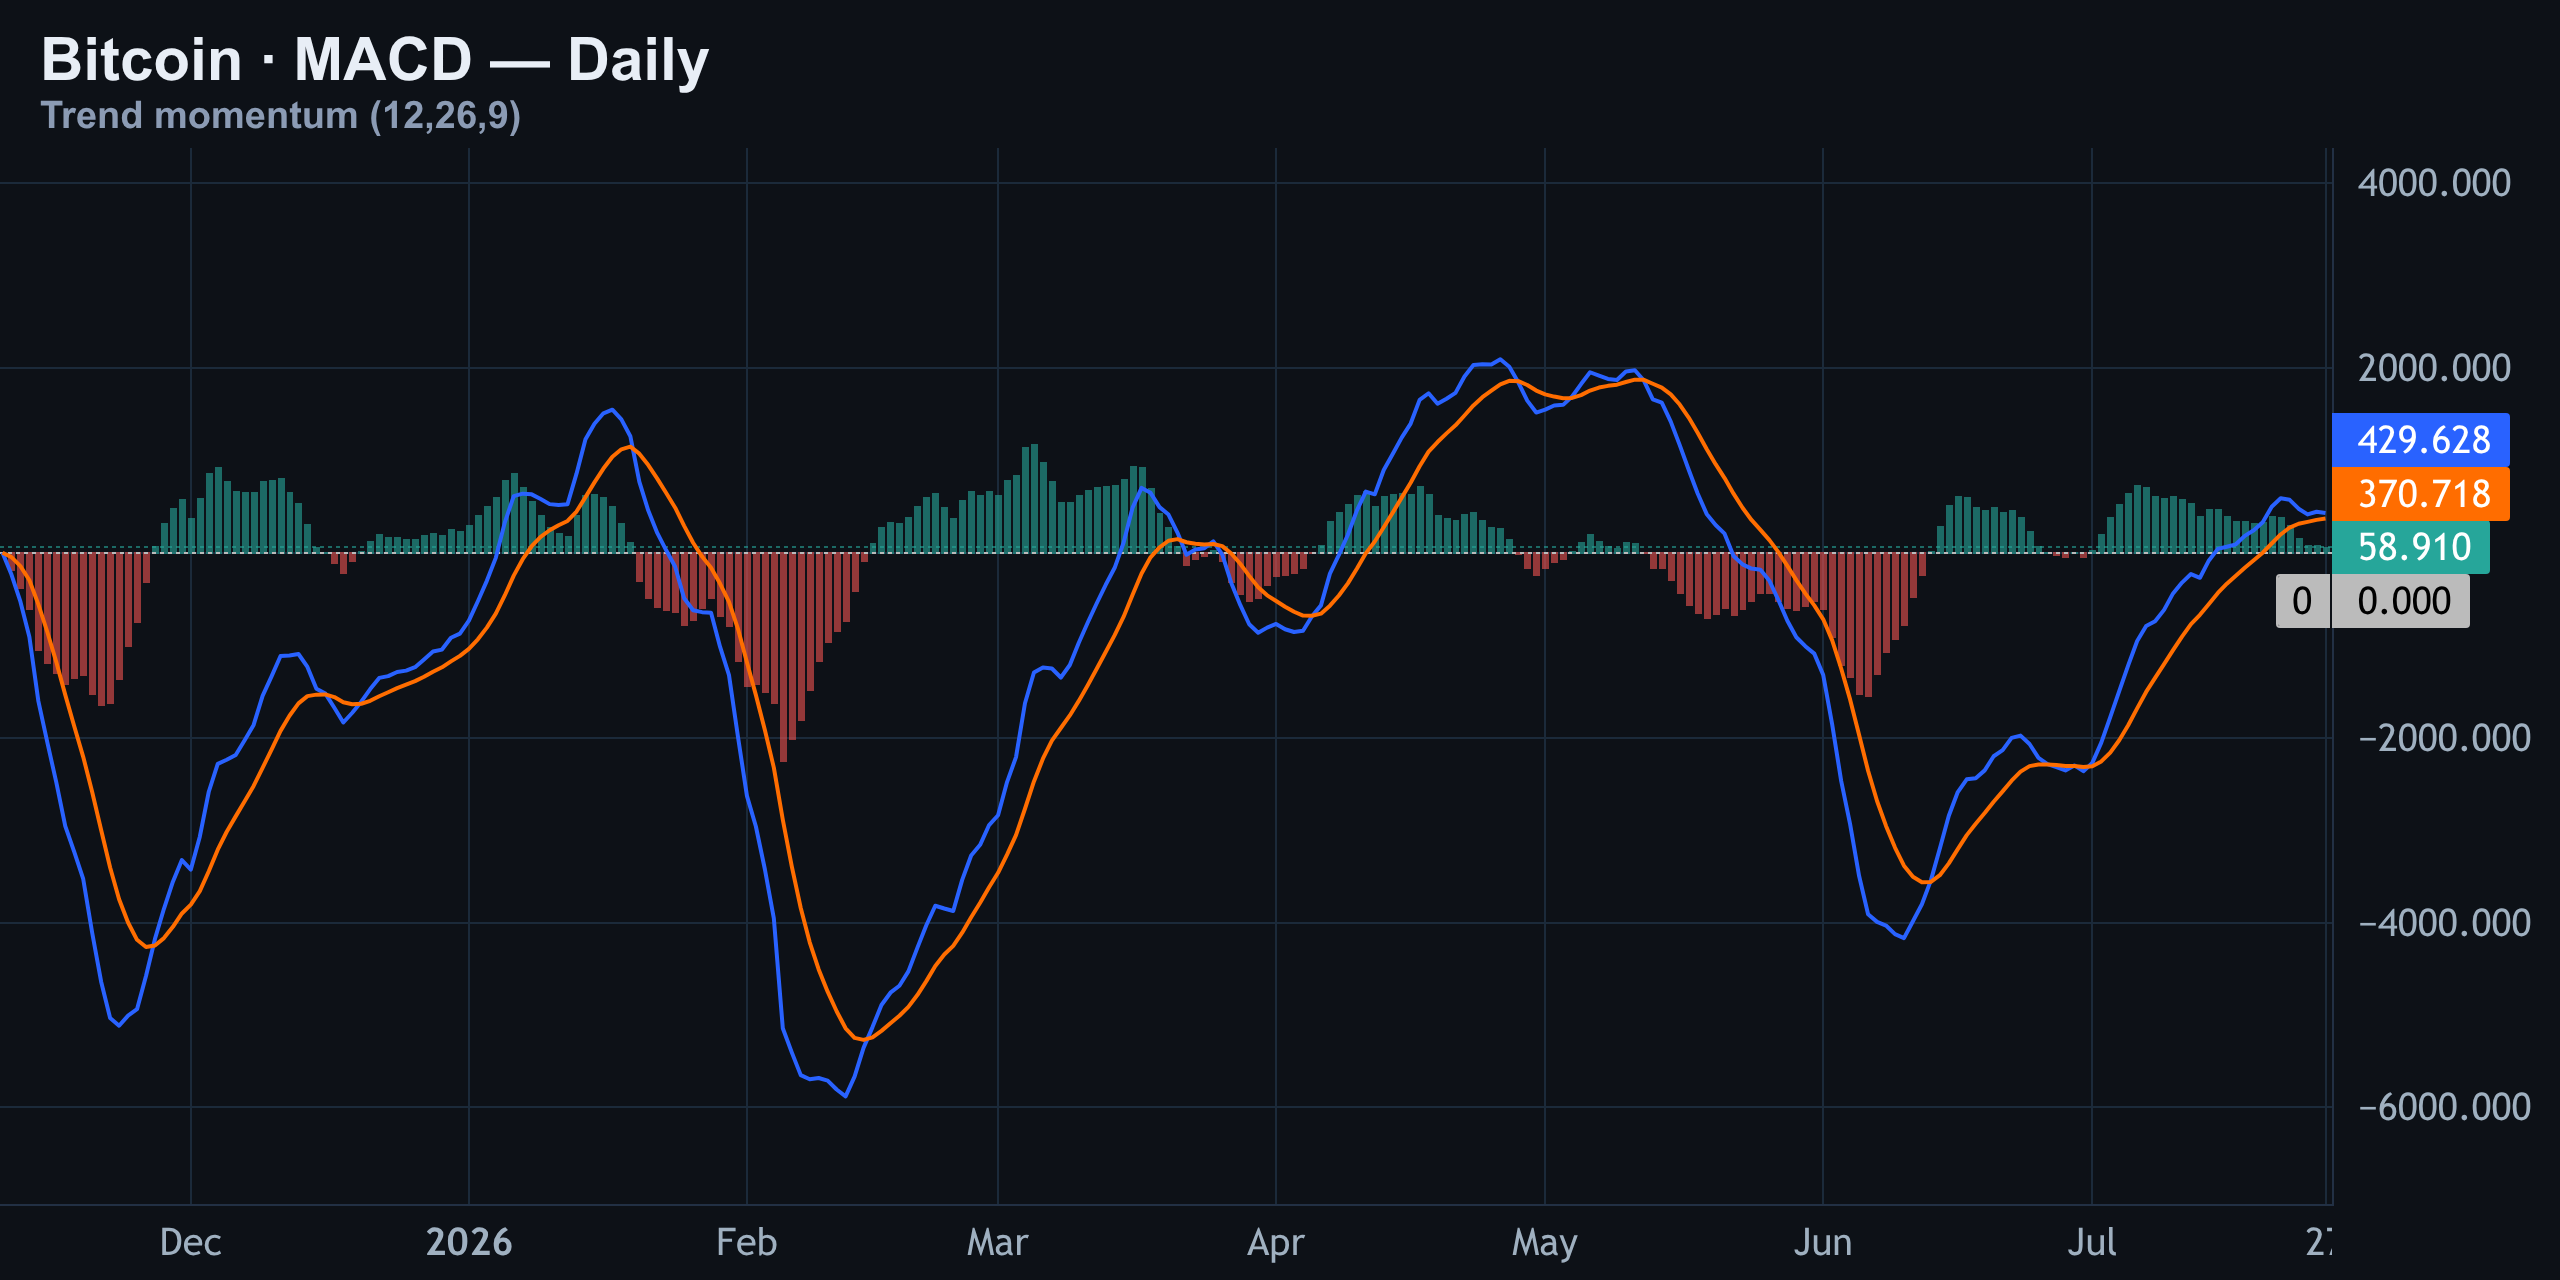
RSI (14) sits near 53 — dead neutral, no edge either way. MACD is barely positive and fading fast, hinting at a slightly bullish bias that's losing steam rather than building.
Liquidation Heatmap & Gamma Exposure: Why This Range Holds
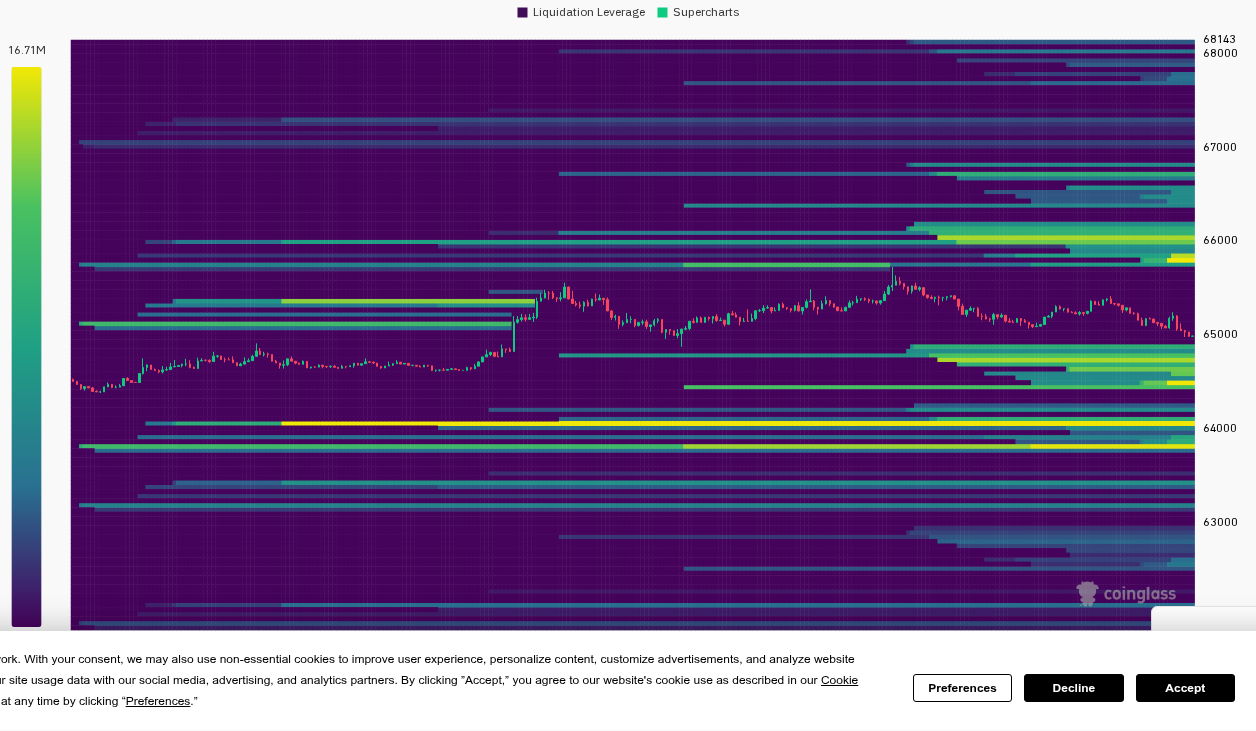
The liquidation heatmap shows stops stacked above current price — a cluster of leveraged positions sitting just overhead that could fuel a sharp squeeze if the $65,900–$67,000 zone gives way. Funding rates confirm the setup: longs are crowded and paying to stay in the trade, which is exactly the fuel that gets liquidated on a fake-out move higher.
Meanwhile, dealers are sitting in positive gamma, which is precisely why every rally toward the top of the range and every dip toward the bottom has been getting faded. Positive gamma means dealer hedging flows work against the direction of the move — buying dips and selling rips — actively suppressing volatility and pinning price toward that $65,000 max-pain magnet.
Levels to Watch & The Verdict: No Trade Today
Putting it all together, here's the full map of levels that matter right now — from the intraday channel rails to the options walls that will decide where this range eventually breaks.
| Level | Price | Why It Matters |
|---|---|---|
| Put Wall (Floor) | $60,000 | Dealers actively defend this strike |
| 4H Range Low | $63,000 – $64,000 | Buyers have defended this floor twice this week |
| 15-Min Channel Lower Rail | ~$64,700 | Loss of this breaks the short-term uptrend |
| Spot | ~$64,996 | Current price, mid-range |
| Daily Pivot | ~$65,008 | Today's intraday balance point |
| Max Pain | $65,000 | Options magnet into nearest expiry |
| 15-Min Channel Upper Rail | ~$65,900 | Resistance capping intraday rallies |
| 4H Range High | ~$67,000 | Sold twice this week; liquidation stops stacked above |
| Call Wall | $72,000 | ~0% probability of a month-end close above this |
So who wins — the crowded, funding-paying longs, or the smart money leaning short through block flow? Right now, neither. The options board is pricing calm, dealers are in positive gamma actively suppressing movement, and the max-pain magnet at $65,000 lines up almost exactly where price already trades. That's not a setup with edge in either direction — it's a market holding its breath.
Until Bitcoin actually breaks one of the walls around it — $60,000 below or $72,000 above — this reads as a watch-and-wait market, not a chase-it market. The coil keeps tightening; the resolution is coming, just not confirmed yet.
Key takeaways
- Bitcoin trades near $64,996, pinned almost exactly at the $65,000 options max-pain level.
- Dealers sit in positive gamma, actively suppressing volatility and fading every rally and dip inside the $63,000–$67,000 range.
- Whale block flow leans bearish (net call-selling, put-buying), while crowded longs keep paying funding — a tension with no clear winner yet.
- Options price essentially 0% odds of a month-end close above the $72,000 call wall.
- No 1:2.5 trade setup exists today; the call is to stand aside until $64,700 or $65,900 breaks with volume.
Frequently asked questions
Why is Bitcoin stuck near $65,000?
Bitcoin is sitting at the options market's max-pain point of $65,000, boxed between a $60,000 put wall and a $72,000 call wall, with dealers in positive gamma actively suppressing volatility around that pin.
What does positive gamma mean for Bitcoin's price action?
When dealers are in positive gamma, their hedging flows work against the market's direction — they buy dips and sell rallies — which dampens volatility and keeps price contained inside a range.
Is the options market bullish or bearish on Bitcoin right now?
It's mixed: the put/call open interest ratio looks bullish-leaning, but rising volume hedging, a +12.2% put skew, and bearish whale block flow all point to underlying defensive positioning.
What level would break Bitcoin out of this range?
A close above $65,900–$67,000 would challenge the 4-hour range high and could trigger stacked short liquidations above spot; a break below $63,000–$64,000 would test the $60,000 put wall.
Is there a trade to take on Bitcoin today, July 27-28, 2026?
No — the setup doesn't offer a clean 1:2.5 risk-to-reward trade today. The recommended approach is to stand aside and wait for a decisive break of the $64,700 or $65,900 levels.