
Analysis
Ethereum Price Today: The Level That Turns Calm Into Chaos
Where We Left It: A Week of Bleeding, Not Breaking
Last week's update, published July 21, made one call: no clean setup, stand aside. Ethereum was trading around $1,943 at the time, sitting inside a wide box with no edge in either direction.
That patience aged well. Over the past seven days, Ethereum has bled roughly 3.3%, drifting from $1,943 down to today's price near $1,879. Anyone who forced a long into that range would be underwater right now. But here's the important nuance: the range itself hasn't resolved. Price hasn't broken down through support or confirmed a new trend — it's simply drifted lower *inside* the same structural box that's held for weeks.
The Options Board Is Sending Mixed Signals
This is where today gets interesting. The options market is telling two different stories depending on whether you look at accumulated positioning or today's fresh flow.
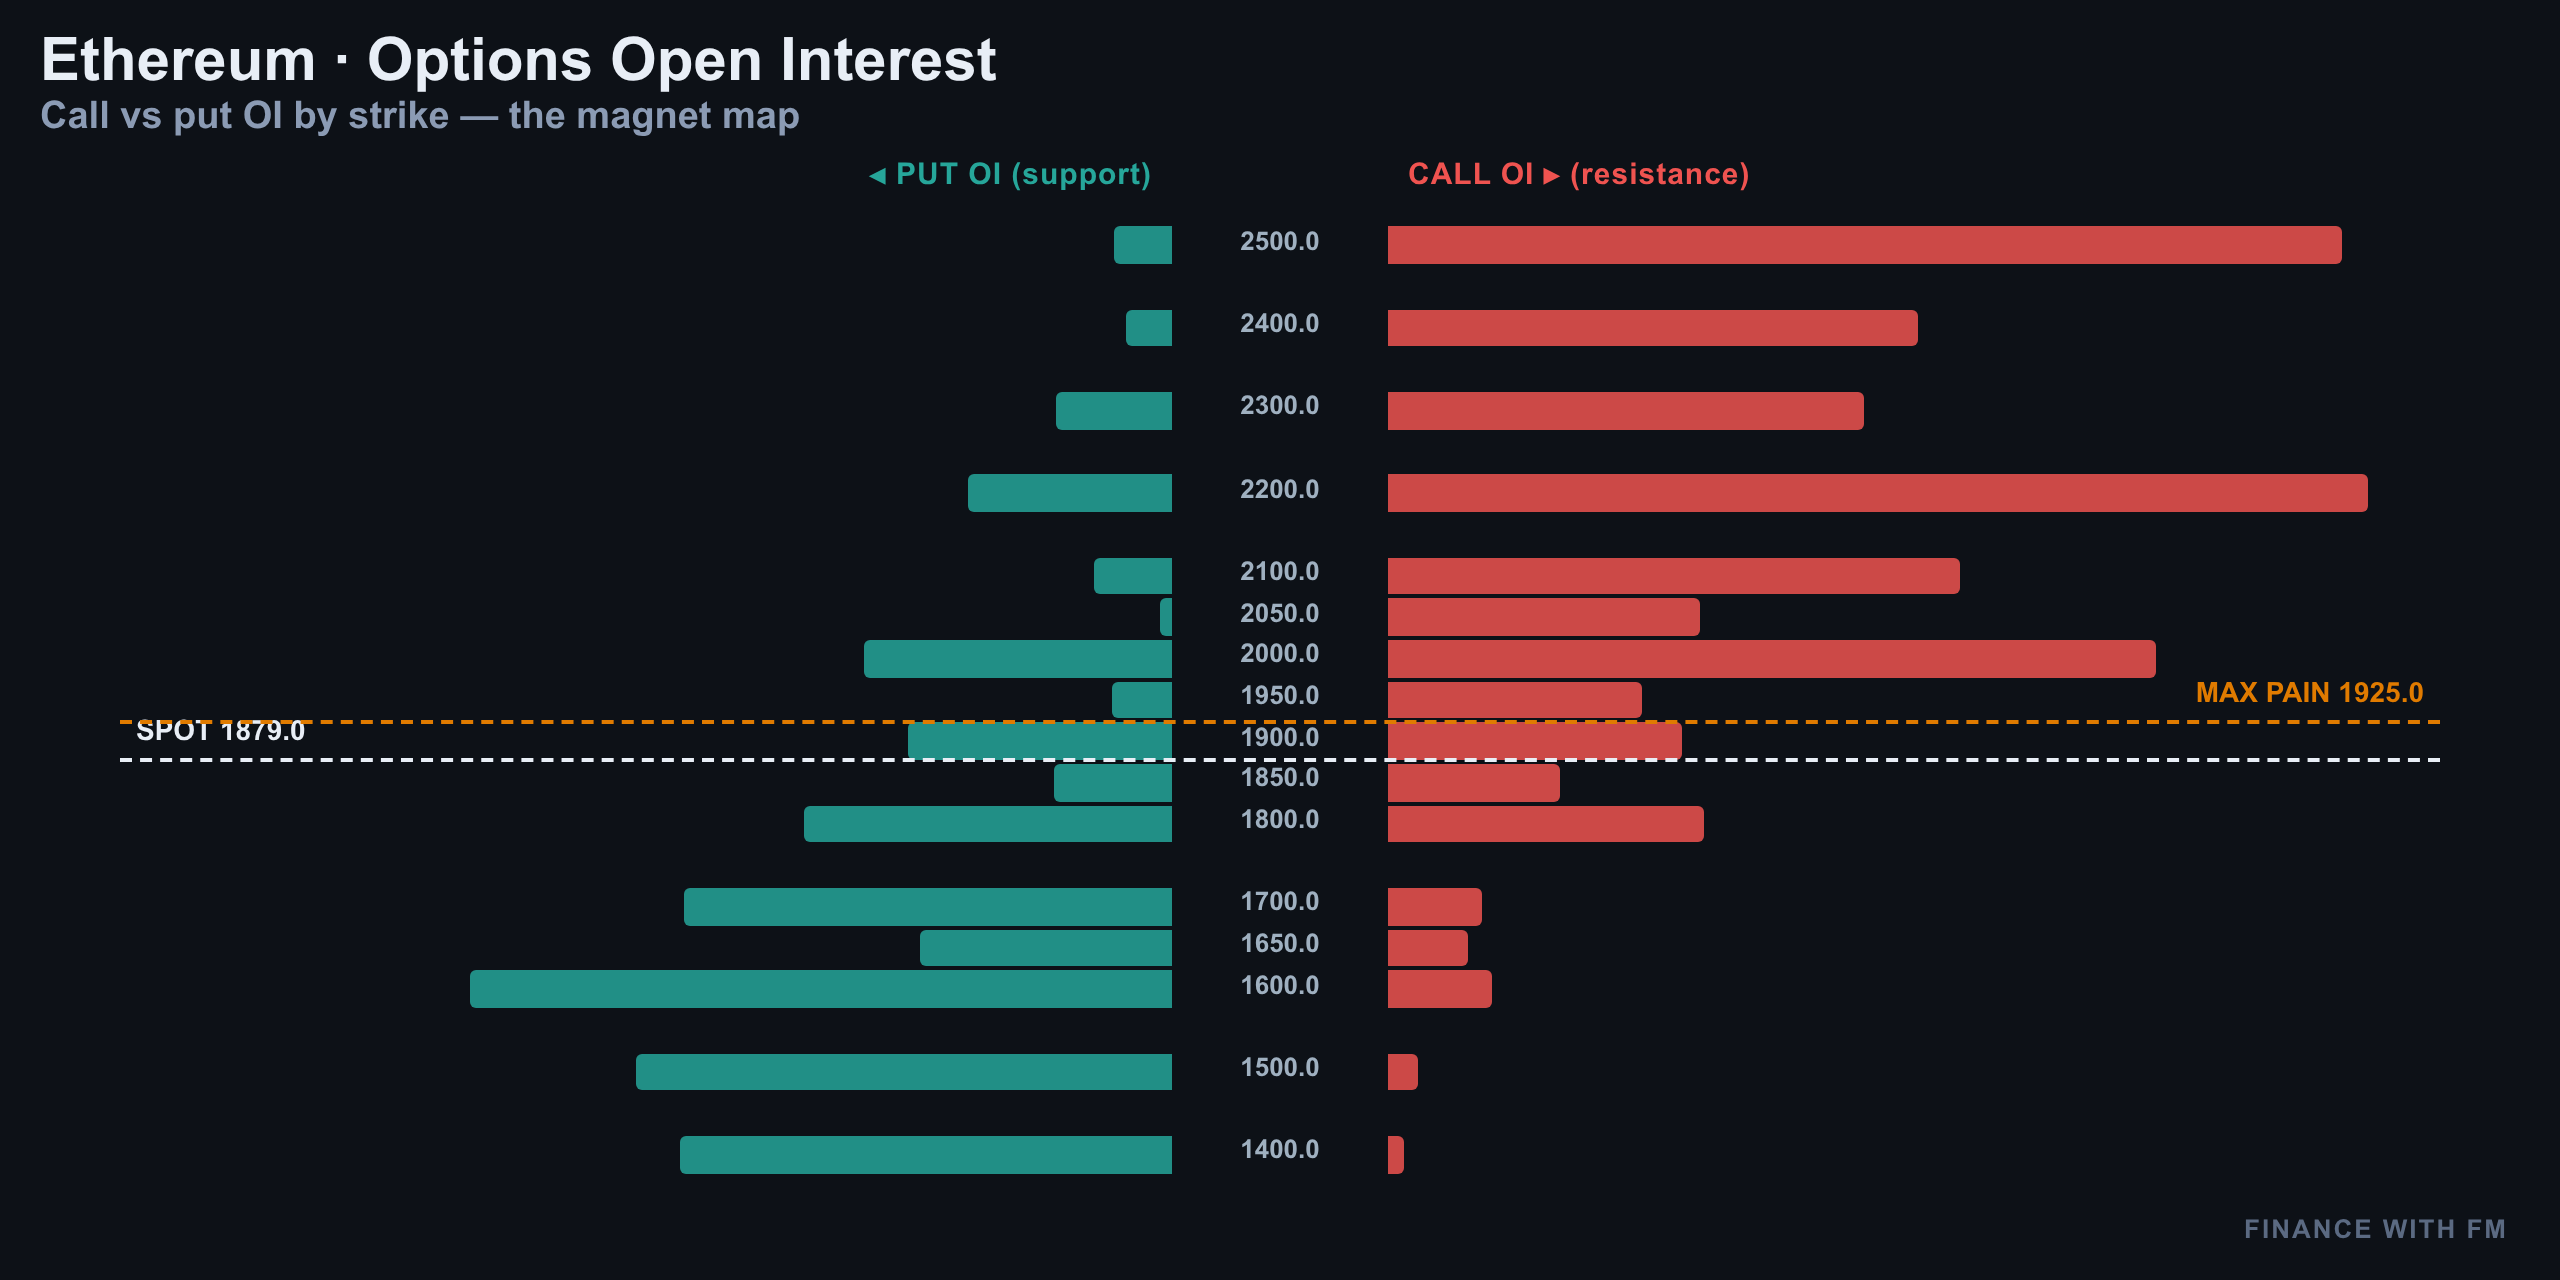
By open interest — the stock of contracts built up over time — the put-call ratio is 0.50. That's a bullish-leaning skew; traders have historically favored calls here. But that's the *old* picture.
Today's volume flips that completely. The volume put-call ratio is 1.12 — traders are actively buying puts right now, hedging the drop in real time. Two different signals, same market: the base is bullish, the fresh flow is defensive.
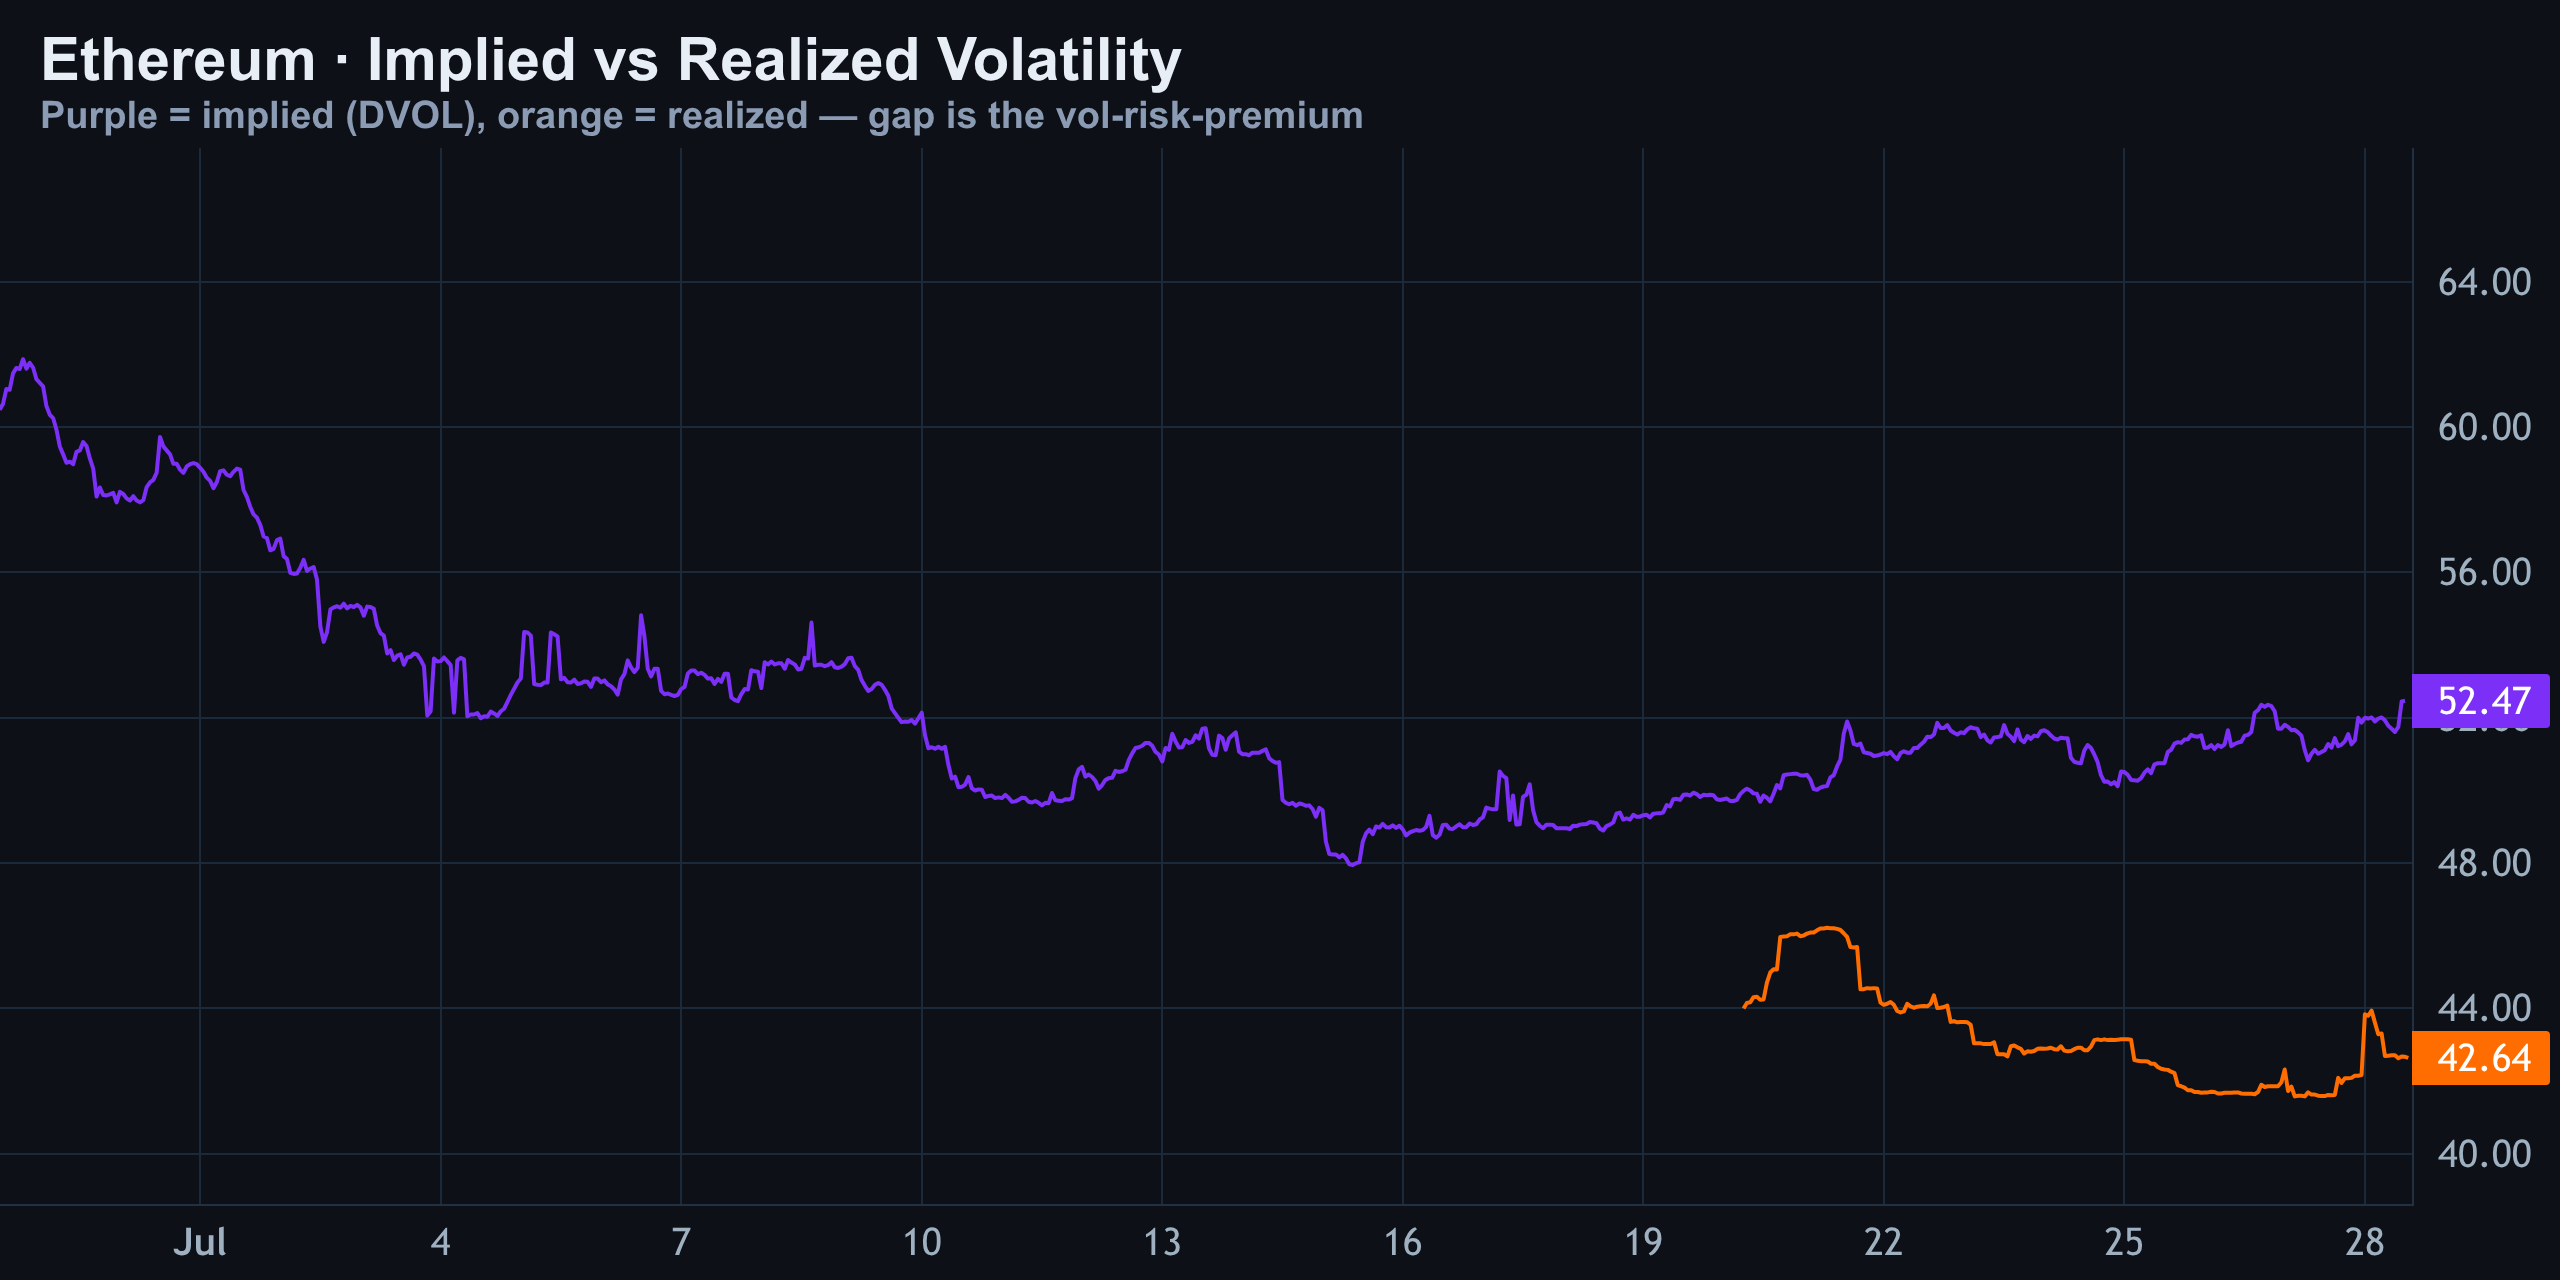
Implied volatility is at 52.5% against realized volatility of just 42.6% — a vol-risk-premium of roughly +9.8 points. In plain terms: options are expensive right now. Anyone selling volatility currently holds the statistical edge, provided this range holds.
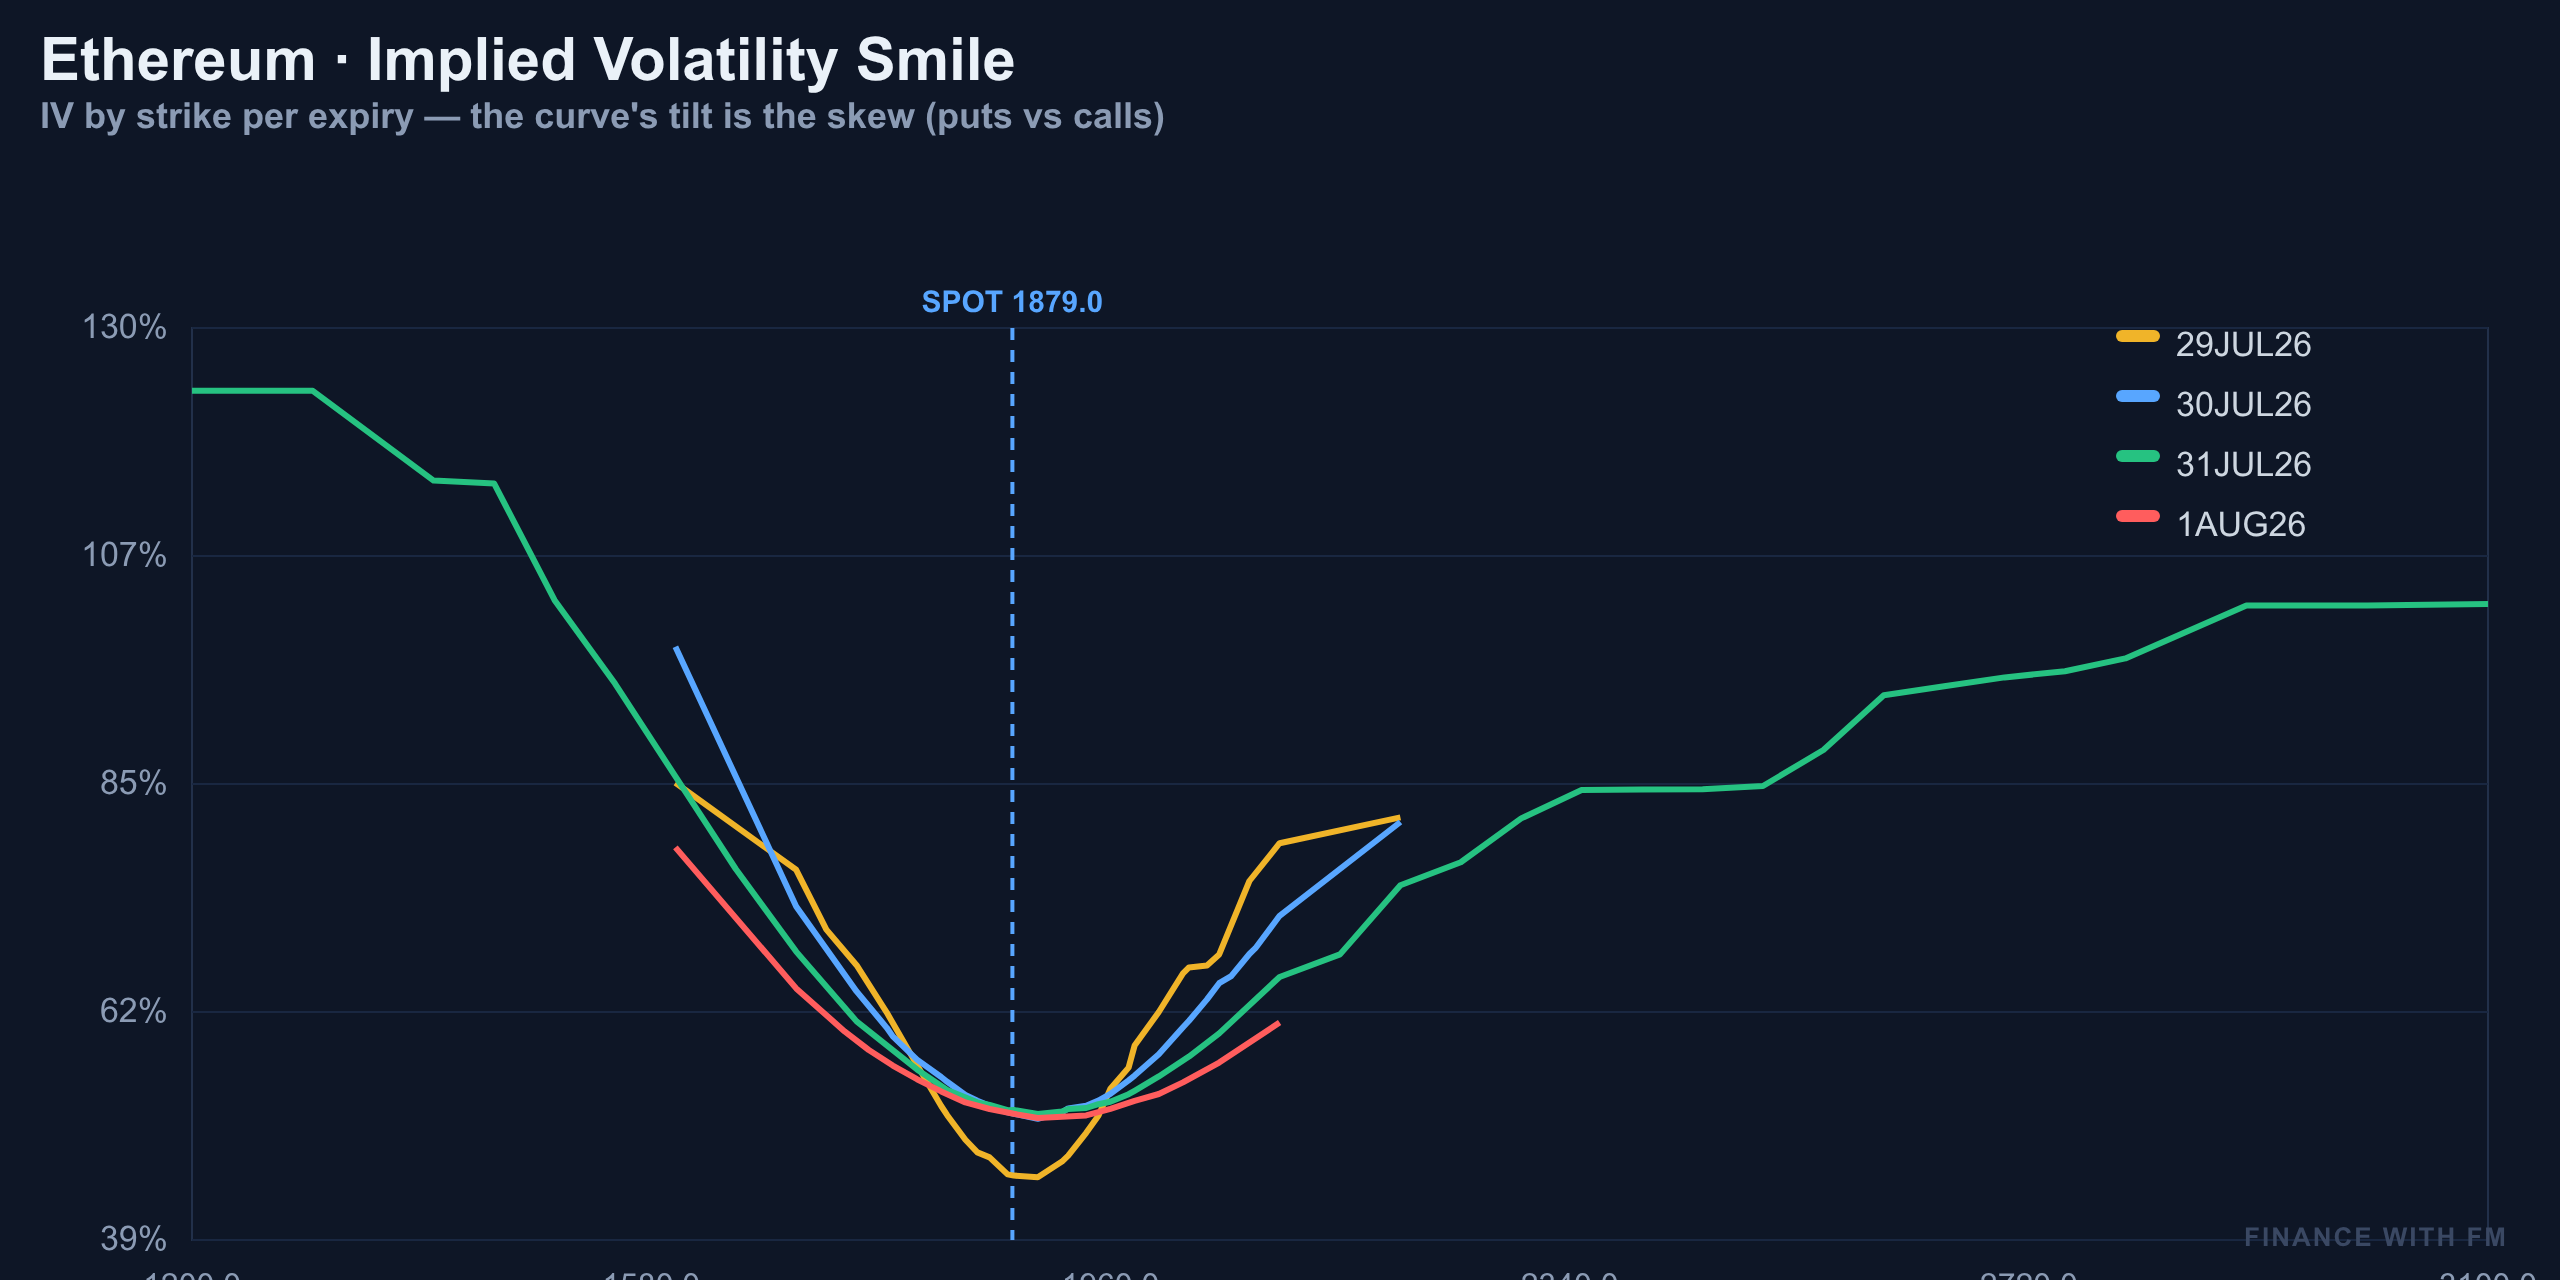
The 25-delta skew is tilted positive by about 1.1%, meaning puts are bid over calls of equal distance from spot. This isn't a symmetric smile — it's a proper skew, and it's classic behavior after a 3.5% drop: fear gets priced first, greed gets priced last. Calls only see real demand up near the heavy $2,200 wall, where sellers write premium against resistance rather than chase upside.
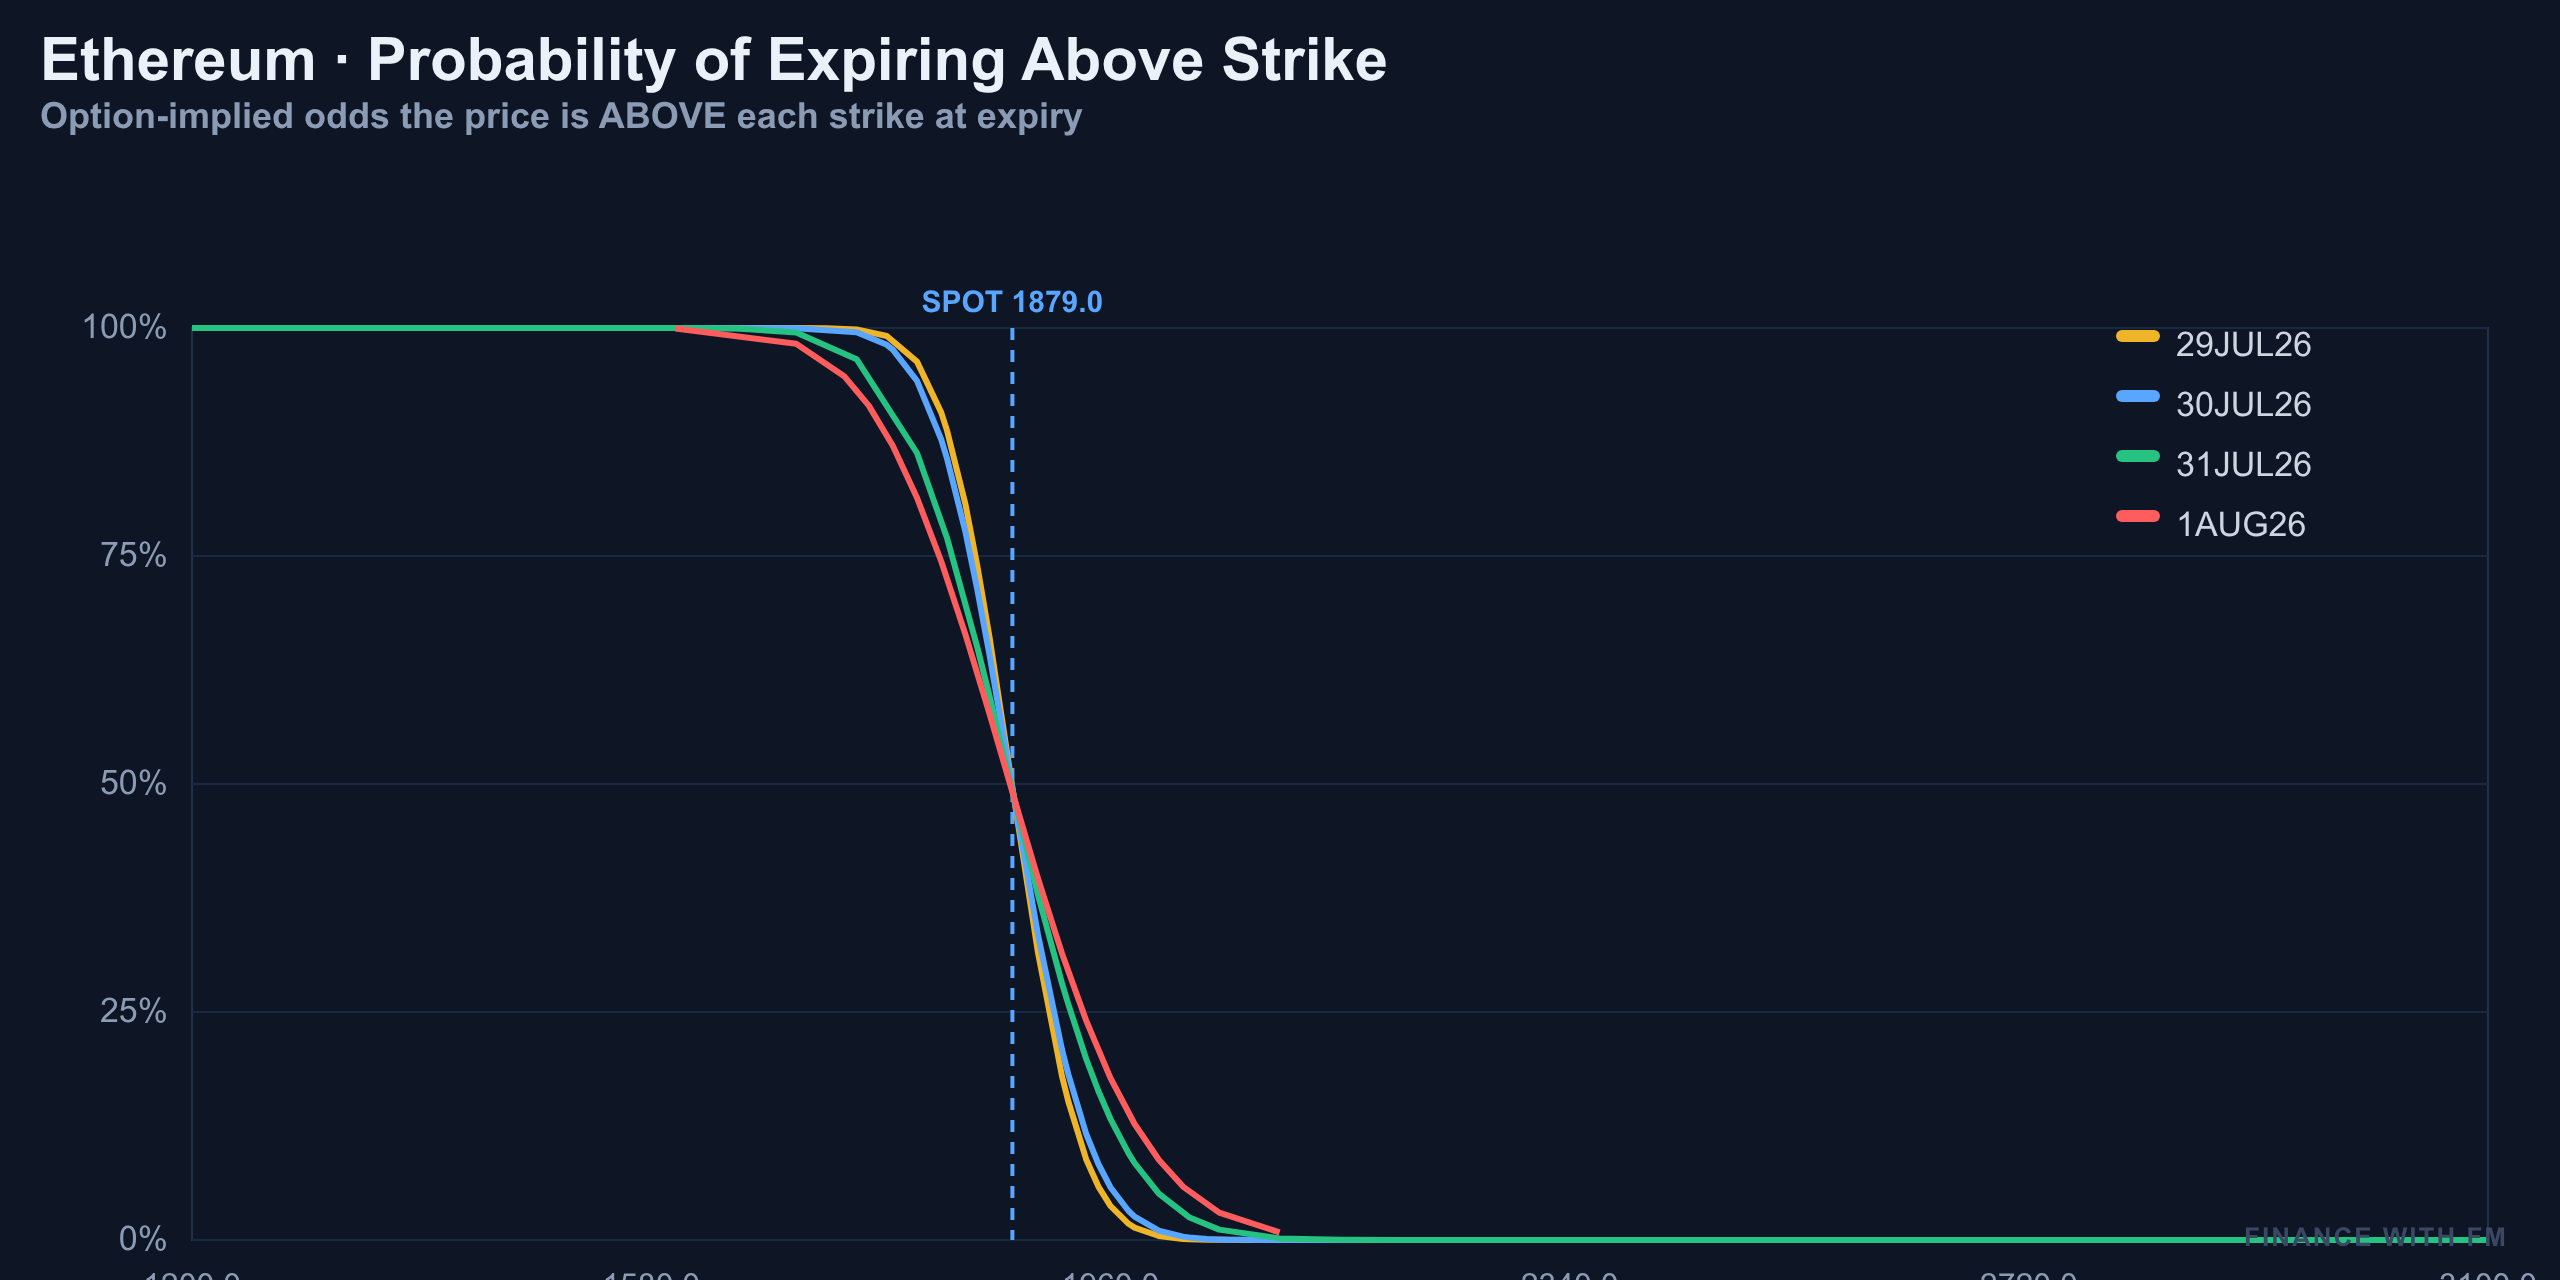
The probability data is blunt. By August 1, there's only about a 3% chance Ethereum trades above $2,050. The market is voting with real money that the recent high near $1,978 was a ceiling, not a launchpad — pricing continuation of the box, not a breakout.
| Metric | Value |
|---|---|
| Implied Volatility | 52.5% |
| Realized Volatility | 42.6% |
| Vol Risk Premium | +9.8 pts |
| Put/Call (Open Interest) | 0.50 |
| Put/Call (Volume) | 1.12 |
| 25-Delta Skew | +1.1% (puts bid) |
| Max Pain (next expiry) | $1,925 |
| Call Wall | $2,200 |
| Put Wall | $1,600 |
Whale Flow: Two-Sided, but Leaning Defensive
Block trades — the large, negotiated options positions institutions and whales put on — give a cleaner read on smart money than retail flow ever does.
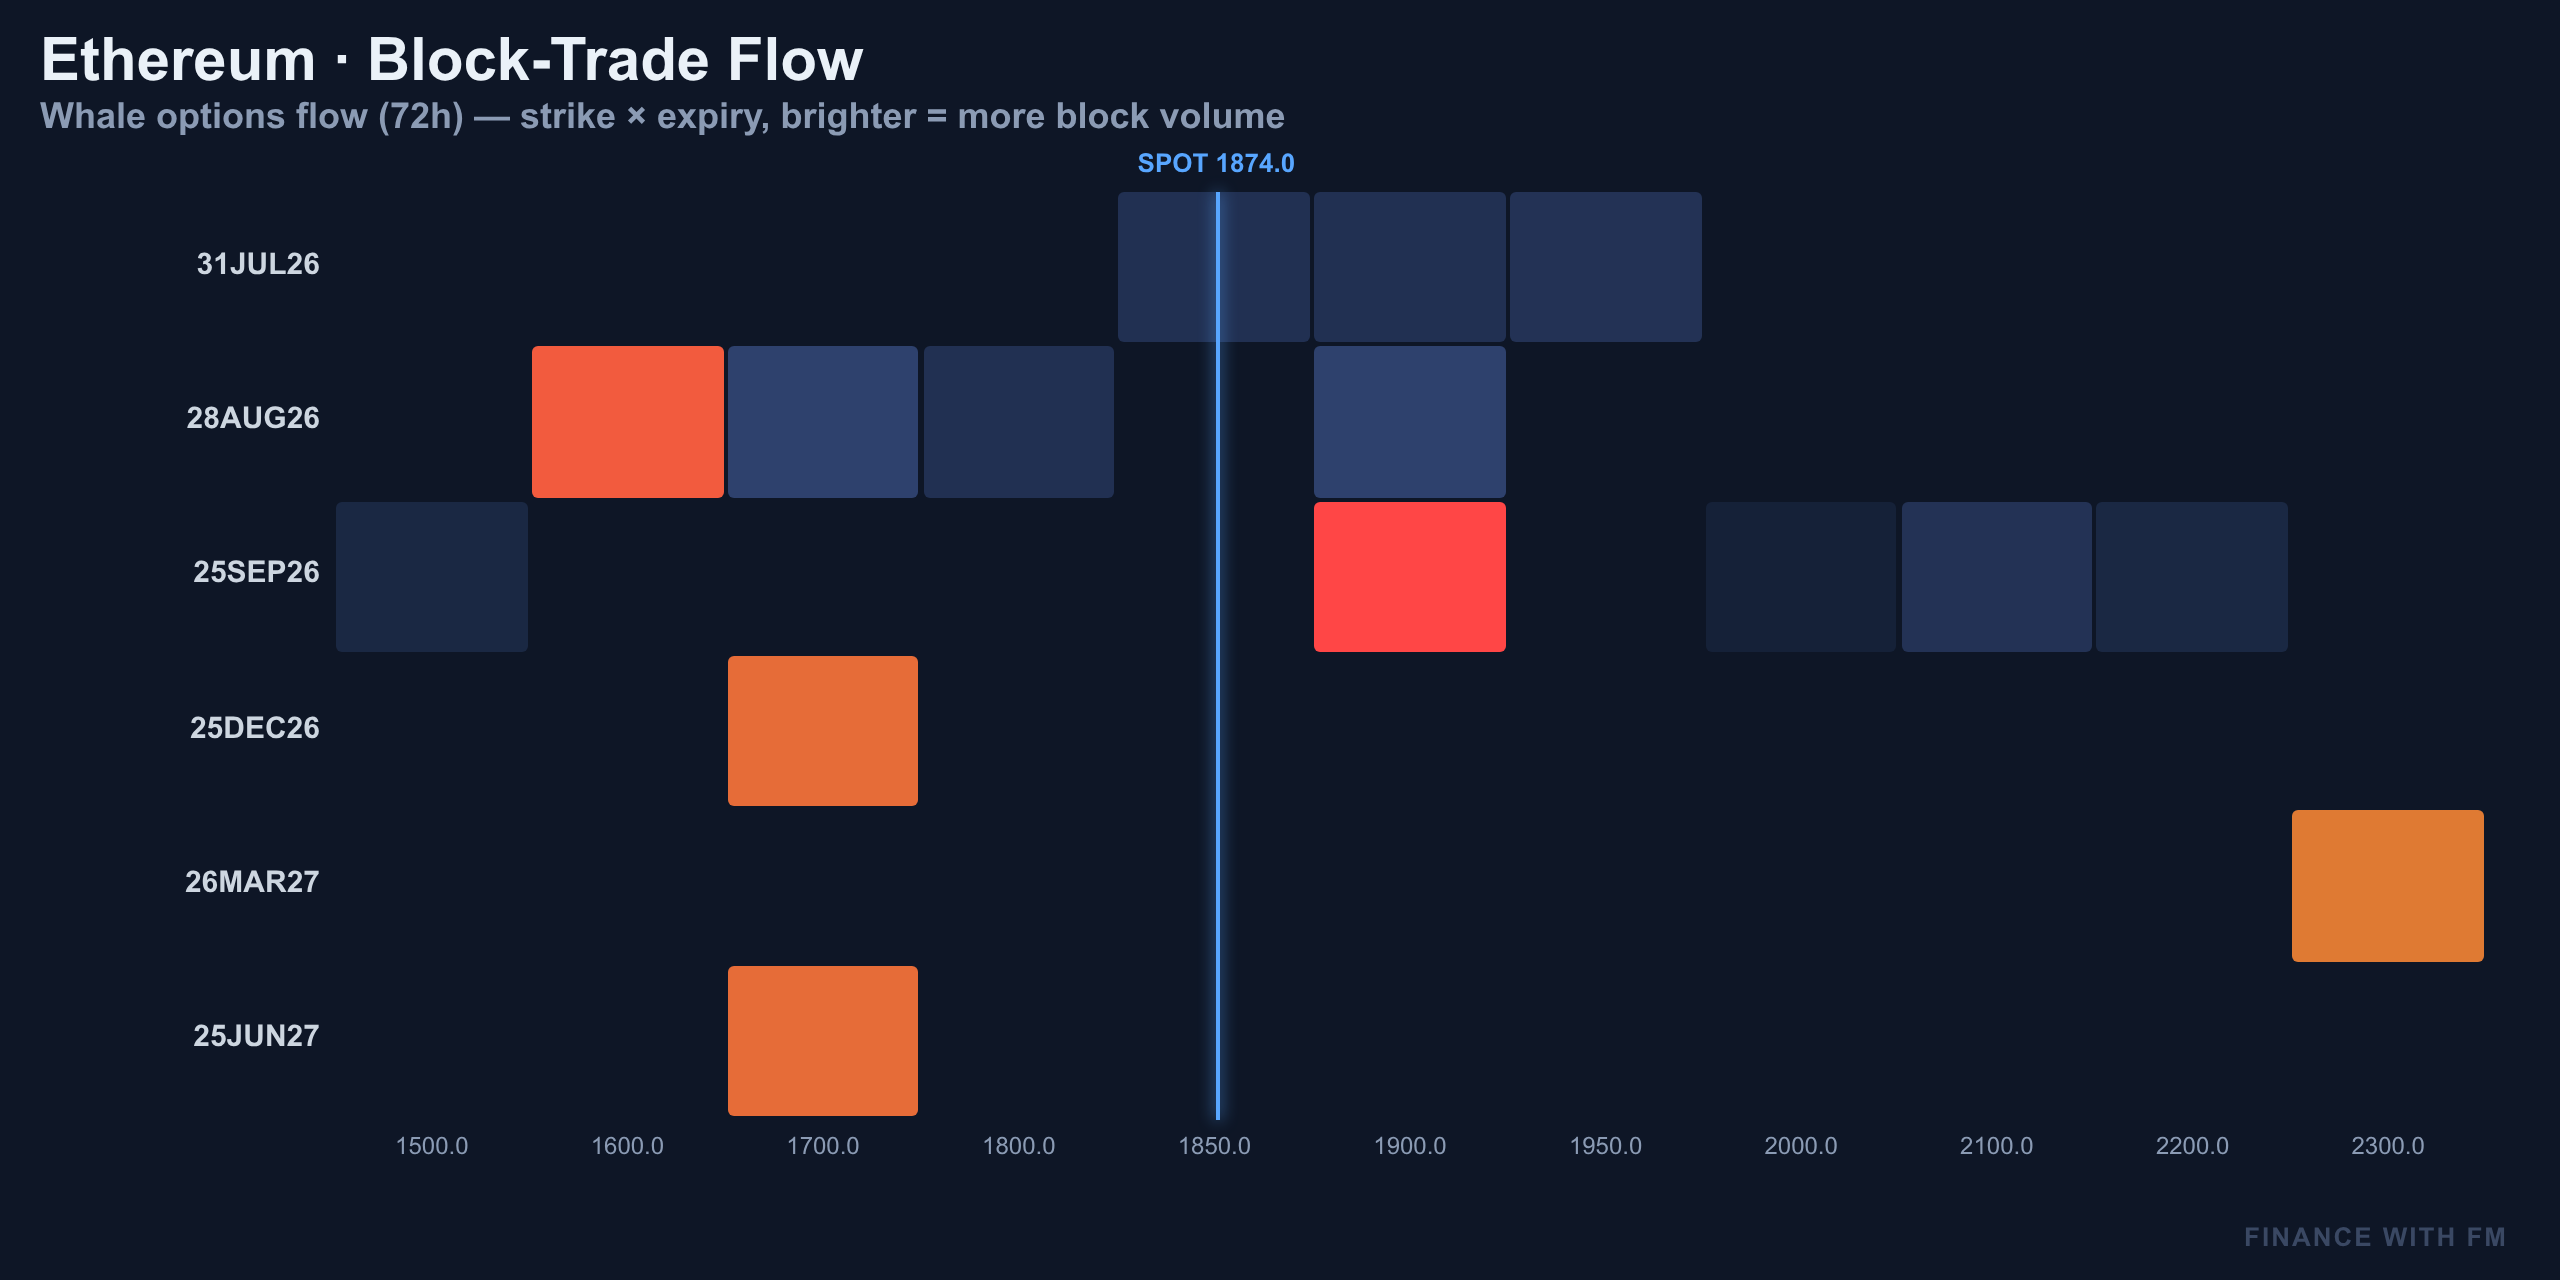
The single heaviest clip today was 3,077 contracts at the $1,900 strike on the September expiry — essentially a wager that Ethereum stabilizes near where it's trading right now. That's not panic; that's a range bet.
But the put side has real weight too. Large put open interest sits at $1,600 on the August expiry, and again at $1,700 stretching out into next June and December. Netting it out: puts bought outweigh calls bought by roughly 4,000 contracts. Smart money isn't panicking — but the tape leans slightly toward hedged downside over the medium term.
Price Action: The 15-Minute Fade vs the 4-Hour Uptrend
15-Minute: Descending Channel Under Pressure
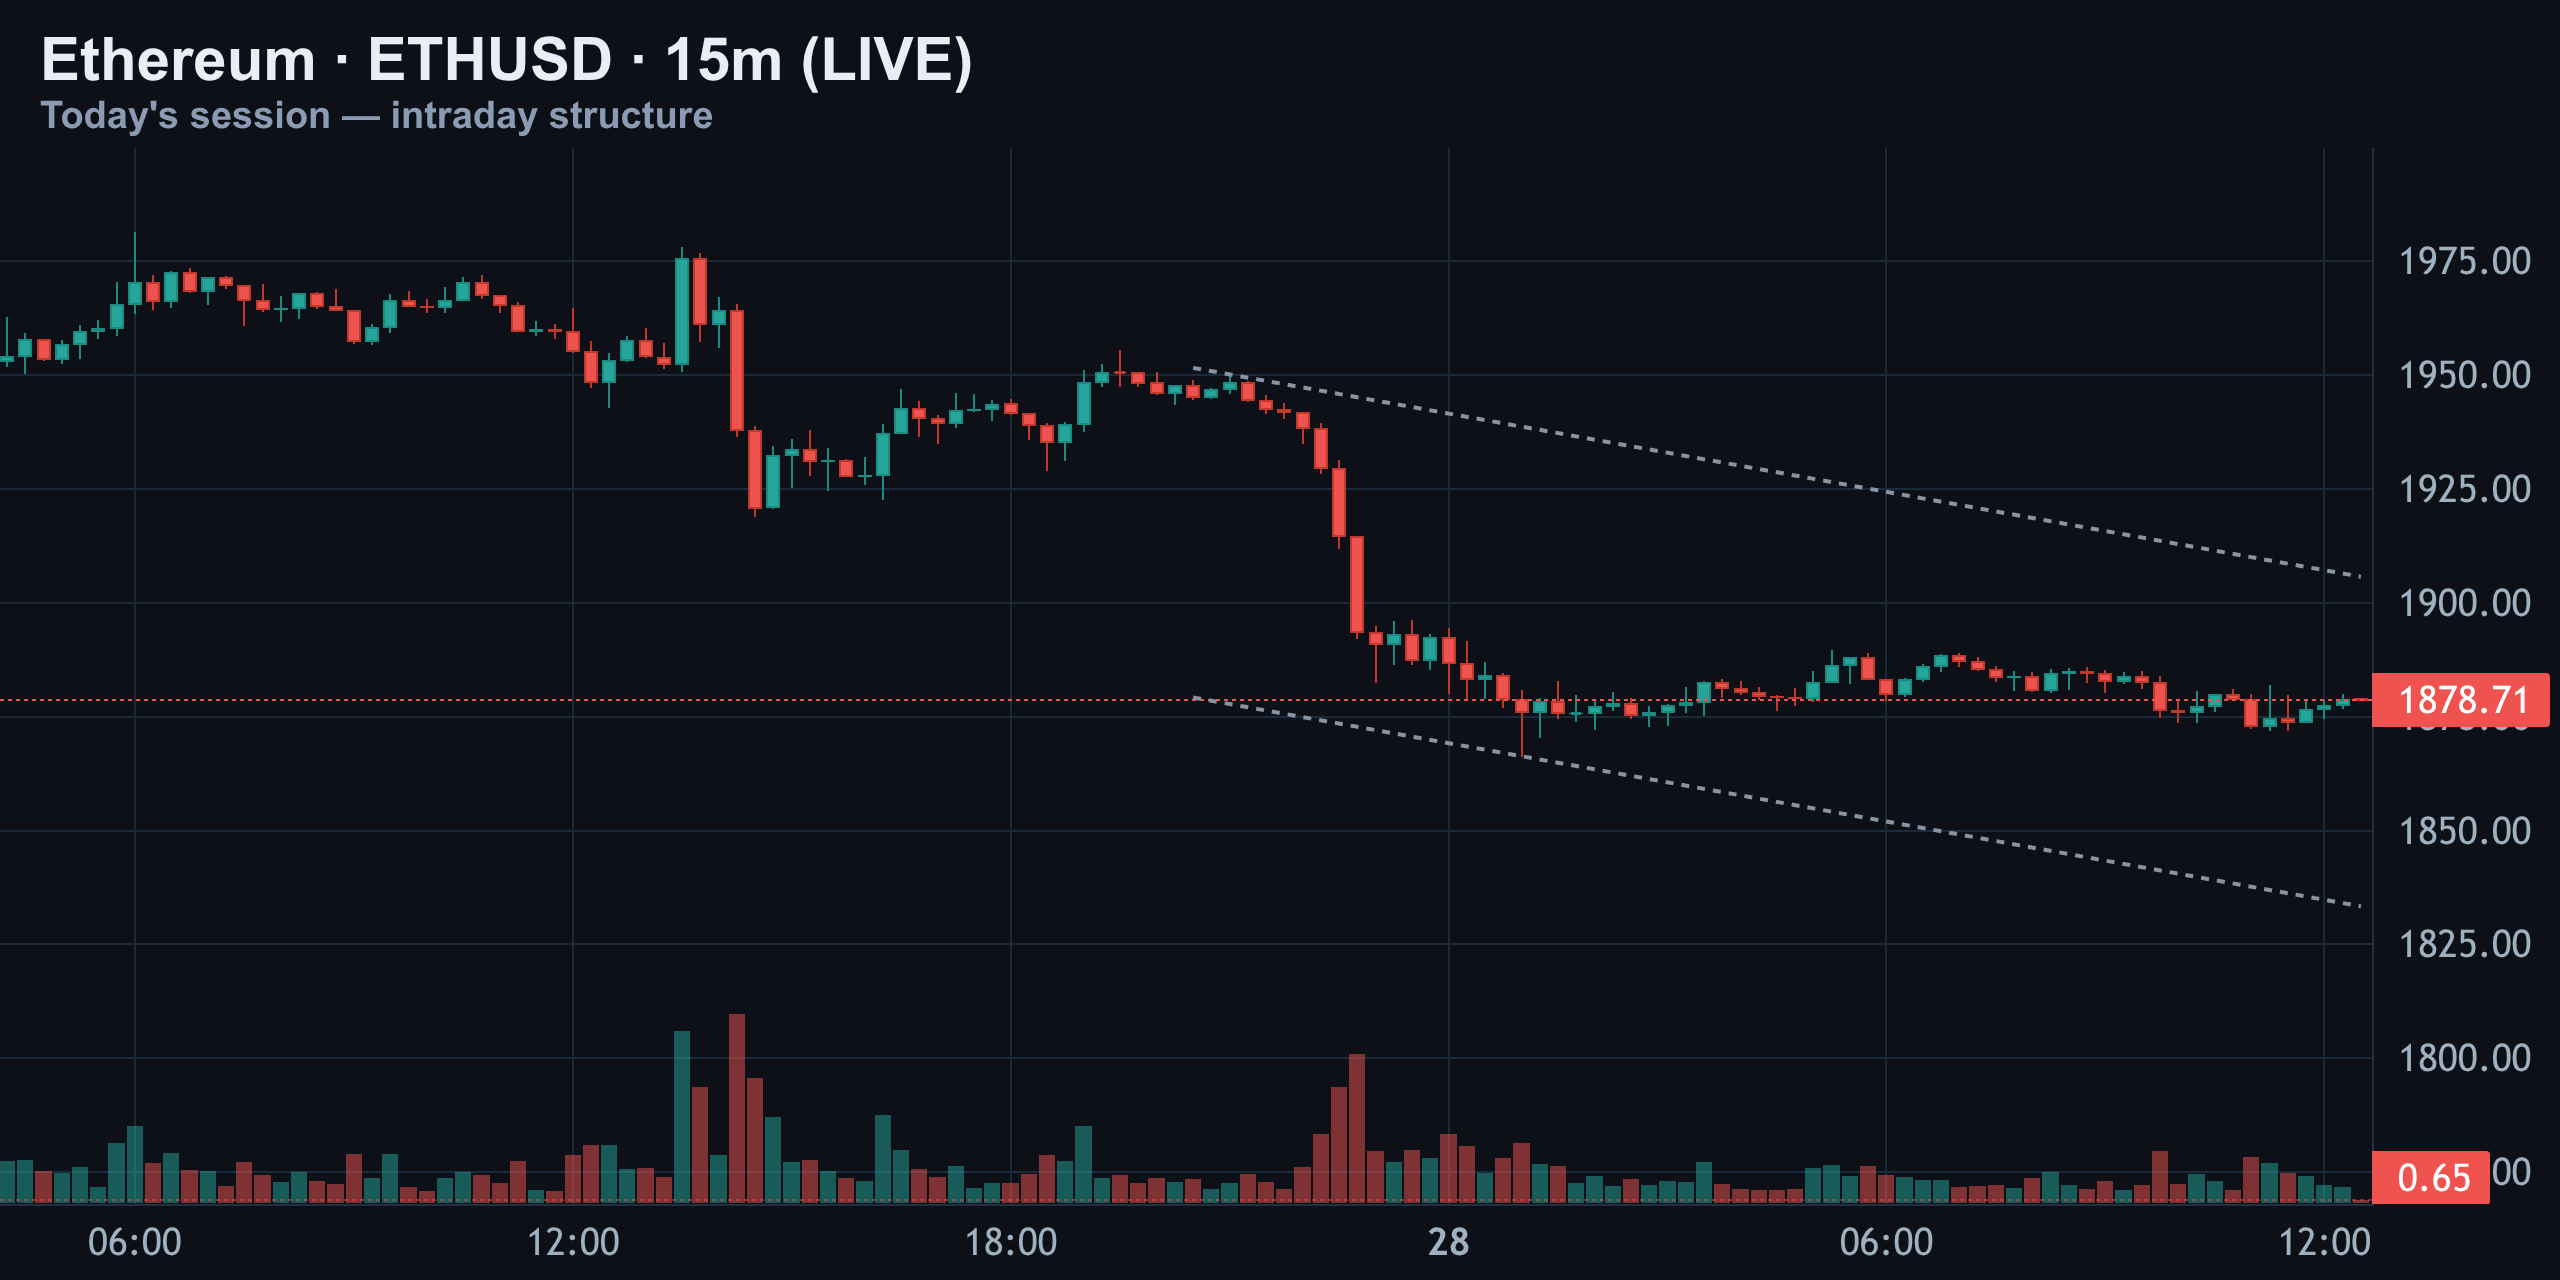
Zoom into today's session and the story is a fade. Ethereum tapped just under $1,978 early, then rolled into a textbook descending channel, stair-stepping lower through the day. The channel's upper rail capped every bounce — the rejection near $1,955 was the tell. By late morning, price found the channel's lower boundary and started chopping sideways near $1,879, with volume drying up. That's exhaustion, not strength: sellers are running out of fresh supply right where the bid wall sits.
4-Hour: Rising Channel Rejected at the Top
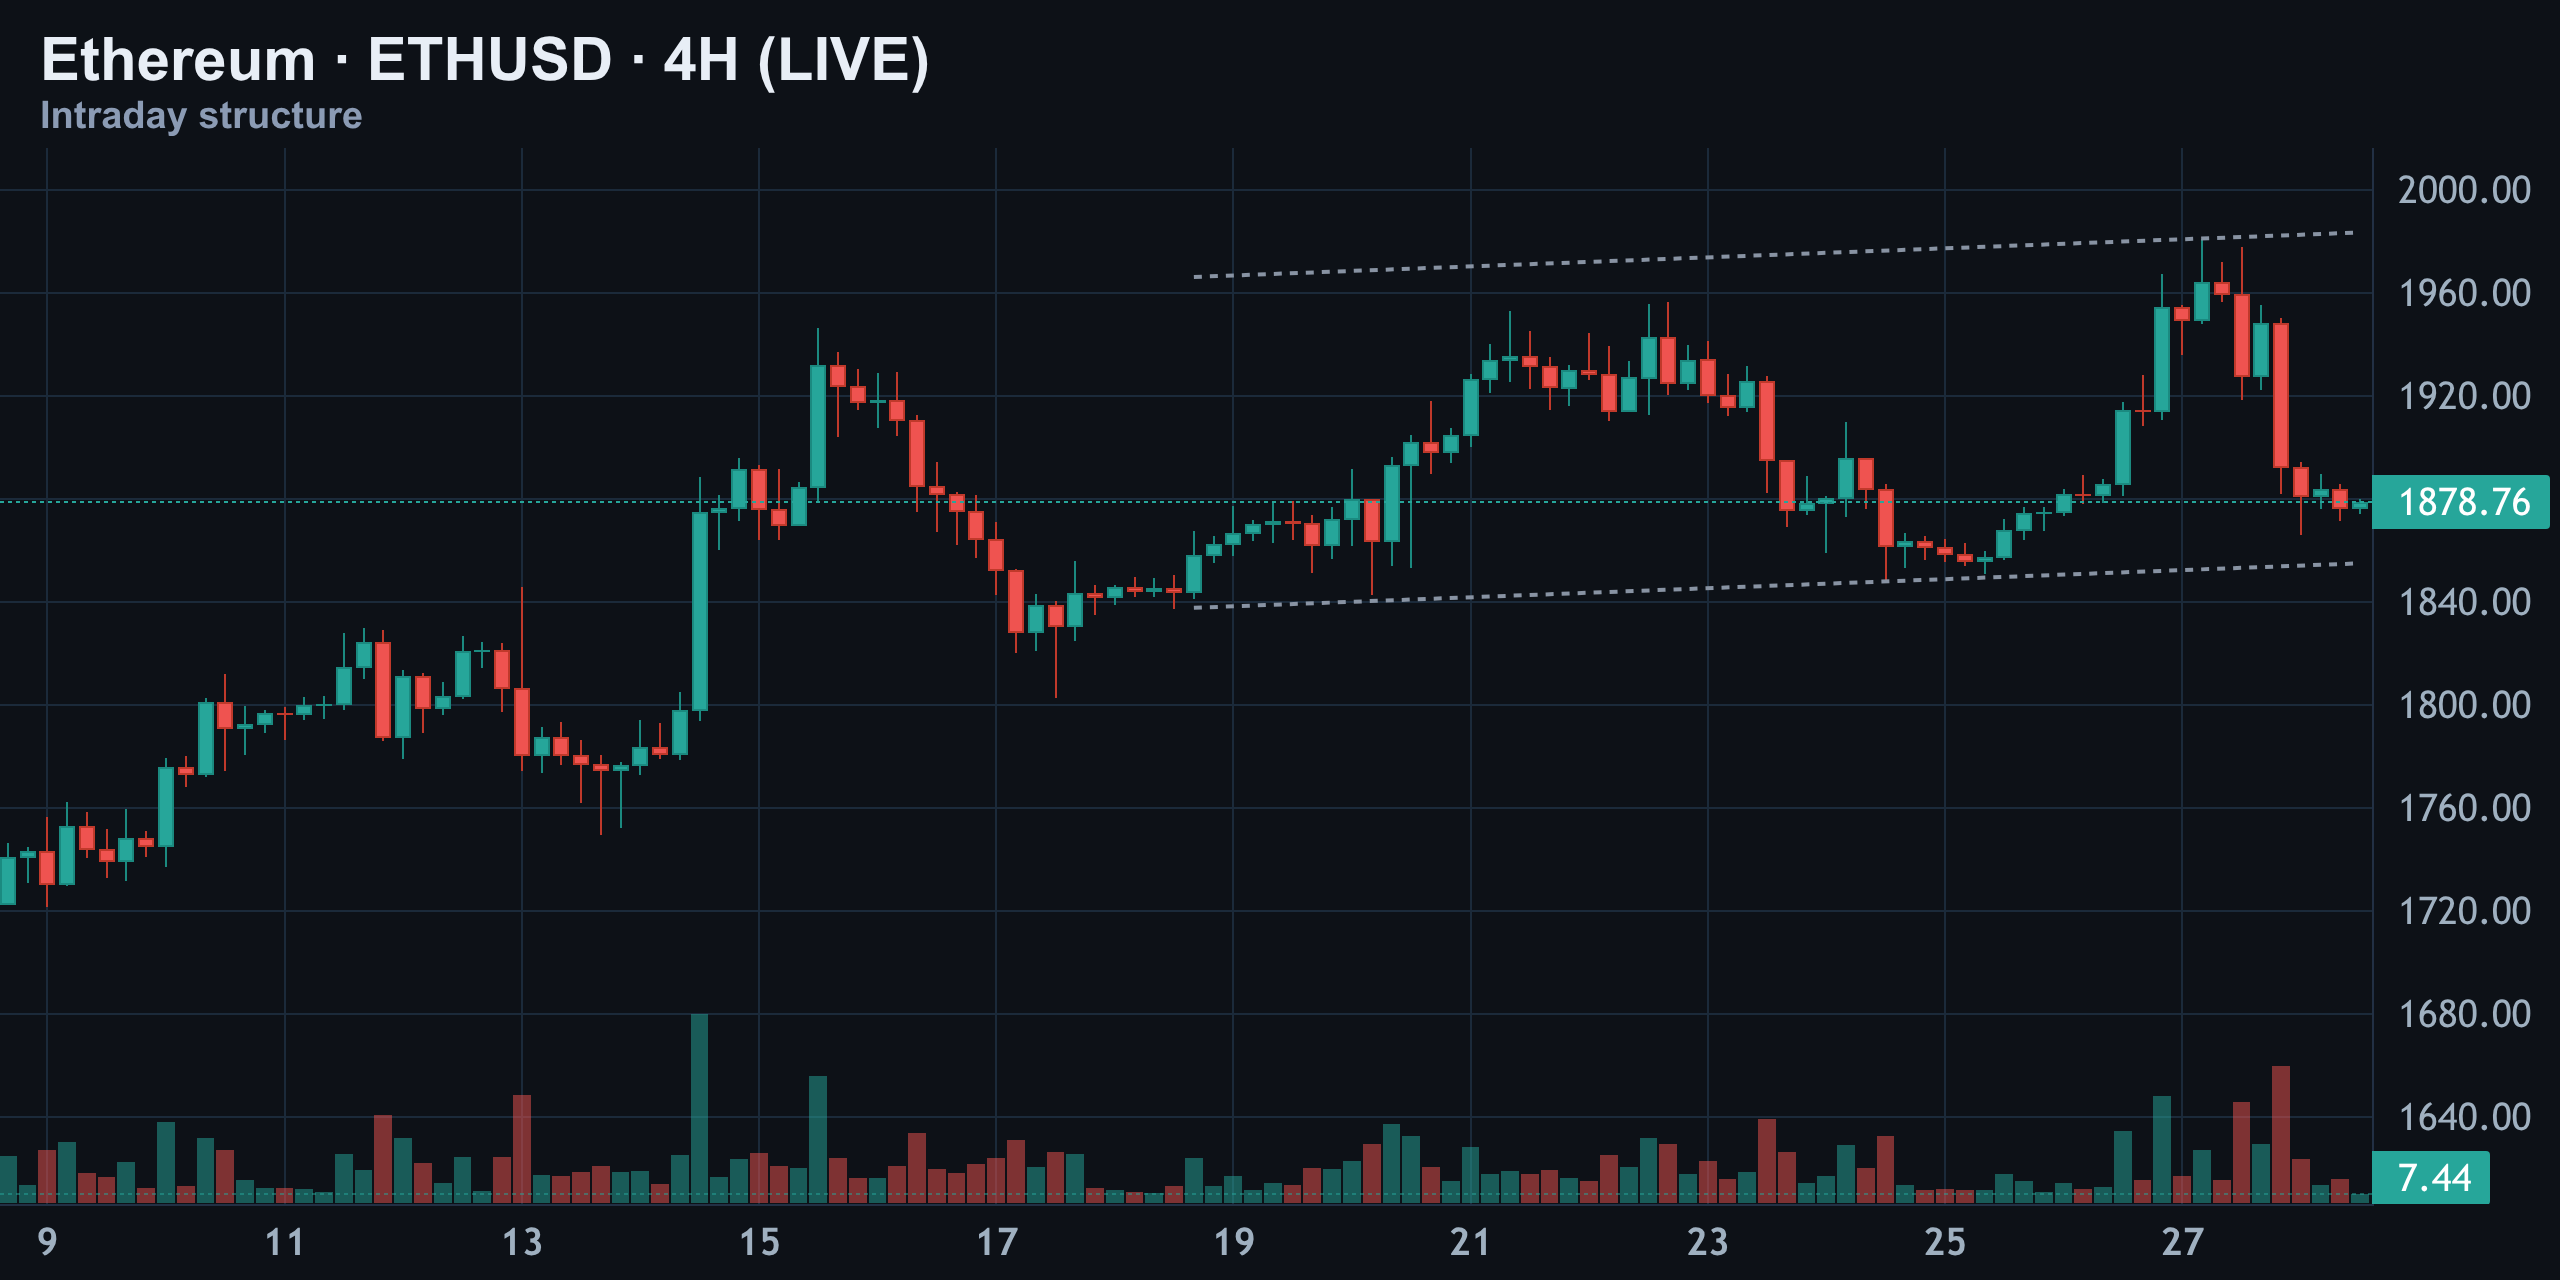
Step back to the 4-hour timeframe and the picture is less bearish than the 15-minute panic suggests. Ethereum has been climbing inside a rising channel since around July 19, printing higher lows the entire way up. It tagged the top of that channel near $1,985, got rejected hard, and is now pulling back toward the channel's floor near $1,878. As long as that floor holds, this reads as a healthy pullback inside an uptrend — not a trend change. Lose it, and the channel breaks.
Daily Range, RSI, and MACD: The Momentum Warning
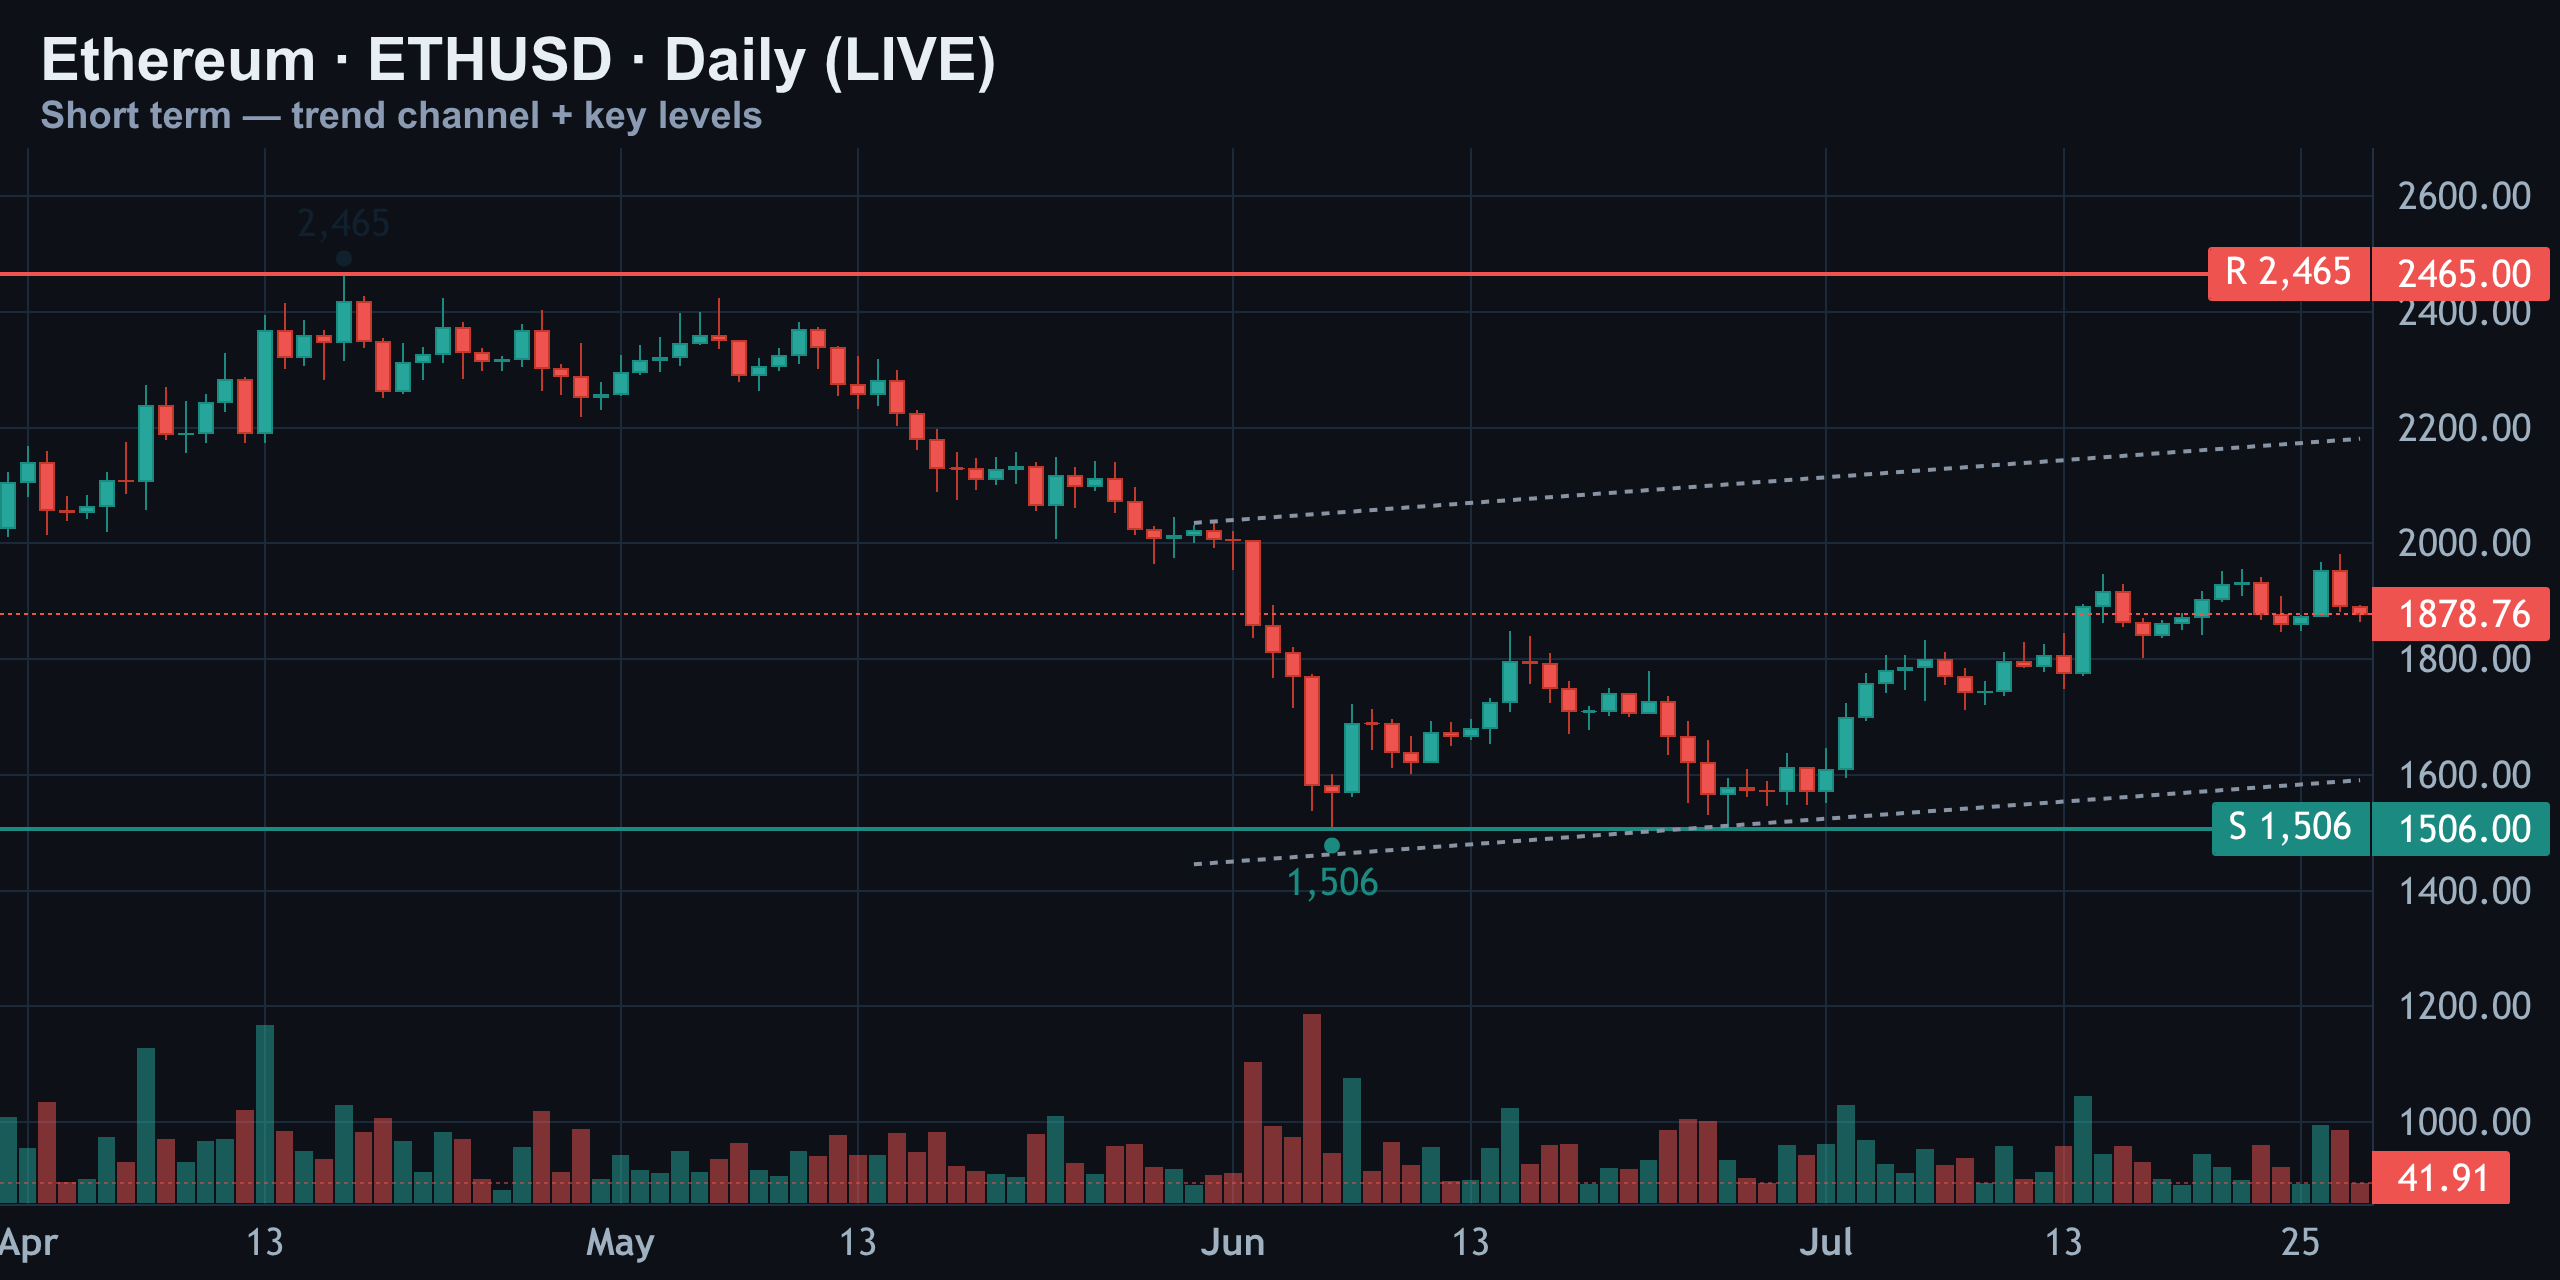
On the daily chart, Ethereum is still boxed inside the same wide range that's held for weeks: $1,506 on the floor, $2,465 on the ceiling. Today's drop hasn't broken that structure — it's a move inside the box, not out of it.
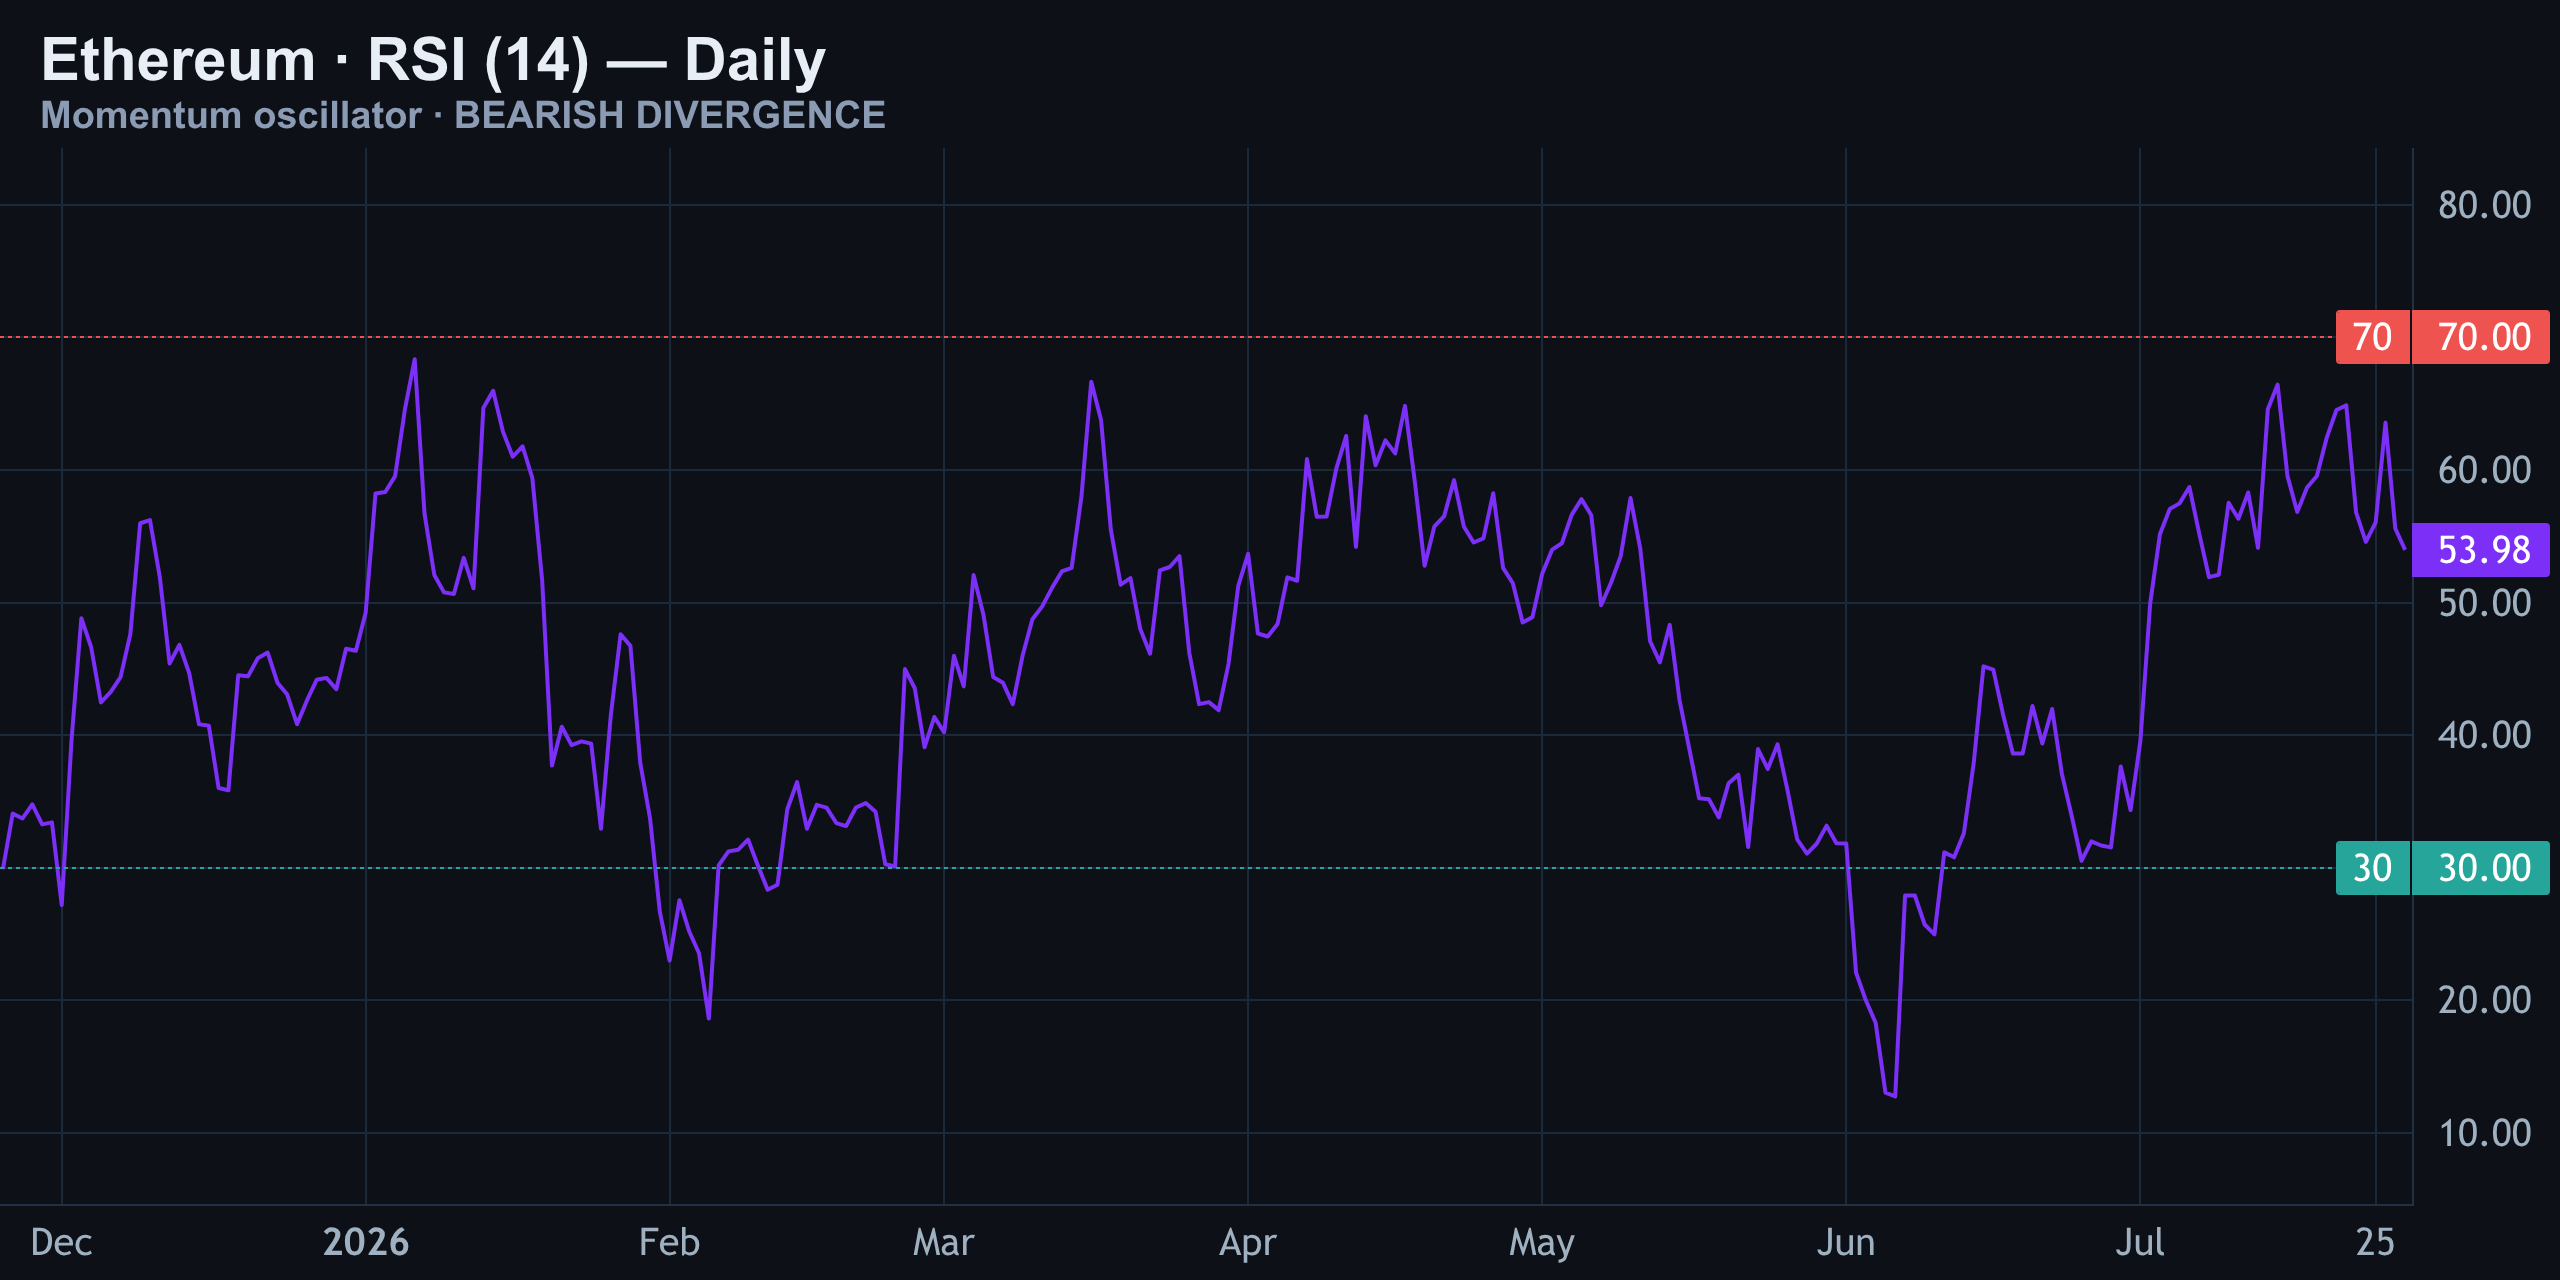
Momentum reads neutral — RSI (14) sits at 54 — but there's a bearish divergence forming: price made a marginally lower high on this latest rejection while RSI failed to confirm it. That's a warning, not a signal on its own.
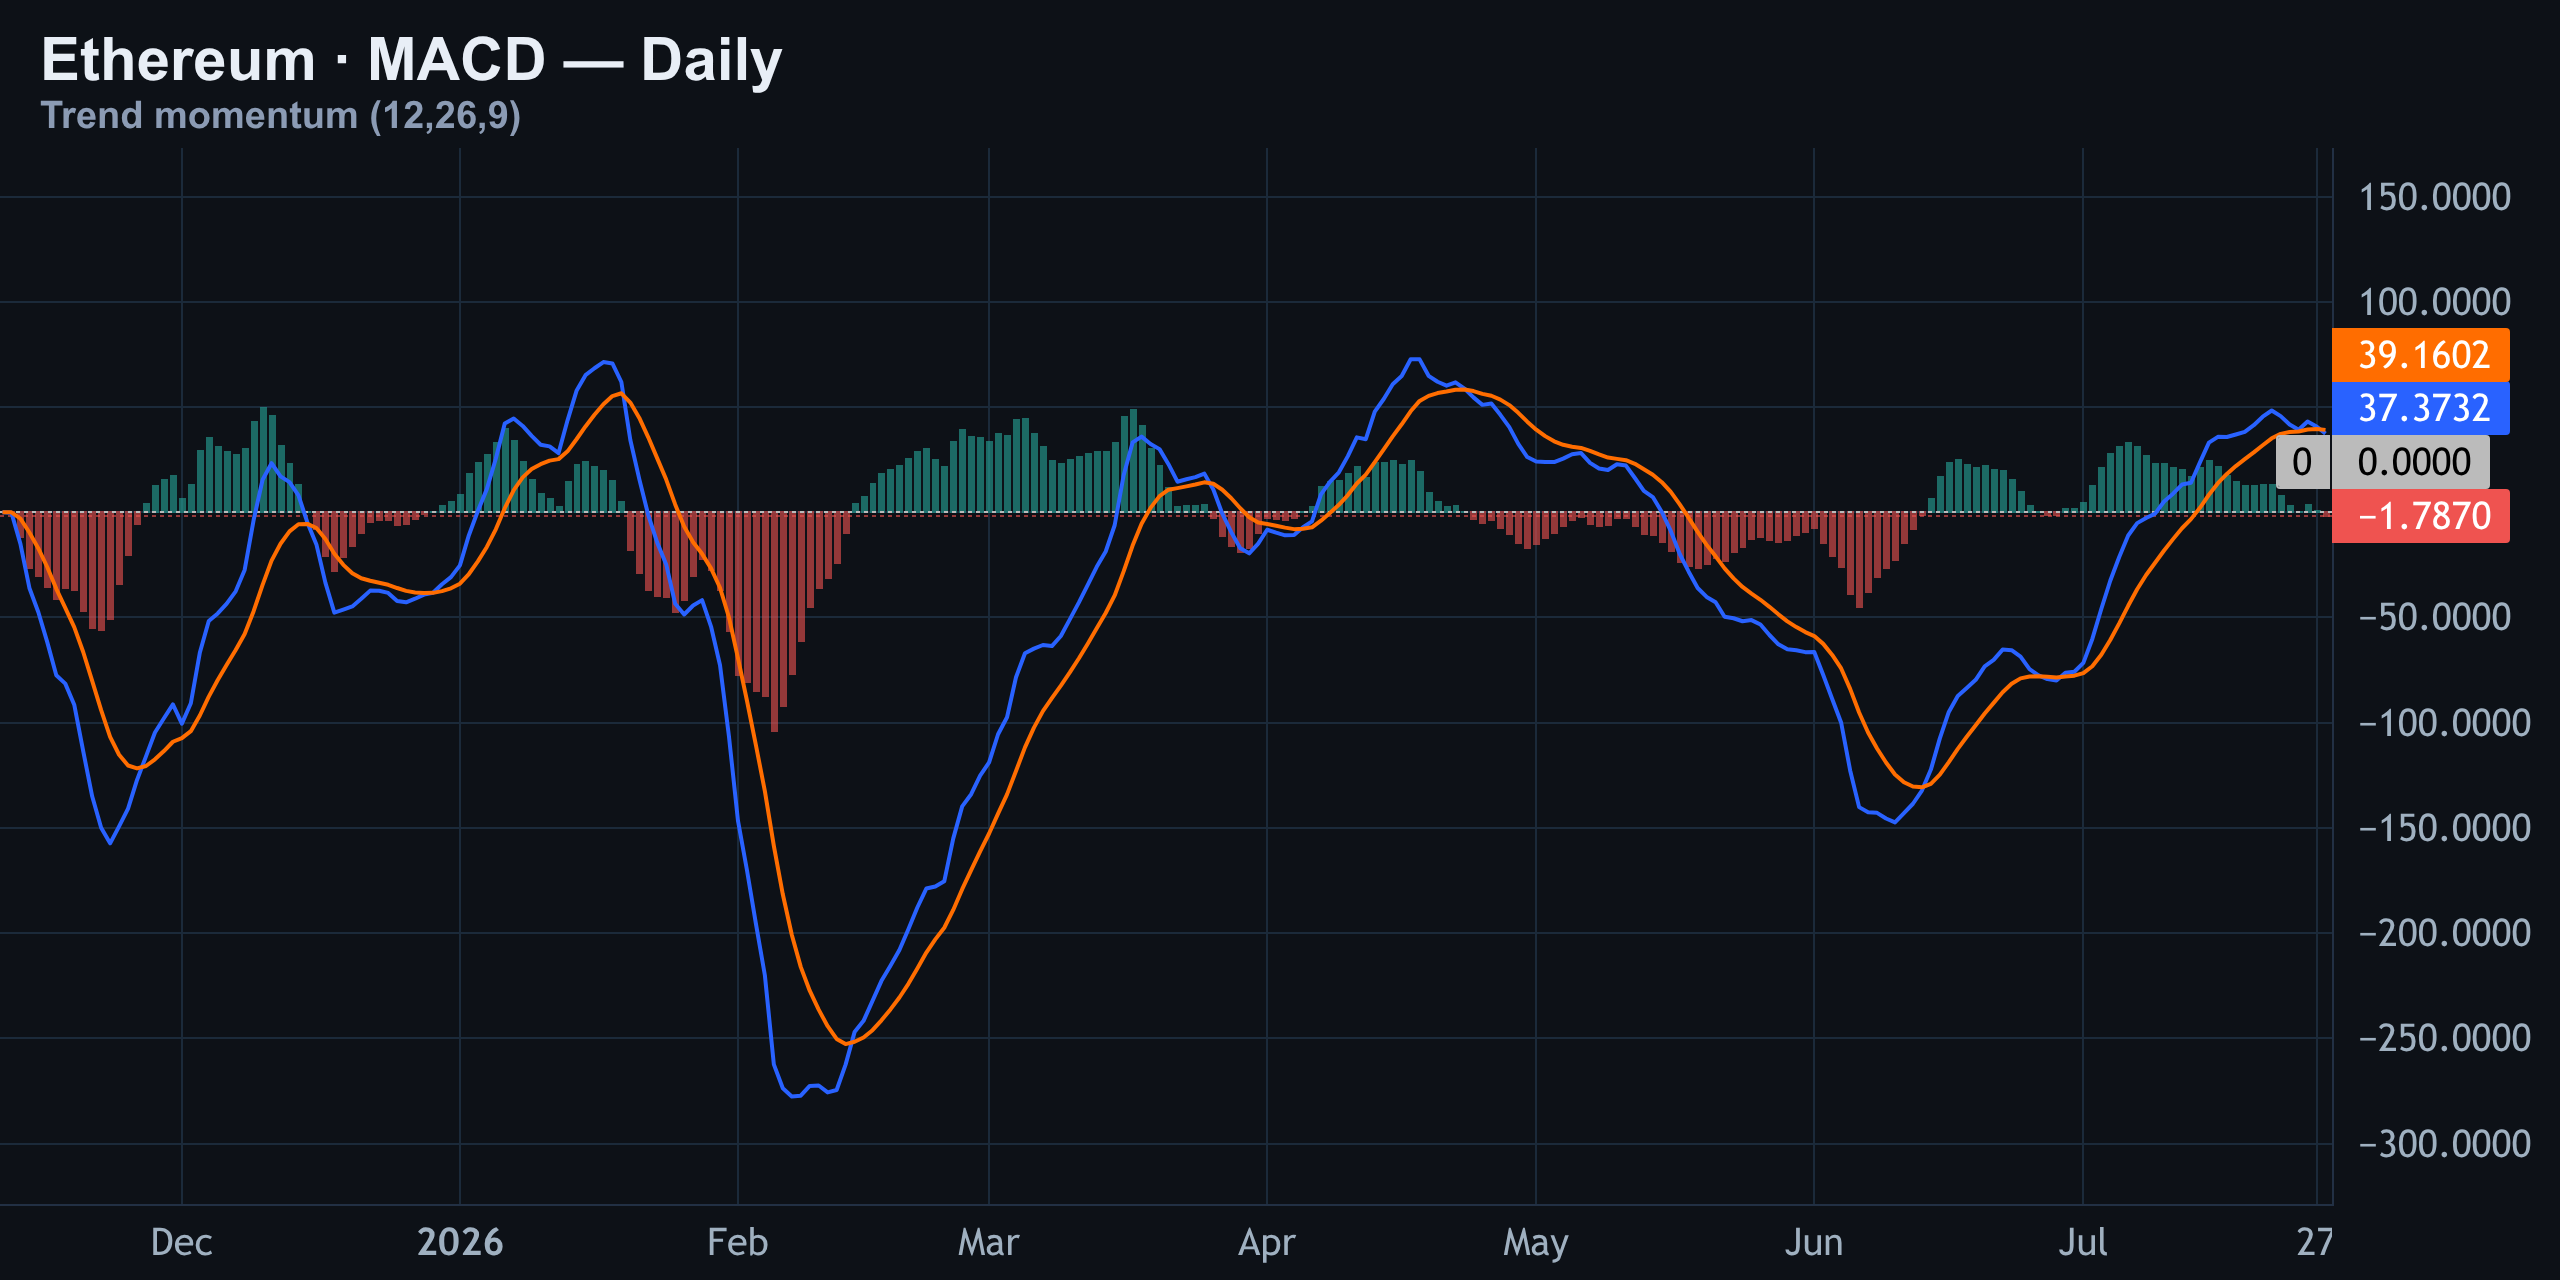
MACD backs that warning up with a bearish cross below the signal line — confirmation that momentum is fading at the highs, even if price hasn't broken the broader structure yet.
| Level Type | Price | Why It Matters |
|---|---|---|
| Today's High | $1,978 | Session rejection point |
| 4H Channel Top | $1,985 | Rising channel resistance |
| Call Wall | $2,200 | Heavy dealer resistance |
| Max Pain (next expiry) | $1,925 | Pull toward this into expiry |
| 4H Channel Floor | $1,878 | Uptrend invalidation line |
| Put Wall | $1,600 | Gamma flip / liquidation zone |
| Daily Range Floor | $1,506 | Structural box bottom |
The Level That Turns Calm Into Chaos: Gamma & Expected Move
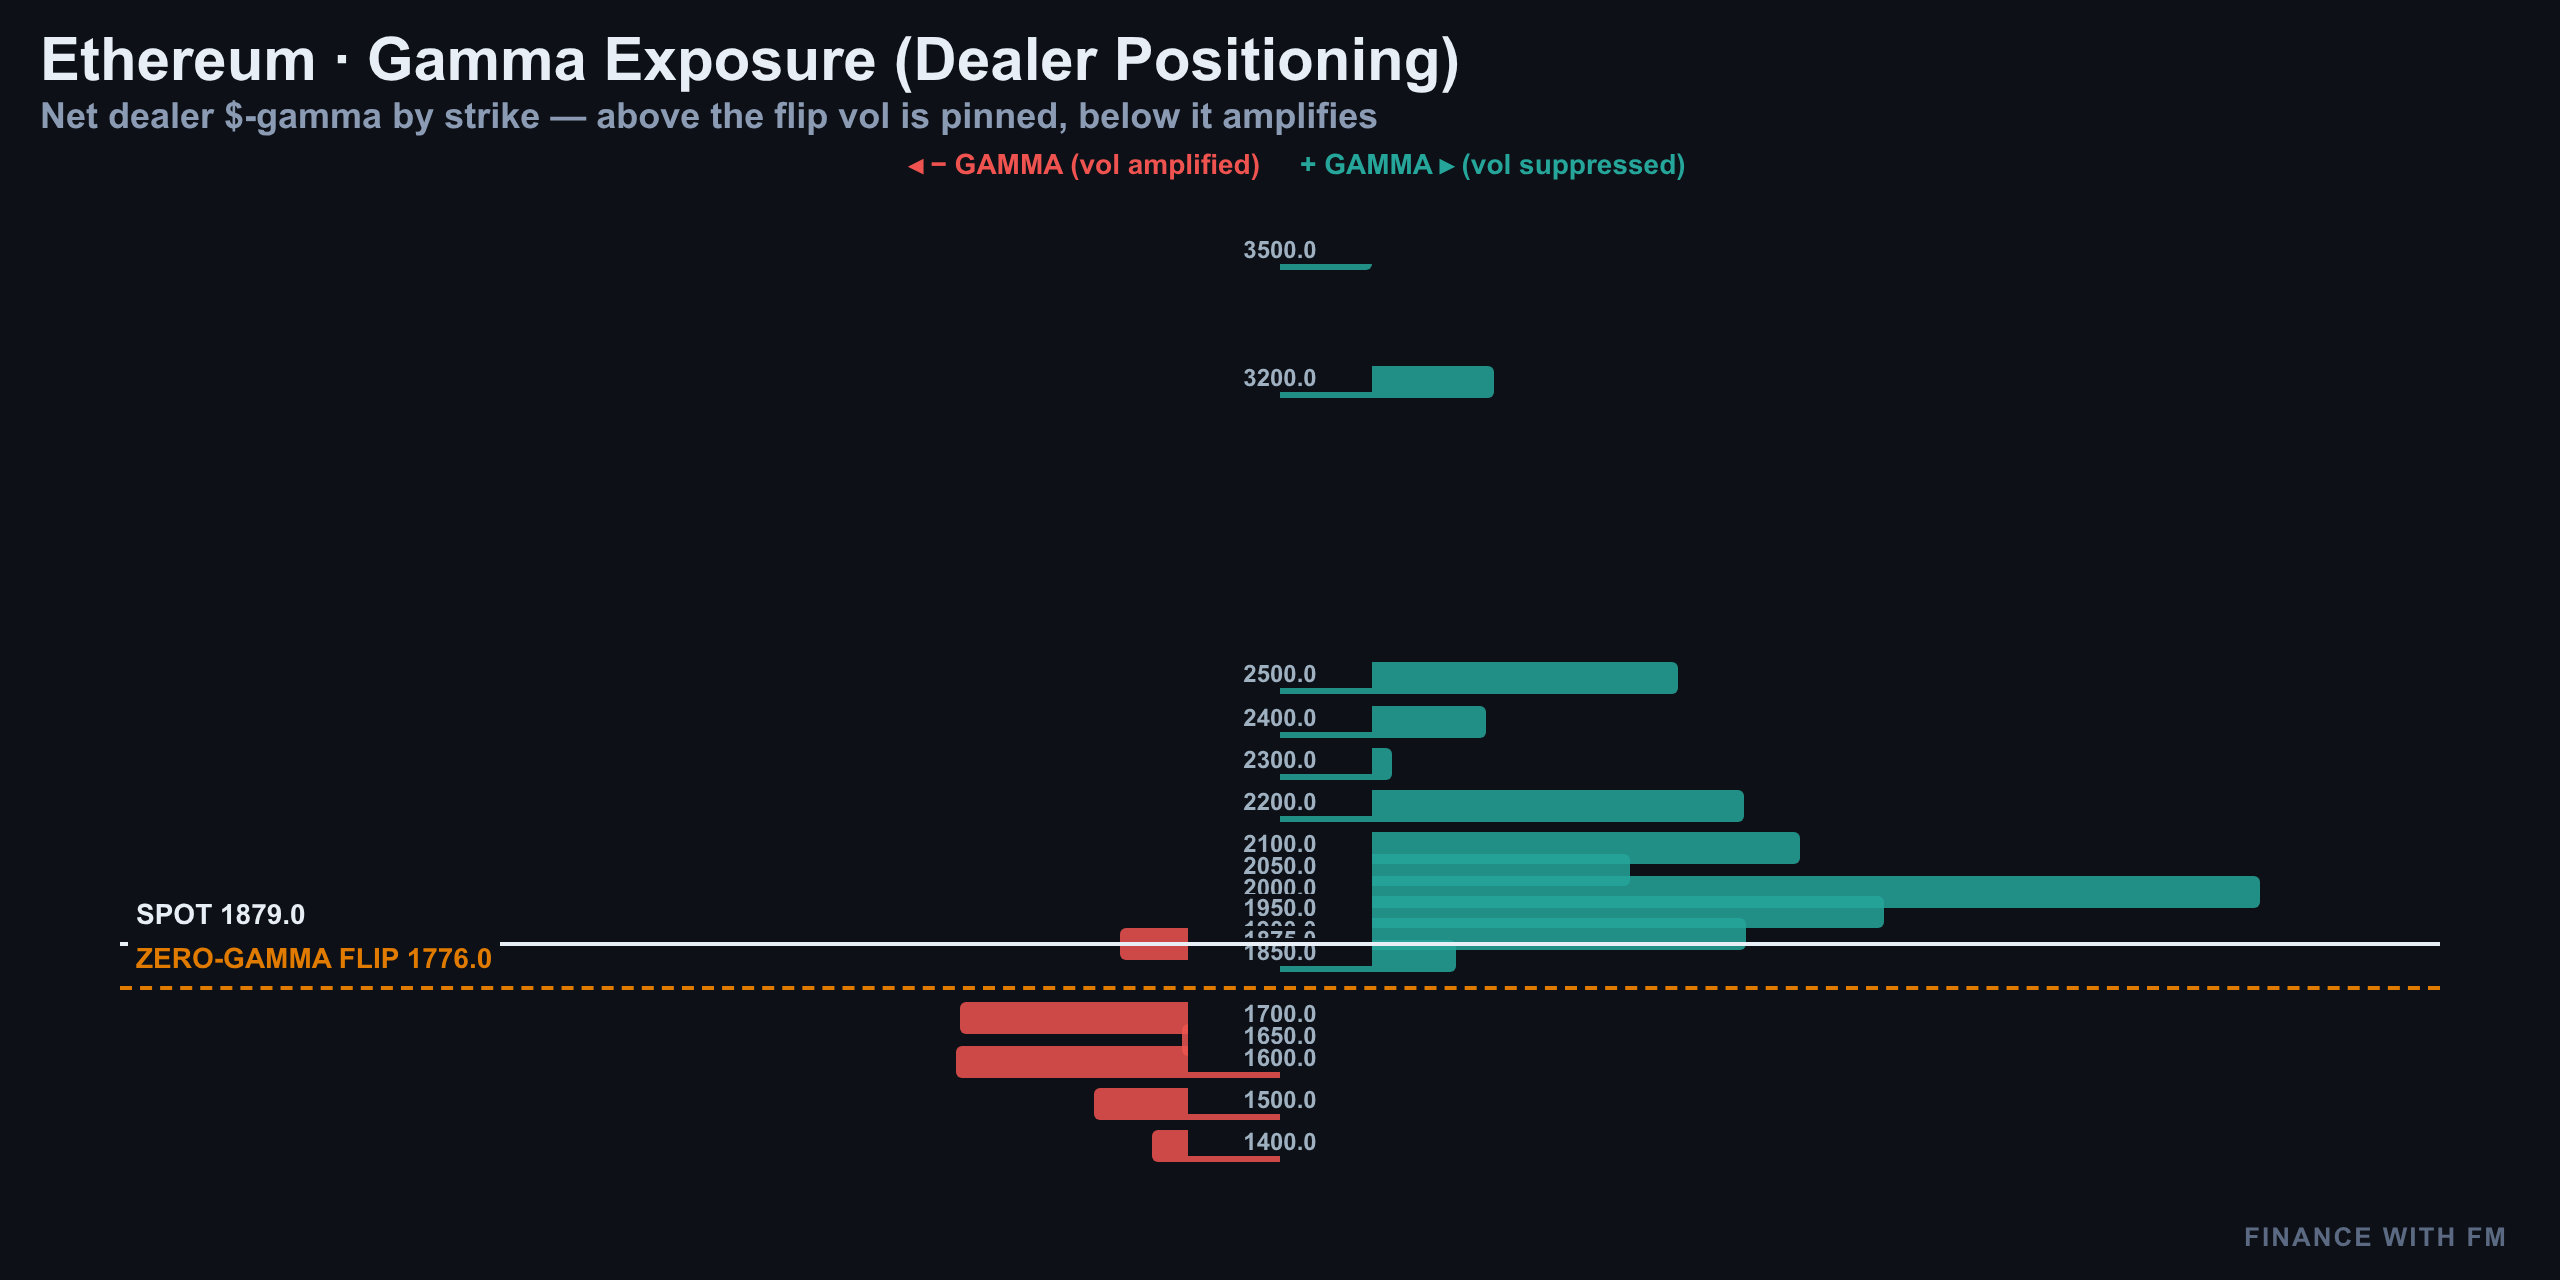
Here's the mechanic that matters most today. Dealers are currently sitting in positive gamma around current price. In practical terms, that means as Ethereum wiggles up and down near $1,879, market makers are forced to buy dips and sell rips to stay hedged — which mechanically dampens volatility and pins price inside a tight band. That's exactly what today's 15-minute chop near the lows looks like.
But positive gamma isn't permanent — it's tied to price. The heavy put wall at $1,600 is the level where that dynamic likely flips. Below it, dealer hedging can flip negative gamma, meaning market makers start *selling* into weakness instead of buying it. That's the mechanism that turns an orderly pullback into a violent, fast move — the level that turns calm into chaos.
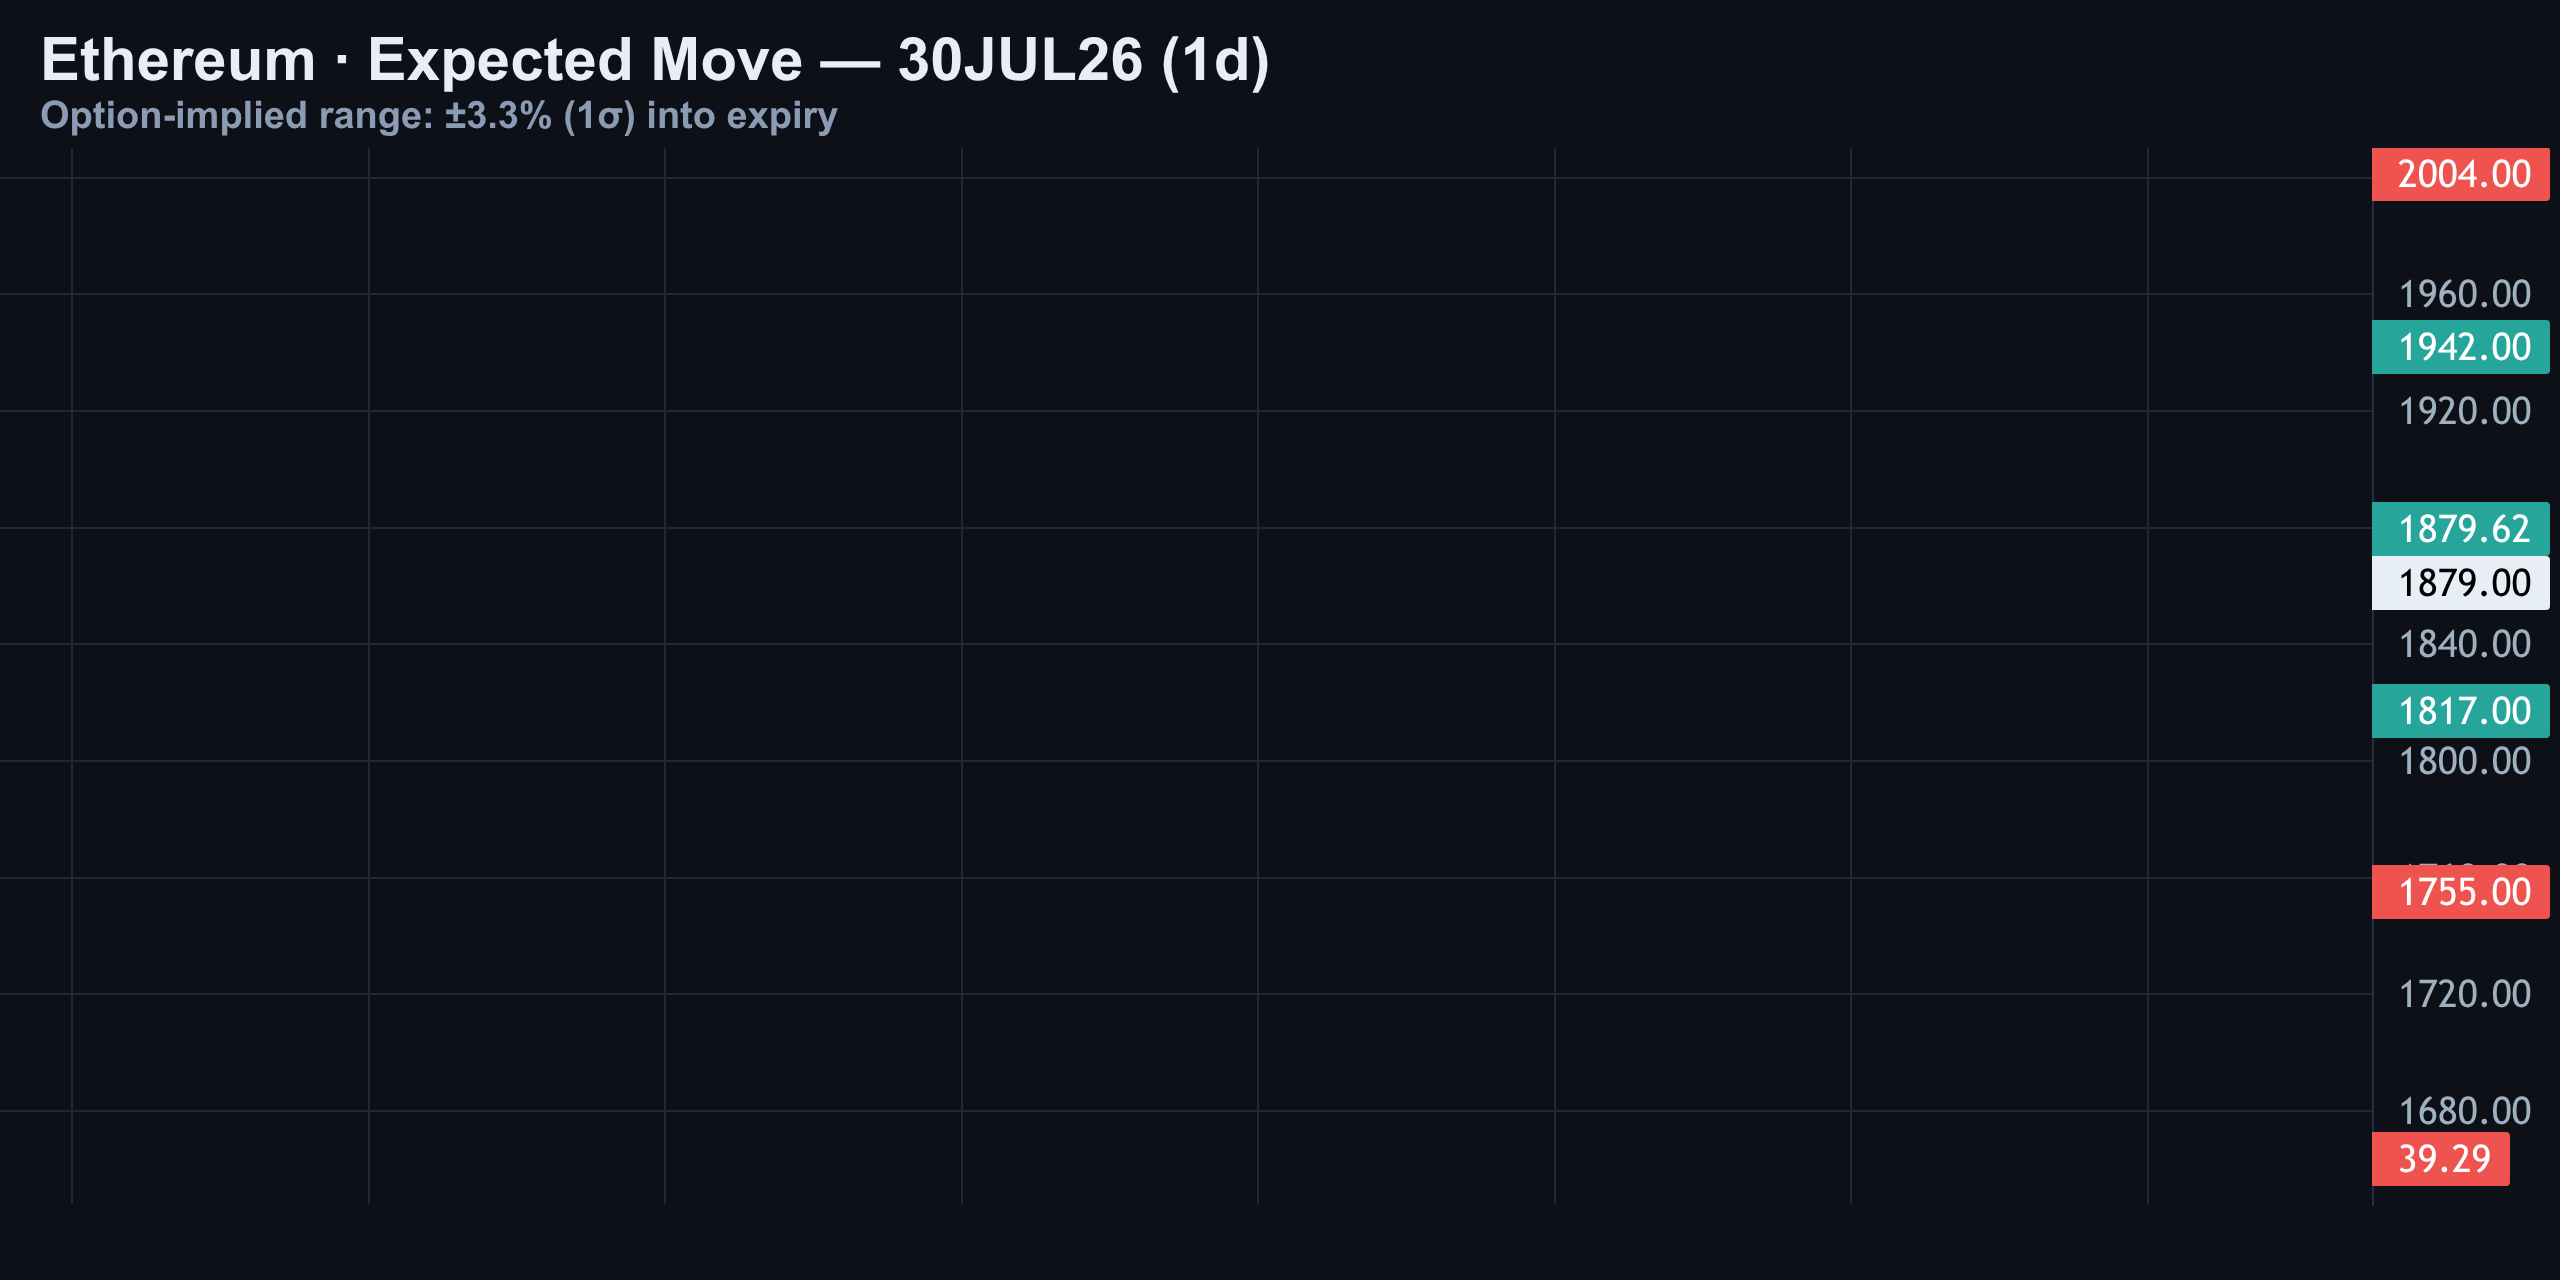
The expected-move data, derived from the current 52.5% implied volatility, frames the probable trading band into the next major expiry — centered loosely around the $1,925 max pain level, with the real tail risk sitting below the $1,600 put wall rather than above the $2,200 call wall. That asymmetry is the whole story of today's board: expensive downside insurance, a magnet pulling toward $1,925, and a trapdoor sitting well beneath current spot.
The Trade Call: No Clean 1:2.5 Setup — Standing Aside
Every level here is real, but none of them currently line up into a trade that clears our standard risk-to-reward bar of 1:2.5. Here's why:
- Longs are crowded: retail is piled long and top traders are long too, which historically fades poorly right after a 3.5% drop.
- Shorts are fighting expensive volatility: with IV running 9.8 points above realized, paying up for downside puts here means the trade needs a big move just to clear the premium.
- Positive gamma argues for range-bound chop near spot, which contradicts a clean directional bet in either direction right now.
- The real edge — the $1,600 gamma-flip zone — is too far from spot to size a tight stop against.
That combination — crowded positioning, expensive vol, and a pinning dealer book — is exactly the setup that chops out both longs and shorts before either side gets paid. Standing aside isn't indecision; it's the same discipline that kept last week's call clean.
Bottom Line
Ethereum's 3.5% drop today looks messier on the 15-minute chart than it actually is structurally. The 4-hour uptrend is intact as long as $1,878 holds, the daily range between $1,506 and $2,465 hasn't broken, and dealers in positive gamma are actively working to keep price pinned near current levels into tomorrow's max pain at $1,925.
The real risk isn't the drop that already happened — it's the trapdoor sitting beneath spot at the $1,600 put wall, where dealer gamma could flip and turn calm chop into a fast, violent move. Until that level is tested or the $1,878 floor breaks with conviction, this stays a range trade, not a trend trade — and no clean setup means no forced trade today.
Key takeaways
- Ethereum fell 3.5% to $1,879 after tapping $1,978, but the drop occurred inside an intact 4-hour rising channel and a multi-week daily range ($1,506–$2,465).
- Options are expensive (IV 52.5% vs RV 42.6%) and skewed toward downside puts, even though dealers sit in positive gamma — a setup built to pin price, not break it.
- The $1,600 put wall is the key level: a break below it risks flipping dealer gamma negative, which could accelerate a slide into a violent move.
- Max pain at $1,925 acts as a magnet into the next expiry; the call wall at $2,200 caps upside, with only a ~3% implied chance of trading above $2,050 by August 1.
- No clean 1:2.5 risk-reward setup exists today — crowded long positioning plus expensive volatility argues for standing aside until $1,878 or $1,600 is tested.
Frequently asked questions
Why is Ethereum down today if dealers are in positive gamma?
Positive gamma dampens volatility and pins price over time, but it doesn't prevent an initial move — it kicks in as dealers hedge the wiggles that follow. Today's drop happened first; the pinning is now showing up in the afternoon chop near $1,879.
What is the put wall and why does it matter for Ethereum right now?
The put wall at $1,600 is where the heaviest put open interest sits. It's also the zone where dealer gamma is likely to flip from positive to negative, which can accelerate a decline rather than cushion it — making it the key downside trigger to watch.
Is Ethereum's uptrend broken after today's 3.5% drop?
Not yet. The 4-hour rising channel that started around July 19 is still intact as long as price holds above roughly $1,878. The daily range between $1,506 and $2,465 also remains unbroken.
What does max pain at $1,925 mean for Ethereum traders?
Max pain is the strike where option writers lose the least money at expiry. It often acts as a mild magnet pulling price toward it into expiration, which is one reason a bounce toward $1,925 wouldn't be surprising even inside a broader downtrend.
Why is there no trade recommended today?
Crowded long positioning, expensive implied volatility relative to realized volatility, and a dealer book that's actively pinning price all work against a clean, low-risk entry in either direction right now. The standard is a 1:2.5 risk-to-reward setup, and nothing on the board currently clears that bar.