
Ethereum Wave C Down or Reclaim $1,930? Elliott Wave Update
Breakout Won First, Then Got Rejected
Last week we asked whether Ethereum's push to $1,956 was rejection or a launchpad. The honest answer turned out to be both. Price actually broke out even higher — running all the way to $1,981 — before the rally lost its legs entirely. Ethereum has since rolled over and is now trading around $1,896, down close to 2% on the week.
For context, at the time of writing ETH is changing hands between roughly $1,880 and $1,915 across major venues, with CoinMarketCap pricing it at $1,893.54, Yahoo Finance at $1,915, CoinGecko at $1,896, and Robinhood at $1,880. That spread itself tells you something — this is a market chopping in a tight, indecisive band rather than trending with conviction.
That's the real shift this week. Seven days ago the question was tactical: does $1,956 hold or break? Now it's structural: is the entire bounce from the recent low actually corrective, meaning the next major move is a wave C decline, not a wave 3 rally? One level — $1,930 — is the fulcrum for that whole debate.
4H — The Bigger Picture: Impulse or Diagonal?
Zoom out, because the four-hour chart is where the real story lives. The higher-degree skeleton shows Ethereum basing near $1,512, rallying to a high around $1,731, and eventually stretching all the way to $1,981. That's the macro shelf this entire analysis is built on.
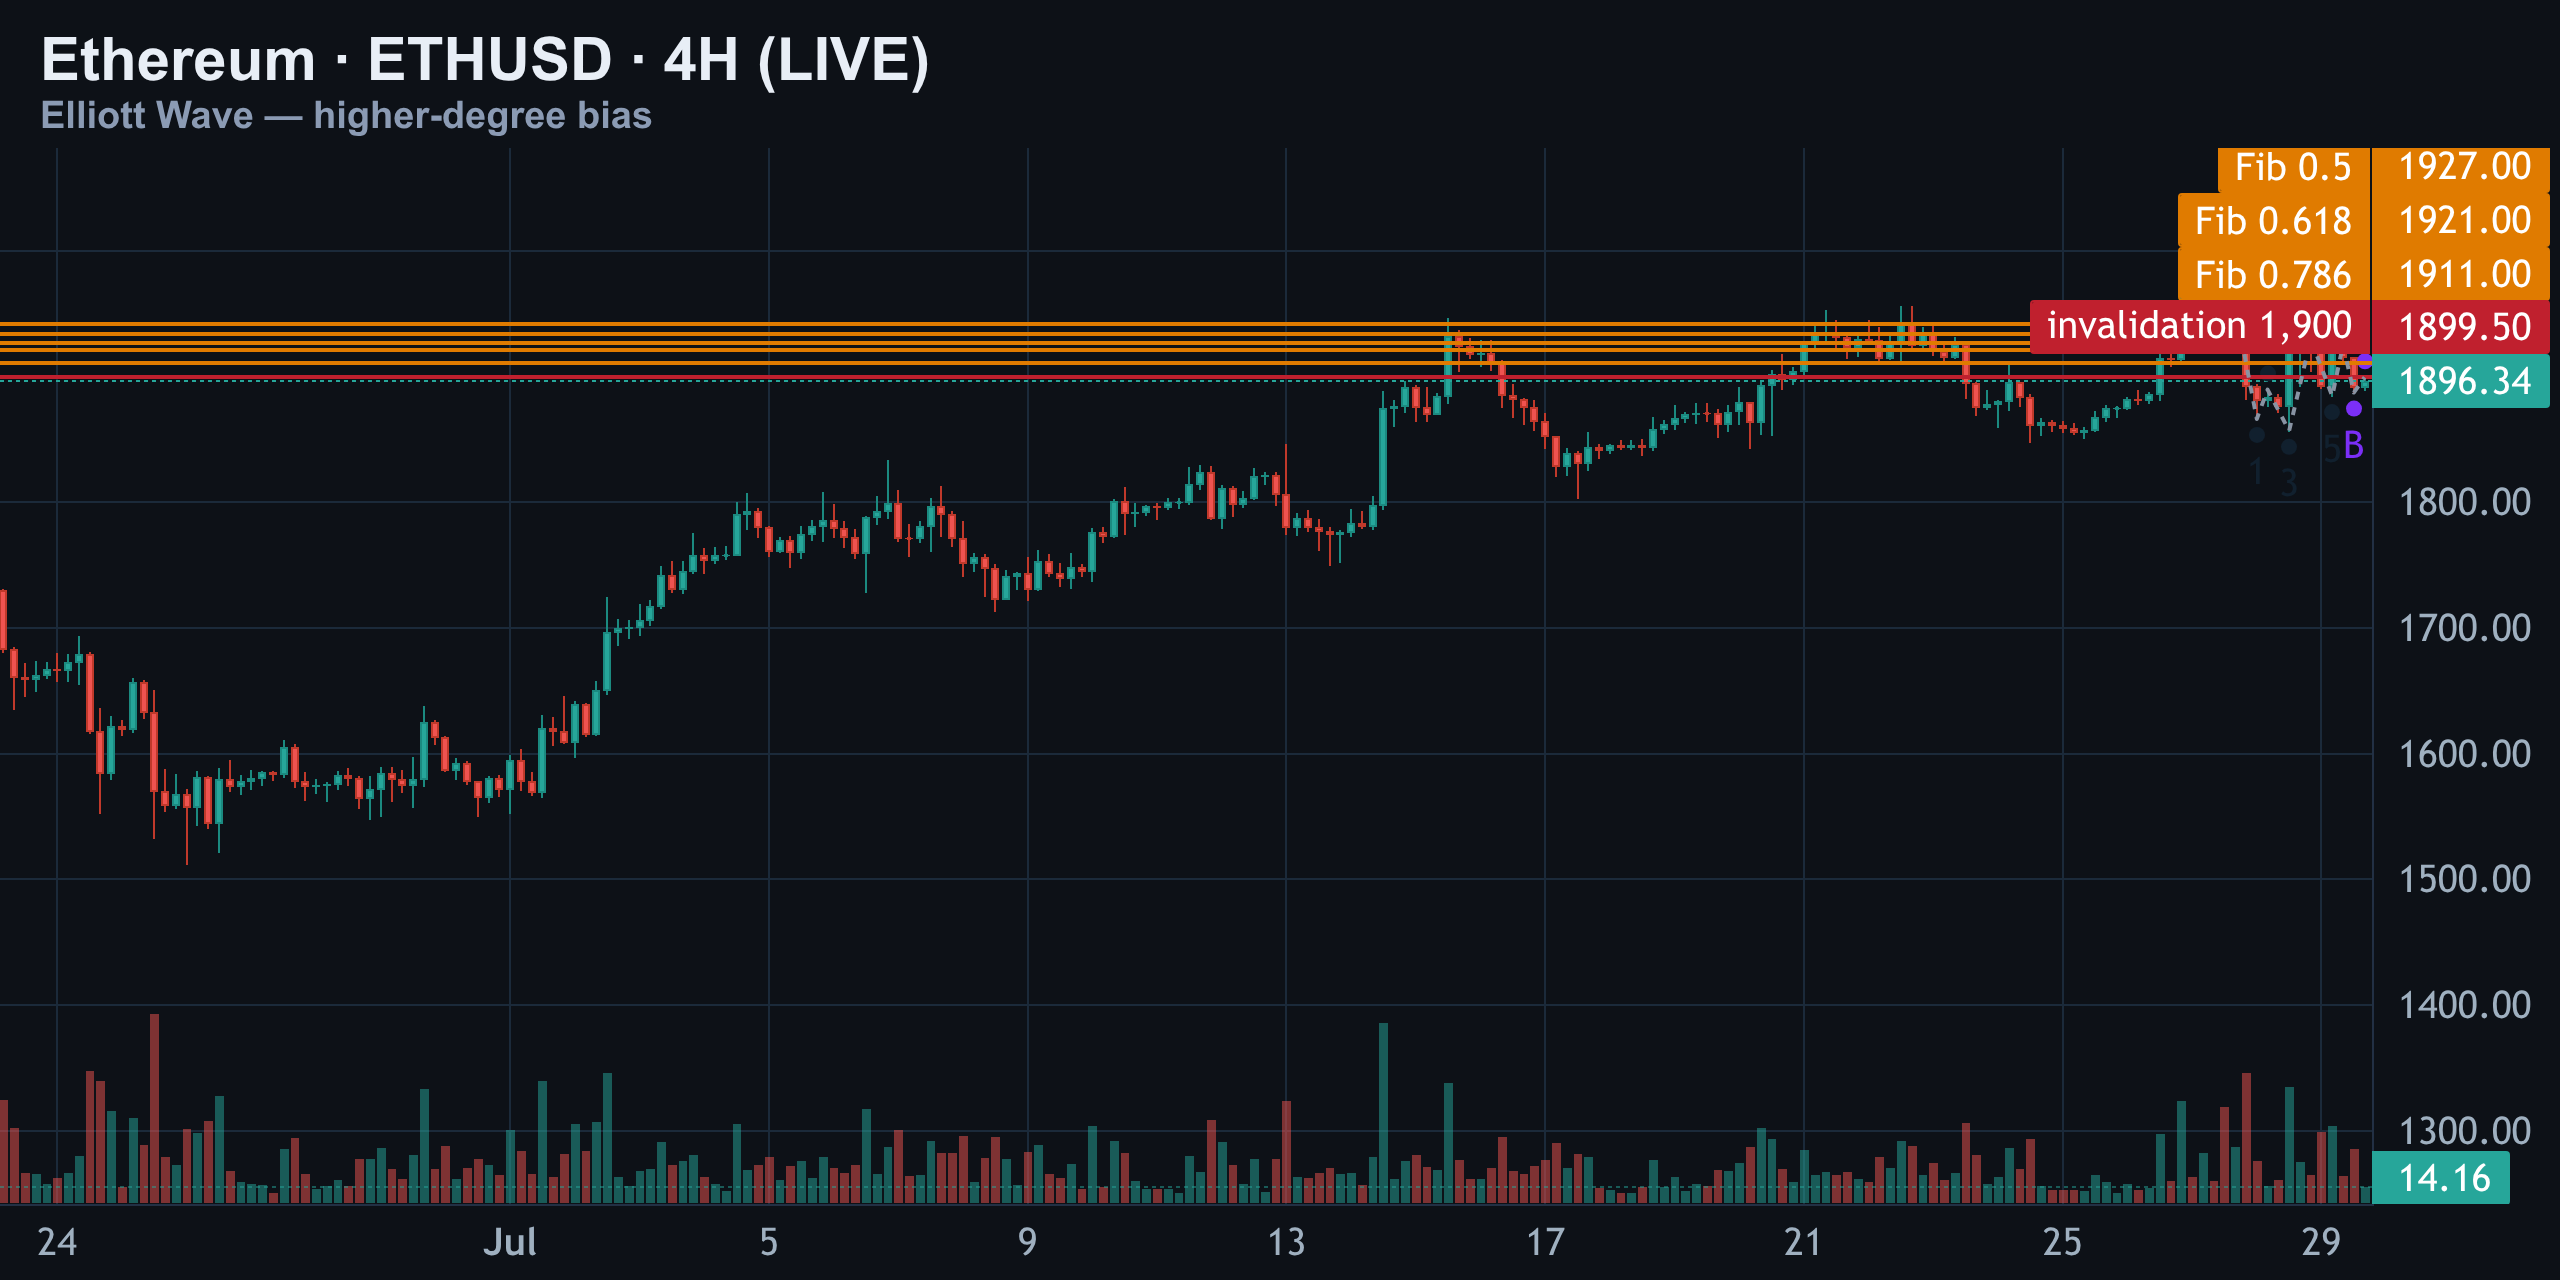
The auto count tries to label a fresh five-wave impulse off that base. Here's how it's mapped, and where it falls apart:
| Wave | Price | Rule Check |
|---|---|---|
| Wave 1 | $1,866 | — |
| Wave 2 | $1,890 | Valid retrace |
| Wave 3 | $1,857 | Smaller than Wave 1 — forbidden |
| Wave 4 | $1,930 | Overlaps Wave 1 territory — forbidden |
| Wave 5 | $1,885 | Structure invalid by this point |
Two violations, back to back. Wave three comes out smaller than wave one — and wave three is never allowed to be the shortest wave in an impulse. Then wave four drags all the way back into wave one's price territory, a hard overlap violation for any clean five-wave move. Put those two flags together and this isn't an impulse at all — it reads far more like a diagonal, or simply a corrective structure dressed up as a trend.
After that failed impulse, price carved out what looks like a clean A-B-C: A down to $1,925, B bouncing to $1,887, and C stalling almost exactly at $1,900. A C-wave landing right on the invalidation shelf is a tell in itself.
1H — Primary Count vs the Alternates
This is where the actual trading decision gets made. Start with the primary count: wave one tops at $1,947, and wave two crashes all the way down to $1,803 — a retrace of over 100% of wave one. That single move breaks wave two's cardinal rule (it can never retrace beyond the start of wave one), which means this isn't a textbook impulse. Treat it as messy, overlapping corrective action instead.
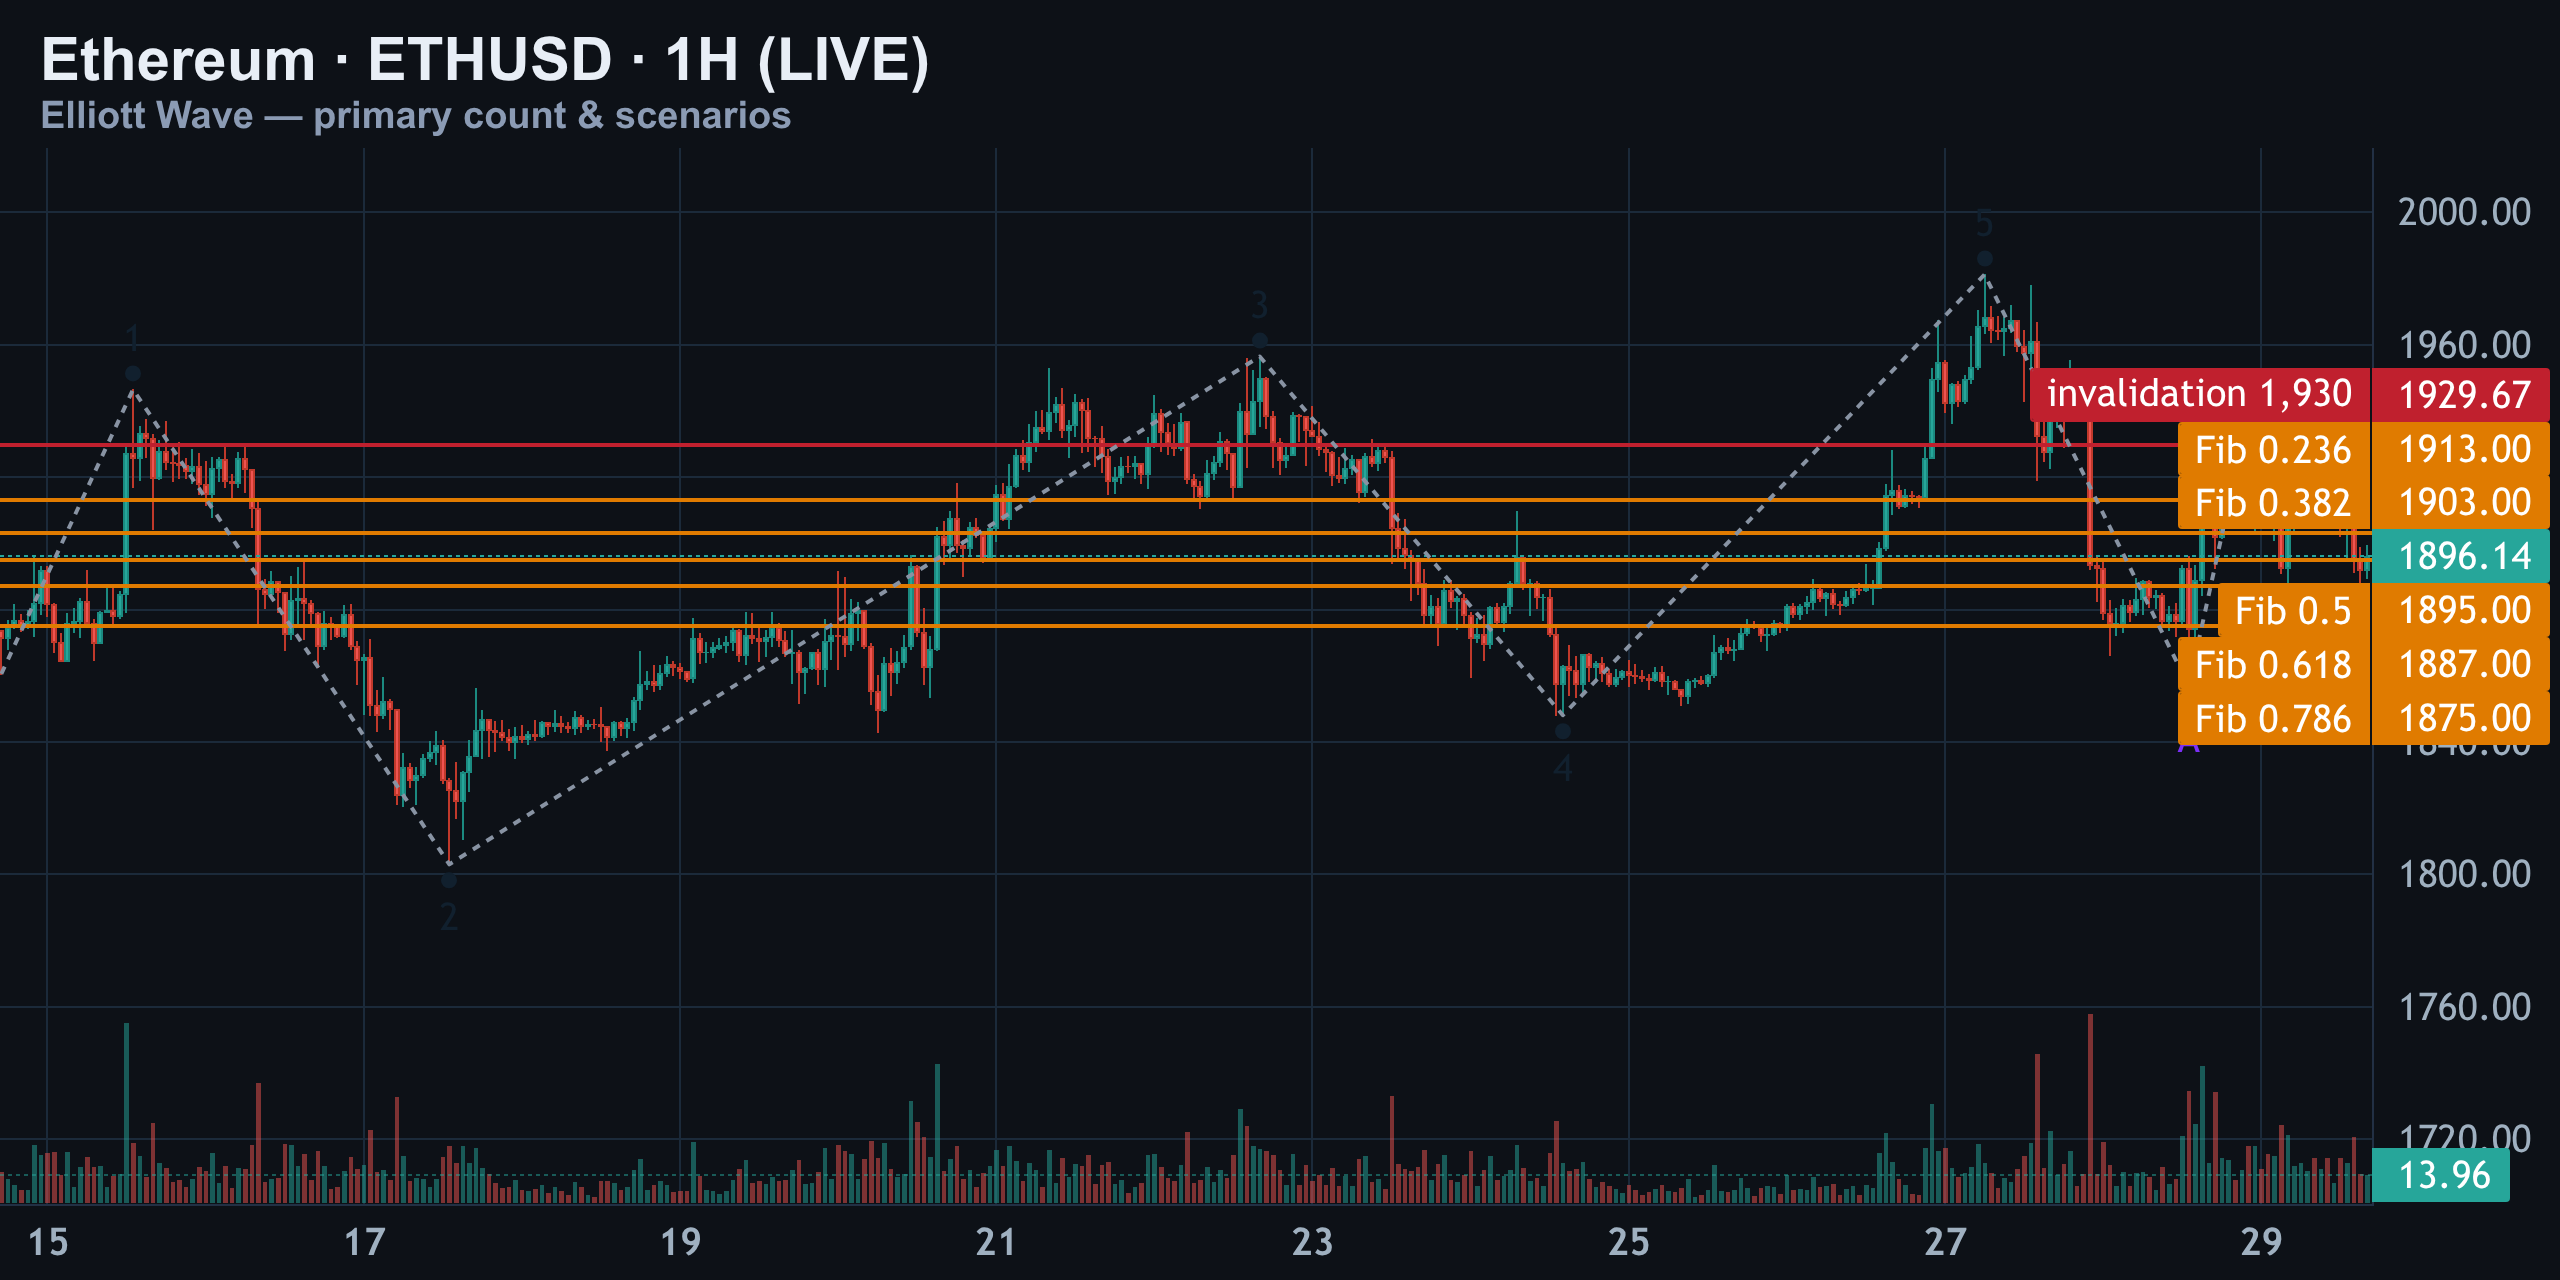
From that broken structure, price pushed to a high near $1,956, pulled back to $1,848, then spiked into the cycle high at $1,981. From there: an A-wave down to $1,857, and a sharp B-wave bounce to $1,930.
| Scenario | Trigger | Target |
|---|---|---|
| Primary — Wave C down | Rejection at $1,900–$1,930 | $1,857, extended to $1,806 |
| Alternate — B not finished | Close above $1,930 | Retest of $1,981, possible marginal new high |
| Alternate — Triangle | Chop stays inside $1,885–$1,930 | Range-bound until breakout |
The primary read: we're now in wave C, heading lower, targeting a retest of the $1,857 low, with an extended objective near $1,806 if C matches A in length. Wipe the board for the alternate — if price reclaims and closes back above $1,930, the B-wave isn't finished, wave C is off the table, and buyers are pushing for a retest of $1,981 or even a marginal new high.
One more lower-probability alternate: if price just keeps chopping between $1,885 and $1,930, we're building a triangle before the real move. It's not the base case, but it would explain this week's sideways grind neatly.
15M — Timing the Entry
Drop to the fifteen-minute chart for timing, not thesis. Price has been glued to the $1,900 pivot for days, chopping between roughly $1,875 and $1,975 on this timeframe.
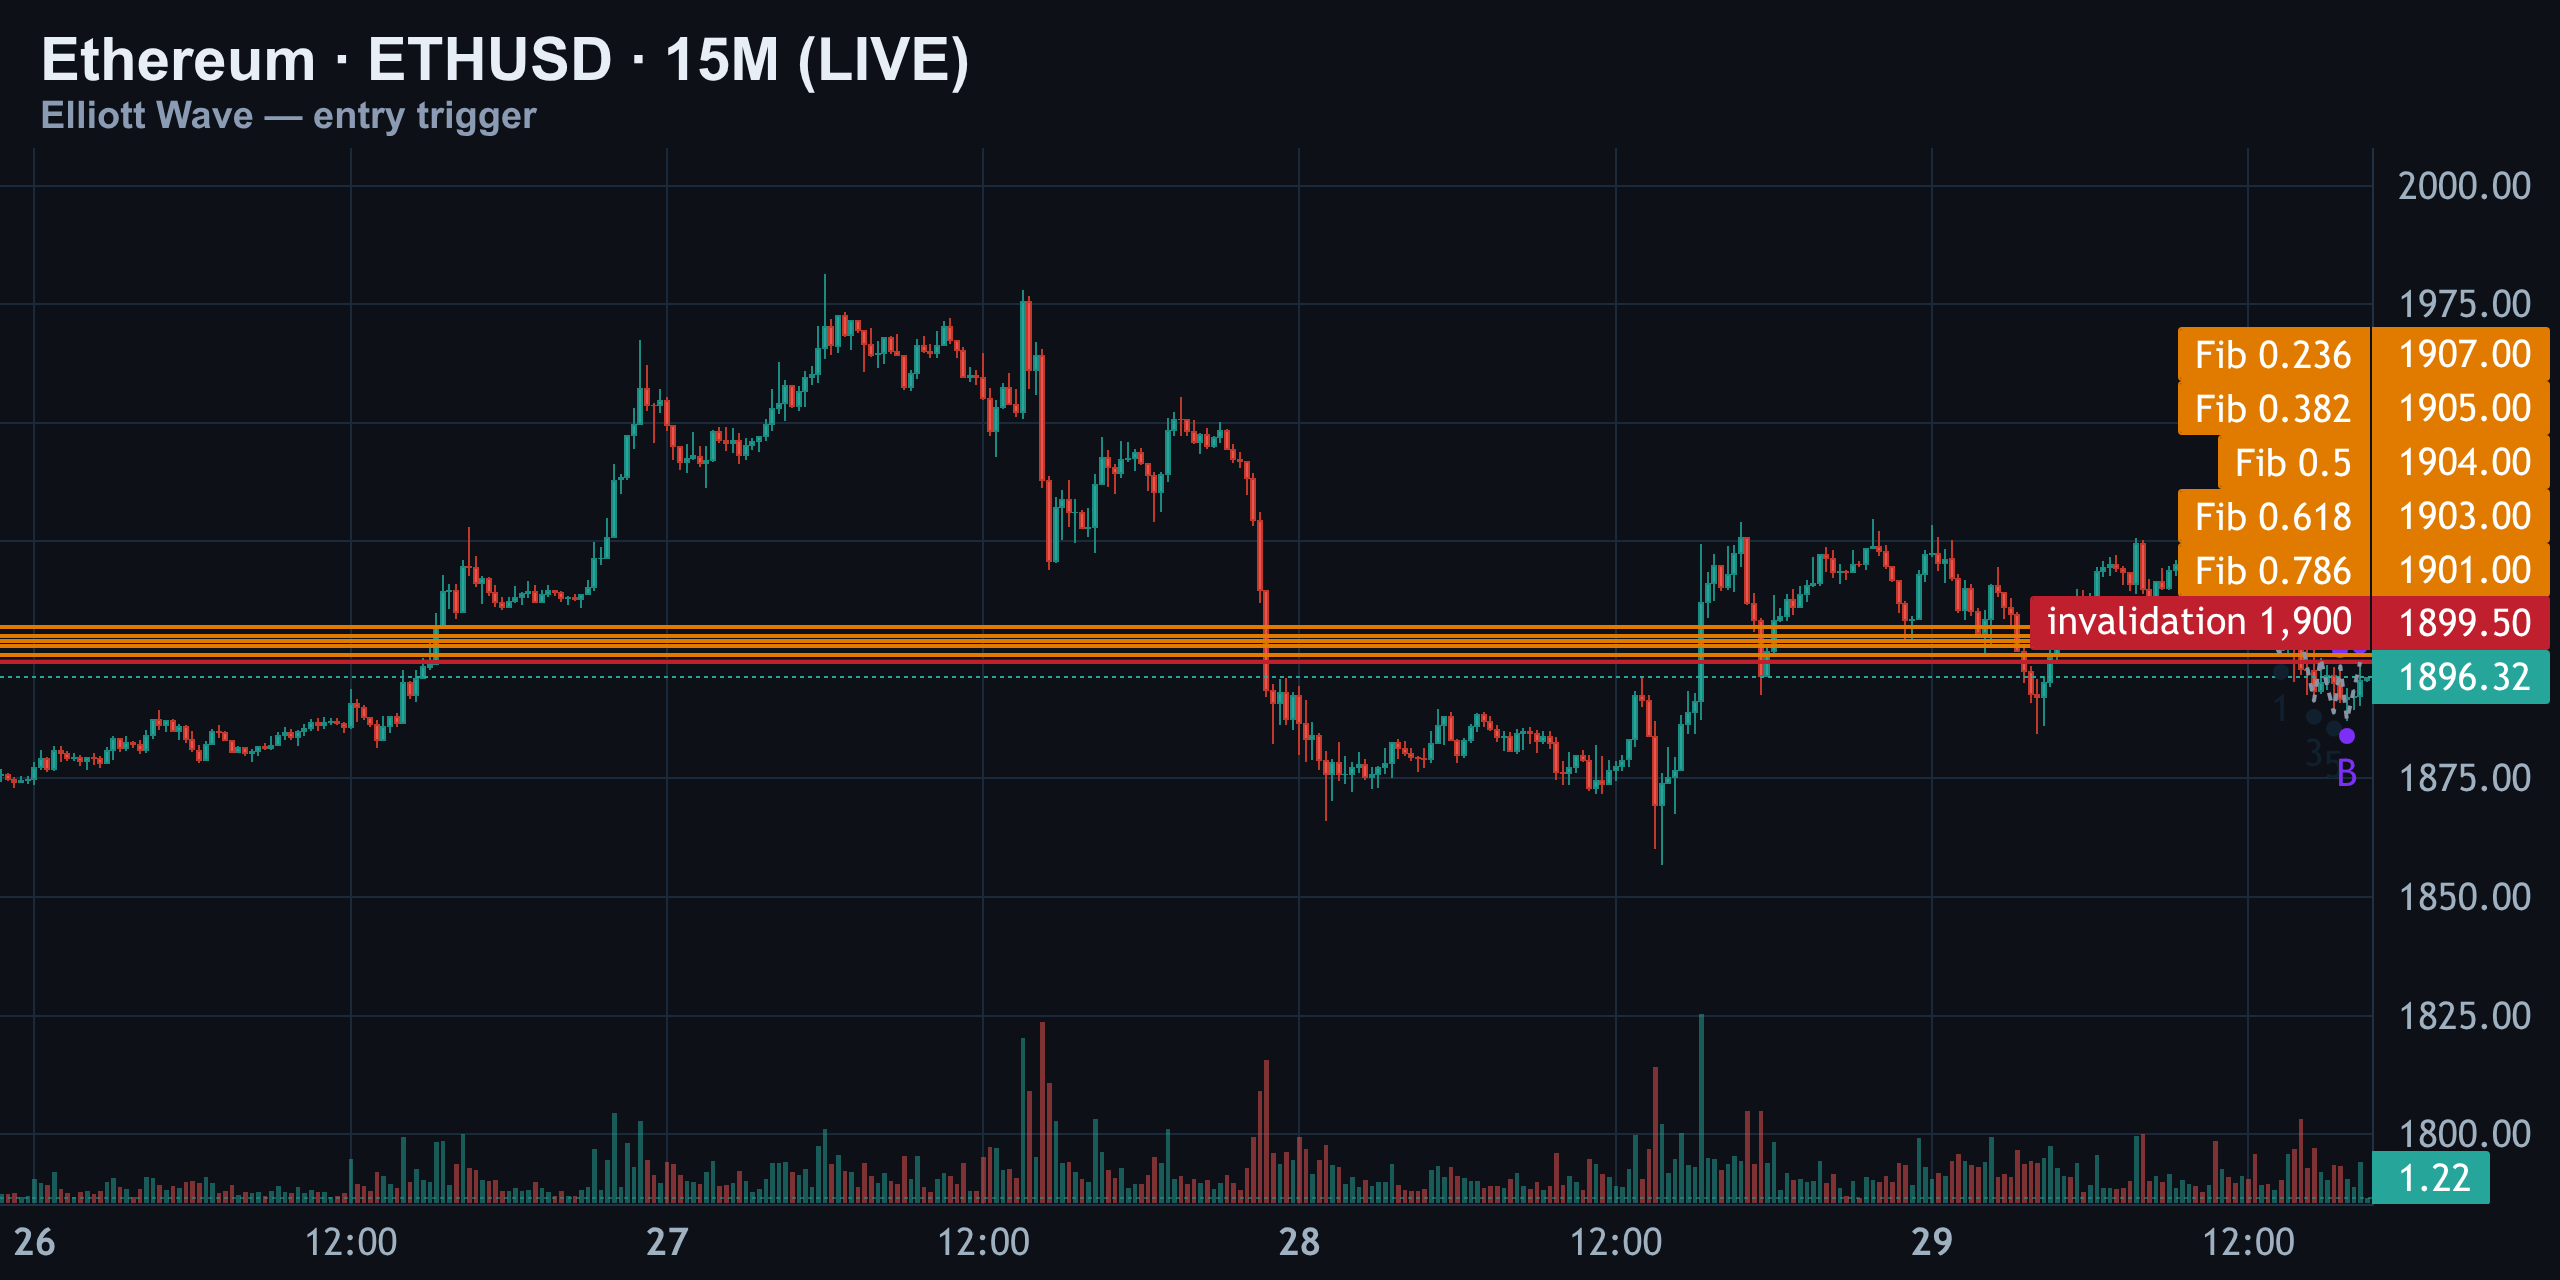
The auto count here shows the same broken-rule signature seen on the higher frames — wave two retracing over 100% of wave one — confirming this local bounce is corrective chop, not a clean impulse either.
| Level | Price | Significance |
|---|---|---|
| Fib 0.236 | $1,907 | Upper edge of rejection zone |
| Fib 0.786 | $1,901 | Lower edge of rejection zone |
| Invalidation | $1,900 | Structural pivot |
| Ask-side order wall | $1,903 | Resting sell liquidity |
For a short entry, the setup wants price to tag the $1,900–$1,911 zone, get rejected, and fail to reclaim it on a closing basis. That confirms the wave C decline is live on the higher frames too. If price instead grinds through $1,911 and holds above it, that's the early warning the bullish alternate is taking over — and shorts need to stand down fast.
The Scenarios, Ranked
Putting the three timeframes together, here's how the probabilities stack up right now:
| Rank | Scenario | Confirmation | Target |
|---|---|---|---|
| 1 | Wave C down (primary) | Rejection at $1,900–$1,930, close below $1,900 | $1,857 → $1,806 |
| 2 | B-wave extension (bullish) | Close above $1,930 | Retest $1,981, possible new high |
| 3 | Triangle consolidation | Repeated chop $1,885–$1,930 without breakout | Range persists, delayed move |
The weight of evidence — broken wave-3 rule on the 4H, broken wave-2 rule on the 1H, and the same signature repeating on the 15M — leans toward the corrective read. But Elliott Wave counts are probabilistic, not predictive certainties, and $1,930 is the line that flips the entire bias.
Positioning & Order Flow: The Edge
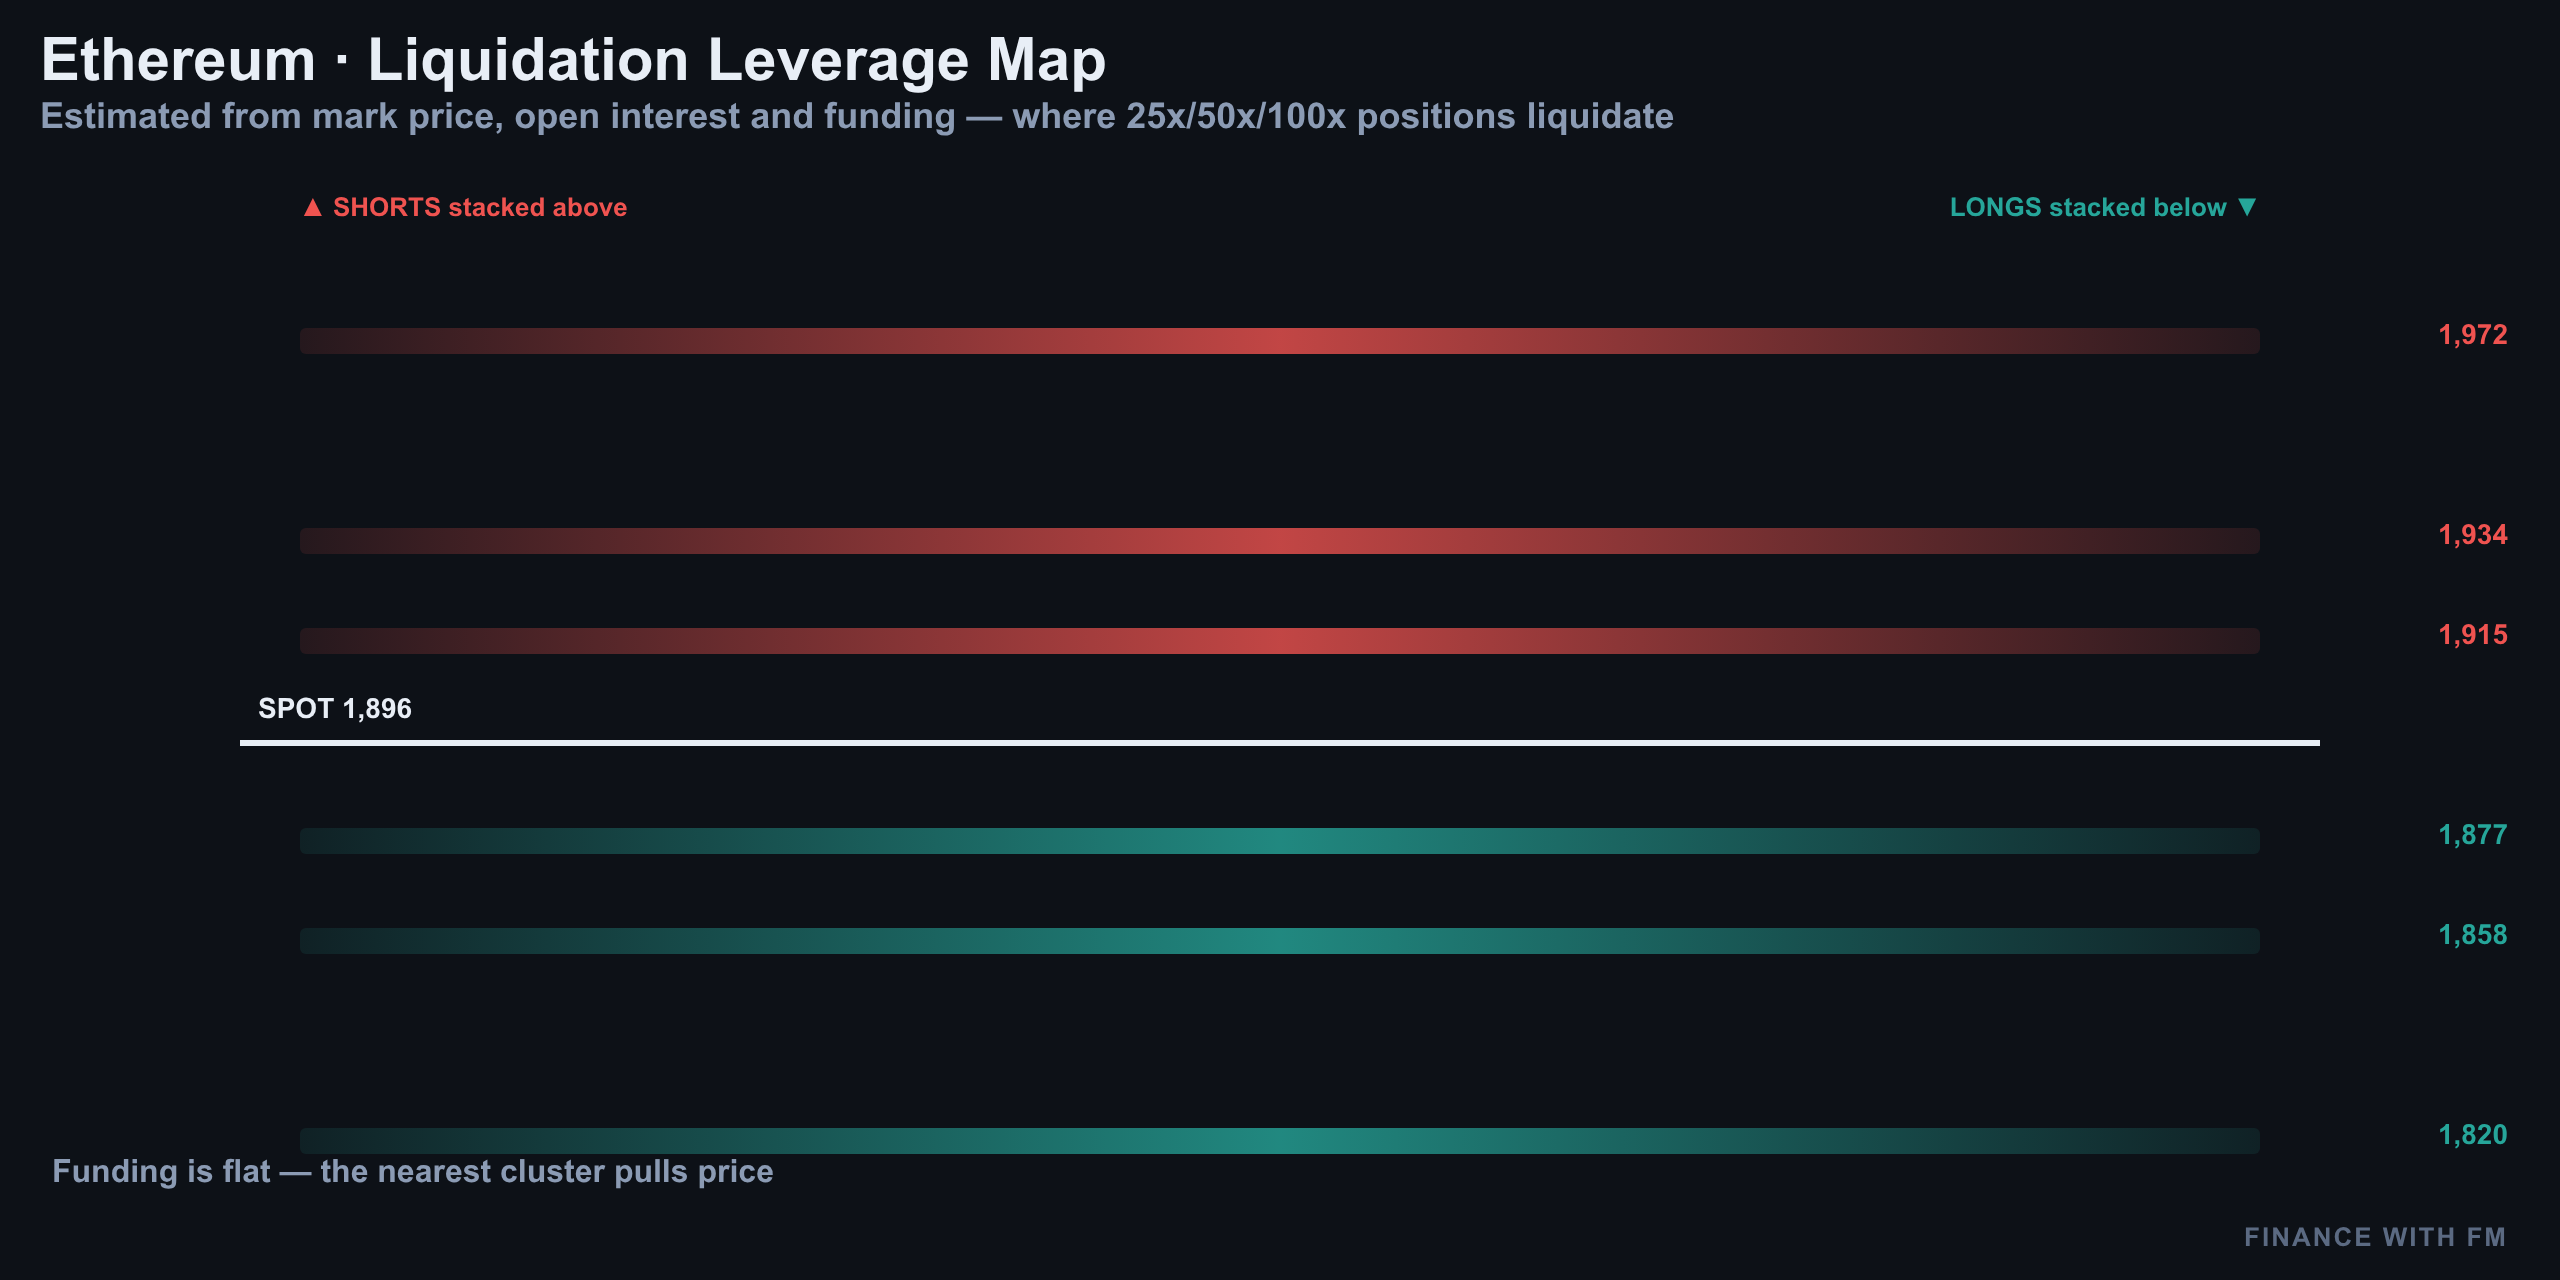
Structure tells you what's likely; positioning tells you who's exposed. Liquidation clusters show where leveraged longs and shorts get forced out of their positions if price moves against them — and those clusters often act as magnets or accelerants for a move.
Structure vs Positioning — Do They Agree?
When the wave count and the liquidation map point the same direction, that's when a setup earns real conviction. Right now, the corrective wave C read on price structure lines up with a market that's still carrying leveraged length built during the run to $1,981 — length that becomes a source of fuel if $1,900 breaks and sellers force a flush toward the lower liquidation clusters. That agreement between structure and order flow is a meaningful part of why the primary count is being favored over the bullish alternate.
Levels to Watch
Whichever way this resolves, these are the numbers that matter over the next few sessions:
| Level Type | Price | What It Means |
|---|---|---|
| Cycle high | $1,981 | Invalidates the entire bearish count if reclaimed with volume |
| Key pivot | $1,930 | The line between wave C down and B-wave extension |
| Rejection zone | $1,900–$1,911 | Fib cluster + order wall; decisive short-term battleground |
| Primary downside target | $1,857 | Wave C = Wave A completion level |
| Extended downside target | $1,806 | If Wave C extends beyond Wave A |
| Current price | ~$1,896 | Sitting inside the rejection zone |
Setup Per the Count (Not Advice)
For traders following the primary wave C thesis, the logical trigger is a tag-and-reject of the $1,900–$1,911 zone with a failure to close back above it — that's the confirmation the C-wave is live across timeframes, with $1,857 as the first objective and $1,806 as the stretch target if momentum extends.
- Bearish trigger: rejection at $1,900–$1,911, closing candle back below $1,900
- Bearish targets: $1,857 first, $1,806 extended
- Bullish invalidation: a decisive close above $1,930
- Bullish target if triggered: retest of $1,981, possible marginal new high
- Neutral/chop scenario: repeated failure to break either $1,885 or $1,930 signals a triangle forming
Whichever side you lean toward, $1,930 is the number that changes the entire narrative. Above it, buyers are back in control and the C-wave thesis is dead. Below it — and especially below $1,900 — the corrective read gets stronger and $1,857 becomes the near-term magnet.
Where Every Coin Sits in Its Count
Ethereum isn't trading in isolation — it tends to move with broader crypto market structure, and right now the pattern of failed impulses and rule-breaking wave counts showing up on ETH's charts is worth watching for signs of similar exhaustion elsewhere in the majors. As the wider market digests the rejection from cycle highs, keep an eye on whether Bitcoin and other large caps are showing the same overlapping, rule-breaking structure — that kind of correlated breakdown would add weight to the bearish case for Ethereum specifically.
For now, ETH remains the clearest example: a rally that looked impulsive on the surface but fails Elliott Wave's own rulebook underneath, with one level — $1,930 — deciding whether the next leg is up or down.
Summary
Ethereum ran to $1,981, got rejected, and is now sitting around $1,896 — down almost 2% on the week. Under the surface, the wave structure powering that entire rally has broken two hard Elliott Wave rules on the 4H and 1H charts alike: wave three coming out shorter than wave one, and wave two retracing over 100% of wave one. Both violations point away from a clean bullish impulse and toward a corrective structure — meaning the current bounce could be a wave C down, not a fresh wave 3 up.
The line in the sand is $1,930. Lose the $1,900–$1,911 rejection zone and fail to reclaim it, and the primary count targets $1,857, extending to $1,806. Reclaim and close above $1,930, and the bullish alternate takes over, aiming back at $1,981 and potentially a marginal new high. Until one of those levels breaks decisively, this is a market to watch, not chase.
Key takeaways
- ETH broke out to $1,981 then rejected hard, now trading near $1,896 — down ~2% on the week
- The 4H and 1H wave counts both break hard Elliott Wave rules (wave 3 shorter than wave 1; wave 2 retracing over 100%), pointing to a corrective structure, not a fresh impulse
- $1,930 is the pivot: below it, wave C targets $1,857 and $1,806; above it, buyers aim for a retest of $1,981
- The $1,900–$1,911 zone stacks Fibonacci confluence, structural invalidation, and a resting ask-side order wall — the key battleground for the next move
- Liquidation clusters currently align with the corrective read, adding order-flow weight to the wave C thesis
Frequently asked questions
What is Ethereum's price right now?
As of late July 29, 2026, ETH is trading around $1,896–$1,900, per data from CoinMarketCap, Yahoo Finance, and CoinGecko.
What does 'wave C down' mean for Ethereum?
It means the recent bounce off the lows is being read as a corrective A-B-C pattern rather than a new bullish impulse. If wave C is live, price is expected to fall toward $1,857, with an extended target near $1,806.
Why does $1,930 matter so much for ETH?
$1,930 is the level that separates the bearish wave C count from the bullish alternate. A close above it invalidates the corrective read and opens the door to a retest of the $1,981 cycle high.
Why is this Elliott Wave count considered 'broken'?
The rally's wave structure violates two core Elliott Wave rules: wave three came out shorter than wave one, and wave two retraced more than 100% of wave one. Both are technically forbidden in a valid impulse, which shifts the read toward a corrective pattern instead.
Is this financial advice?
No. This is technical and Elliott Wave analysis for educational purposes only. Always do your own research and manage risk before trading.