
Forex Gurukul: What The Currency Market Really Is
The Forex Market, From Scratch
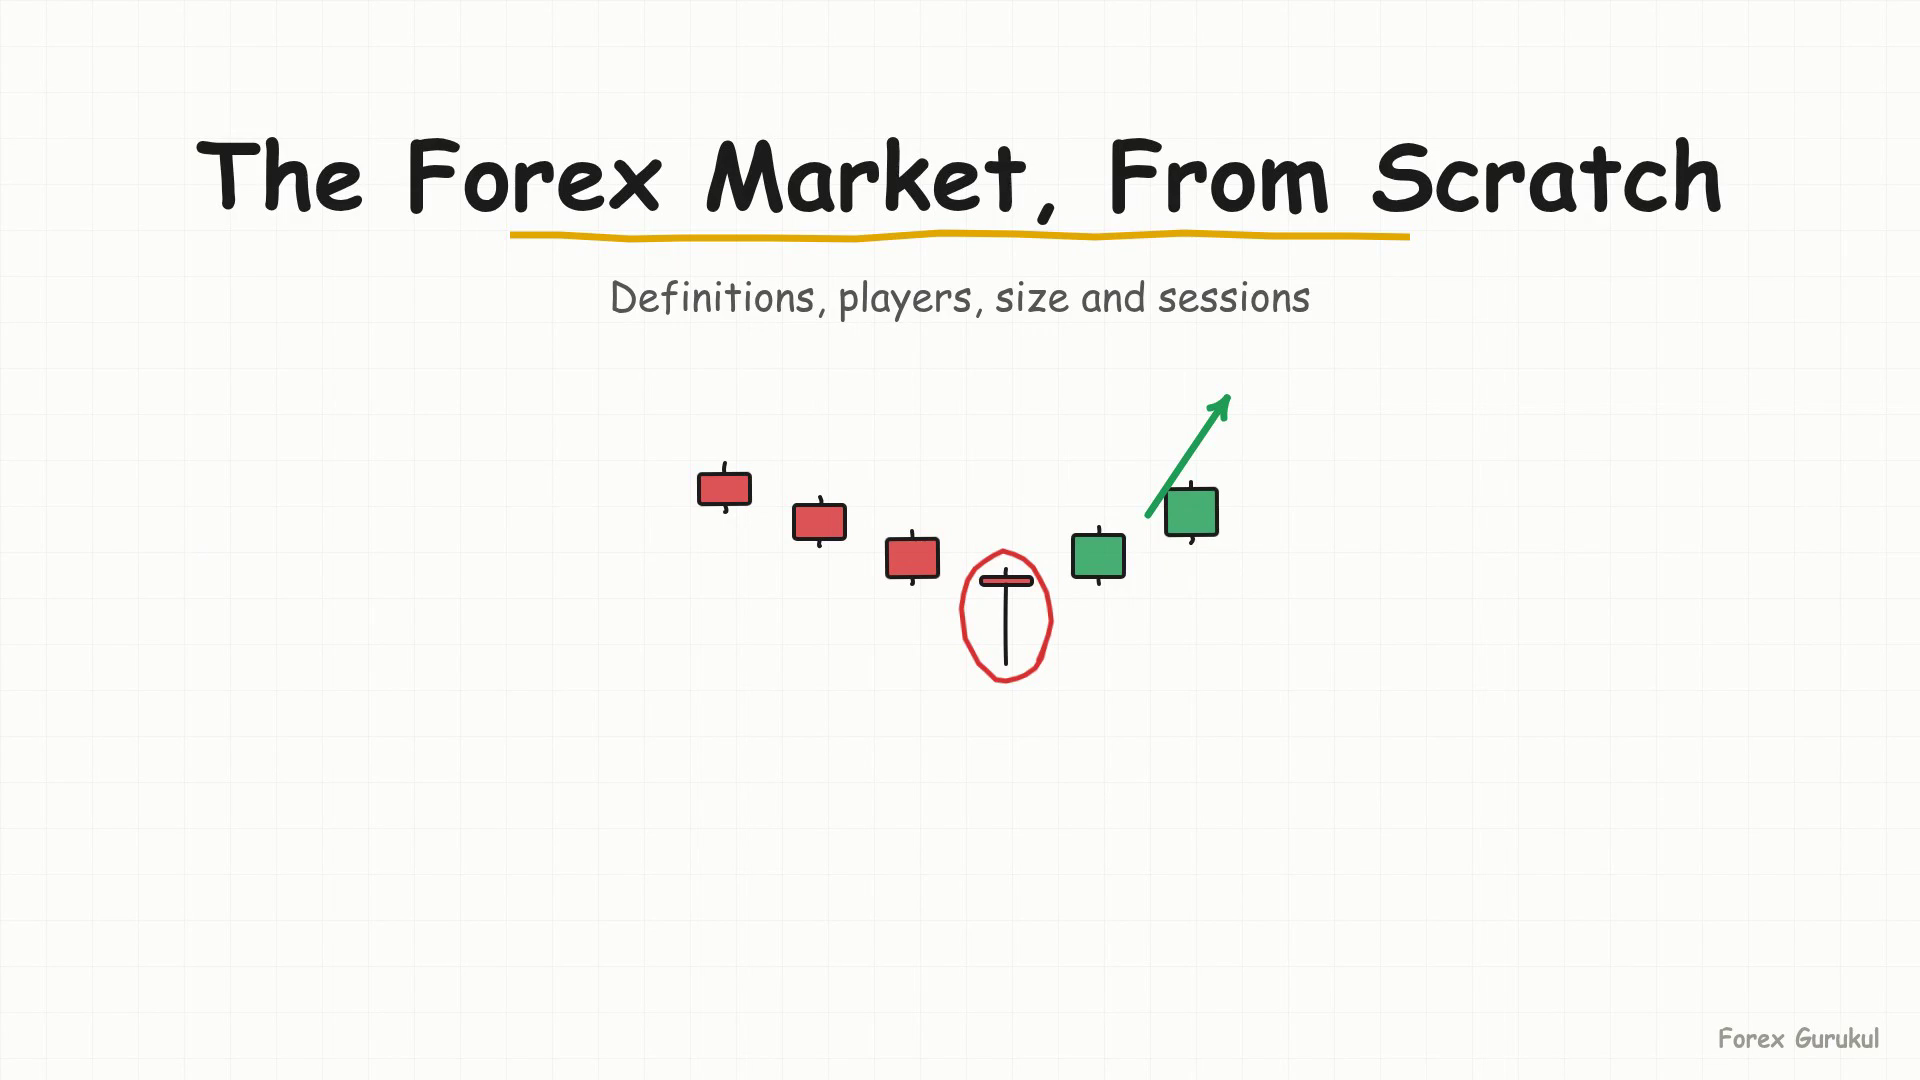
Welcome back to Forex Gurukul. Today we go right back to the foundation, because before you touch a chart, before you look at a single candle, you need to understand the room you are actually trading in.
This lesson is about the forex market itself: what it is, who is in it, why it moves, how big it actually is, and when it is open. Nothing here is a shortcut to profit. It is the ground floor everything else in this school gets built on.
What Is Forex, Really
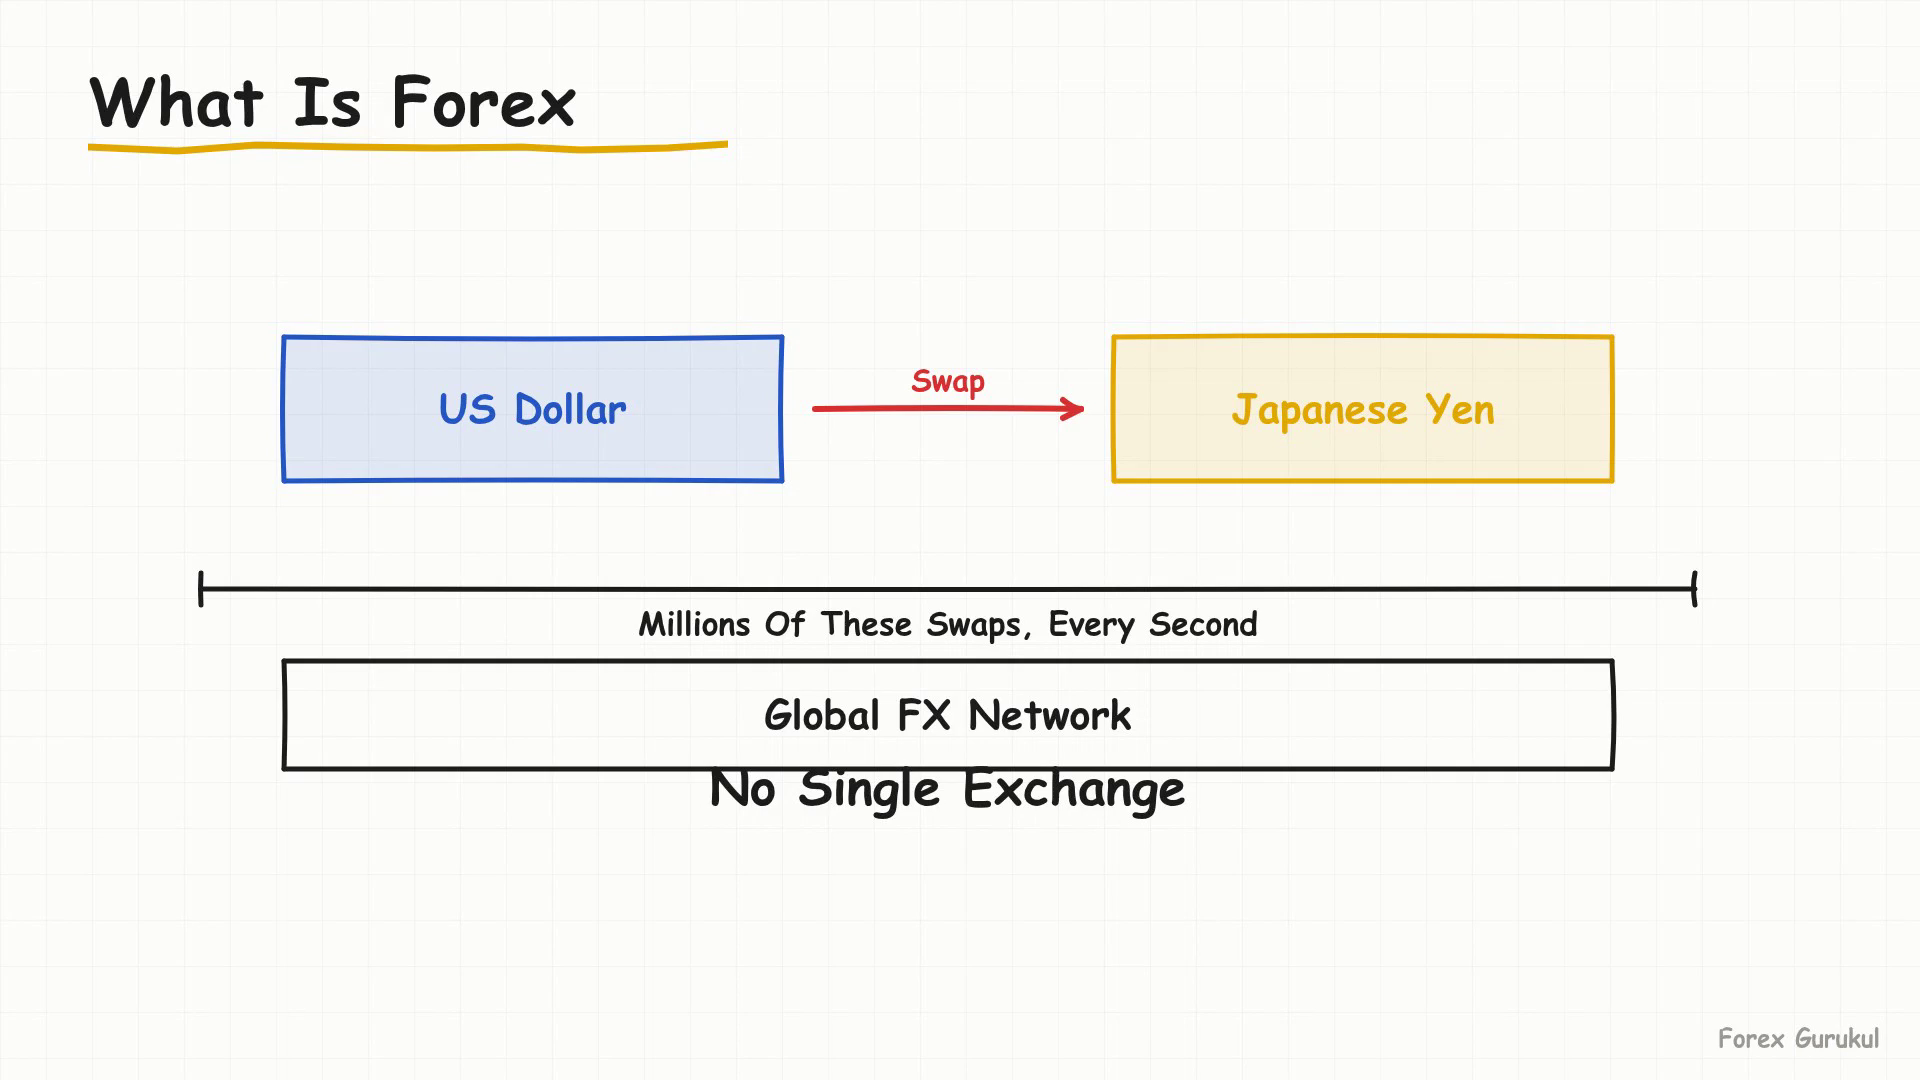
Forex, short for foreign exchange, is simply the global marketplace where one country's currency is traded for another. When a business in the United States needs euros to pay a supplier in Germany, or a bank in Tokyo wants to hold dollars instead of yen, that swap happens here.
Unlike the stock market, there is no single building, no central exchange floor where this happens. Instead, forex lives as a network — banks, brokers and trading desks all over the world, connected electronically, constantly quoting prices to each other.
Reading The Exchange Rate
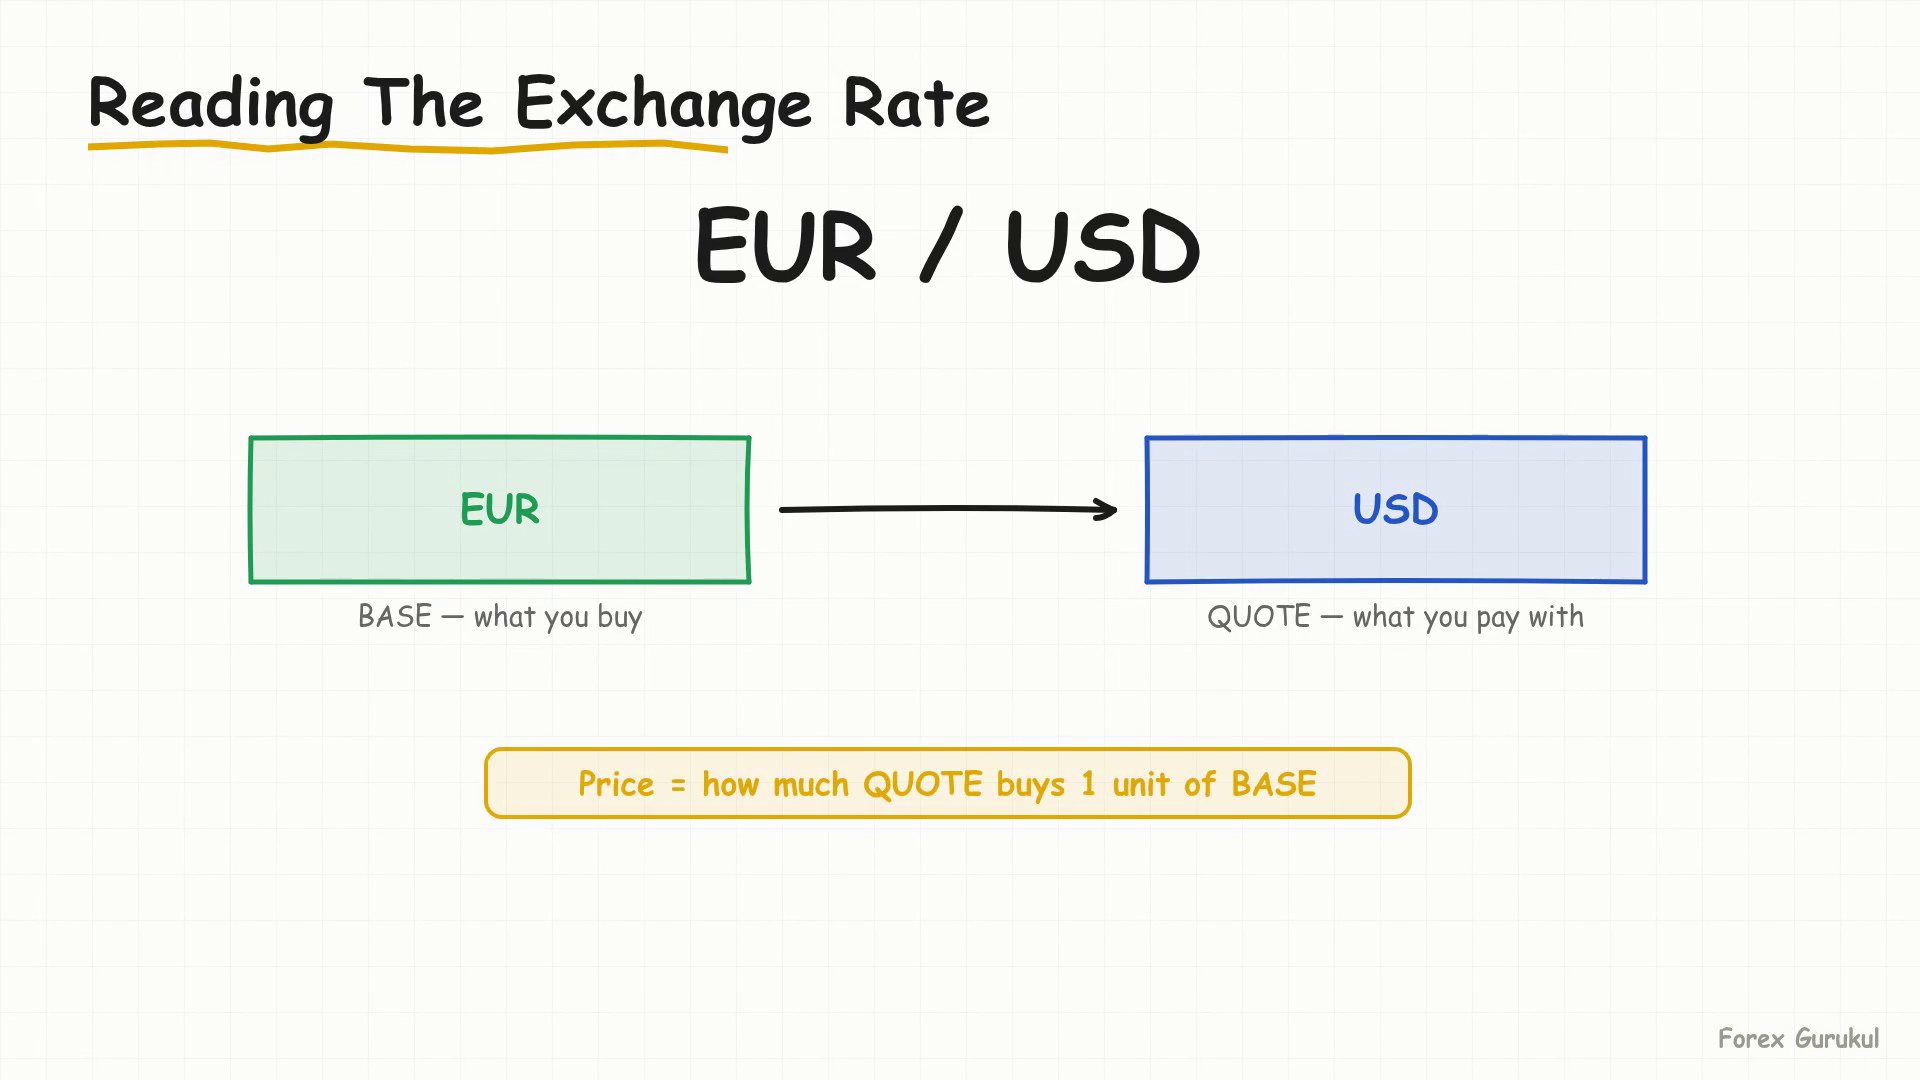
Every trade in this market is quoted as an exchange rate, and this idea is simpler than it sounds. An exchange rate is just the price of one currency measured in another.
Look at EUR/USD, the pair we watch live below. The first currency listed is the base, the second is the quote. As of July 28, 2026, EUR/USD was trading close to 1.1396 on Trading Economics' feed and around 1.1367 on the ECB's daily reference rate — meaning one euro costs roughly one dollar and thirteen to fourteen cents.
| Source | EUR/USD Rate (July 28, 2026) | Note |
|---|---|---|
| ECB Reference Rate | 1.1367 | Official daily fixing |
| Trading Economics (live feed) | 1.1396 | Up 0.25% on the session |
| OFX Historical Data | 1.1418 (July 27, 2026) | Prior day close for comparison |
Notice the wording — it costs. A currency by itself has no fixed value; it only has meaning relative to something else. That is why exchange rates move constantly: they are a live comparison of economic strength, interest rates and sentiment between two economies, never a value standing alone.
Who Moves This Market
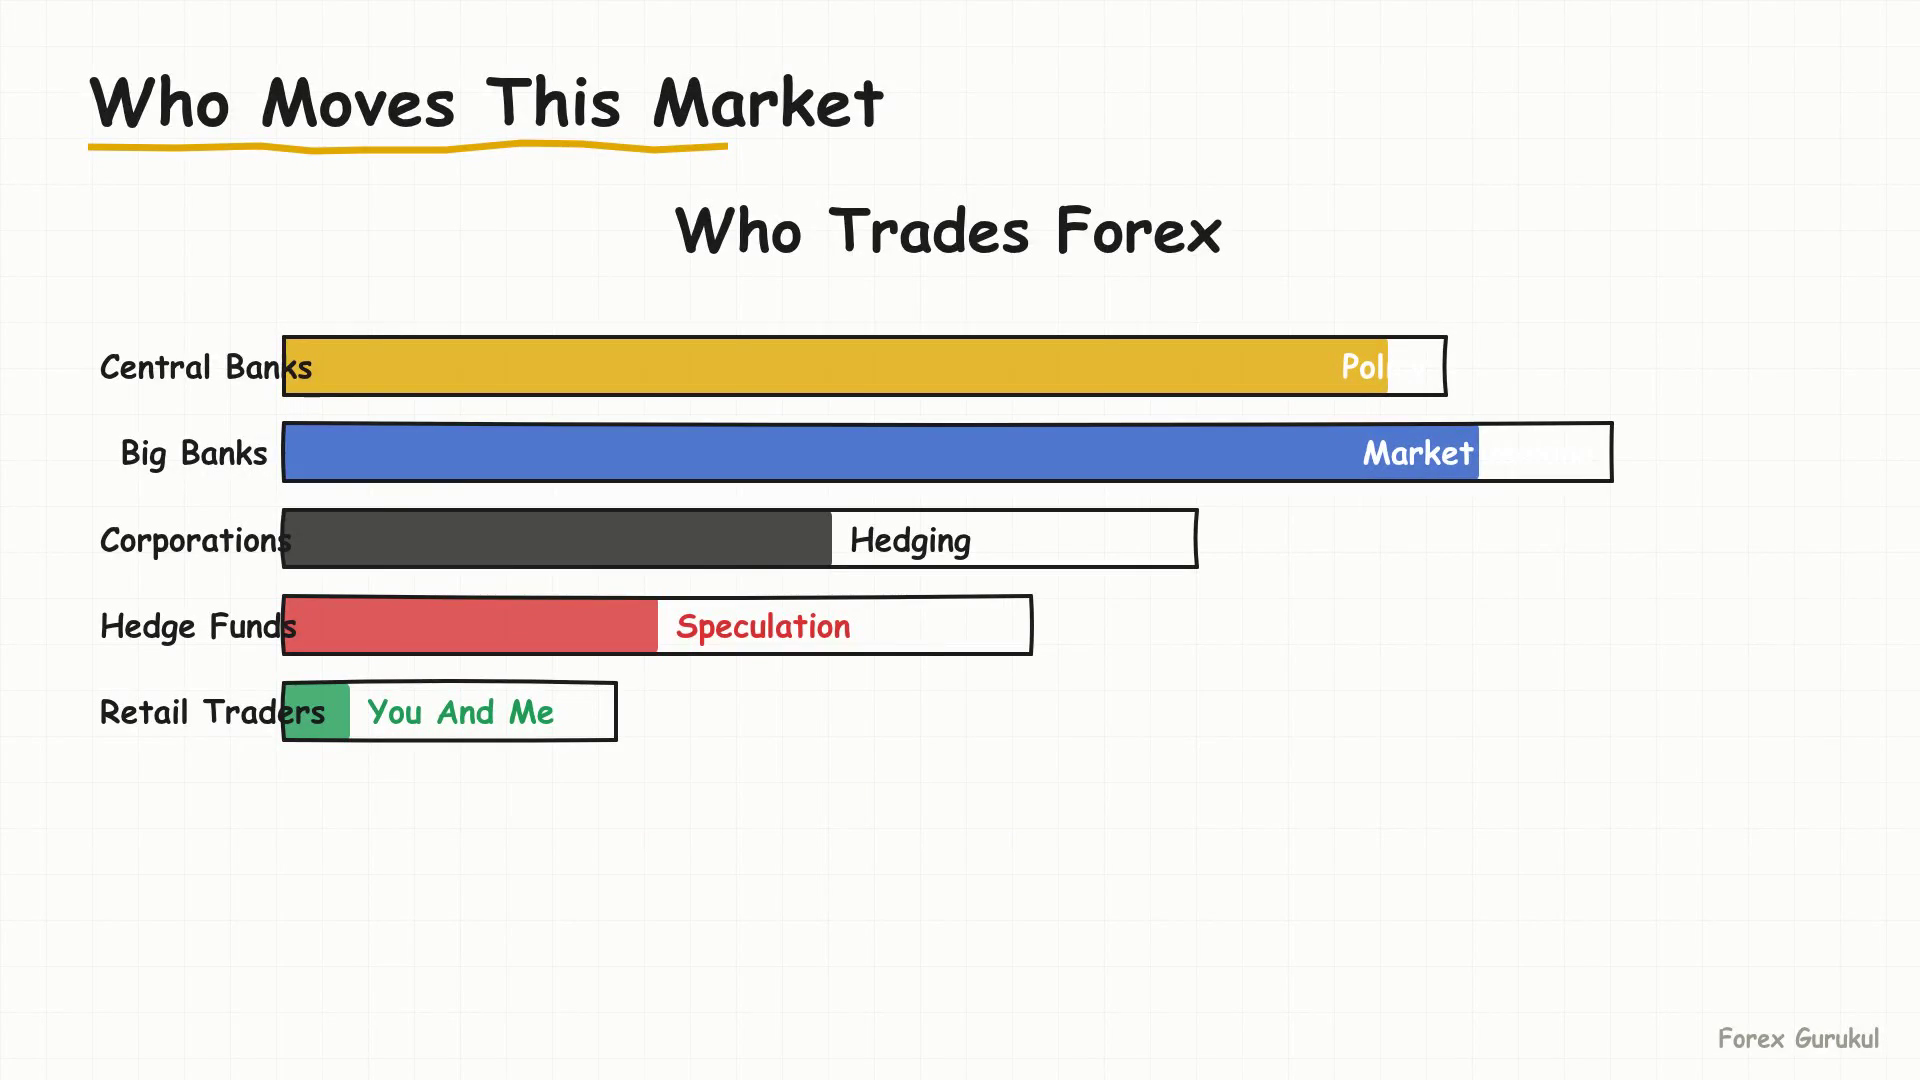
So who is actually behind these price changes? The market has a rough hierarchy of participants, each with a different reason for being there.
- Central banks (Federal Reserve, ECB, etc.) — do not trade for profit; they move interest rates and intervene to manage inflation and currency strength. When they speak, the whole market listens.
- Large commercial and investment banks — the market makers, quoting bid and ask prices to everyone else and handling enormous client flow.
- Corporations — an airline buying fuel overseas or a manufacturer paying foreign suppliers; this is hedging, not speculation, they trade forex simply to run their business.
- Hedge funds and institutional traders — take directional bets on macro trends, interest rate differences and geopolitical shifts.
- Retail traders — individuals like you and me, trading through a broker, far smaller in size but plugged into the exact same live price feed as everyone above.
Why Price Really Moves
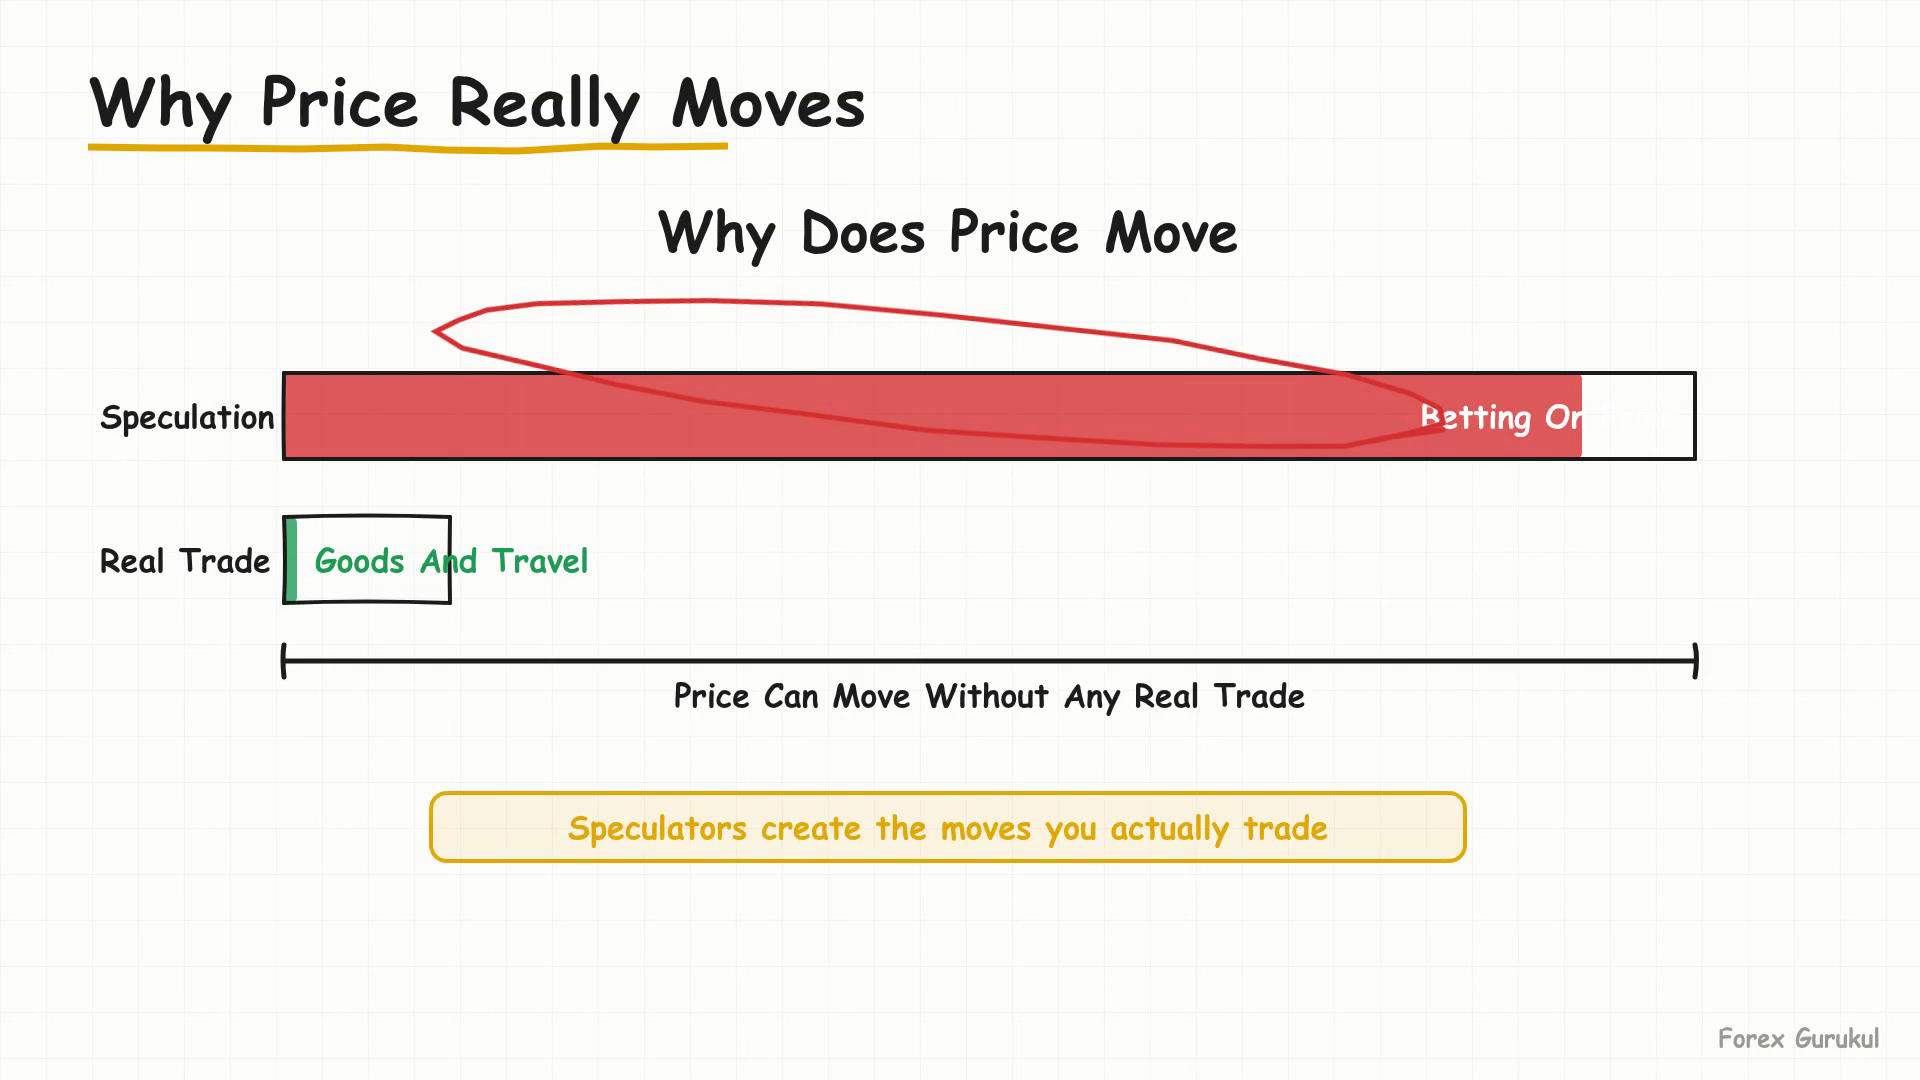
Here is something that surprises new traders. If most of the volume in this market was corporations paying invoices or tourists exchanging money for a vacation, price would barely move — real trade volume is actually a small slice of the pie.
The overwhelming majority of daily turnover, most serious estimates put it well above ninety percent, comes from pure speculation — funds, banks and traders positioning on where they believe price is heading next, with no underlying shipment of goods or airline ticket behind the trade at all.
How Big Is This Market
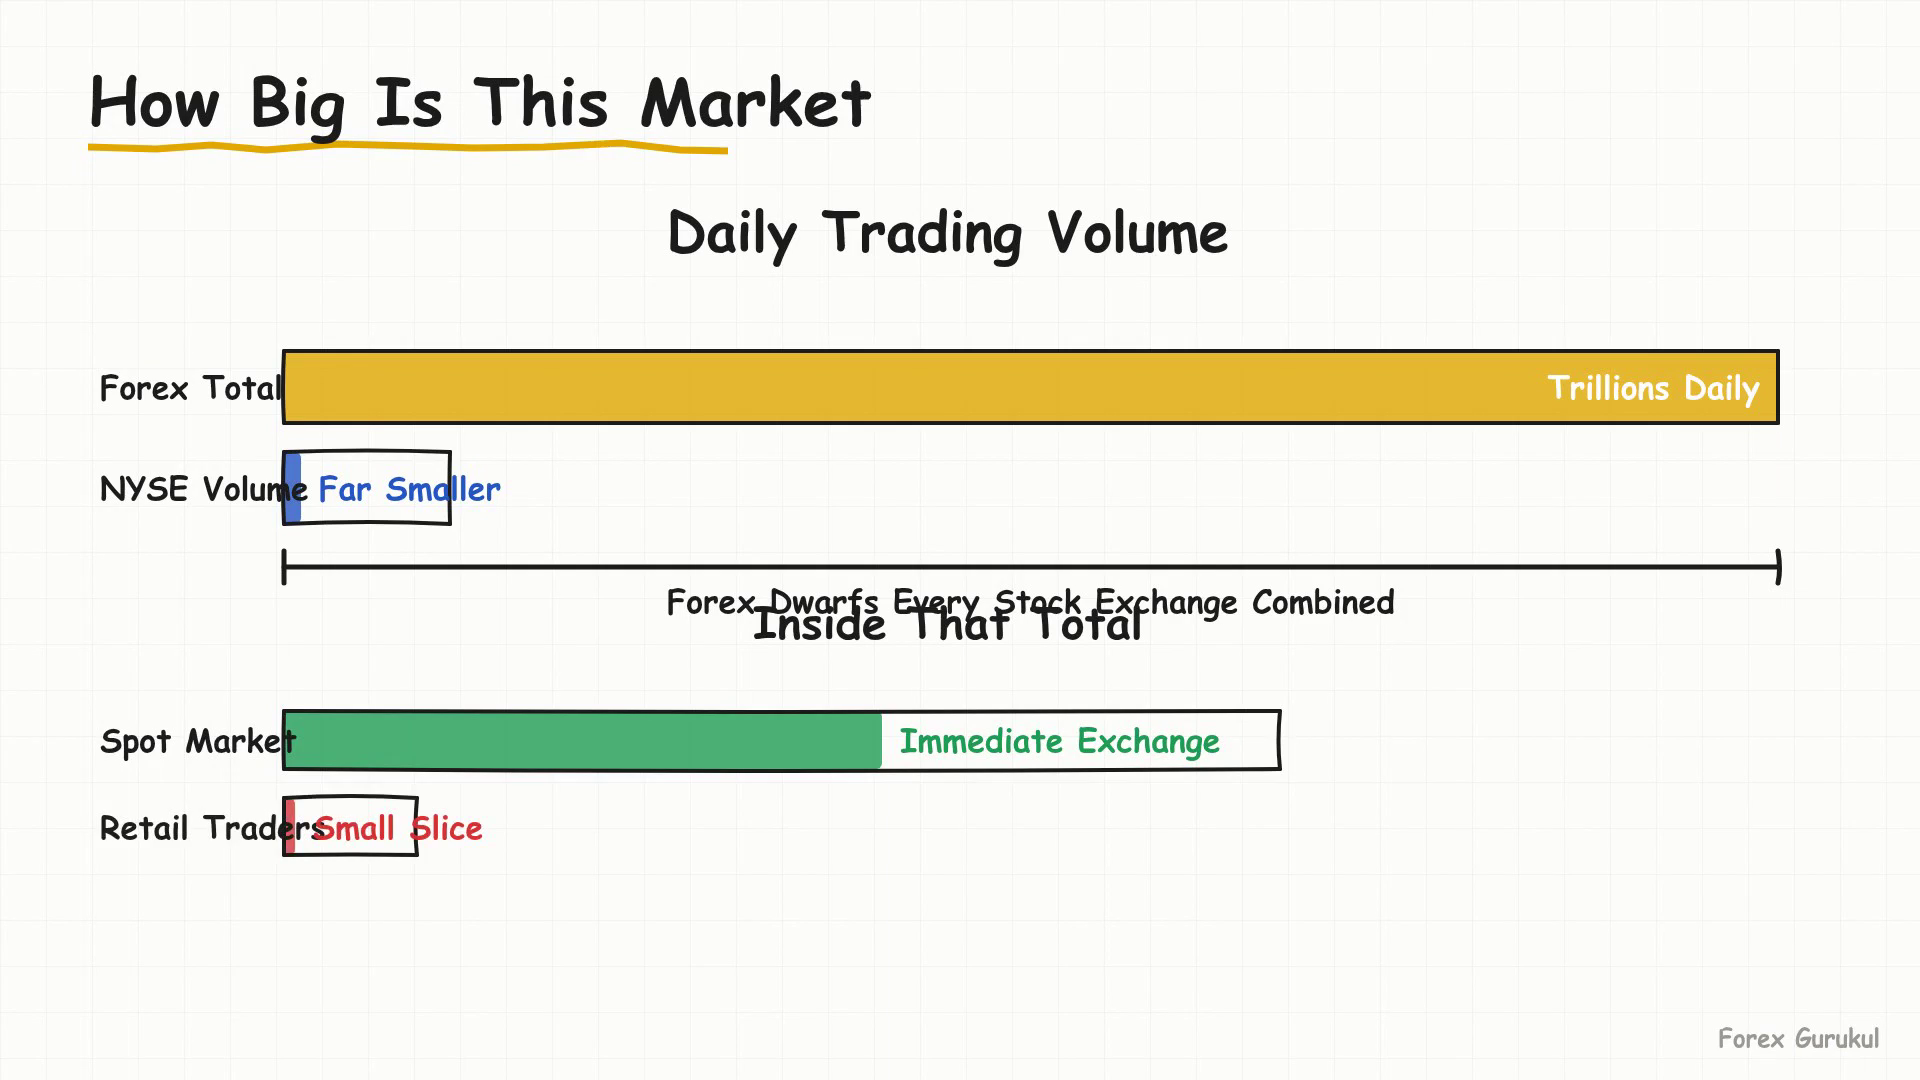
Forex is the largest financial market in the world by a wide margin. The most authoritative source here is the Bank for International Settlements' Triennial Central Bank Survey. The April 2025 survey put global daily FX turnover at approximately $9.6 trillion, a roughly 28% jump from the 2022 survey.
| Market Segment | Daily Turnover (April 2025) | Share of Total |
|---|---|---|
| Total FX market | ≈ $9.6 trillion | 100% |
| FX spot market | ≈ $3 trillion | 31% (up from 28% in 2022) |
| Forwards, swaps & other instruments | Remainder | ~69%, mostly institutional hedging |
To put that in perspective, that figure dwarfs the combined daily volume of every stock exchange on earth, including the New York Stock Exchange. Inside that enormous number, the spot market, meaning currencies exchanged for near-immediate delivery, makes up the largest single slice by instrument type.
Retail traders — the individual accounts like yours — represent a comparatively small percentage of that total volume, but that slice has grown steadily every year as more people trade from home through online brokers.
The Market Never Sleeps
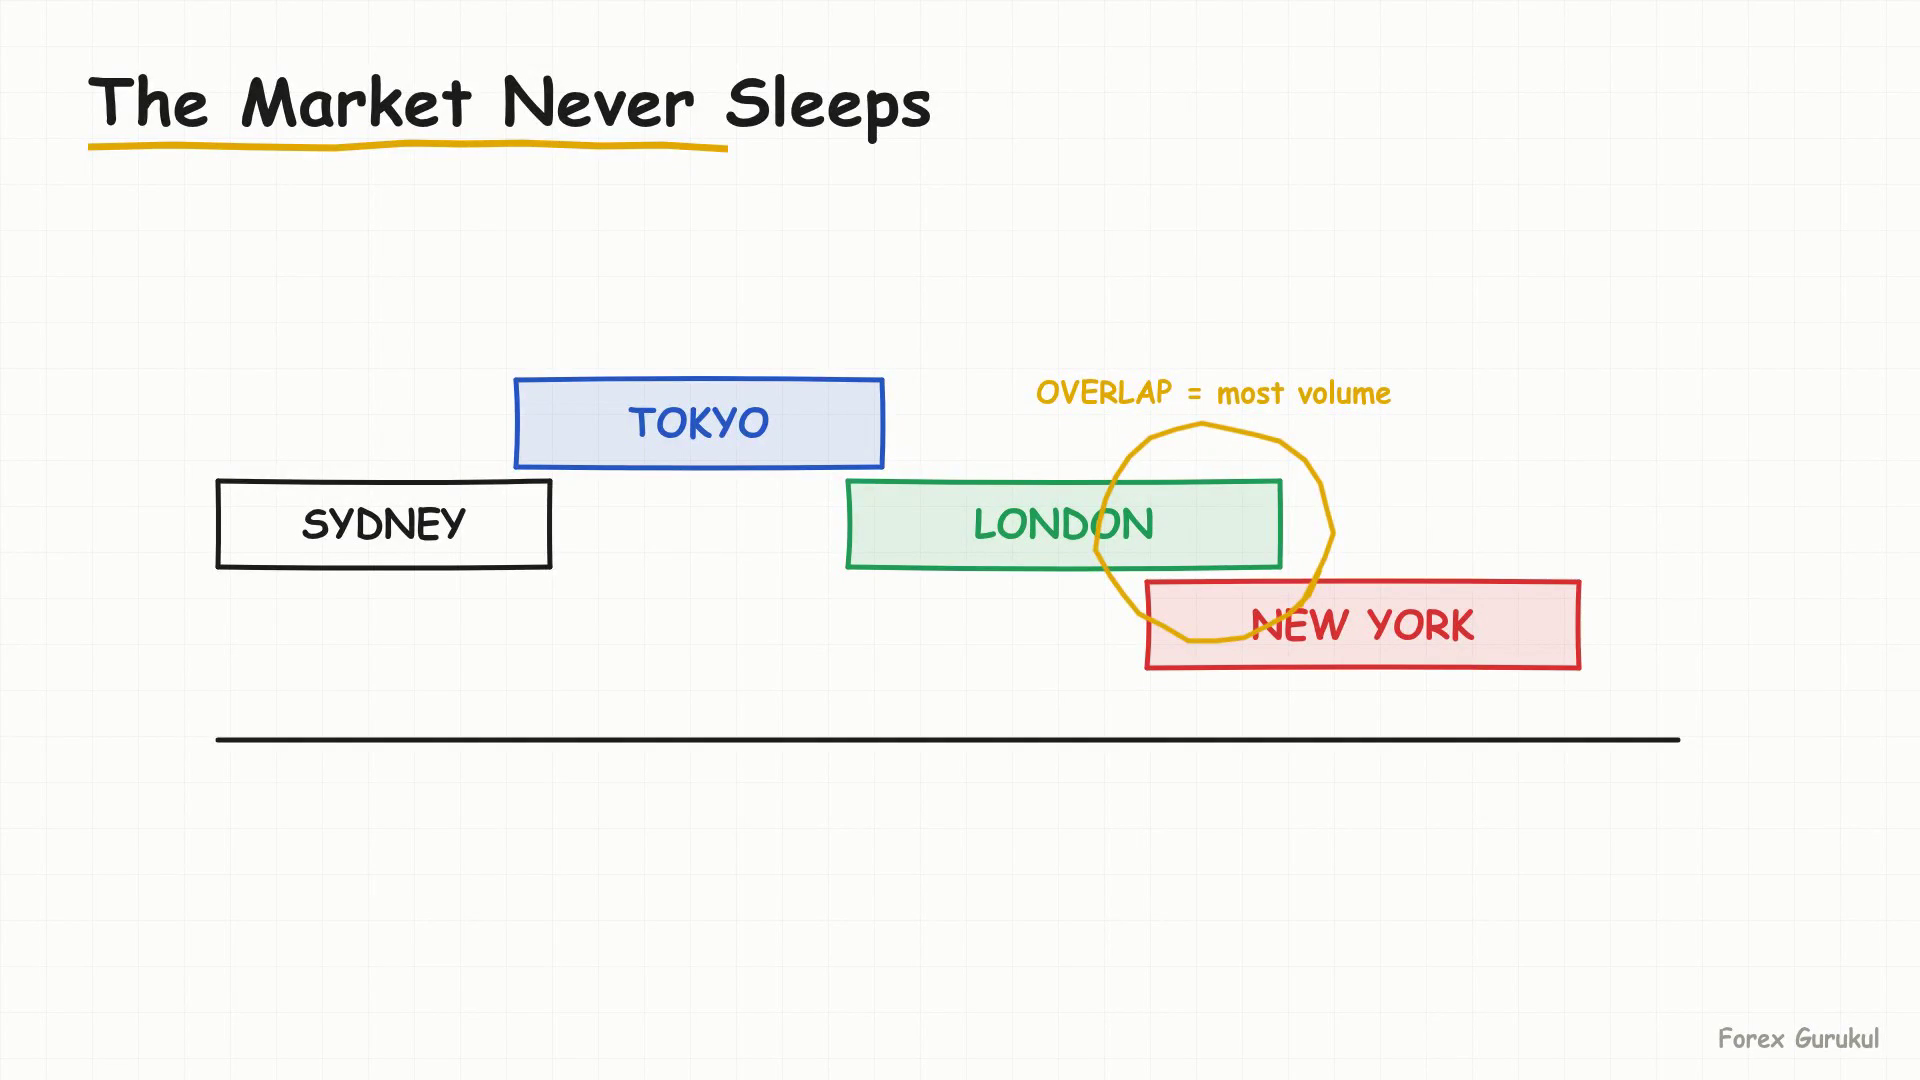
One more structural fact before we get to a live chart. Forex never closes for the day the way a stock exchange does in the afternoon. Because trading desks operate around the planet, one financial center opens as another is winding down.
| Session | Character | Rough Overlap |
|---|---|---|
| Sydney → Tokyo | Quieter, range-bound | Opens the trading day |
| Tokyo → London | Volume begins to build | Handoff period |
| London | Strong pickup in volume | Most liquid European hours |
| London / New York overlap | Sharpest, most tradeable moves | ≈ 8–11 AM Eastern Time |
That gives you a market that is live twenty-four hours a day, five days a week. But do not confuse open with equally active — each session has its own personality, and the London/New York overlap is usually where two of the largest financial centers being live at the same moment produces the day's biggest moves.
Session-Open Momentum Candle
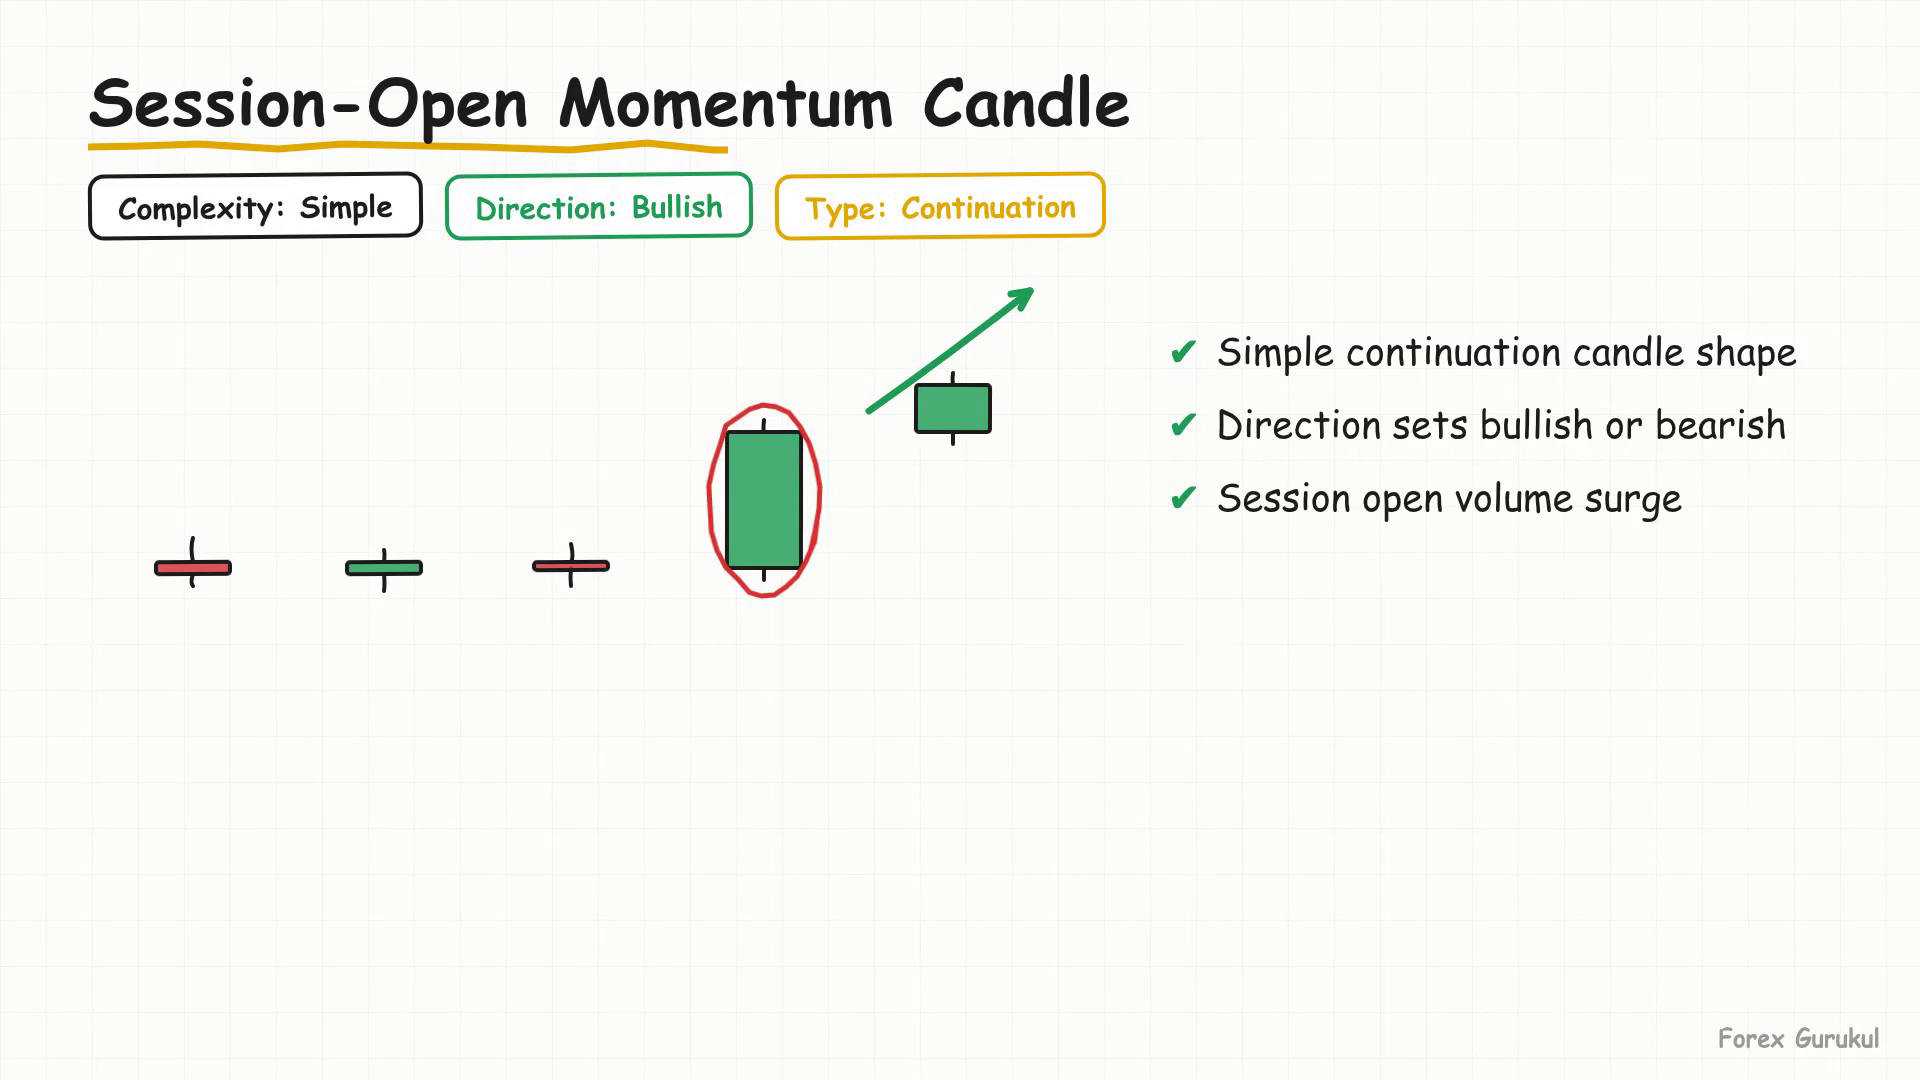
Let us connect all of this to something you can actually trade. When a new session opens, especially London or New York, you will often see a strong, wide-range candle print almost immediately — we call this a momentum candle.
Classify it out loud every time you see one. It is a simple pattern, a single candle, not a multi-bar formation, and it is a continuation type, meaning it tends to push further in the direction it already broke, bullish or bearish depending on which way that candle closed.
Euro / Dollar — Live Session Watch
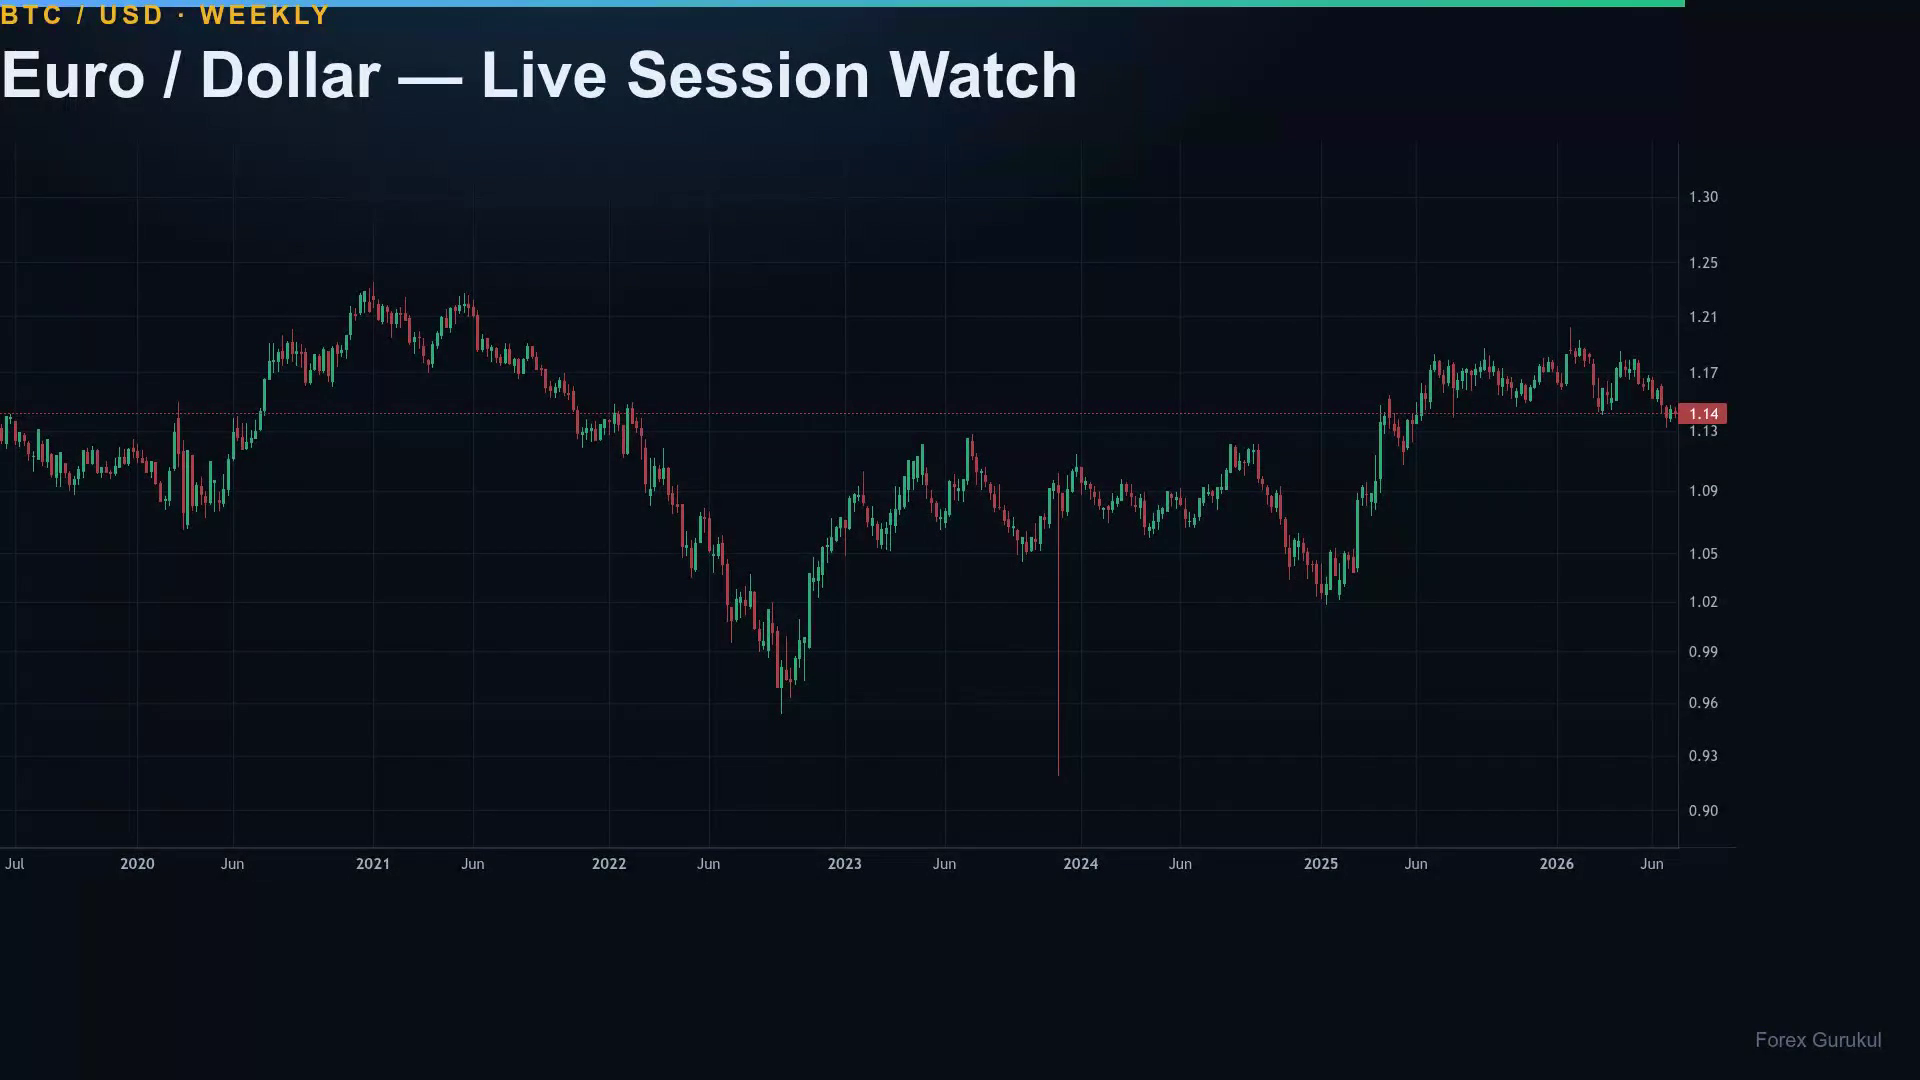
As of July 28, 2026, EUR/USD sits around the 1.13–1.14 handle, with the ECB's official reference at 1.1367 and live trading feeds showing it as high as 1.1396–1.1418 depending on the exact snapshot and time of day.
This is exactly the kind of pair where the concepts above stack together: it is the most heavily traded currency pair on earth, it is dollar-based (so central bank commentary from either the Fed or the ECB moves it instantly), and its sharpest candles routinely appear right at the London/New York overlap window discussed earlier.
Watch it live through a session open and you will usually catch at least one clean momentum candle worth classifying — that is the practical bridge between today's theory and tomorrow's chart work.
Where New Traders Go Wrong
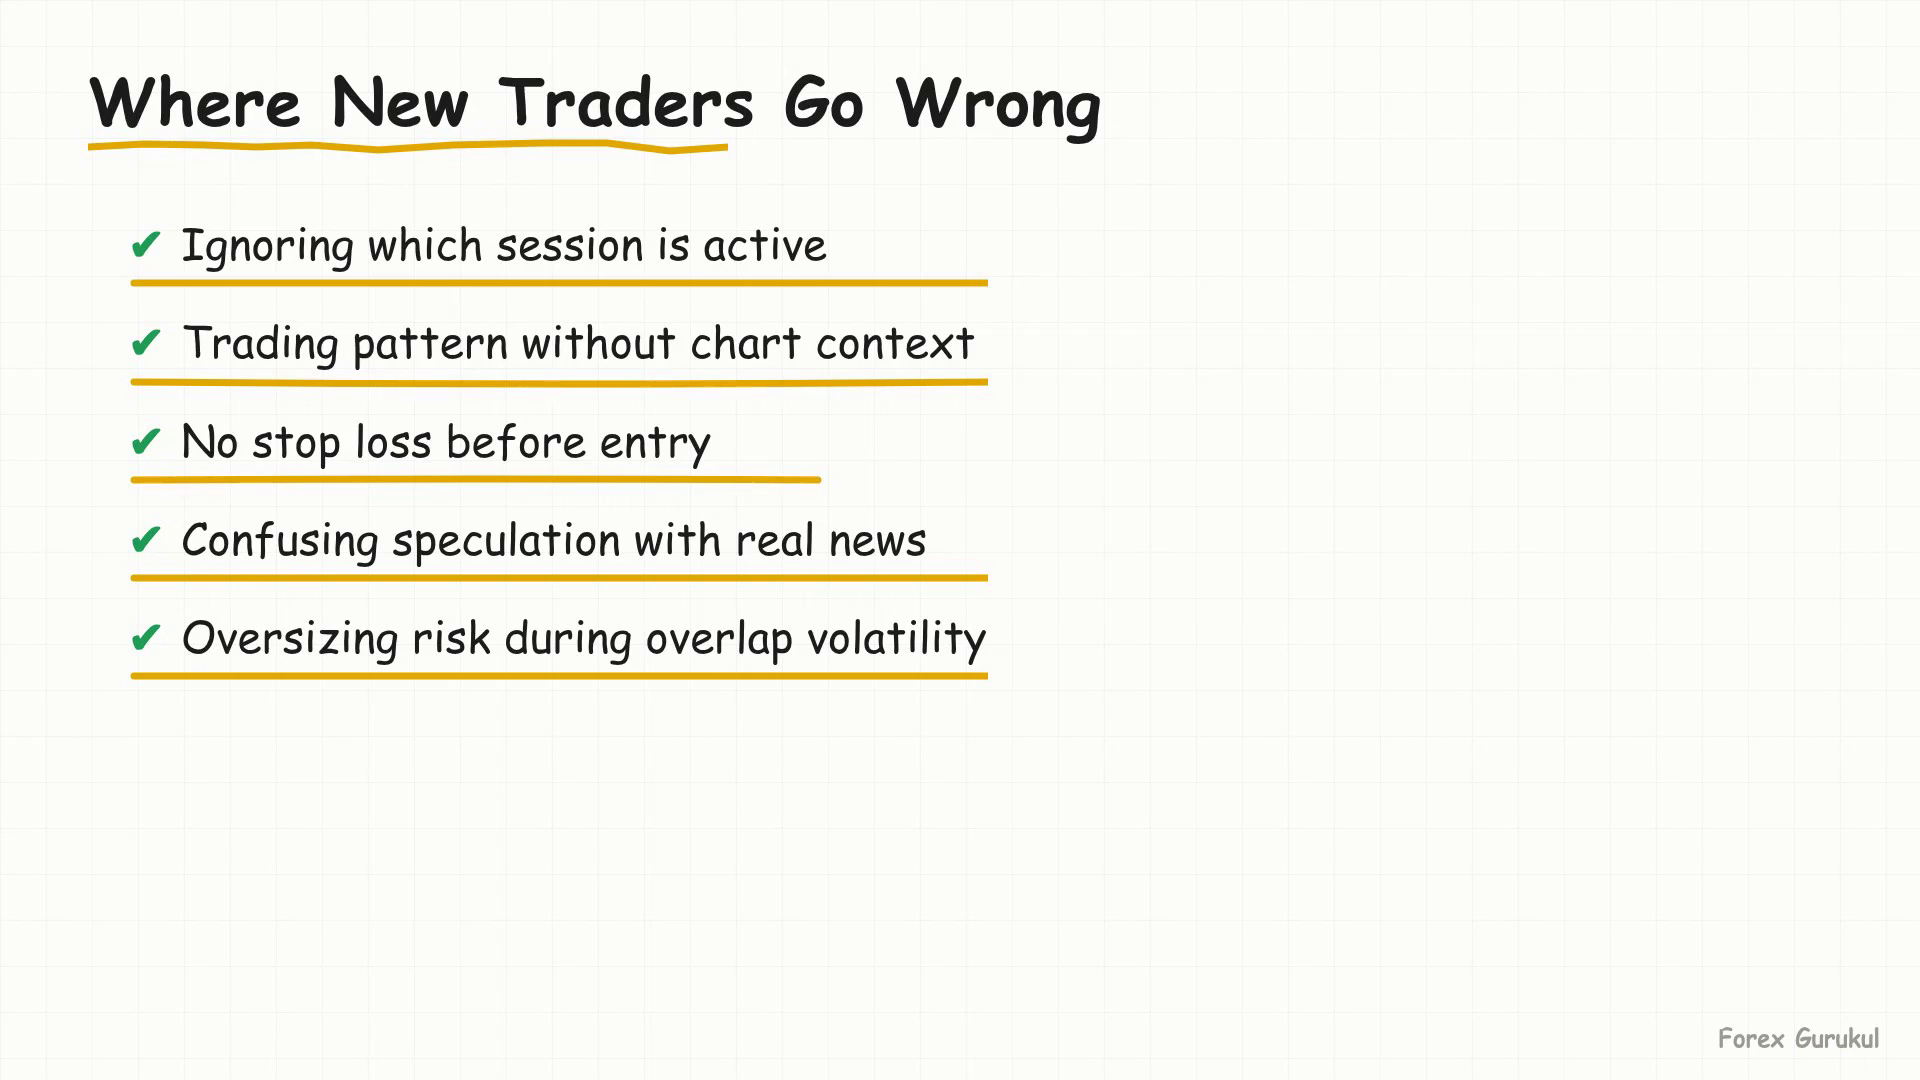
Most beginners skip everything above and jump straight to indicators and entry signals. That is backwards. If you do not know that over 90% of volume is speculative, you will panic every time price whips against a level for no visible reason — when in reality that is just the market's default behaviour, not an anomaly.
- Trading every session equally, instead of concentrating effort around London/New York overlap when liquidity and movement are highest.
- Treating a momentum candle as a signal on its own, without asking whether it printed at a session open or in the middle of a dead zone.
- Forgetting that a currency pair's price is a relative comparison — chasing EUR/USD strength without checking what the dollar side of the pair is doing on the DXY or in Fed commentary.
- Assuming retail order flow moves the market, when banks, funds and central banks dwarf retail volume by a wide margin.
Today's Core Ideas
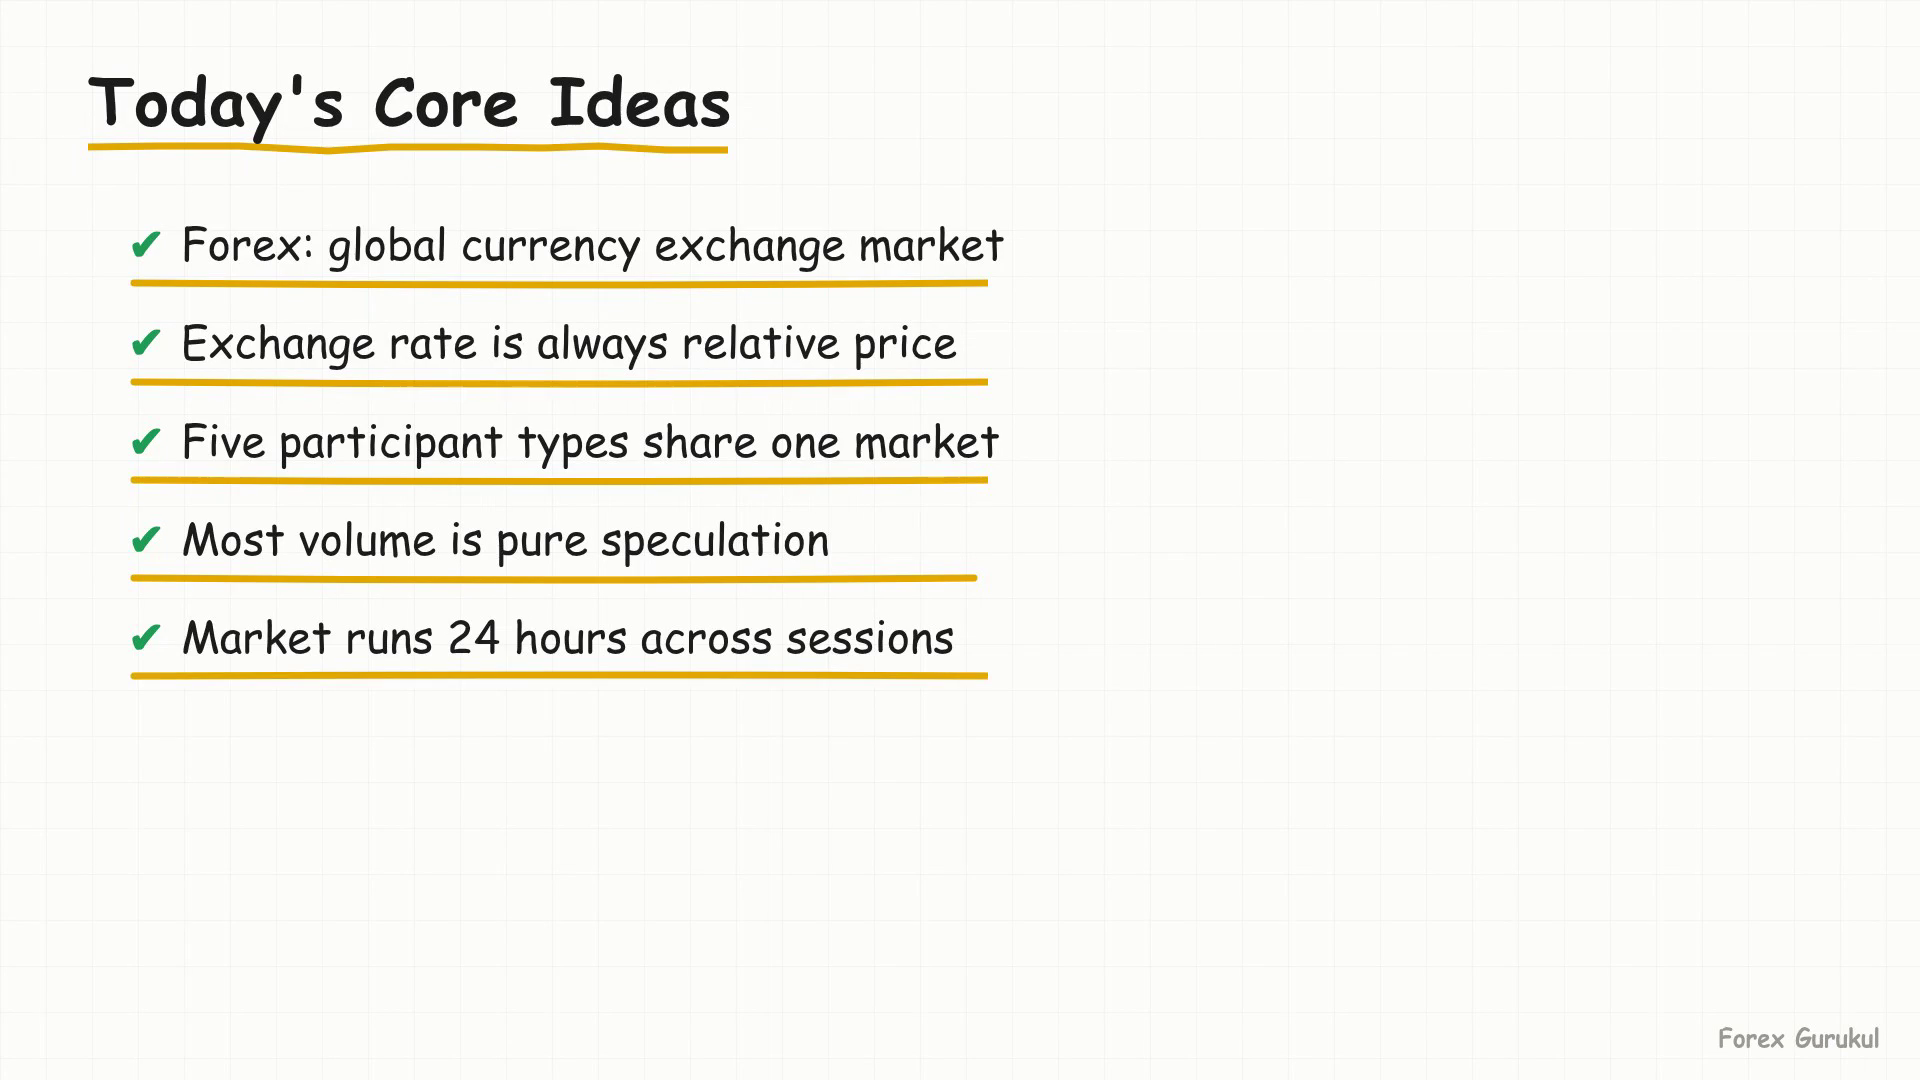
Forex is not a building or an app — it is a decentralized, 24-hour global network where banks, funds, corporations and retail traders quote and trade currency pairs against each other, dominated by speculative positioning rather than real trade flow.
- An exchange rate is always relative — it tells you what one currency costs in terms of another, never a standalone value.
- Speculators, not invoice-payers, drive the vast majority of daily price movement.
- Global daily FX turnover is around $9.6 trillion, according to the BIS 2025 Triennial Survey — larger than every stock exchange on earth combined.
- The market rotates through Sydney, Tokyo, London and New York with no daily close, but the London/New York overlap is where the sharpest moves tend to happen.
- A session-open momentum candle is a useful continuation signal only when you respect its context — timing and location matter more than the candle shape itself.
Key takeaways
- Forex has no central exchange — it's a 24-hour electronic network of banks, brokers and traders quoting currency pairs against each other.
- Over 90% of daily volume is speculative positioning, not real trade or tourism — which is why price can move sharply with no economic event behind it.
- Global daily FX turnover hit roughly $9.6 trillion in the BIS's April 2025 survey, dwarfing every stock exchange combined.
- The London/New York overlap (roughly 8–11 AM ET) is consistently the most liquid, most tradeable window of the trading day.
- A session-open momentum candle only means something in context — the same candle shape behaves differently at a session open than in a quiet range.
Frequently asked questions
What exactly is the forex market?
It's the decentralized global marketplace where currencies are exchanged, involving central banks, commercial banks, corporations, hedge funds and retail traders, all connected electronically with no single physical exchange.
How big is the forex market compared to the stock market?
The BIS's April 2025 Triennial Survey puts global daily FX turnover at approximately $9.6 trillion — far larger than the combined daily volume of every stock exchange in the world, including the NYSE.
Why does the EUR/USD rate keep changing?
An exchange rate is a relative comparison between two economies' strength, interest rates and sentiment — it never reflects a fixed value, so it moves constantly as expectations shift on either side of the pair.
When is the best time to trade forex?
The market is open 24 hours, five days a week, but the London/New York overlap (roughly 8–11 AM Eastern Time) typically sees the highest liquidity and the sharpest, most tradeable price moves.
Is most forex trading driven by real businesses paying for goods?
No — real trade and hedging represent a small share of total volume. The vast majority, often cited as over 90%, comes from pure speculative positioning by funds, banks and traders.