
Funding Rate & Doji: Why Your BTCUSD Long Bleeds Money
The $300 Overnight Bleed: A Long That Never Got Hit
Jordan held a leveraged Bitcoin long overnight. By morning his account was down three hundred dollars — and price hadn't moved against him. No crash. No stop hit. Something quieter drained the account while he slept: the funding rate, a cost most beginners never think to check. Stack that on top of a warning candle he scrolled straight past, and you get one blown-up trade caused by two missed signals, not one.
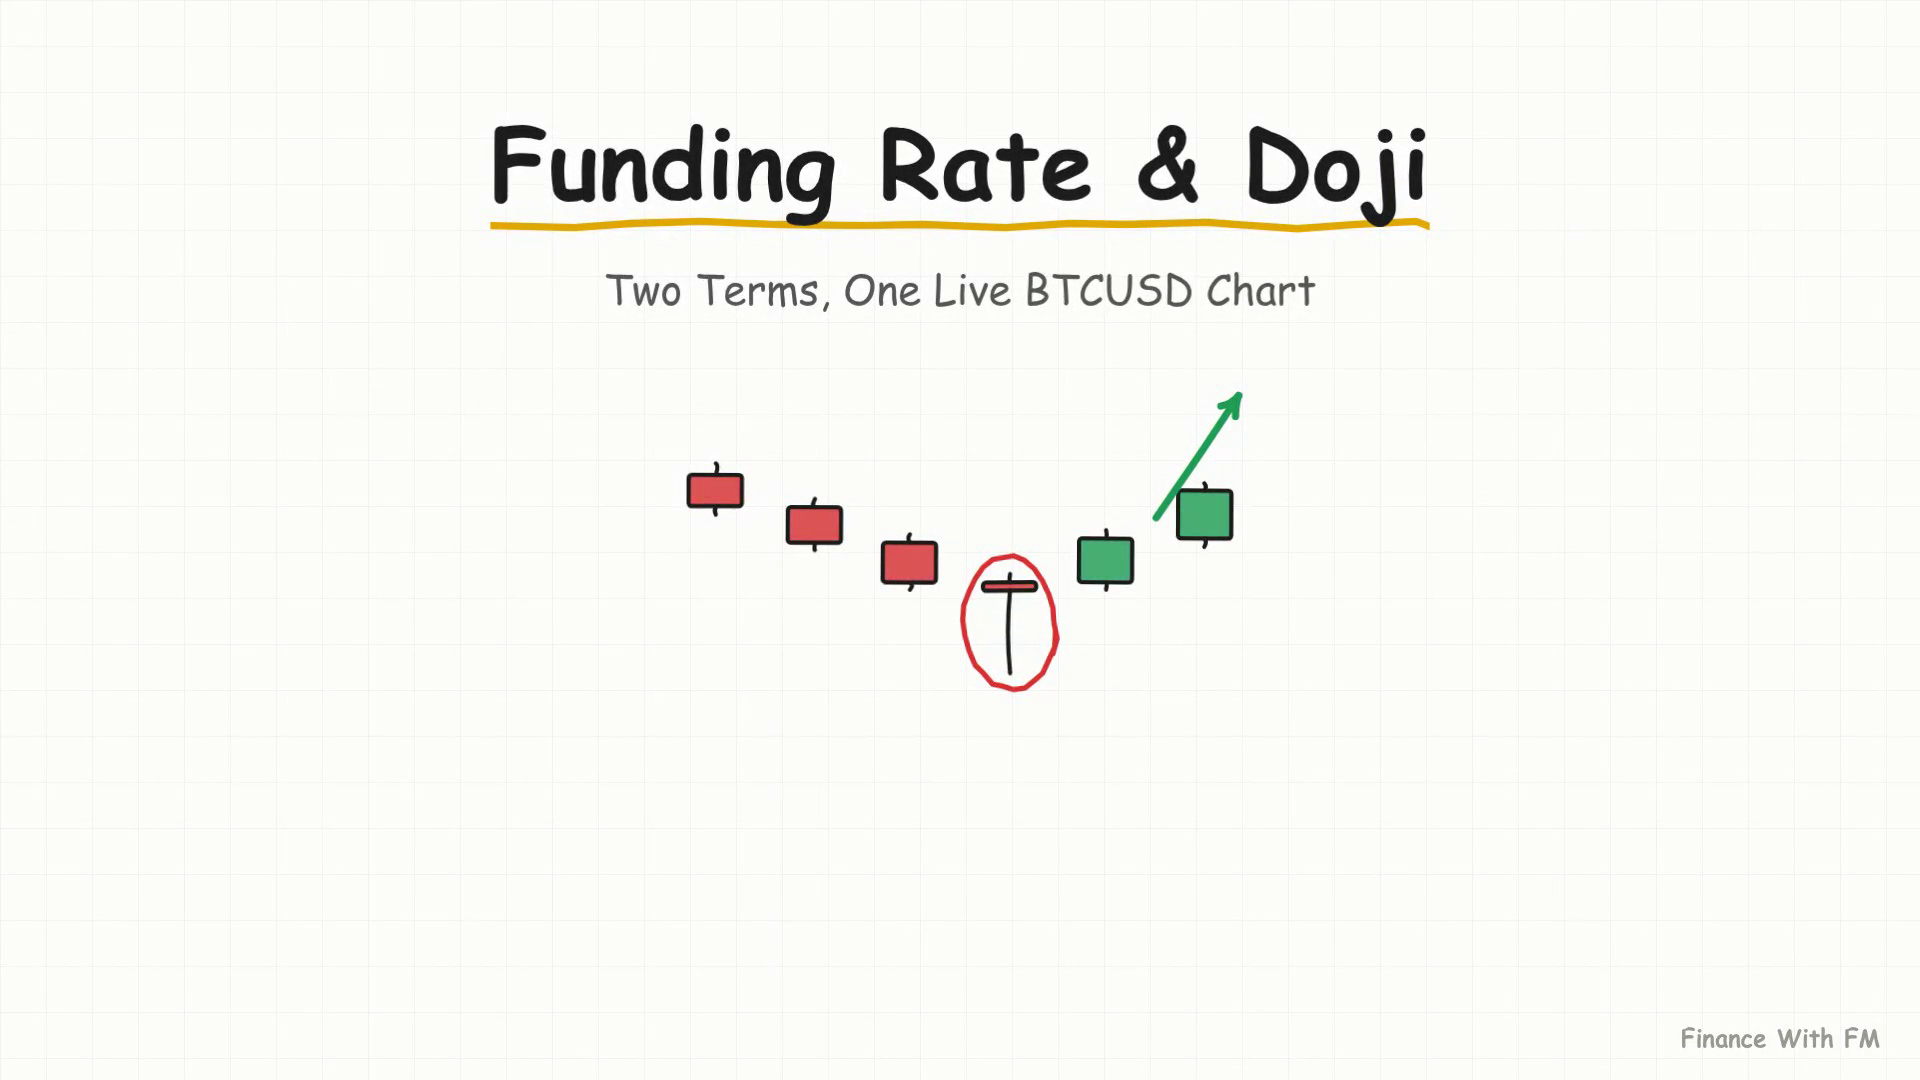
This piece is the written companion to that story. Two terms every trader needs on their radar — funding rate and the doji candle — then we hunt both on today's real Bitcoin chart, dated July 27, 2026. No fluff, just the mechanics, the levels, and the stop that would have saved him.
What Is Funding Rate — And Why Crowded Longs Pay The Price
Funding rate is the fee perpetual futures traders pay each other every few hours to keep the contract price tied to spot price. When more traders are long than short, longs pay shorts, and the number turns positive. Deeply positive funding means the market is crowded with leverage on one side of the trade.
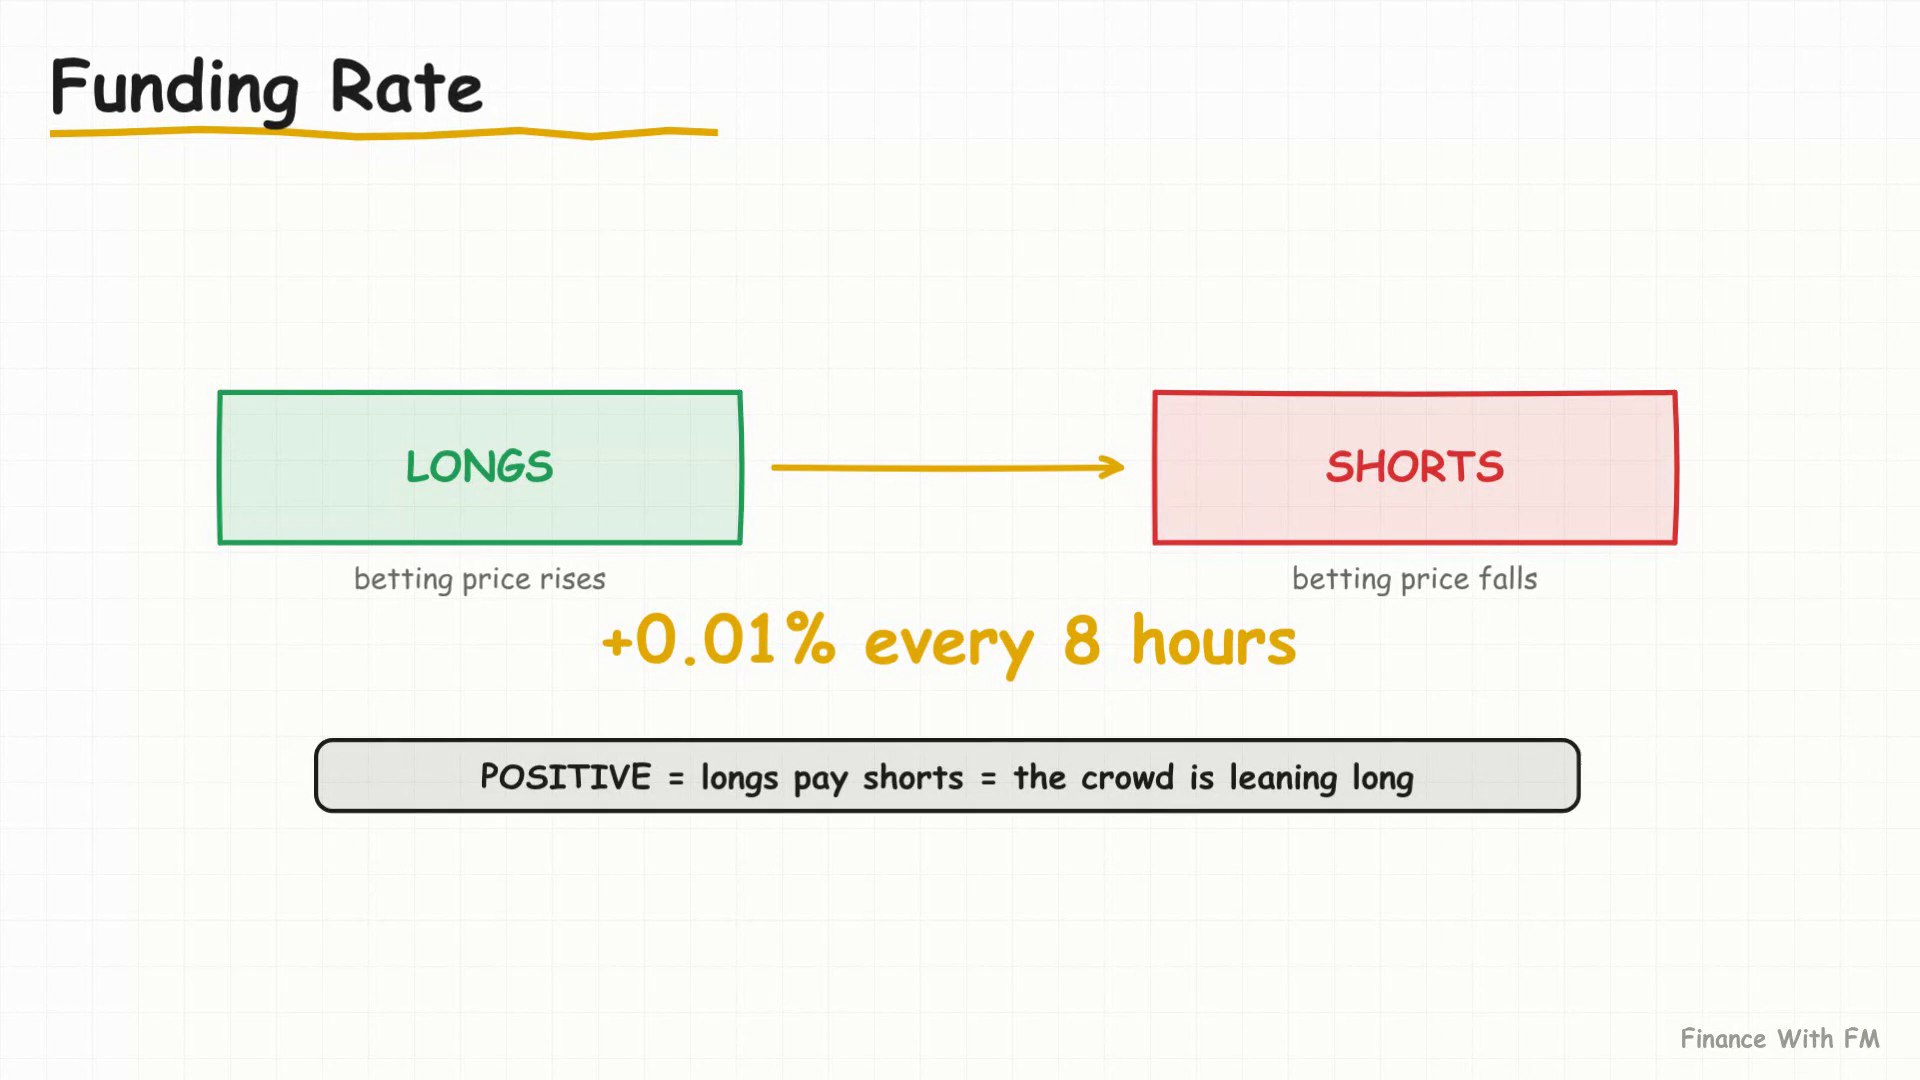
- Checked on your exchange's futures page, not on the candle chart — it updates every few hours.
- Crowded positioning is fragile: one stalling candle can trigger a cascade of stop-outs.
- It's a filter, not a standalone signal — rising positive funding plus a stalling price means tighten your stop, not automatically flip short.
- Check funding before you add size, not after your account has already bled for it.
The Funding Squeeze Frame: A Plan For Crowded Markets
Here's the exact frame Jordan should have used. He's long, funding is deeply positive (meaning he pays to hold), and price stops climbing. That combination is the setup — here's how to act on it without guessing.
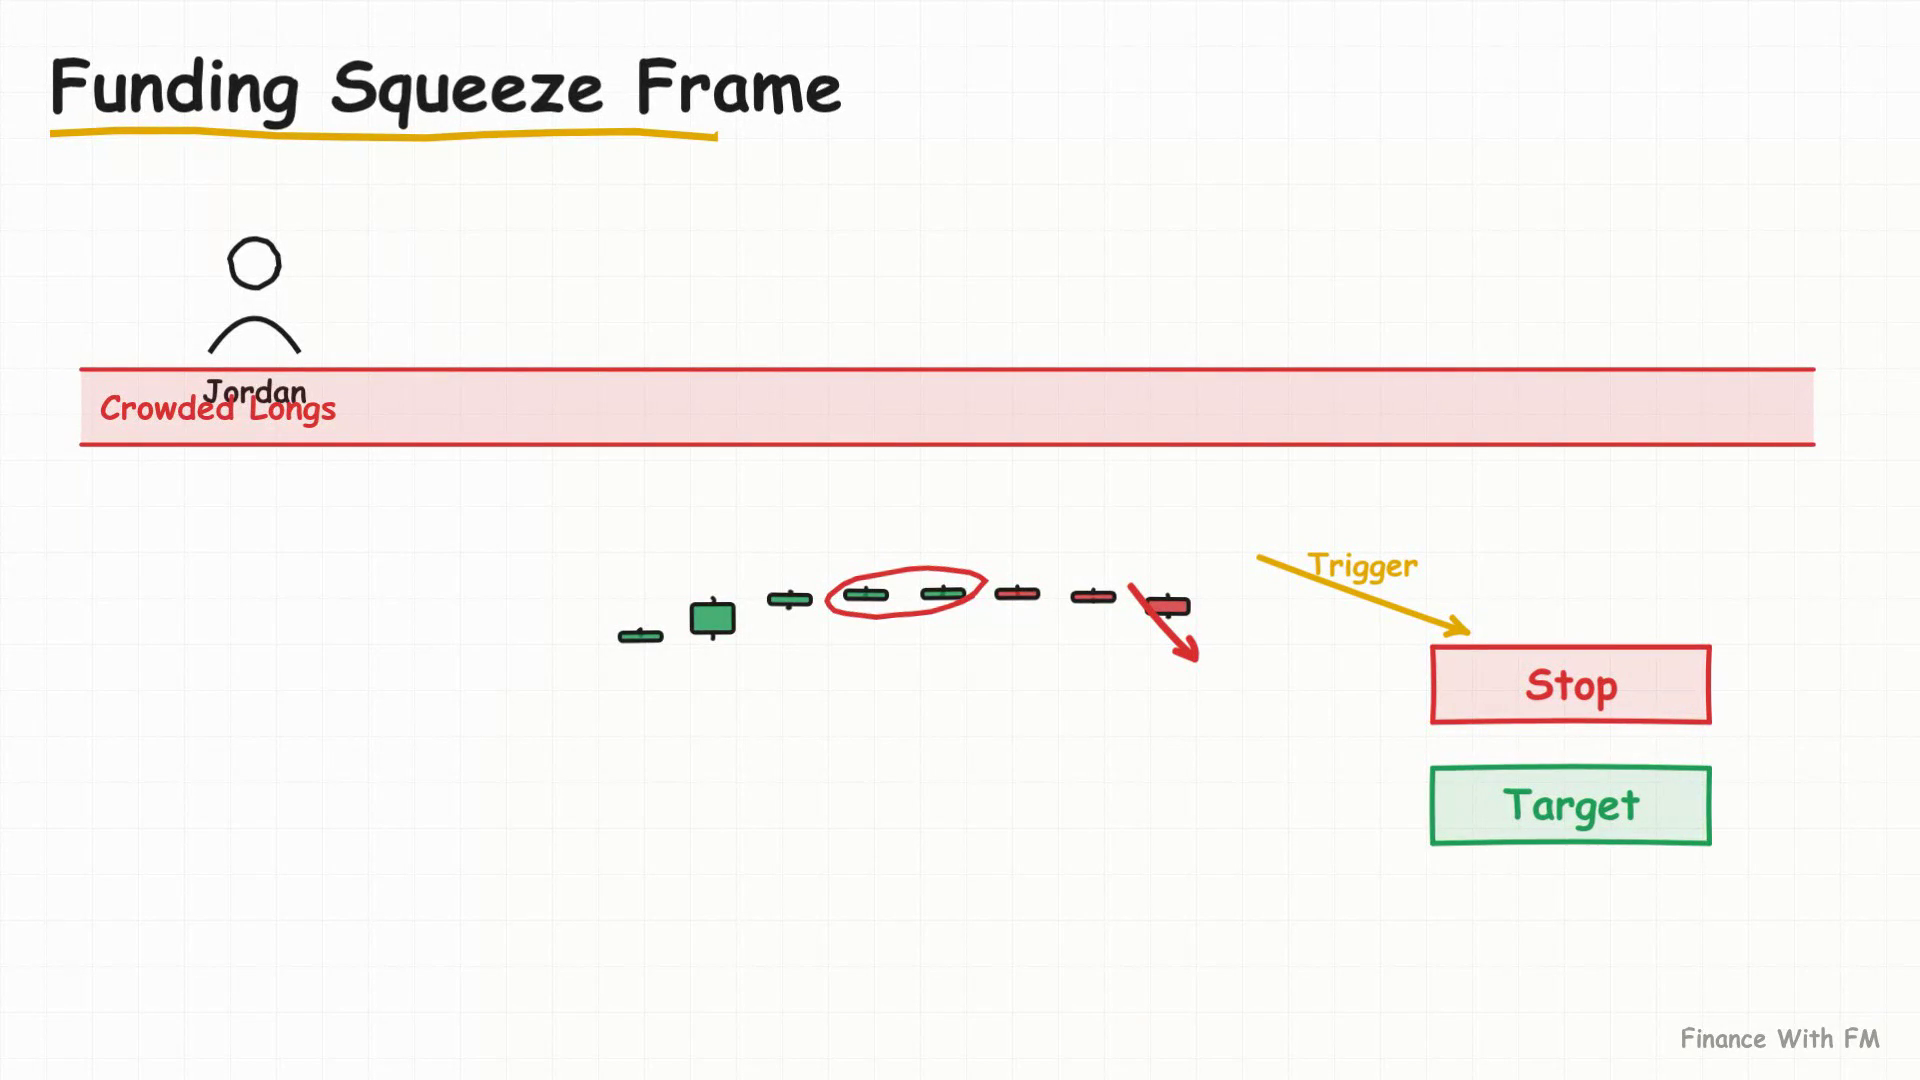
| Element | Rule |
|---|---|
| Condition | Long position + deeply positive funding + price stalling |
| Trigger | A candle closes below the last higher low |
| Stop | A few ticks under that same low — enough room for a wick, not enough to give back the move |
| Target | The level where funding usually resets — often the swing low before the rally began |
The rule is simple: rising positive funding plus a stalling price means tighten your stop. It doesn't mean panic-sell, and it doesn't mean flip short blindly. It means the market has told you the trade just got riskier — respect that.
The Doji Candle: Neutral Shape, Powerful Location
A doji is a single candle where the open and close land almost at the same price. The body is razor-thin, wicks stick out both sides, and it looks like a plus sign. On its own, a doji is direction-neutral — it only becomes a reversal signal when its location is right.
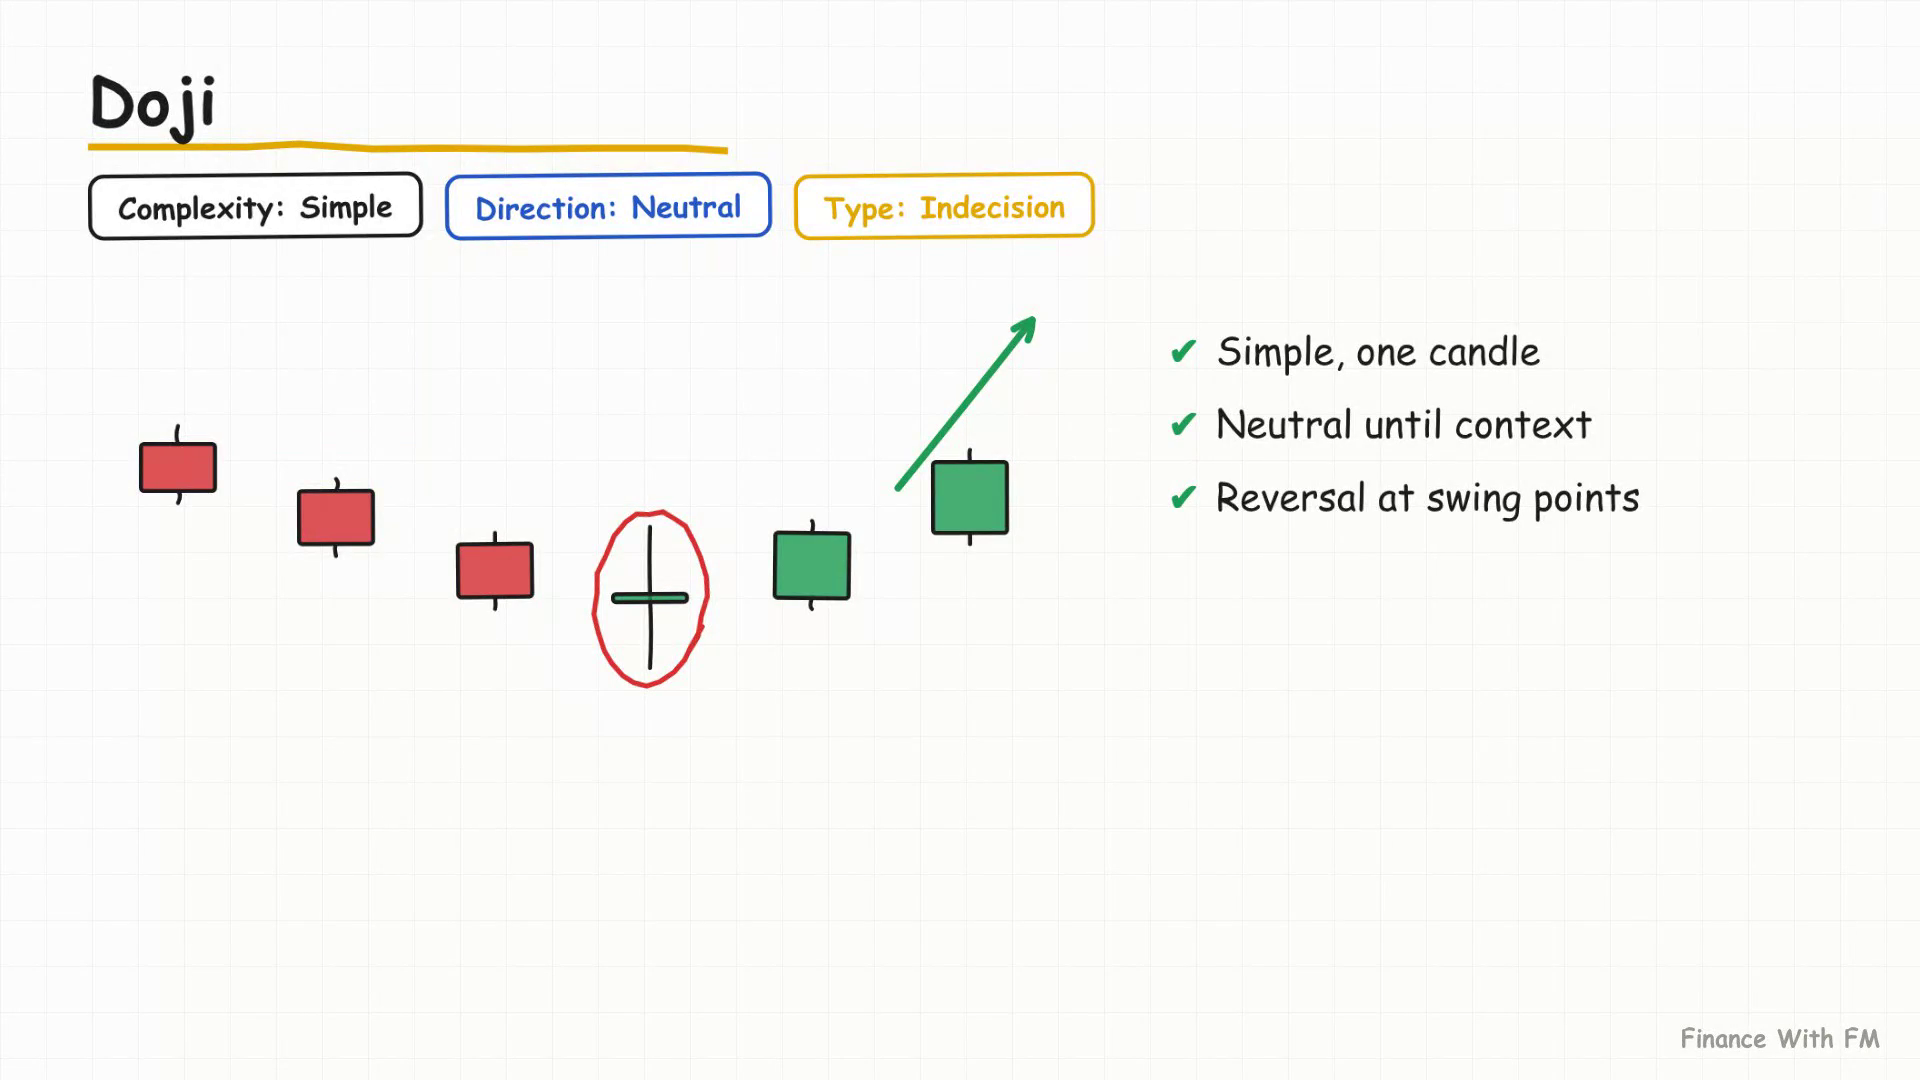
Spot it by comparing its tiny body against the last several candles. Why it matters: it shows buyers and sellers fought to a draw right after a strong move — often the pause right before momentum flips.
| Element | Rule |
|---|---|
| Trigger | Next candle breaks the doji's high (bullish) or its low (bearish) |
| Stop | Just beyond the doji's opposite wick |
| Target | The prior swing point — aim for at least 2:1 reward-to-risk |
Doji At The Top: A Confirmed Signal On A Real BTC Chart
Theory is easy to nod along to. Here's a doji on a real chart — a confirmed instance, real price, real date: July 27, 2026. Notice where it sits: right at the top of a stretched run, not floating in the middle of a choppy range. That location is the whole story.
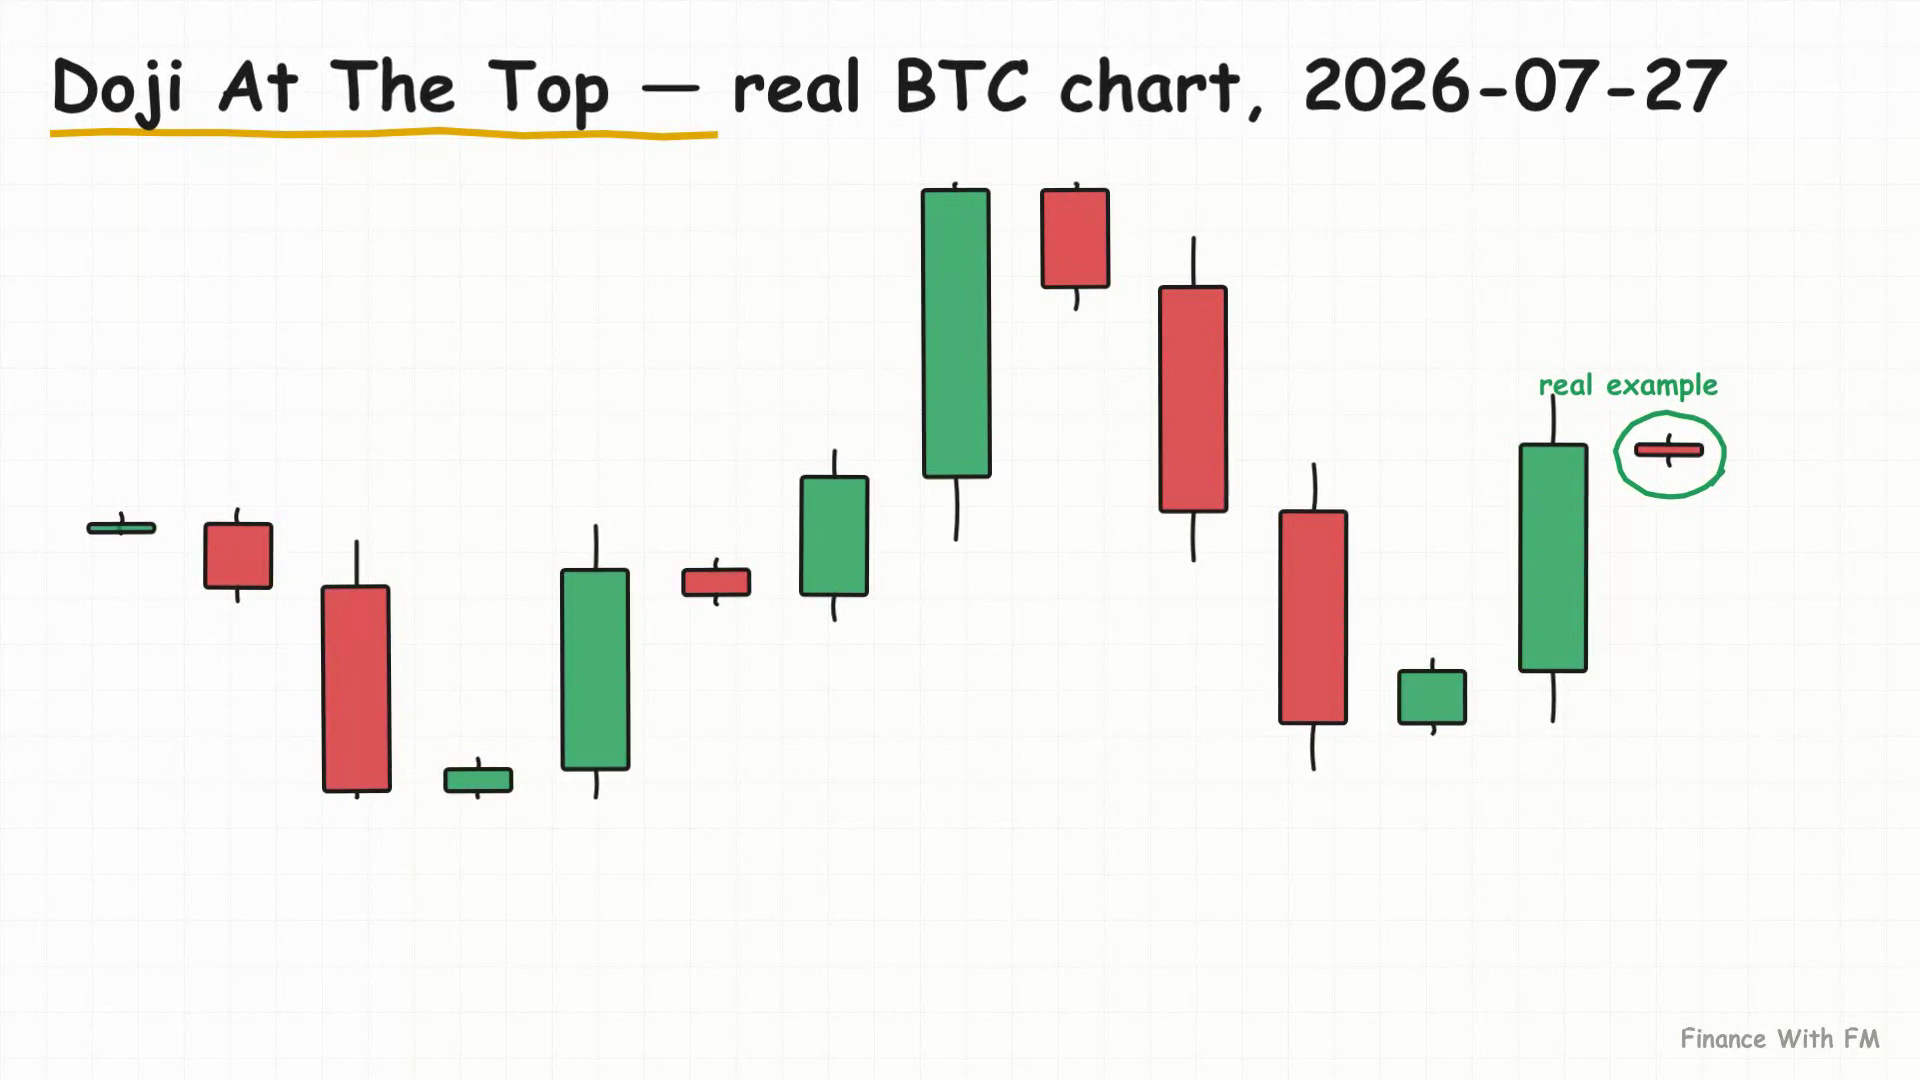
Pause here if you want to test yourself — pull up your own chart, any pair, any timeframe, and find one doji sitting at a recent swing high or low before reading on.
Two Missed Clues: How Jordan's Account Actually Bled
Both clues sat on Jordan's chart the whole time. Funding was stretched positive, and right at the highest candle of the rally sat a doji — a clear exhaustion signal. He judged the candle by shape alone instead of by where it sat in the story.
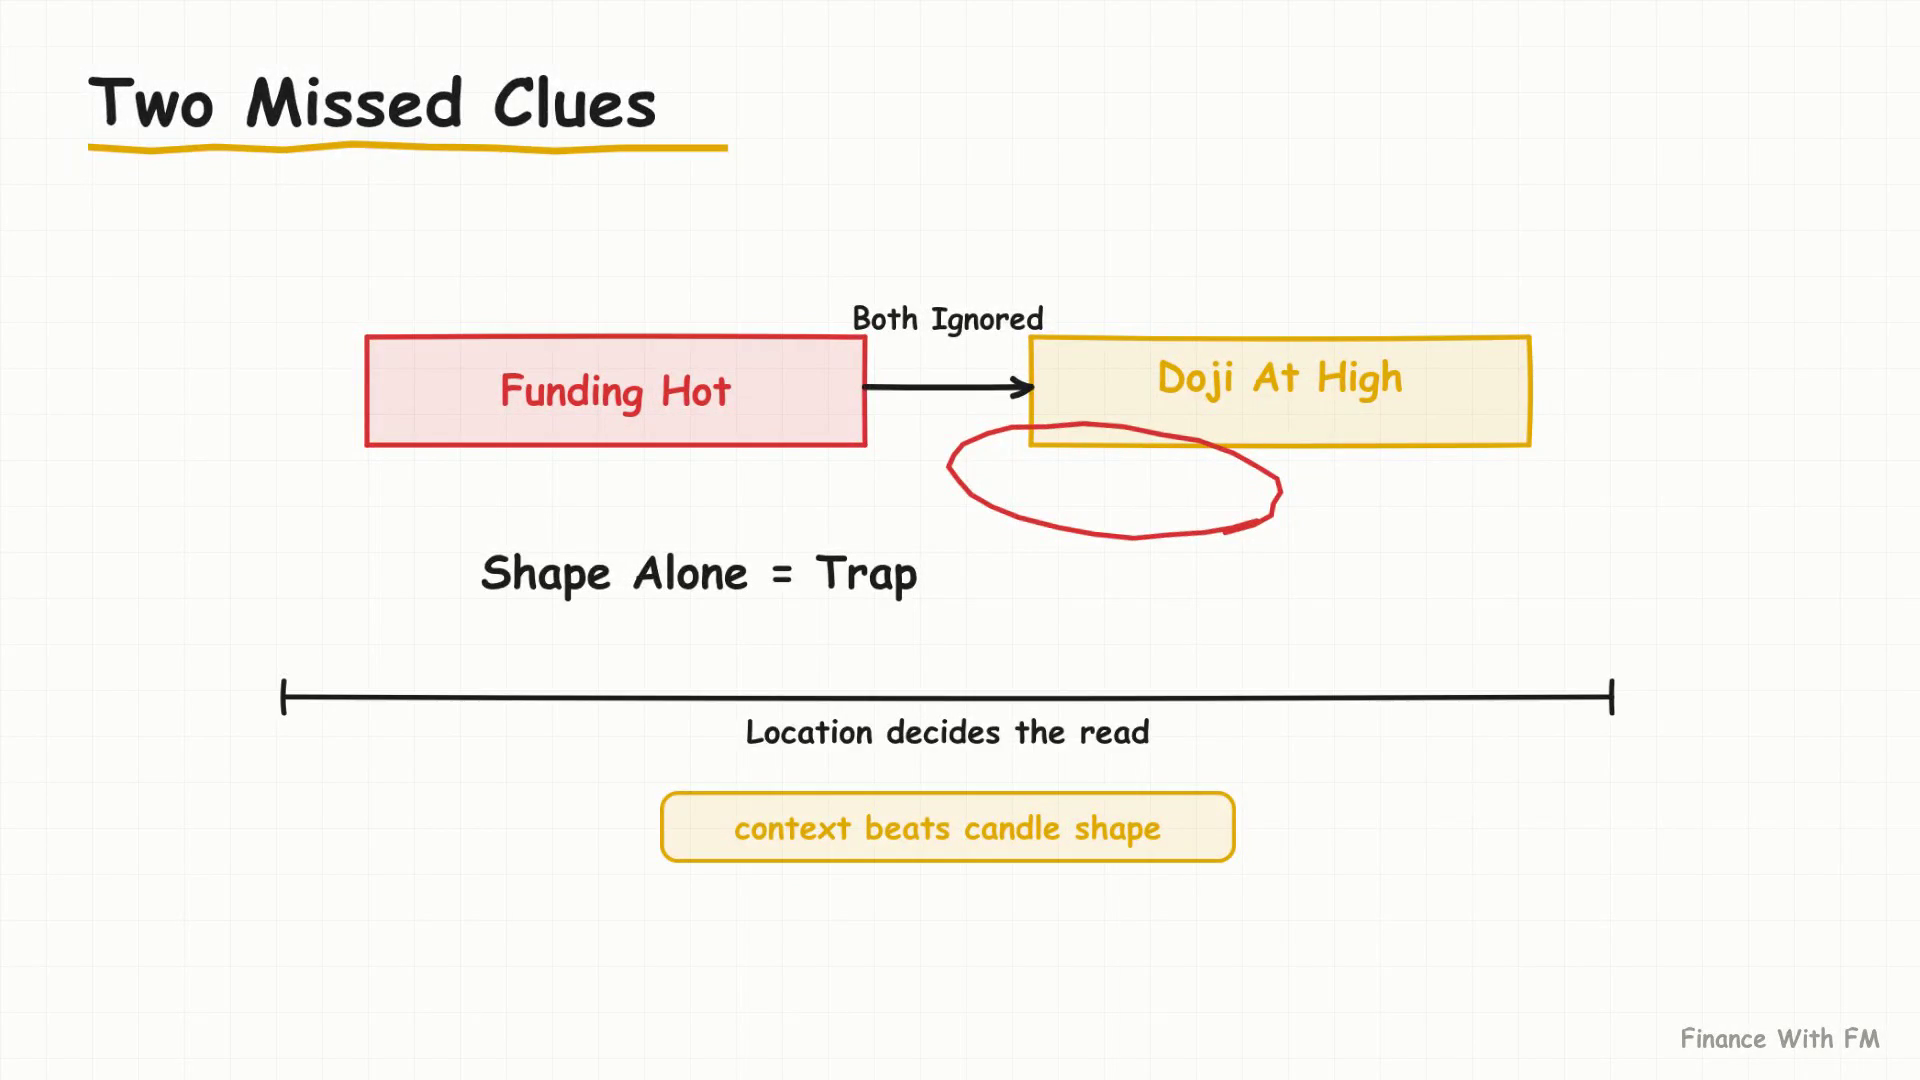
That's the part that actually saves an account: not memorizing what a doji looks like, but checking funding *and* location before you size into a long that's already run hard. Now let's run that exact process on today's live BTCUSD chart.
BTCUSD Right Now: 4H Structure And The 1H Setup
Zoom out first: 4H structure
This is Bitcoin, four-hour candles, live. Context over pattern, always. The bigger swing runs from a low near $58,115 up to a high near $66,956. Price now trades near $65,353, holding above the shallow 0.236 retracement around $64,870 — bullish structure, buyers defending a shallow pullback.
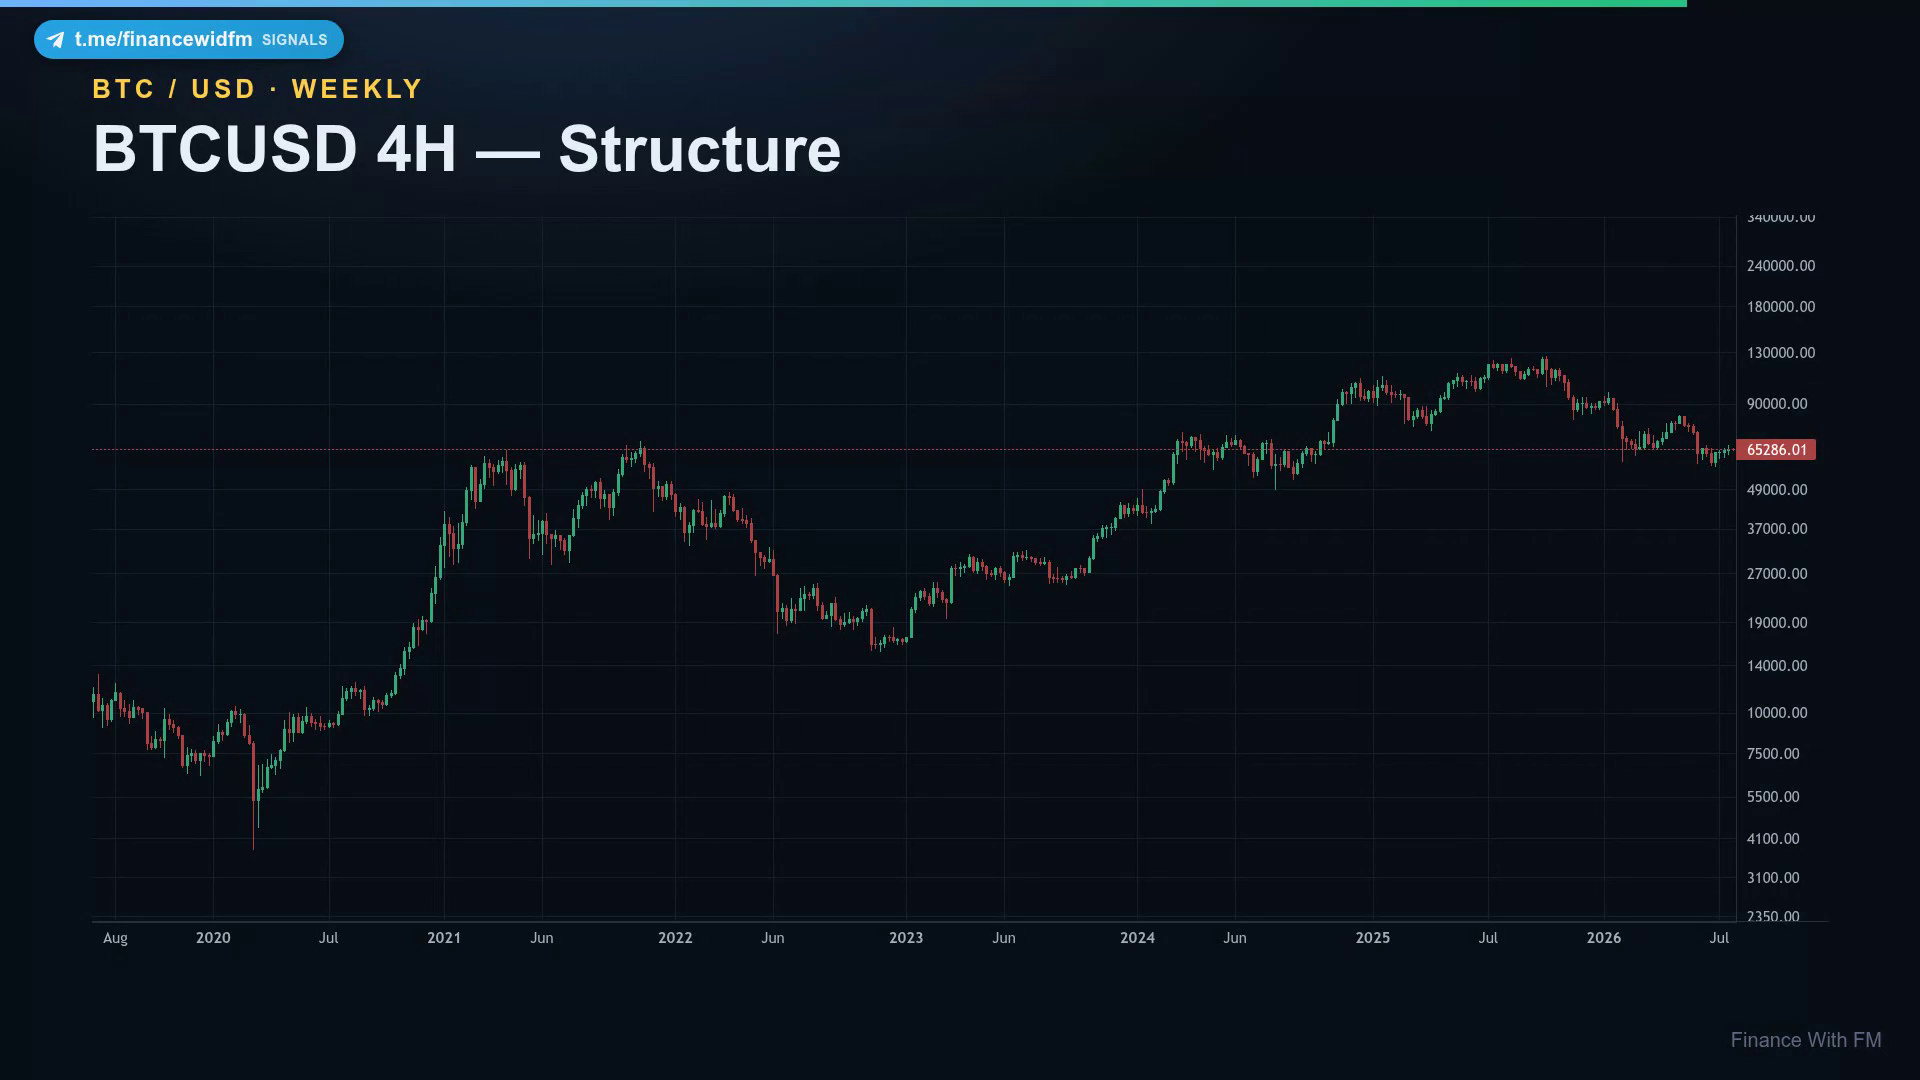
| Level | Price |
|---|---|
| Swing Low | $58,115 |
| Swing High | $66,956 |
| Current Price | $65,353 |
| 0.236 Retracement | $64,870 |
- Hunt clue one: right at the $66,956 high, look for a small-bodied candle with wicks both sides — the doji zone where the rally paused before rolling into this pullback.
- Hunt clue two: a high forming after a stretched run like this is exactly where funding tends to run hot — worth a check before sizing into a long.
Zoom in: the 1H setup
Zooming into the one-hour chart for the actual setup, the swing resets from a low near $61,825 up to that same high near $66,956. This is practice-setup analysis only, not advice.
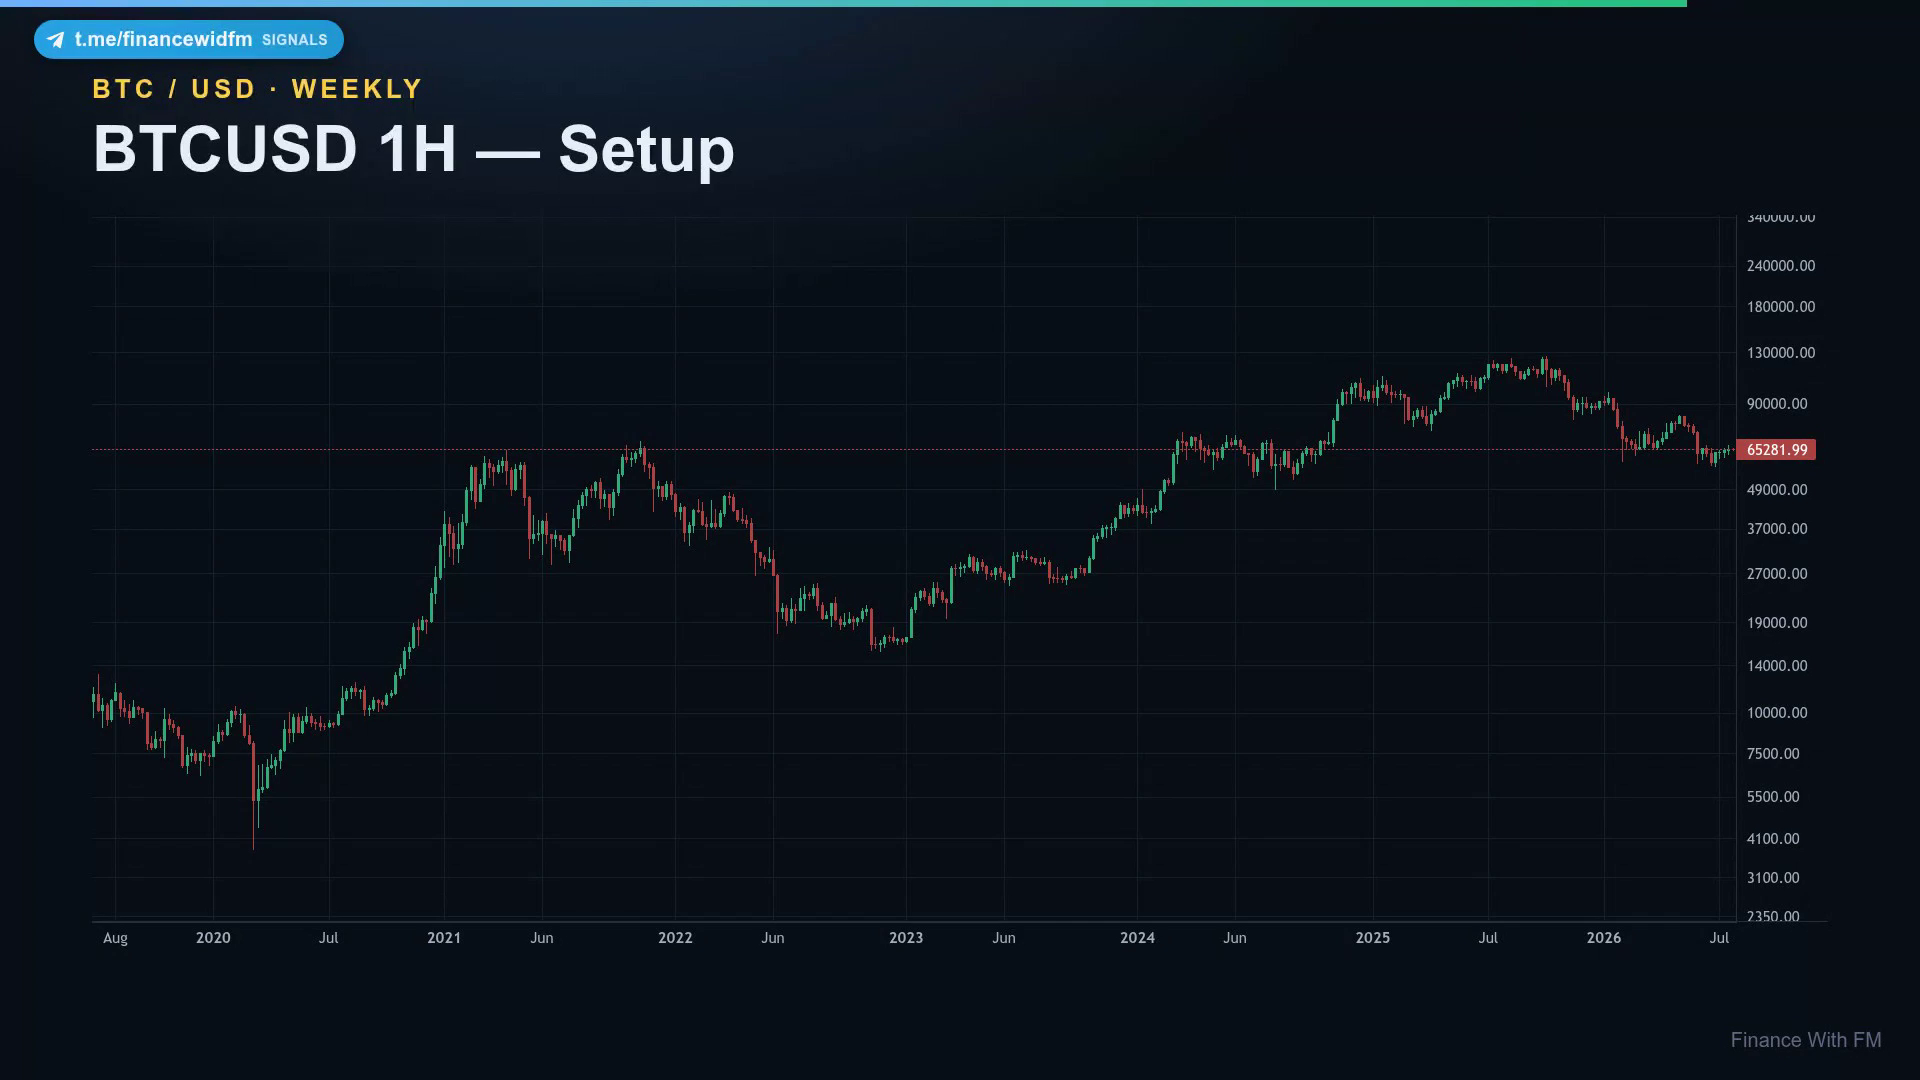
| Fib Level | Price |
|---|---|
| Swing Low | $61,825 |
| Swing High | $66,956 |
| 0.236 | $65,745 |
| 0.382 | $64,996 |
| 0.5 (Trigger zone) | $64,391 |
| 0.618 (Stop zone) | $63,785 |
| Element | Value |
|---|---|
| Trigger | Bullish reversal candle closing back above $64,391 |
| Stop | Just under $63,785 — room for a wick |
| Target | Back near $66,956 |
| Risk | Roughly $600 |
| Reward | Over $2,500 |
| Reward-to-Risk | Better than 4:1 |
Remember: Context Beats The Pattern
Jordan's mistake wasn't lack of technical skill. He knew what a doji looked like. What he skipped was the cross-check: where does this candle sit in the story, and how crowded is the funding rate behind it? Both questions take thirty seconds. Both would have saved three hundred dollars.
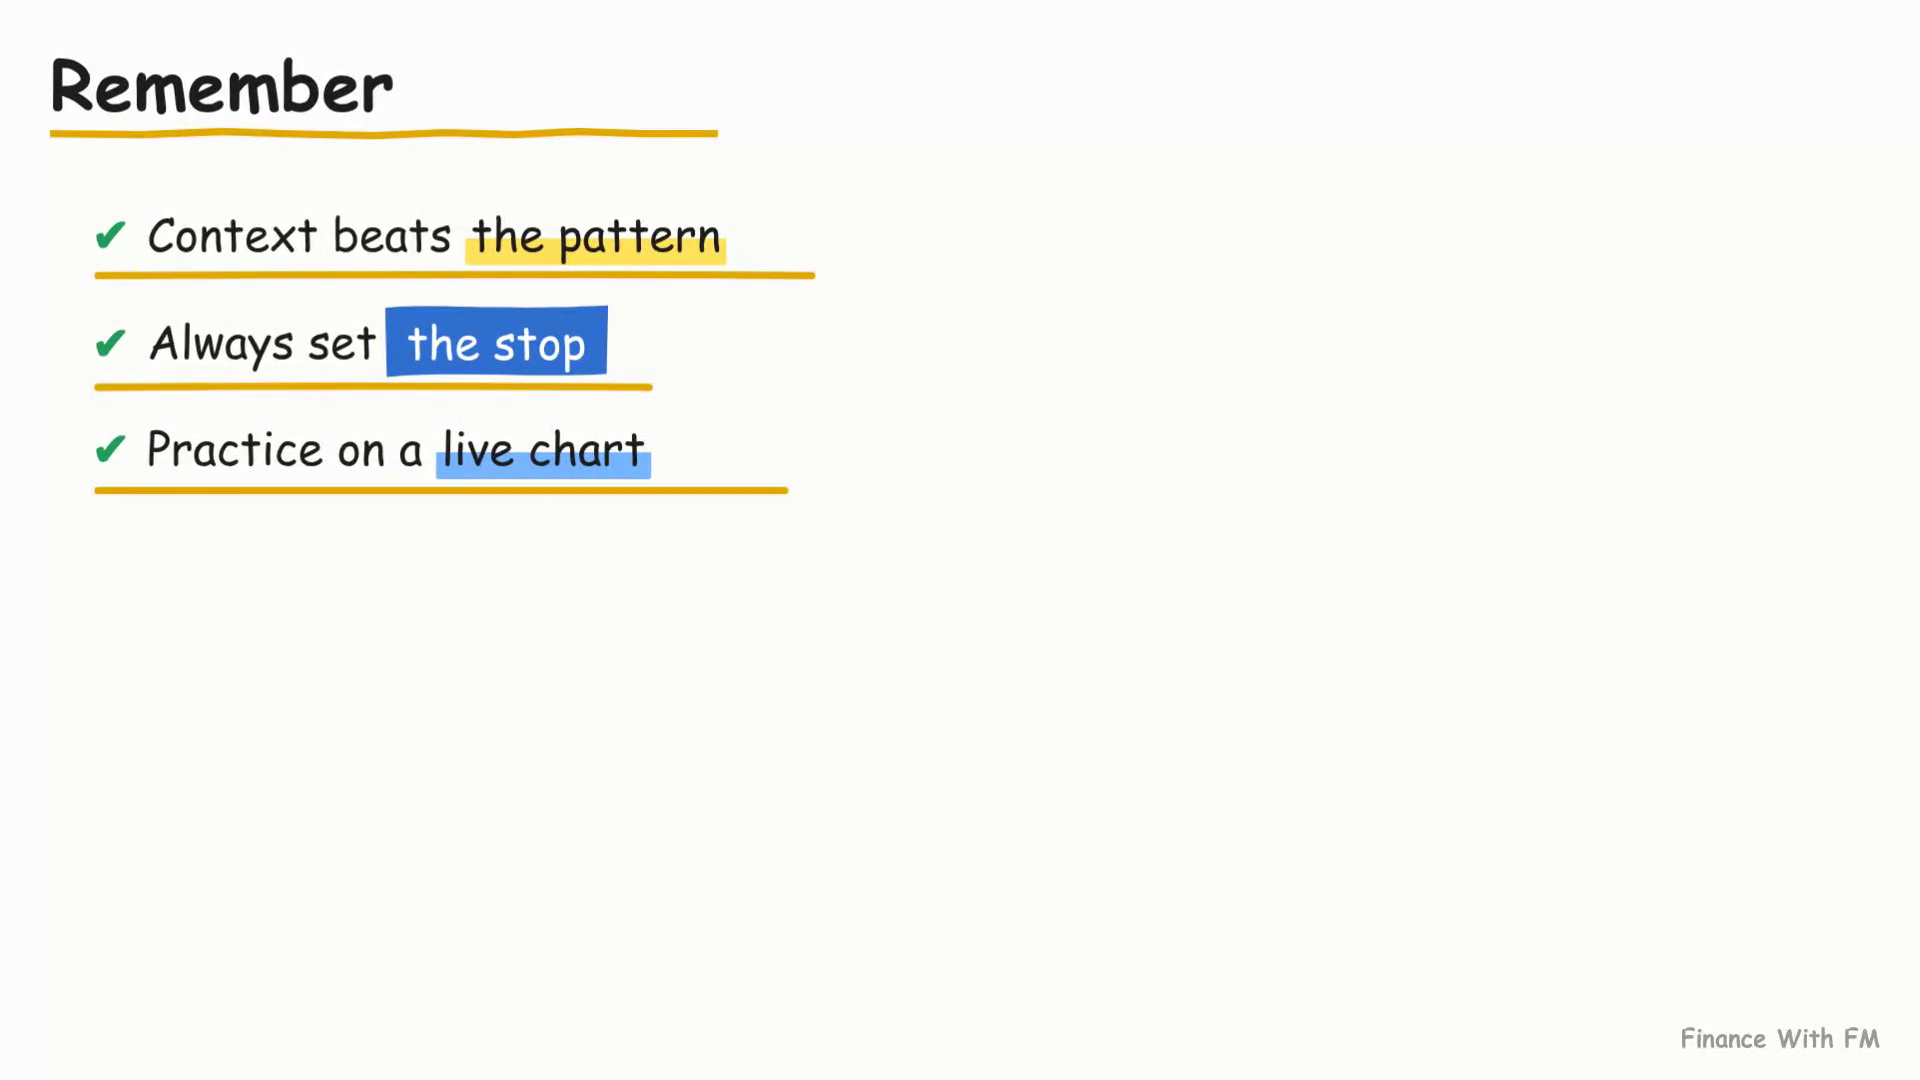
- Context beats the pattern — a doji at a stretched high means something different than a doji in a choppy range.
- The stop is what saves you — not the entry, not the target, not the leverage.
- Nothing replaces practice on a live chart — theory only sticks once you've hunted the clue yourself.
Before your next leveraged BTCUSD long, run the same two checks: pull up the funding rate on your exchange, and scan the recent swing high for a doji. If both point the same direction, tighten before the market makes the decision for you.
Key takeaways
- Funding rate is paid between traders on perpetual futures, not charged by an exchange — deeply positive funding means longs are paying to hold a crowded trade.
- A doji is direction-neutral by itself; it only becomes a reversal signal when it sits at a stretched swing high or low.
- Jordan's $300 overnight loss came from crowded positive funding plus an exhaustion doji at the top — two checks that take thirty seconds each.
- On today's BTCUSD 1H chart, the practice setup risks roughly $600 to target over $2,500 near $66,956 — better than 4:1, with the stop just under $63,785.
- The stop-loss, not the pattern or the funding read, is what actually protects the account when a setup fails.
Frequently asked questions
What counts as a "deeply positive" funding rate on BTCUSD?
There's no fixed universal number, but when funding runs well above the typical baseline for several consecutive periods, it signals crowded long positioning. Check your exchange's futures page directly rather than guessing from the price chart.
Does a doji always mean a reversal is coming?
No. A doji is direction-neutral by itself. It only carries weight as a reversal signal when it forms at a recent swing high or low after a stretched move — location matters more than shape.
Where do I check the funding rate for Bitcoin perpetual futures?
On your exchange's futures/derivatives page, not on the candlestick chart. It's a separate data feed that updates every few hours.
Is the BTCUSD 1H setup in this article a trade recommendation?
No. It's a practice-only illustration of how to structure a trigger, stop, and target using real chart levels. Always do your own analysis and risk management.
What's the actual risk-to-reward on the current BTCUSD setup?
Roughly $600 of risk (stop just under $63,785) against over $2,500 of potential reward (target near $66,956), which works out to better than 4:1.