
Analysis
Kaspa: 17% Drop, Whale Rumours, and the Levels That Matter
The 17% Move Nobody Saw Coming
Kaspa just dropped double digits in a week, while rumours swirl about whales stacking millions of tokens behind the scenes. Is this quiet accumulation before a breakout — or a trap before the next leg down? The levels don't lie, and neither does the leverage data sitting underneath the chart right now.
KAS is trading around $0.02617, still boxed inside the same range it has held for roughly two months. Whale wallets are allegedly stacking millions of tokens. Altcoin-season chatter is getting louder by the day. Today we separate the confirmed from the rumour, and find the exact level that proves either side right.
The Number That Started It
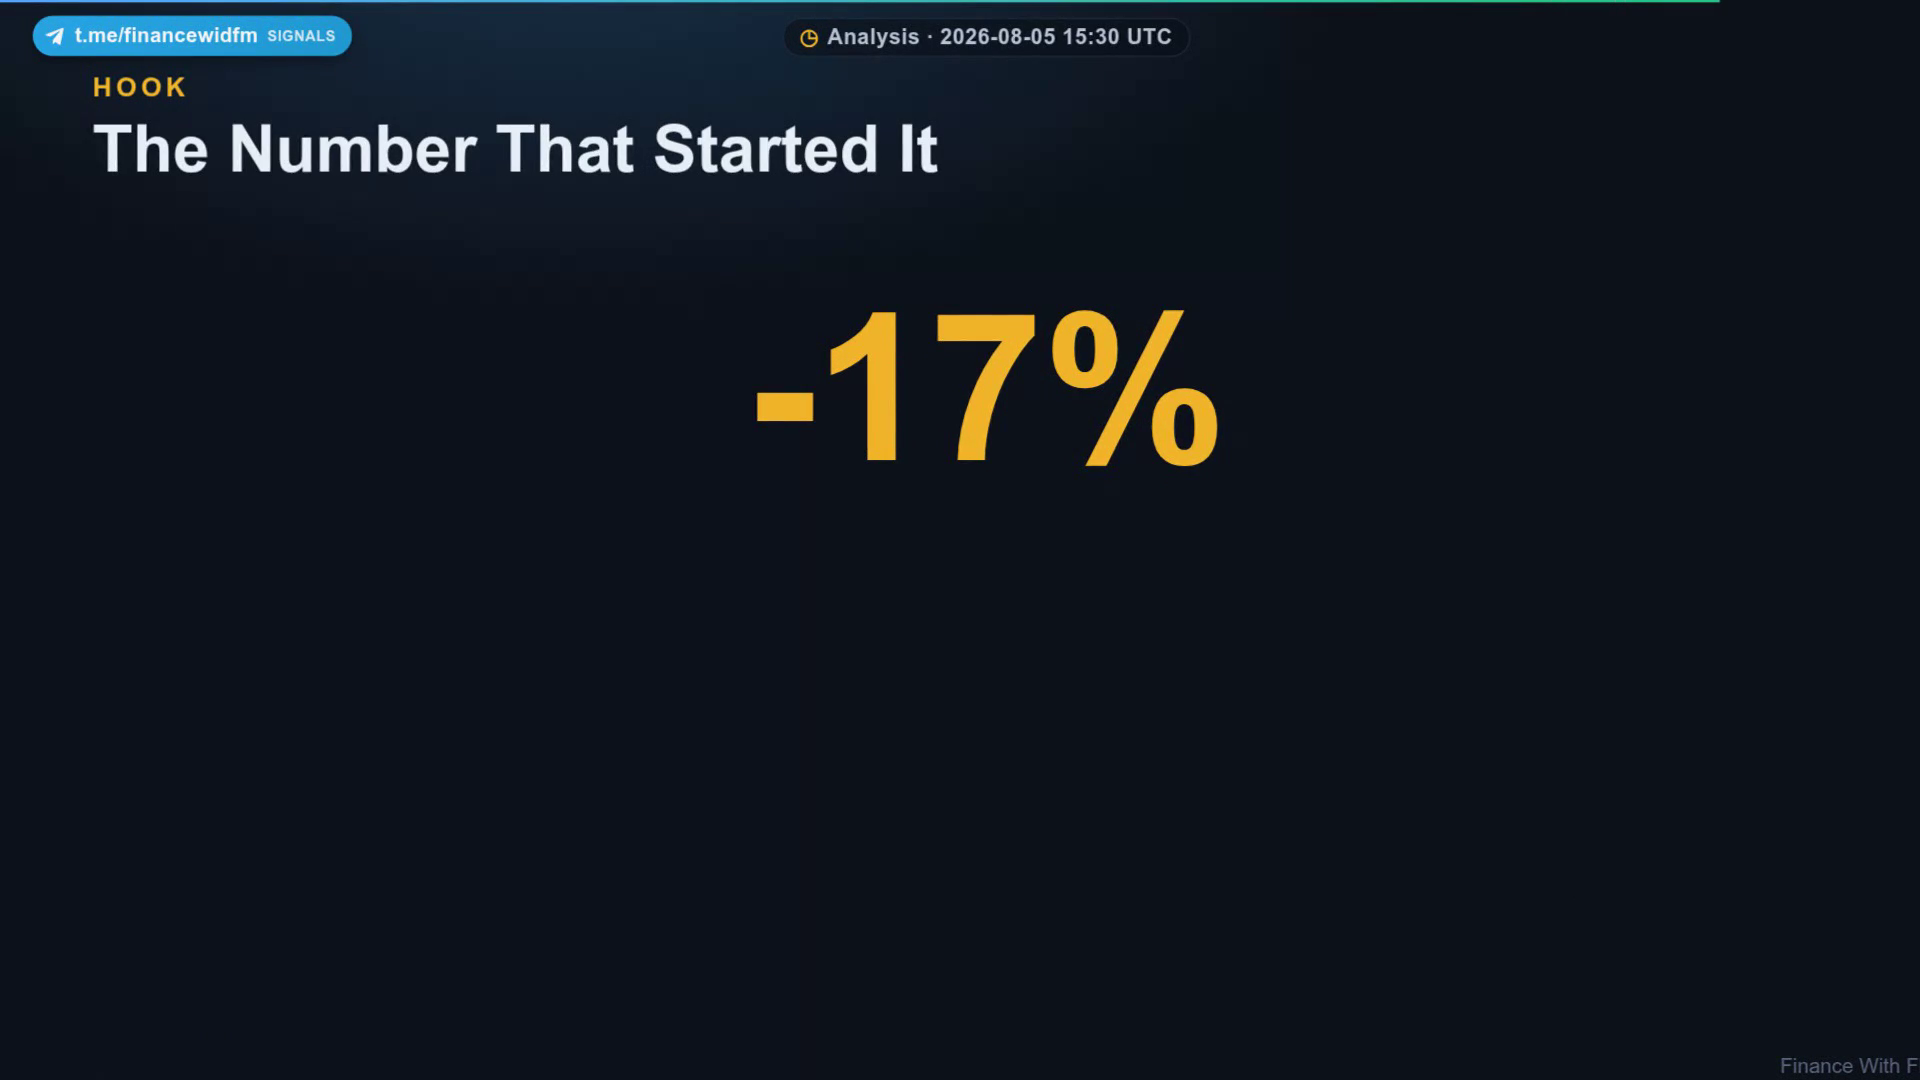
Seventeen percent. That's how much Kaspa dropped in a single week, and drops like that usually mean one of two things. Either weak hands just got flushed out before a real move higher — or the story everyone's repeating about quiet whale accumulation is just noise dressed up as a setup.
Kaspa's price history over the last month shows exactly how compressed this move has been. Daily closes have hovered in a tight $0.0270–$0.0280 band for most of late July before the drop pulled price toward the low end of the range.
What Actually Happened (The Confirmed Part)
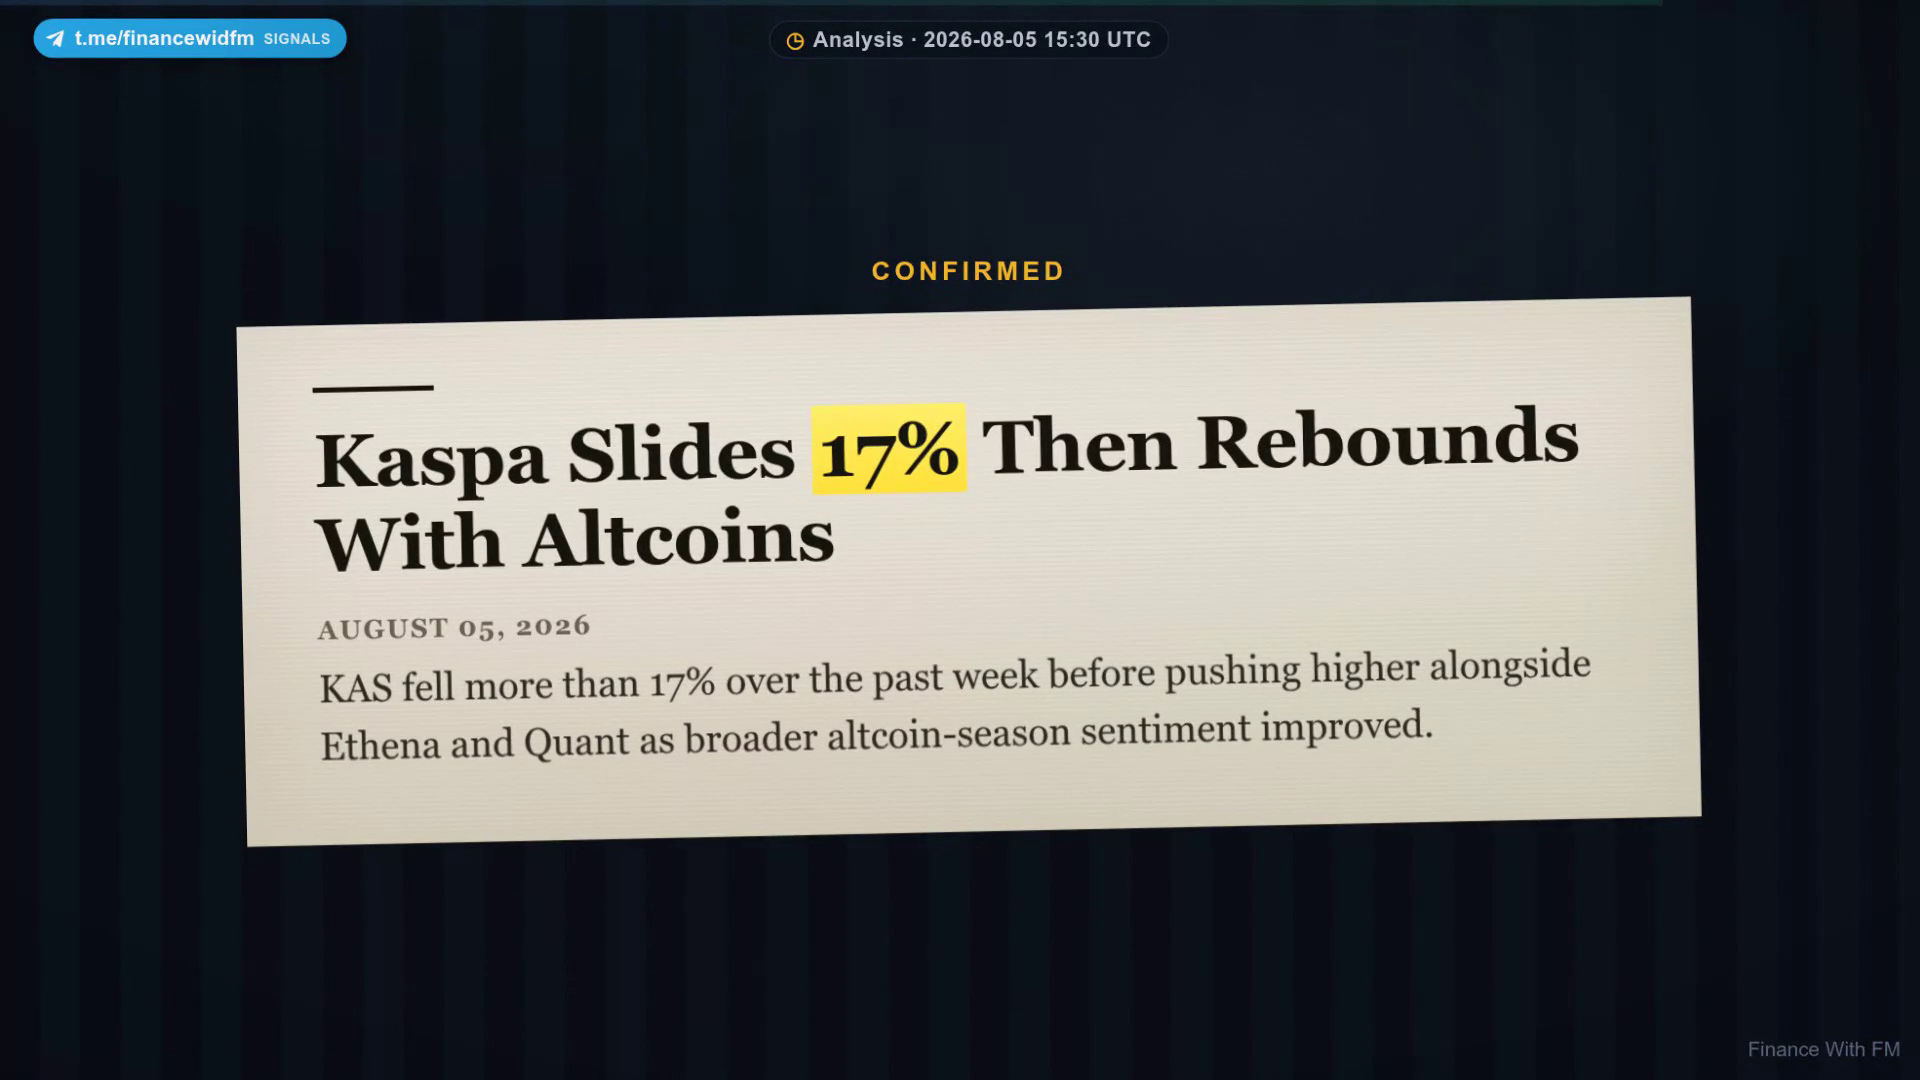
Here's what's actually confirmed. Kaspa fell more than seventeen percent over the past week — that part is fact, not opinion. But it didn't stop there. Price bounced back, and Kaspa started pushing higher alongside Ethena and Quant, as sentiment across the broader altcoin market improved.
That's the macro thread here: this isn't a Kaspa-only story, it's a slice of a wider altcoin-season mood shift. Two confirmed facts, one drop, one bounce — and nothing about whales, nothing about 2032 price targets, nothing about market dominance. Just price action and a sector-wide sentiment lift.
- Confirmed: Kaspa fell over 17% in a single week
- Confirmed: Price bounced afterward alongside Ethena (ENA) and Quant (QNT)
- Confirmed: Broader altcoin sentiment improved during the bounce
- Not confirmed: Whale wallets 'quietly accumulating millions of tokens'
The Rumour vs The Leverage Data
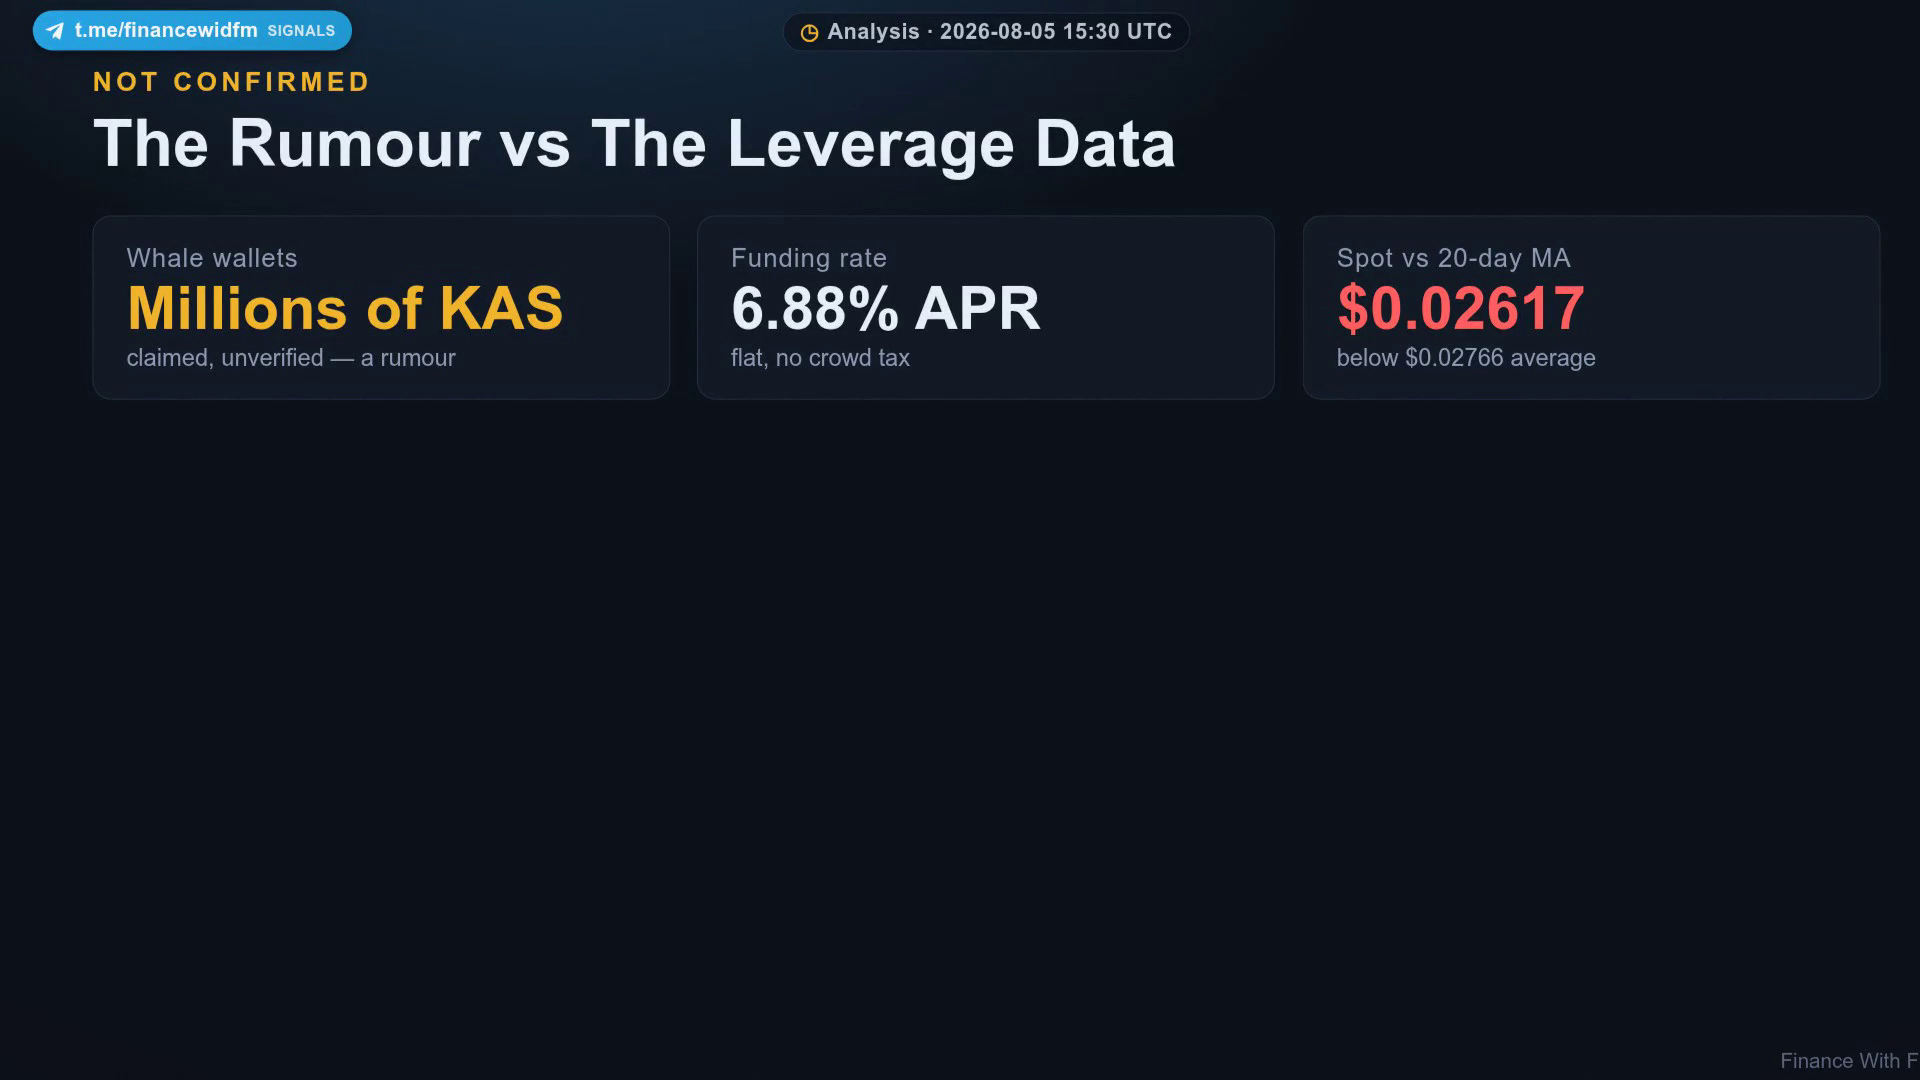
Now here's what is NOT confirmed. A rumour circulating right now claims large wallets — whales — have been quietly accumulating millions of Kaspa tokens, setting up for a bigger move. Named plainly: that's a rumour, not a fact, and nobody has shown verified on-chain proof.
So let's check it against real leverage data instead of vibes.
| Metric | Reading | What It Would Show If The Rumour Were True |
|---|---|---|
| Funding rate (annualized) | 6.88% | Should lean clearly bullish, not flat |
| Spot price | $0.02617 | Should be trending above short-term averages |
| 20-day average | $0.02766 | Spot should be reclaiming this, not sitting below it |
Funding sits at 6.88% annualized — flat, neutral, no crowd tax either way. If whales were aggressively loading up and traders believed it, we'd expect funding to lean bullish. It isn't. Spot price is $0.02617, still sitting below the 20-day average of $0.02766. The accumulation story hasn't shown up in price, and it hasn't shown up in leverage. That doesn't kill the rumour — it just means it's unconfirmed.
Is The Hype Already In The Price?
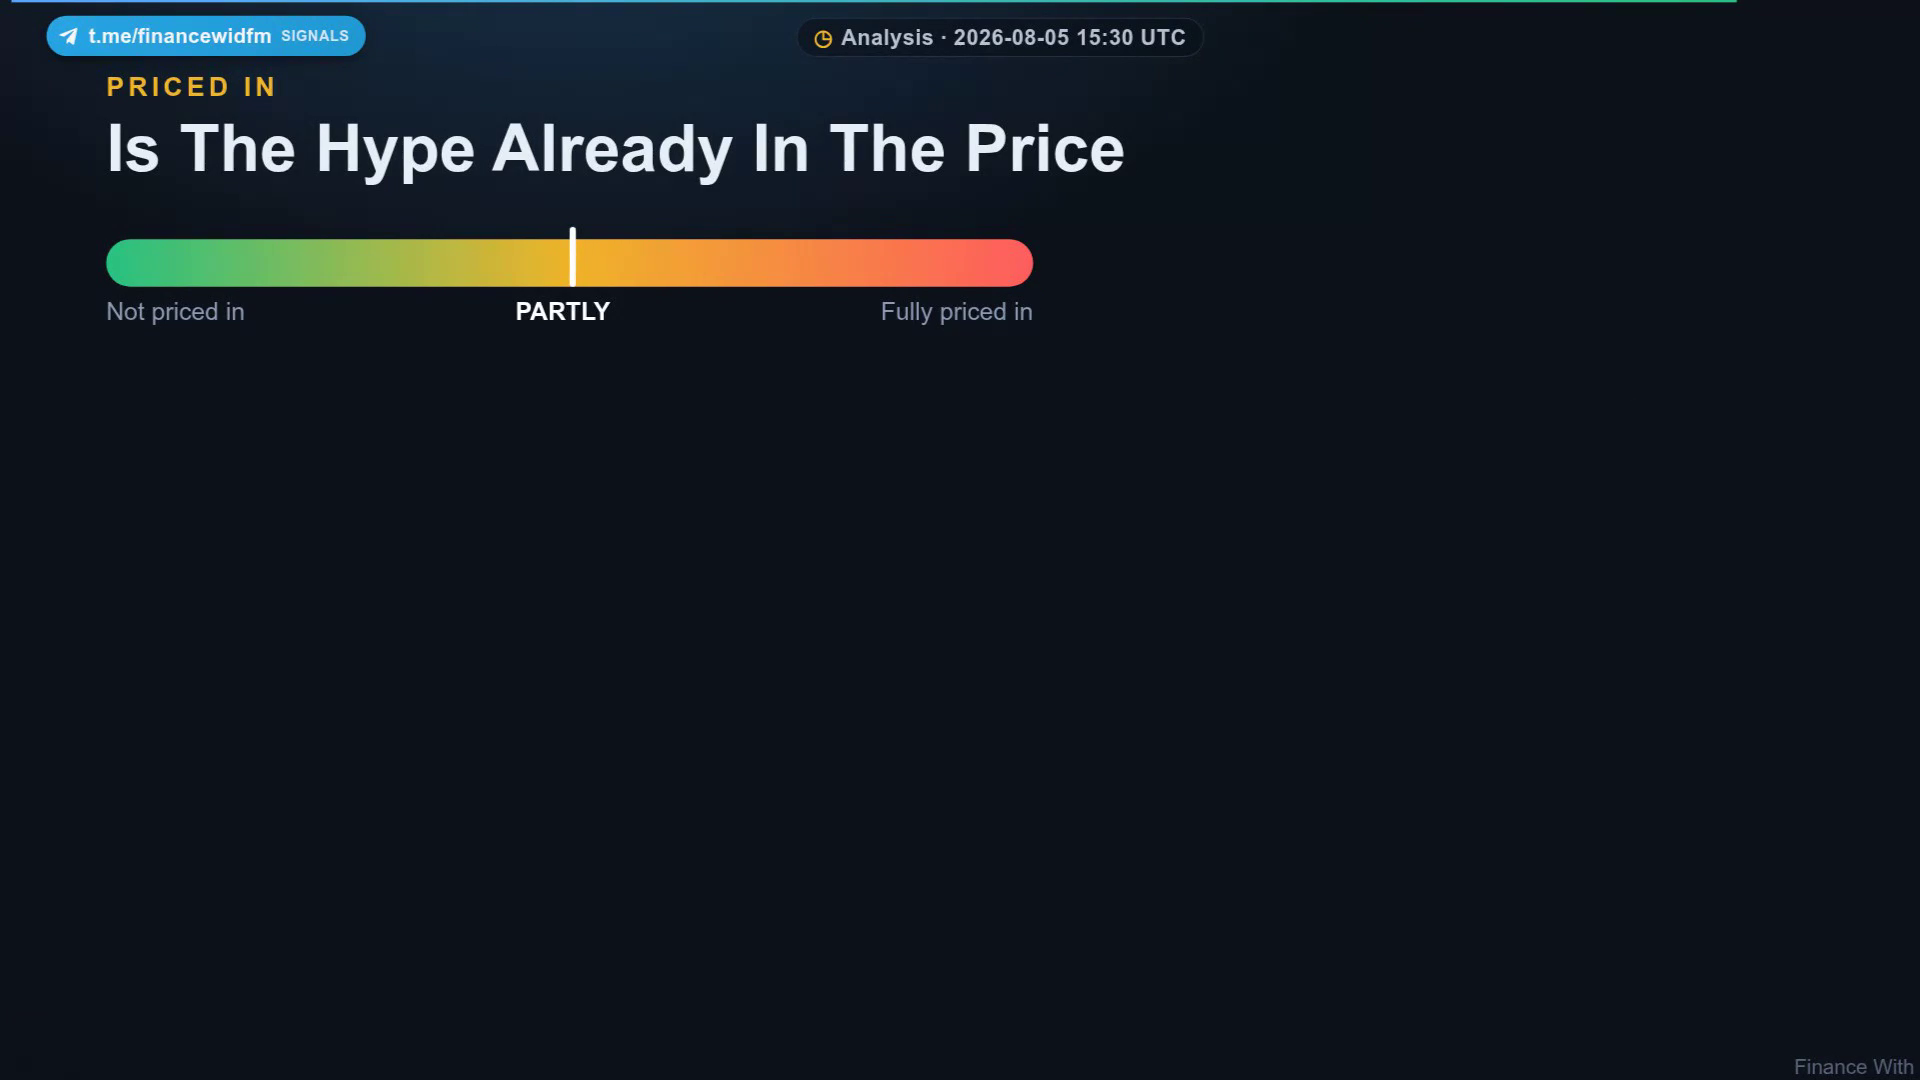
So is this already priced in? Partly — and that word matters. Funding staying flat despite a wave of bullish video narratives tells us leveraged traders aren't leaning into the hype. And spot sitting below both the 20-day and 200-day averages, near the low of its two-month range, tells us the 'next Bitcoin' talk hasn't translated into actual buying pressure yet.
For context, several price forecasting models still peg Kaspa's upside for this month between $0.029 and $0.040, with most clustering near the $0.03–$0.032 zone. That's a meaningful gap above where spot sits right now — which is exactly why the reclaim levels below matter more than any headline target.
The Map: Where Price Runs Into Something
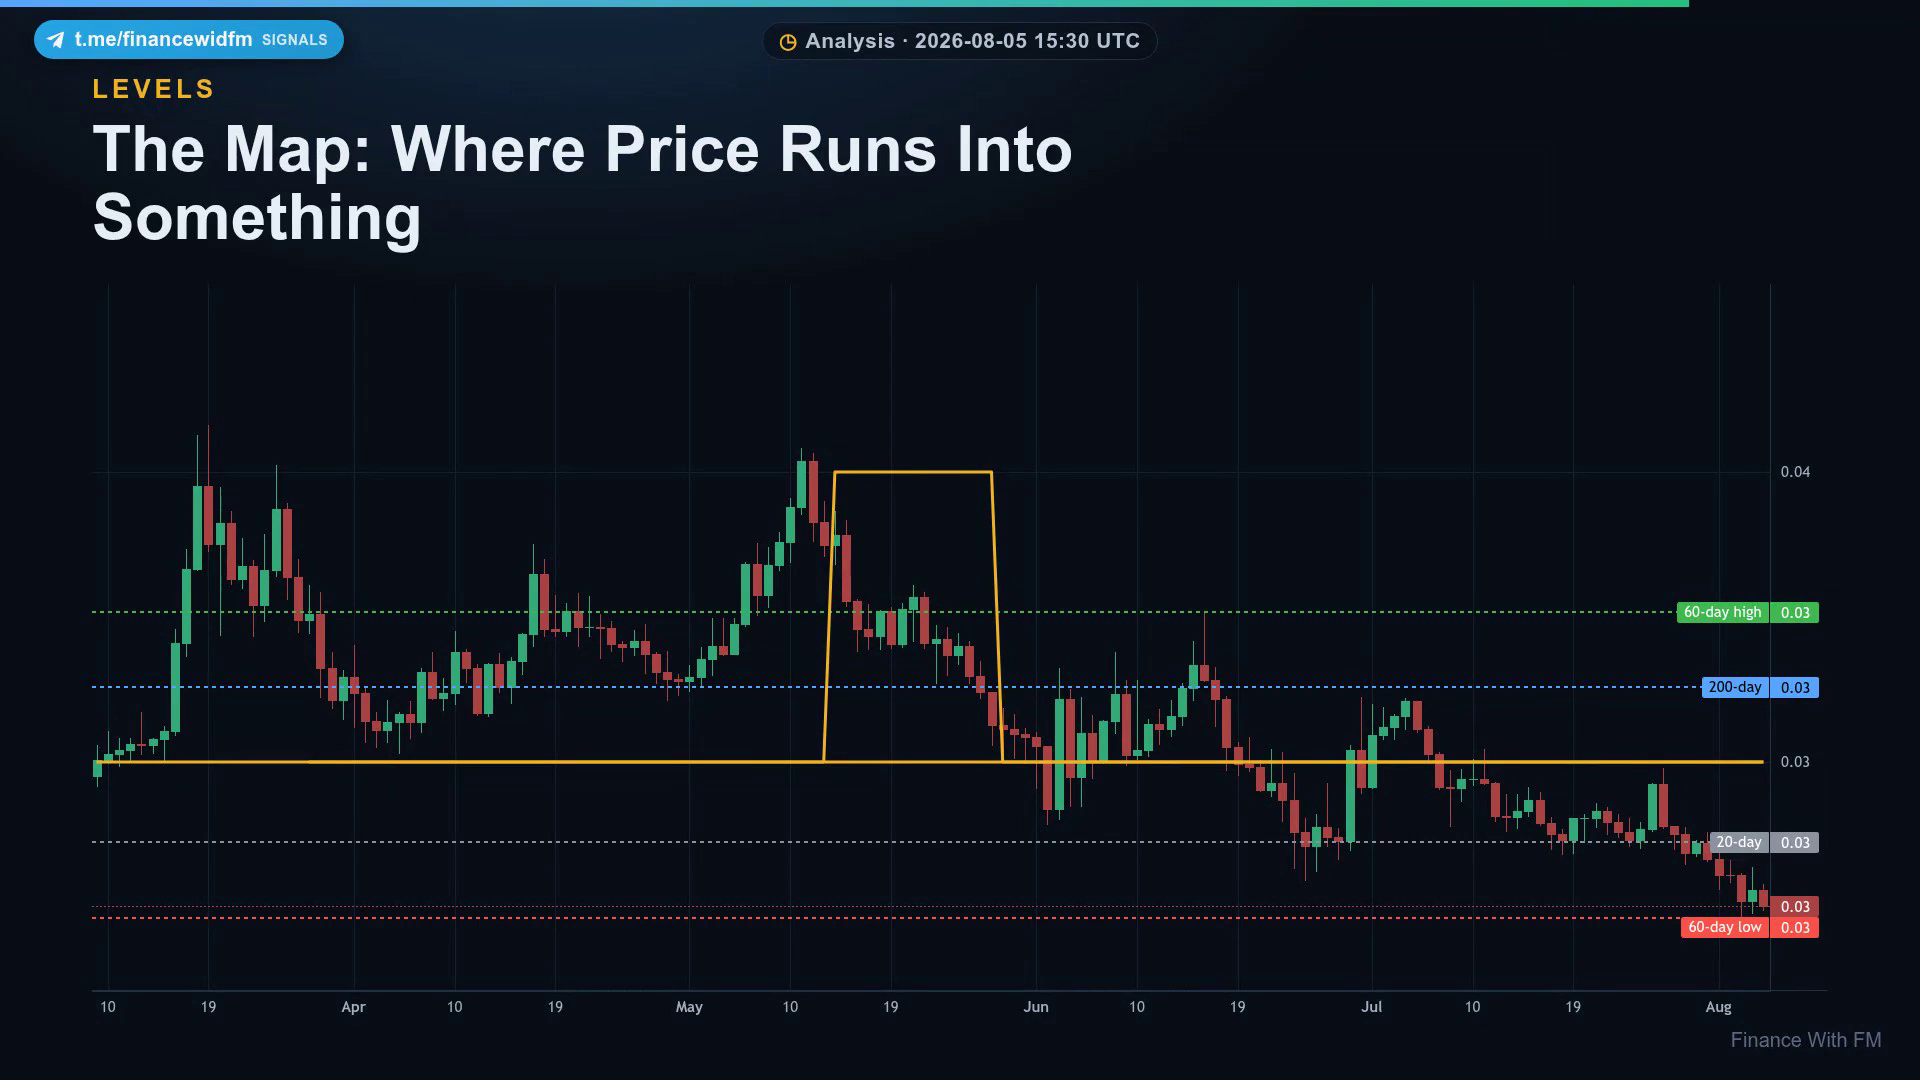
Let's map where this actually runs into something. Spot is $0.02617.
| Level | Price | What It Means |
|---|---|---|
| Range low (60-day) | $0.02569 | Lose this on a weekly close and the bear case takes over |
| Current spot price | $0.02617 | Sitting just above the range low right now |
| 20-day average | $0.02766 | First real technical proof the accumulation story is showing in price |
| 200-day average | $0.03225 | The bigger wall — major resistance built over months |
| Range top (60-day) | $0.03481 | Level bulls need to reclaim to flip the whole structure bullish |
First test above is the 20-day average at $0.02766 — reclaim that, and it's the first real technical sign the accumulation story is showing up in price. Above that, the 200-day average at $0.03225 is the bigger wall; that's major resistance built over months. On the downside, $0.02569 is the range low — lose that on a weekly close, and the bear case takes over. $0.03481 marks the top of the 60-day range, the level bulls need to reclaim the whole structure.
Our Call vs The Best Case Against It
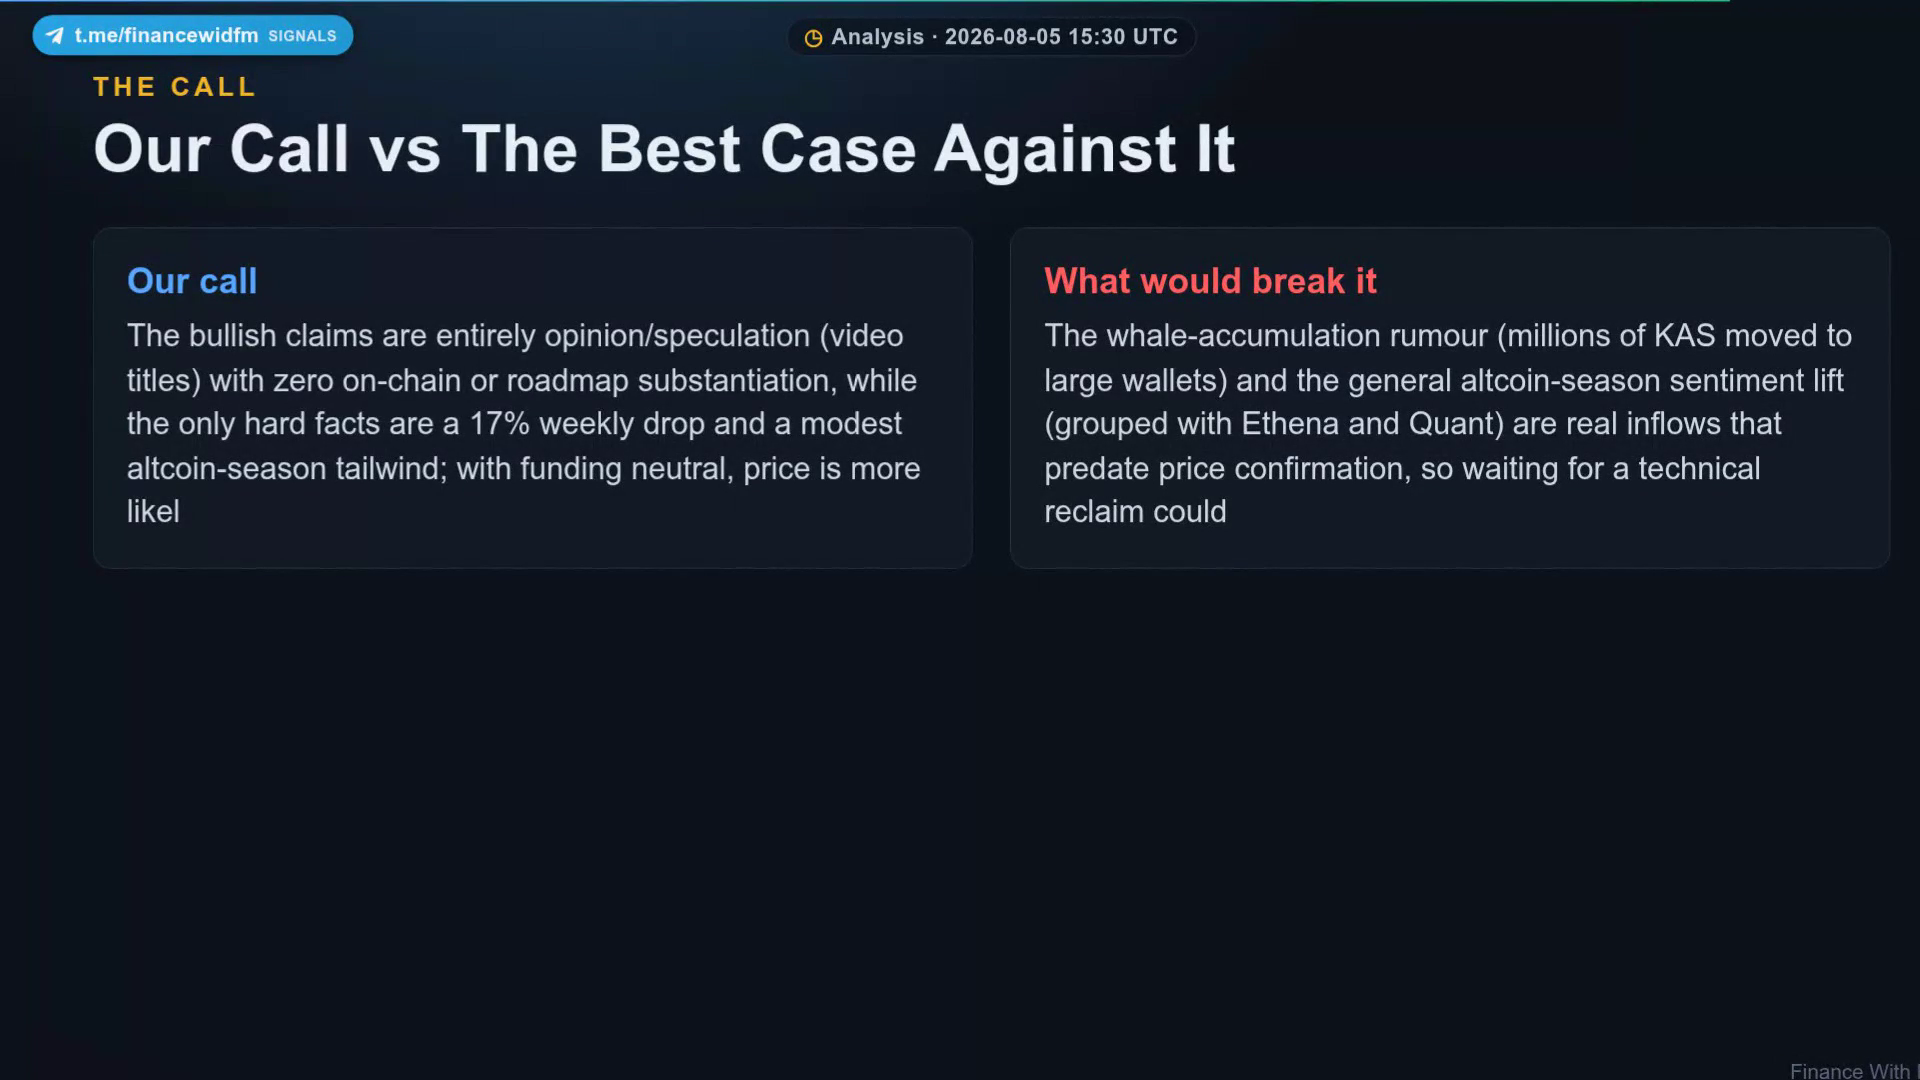
So here's our call, stacked against the best argument against it.
Both sides have a point. That's precisely why the levels above — not the rumour, not the hype — are the fair referee here.
What To Watch From Here
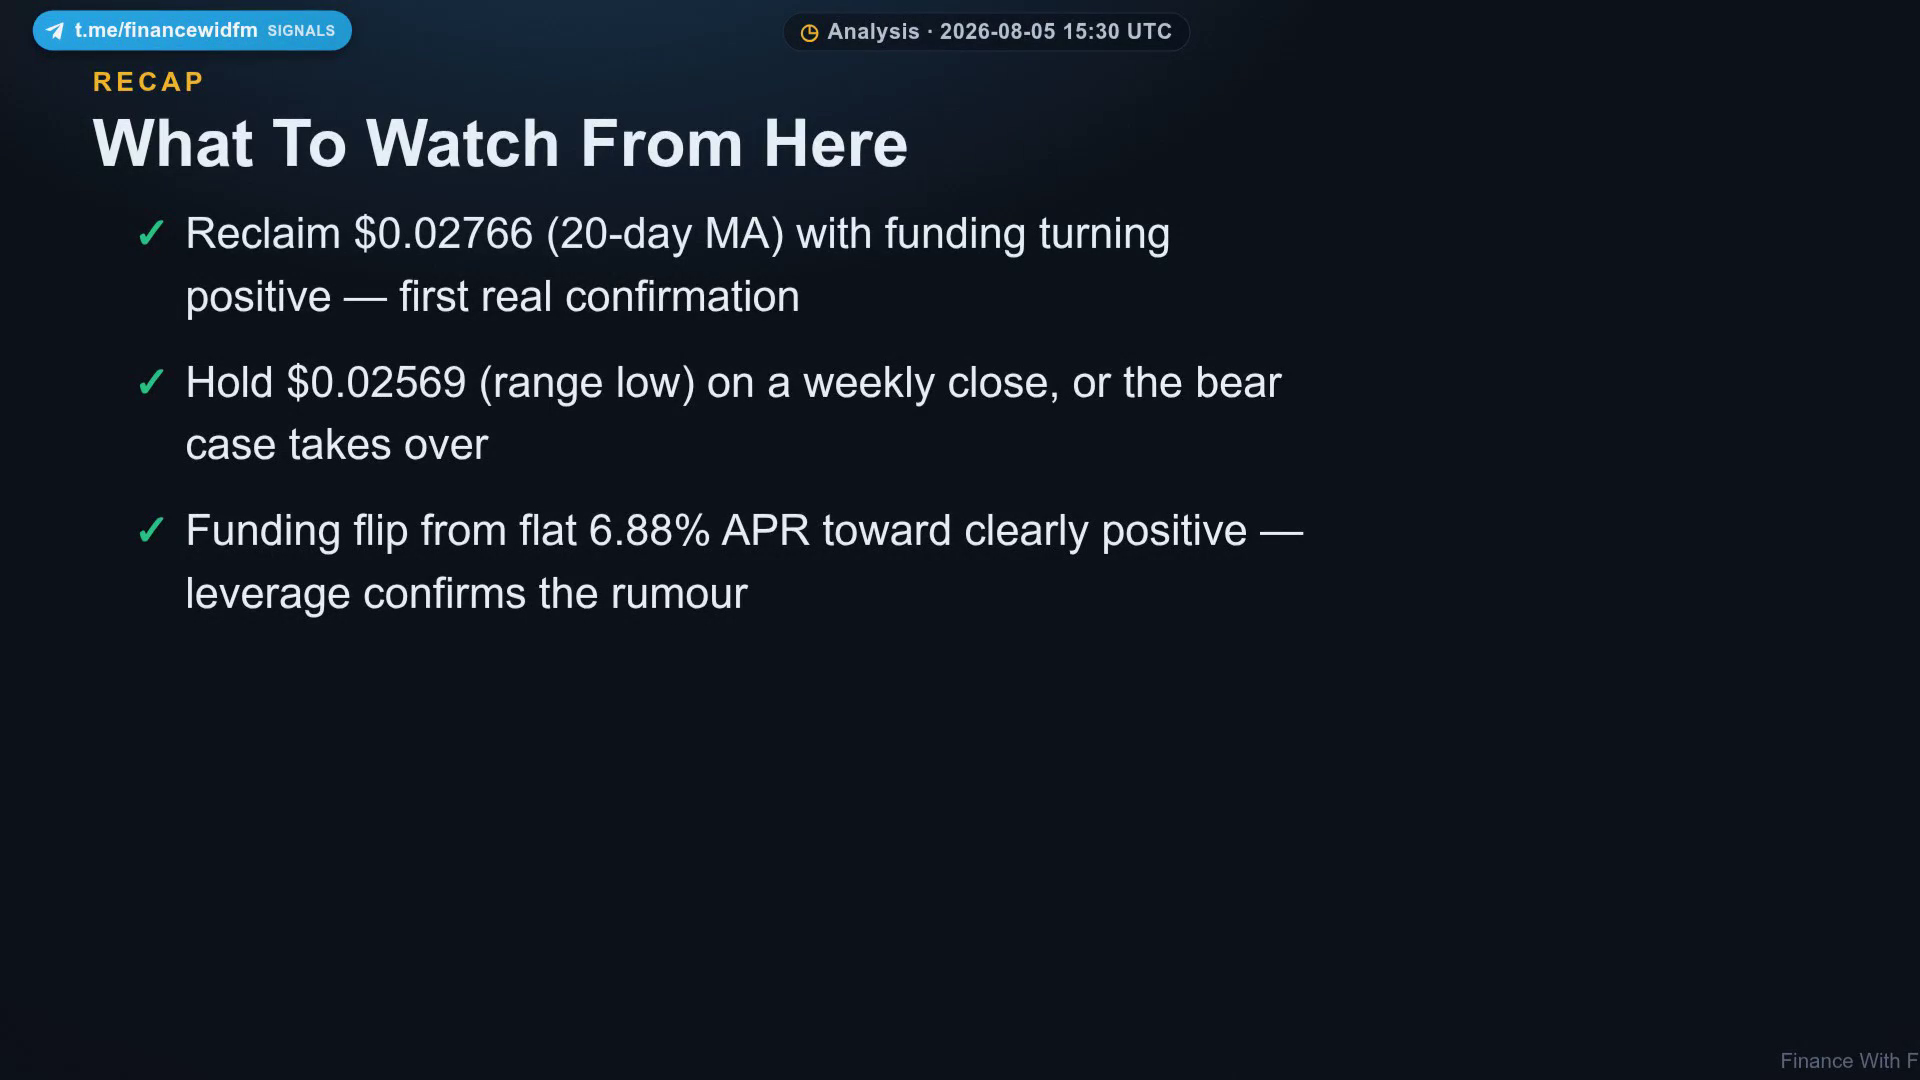
Here's what to actually watch.
- Does Kaspa reclaim the 20-day average at $0.02766 while funding turns positive — that's the first real confirmation the accumulation story is real.
- Does $0.02569 hold on a weekly close, or does that range low give way and prove the bear case instead.
- Watch funding itself — a flip from flat 6.88% toward clearly positive would be the leverage signal that turns rumour into confirmation.
This isn't a signal to buy or sell — it's a map, so you know exactly which level matters when it moves. If price clears $0.03225 with funding rising, the accumulation story graduates from rumour to confirmed trend. If $0.02569 breaks on a weekly close instead, the range resets lower and the whale narrative goes quiet fast.
Key takeaways
- Kaspa fell over 17% in a week, then bounced alongside Ethena and Quant as broader altcoin sentiment improved — that part is confirmed.
- Whale accumulation talk is currently a rumour, not fact — flat 6.88% funding and spot below the 20-day average show no leverage or price confirmation yet.
- The key levels: $0.02569 (range low), $0.02766 (20-day average), $0.03225 (200-day average), $0.03481 (range top).
- Reclaiming $0.02766 with rising funding is the first real technical sign the accumulation story is showing up in price.
- Losing $0.02569 on a weekly close flips the setup bearish regardless of the whale narrative.
Frequently asked questions
Why did Kaspa (KAS) drop 17% in a week?
The drop reflected broader altcoin weakness rather than a Kaspa-specific event; price later bounced alongside Ethena and Quant as sector-wide sentiment improved.
Is the Kaspa whale accumulation rumour true?
It's unconfirmed. There's no verified on-chain proof, and leverage data (flat 6.88% funding) doesn't show the bullish lean you'd expect if large wallets were aggressively buying.
What price does Kaspa need to reclaim to confirm a bullish shift?
The 20-day average at $0.02766 is the first test; the 200-day average at $0.03225 is the bigger resistance wall that needs to break for the bullish structure to fully confirm.
What level would confirm the bearish case for Kaspa?
A weekly close below the range low of $0.02569 would signal the bear case is taking over.
What are current Kaspa price predictions for August 2026?
Forecasting models put near-term upside between roughly $0.029 and $0.040, with several clustering near $0.03–$0.032.