
Analysis
NVDA Coils Near All-Time Highs: Breakout or Fakeout?
Nvidia Is Sitting Right on the Edge of History
Nvidia is doing something it hasn't done in months: coiling directly beneath its all-time high with real conviction behind it. The stock recently pushed to a fresh record, capping a long stretch of consolidation, and Wall Street's attention is now split between two narratives — either this is the launchpad for the next leg higher, or it's a classic fakeout before a deeper pullback.
The timing matters. Nvidia reports hyperscaler-driven earnings later this month, and options markets are already pricing in elevated volatility around the print. Analysts covering the stock are split between a straightforward retest-and-breakout scenario and a more cautious view that gains could stall until guidance clears the air.
Daily Structure: A Clean Higher Low, Then a Grind to Resistance
Zooming out on the daily chart, Nvidia carved a clean higher low near $164 back in April, then rallied hard into a swing high of $236.26 in May. Since then, price has chopped sideways inside a well-defined range — not a breakdown, just digestion after a strong run.
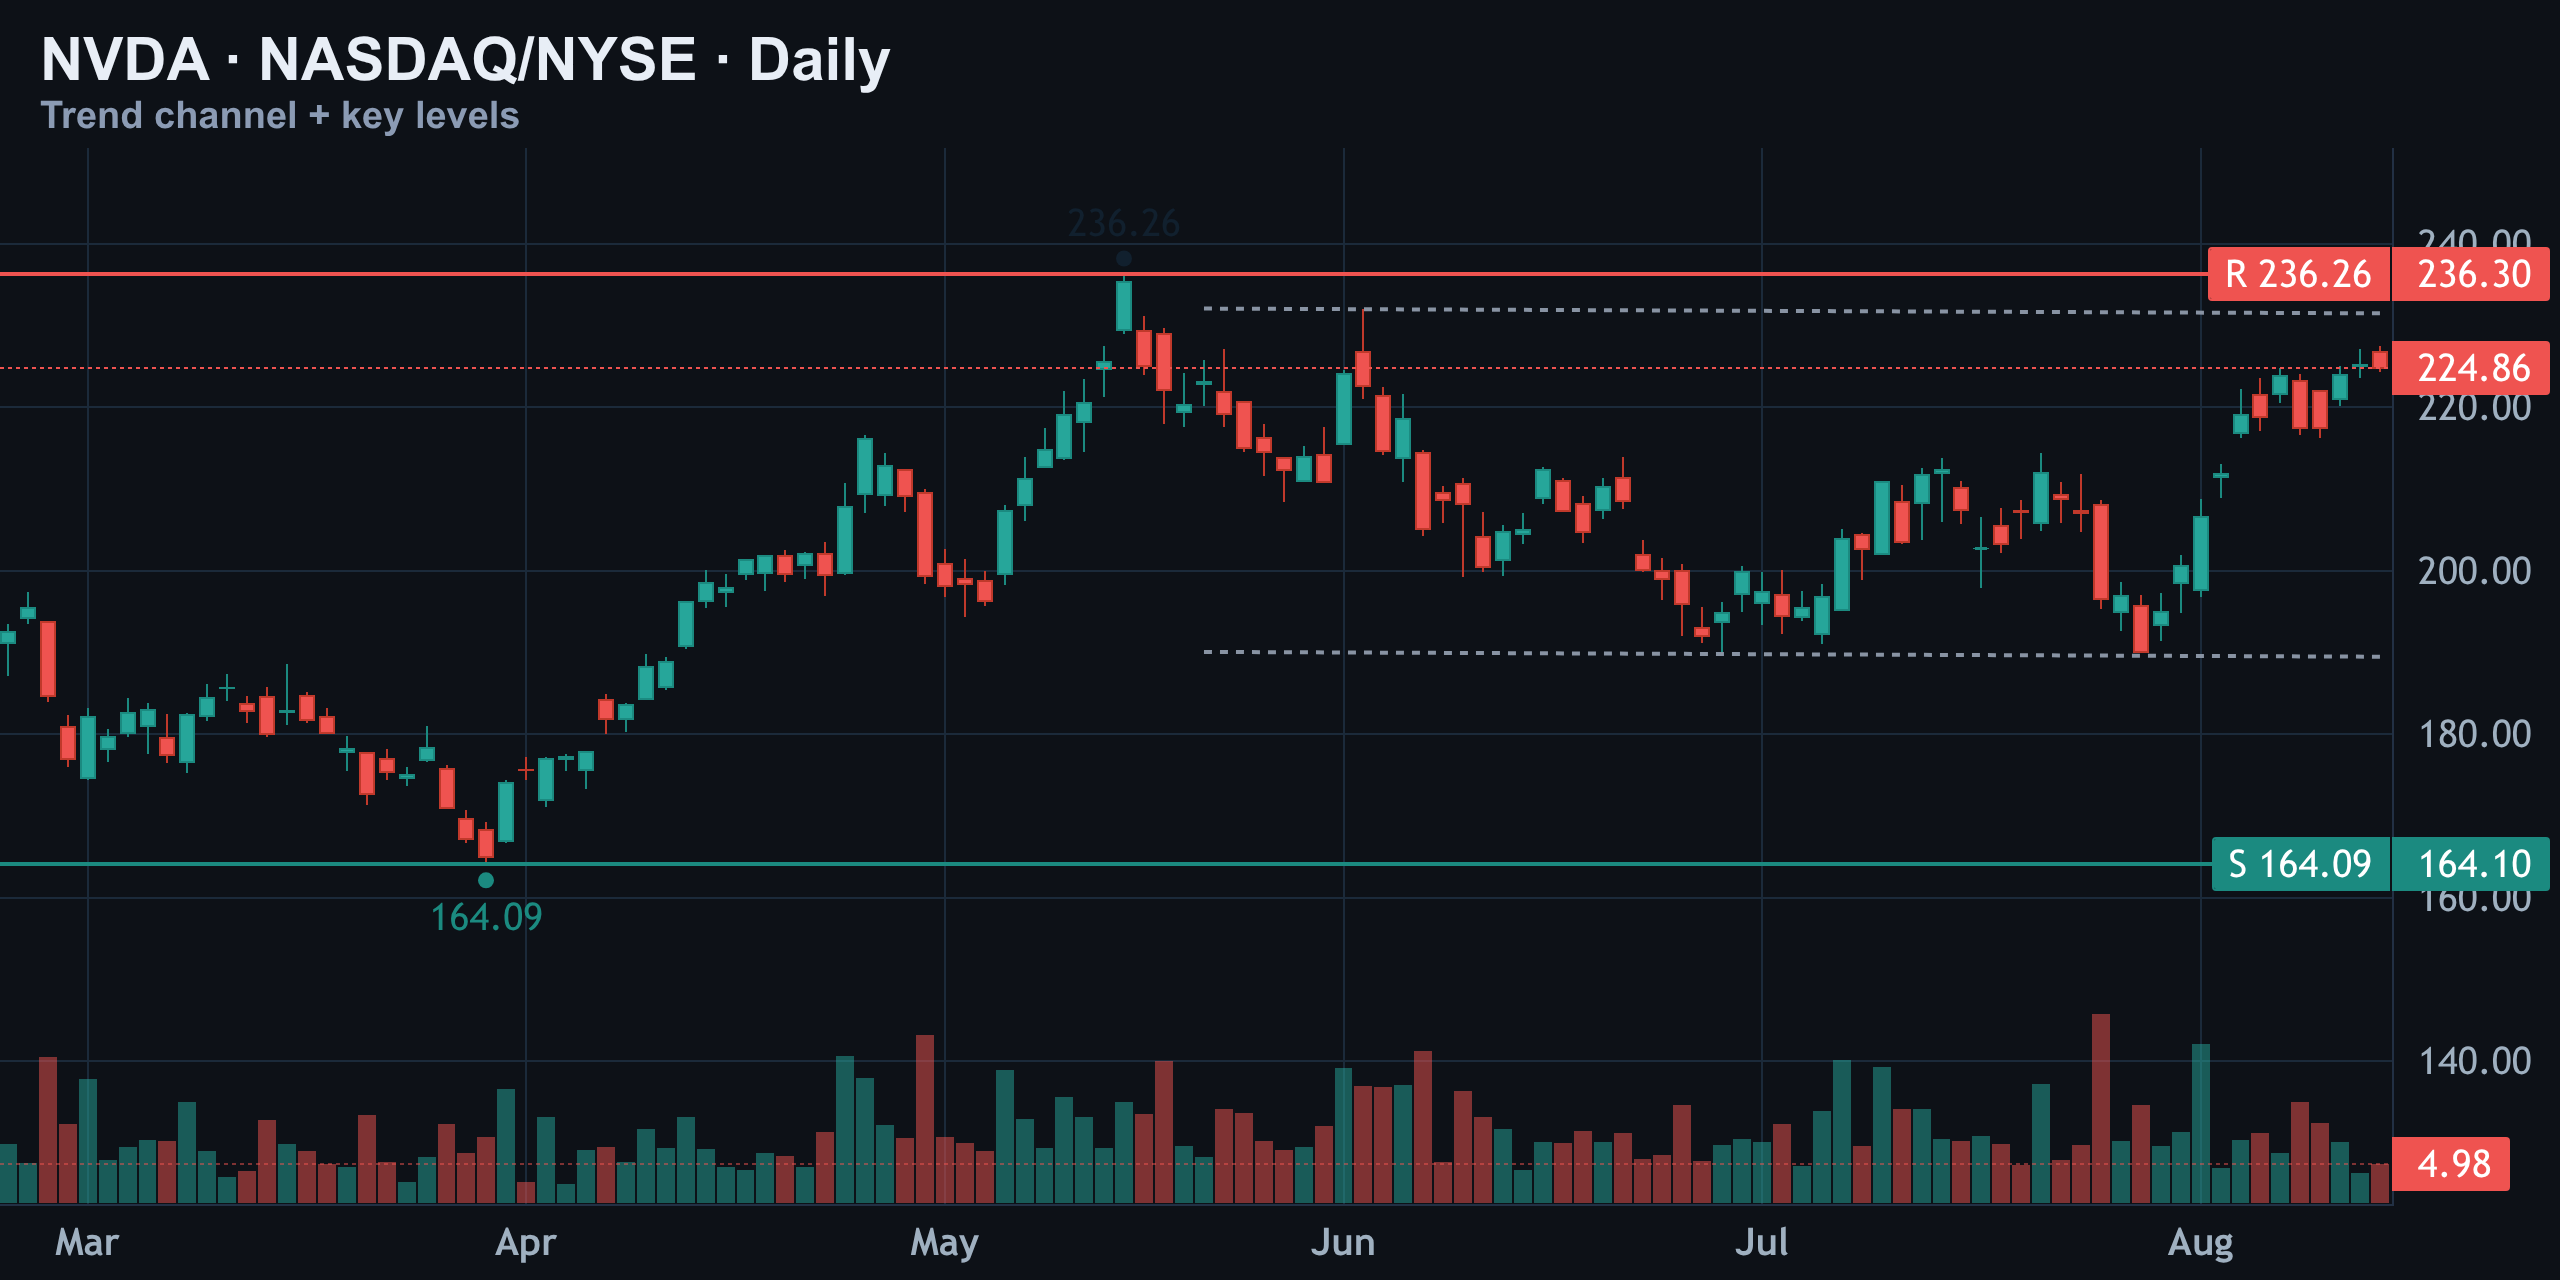
What's notable is the last few sessions: buyers have stepped back in with purpose, pushing the stock right up against the $224.86 resistance shelf. That's not random noise — it's the same zone that capped multiple prior attempts, which is exactly why a decisive close above it would carry weight.
1-Hour Structure: A Textbook Rising Channel
Drop down to the hourly timeframe and the picture gets even cleaner. Since the end of July, Nvidia has been carving a textbook rising channel. Price dipped to around $190, then built a steady staircase of higher lows and higher highs, riding the bottom trendline support all the way up to test $224.86 again.
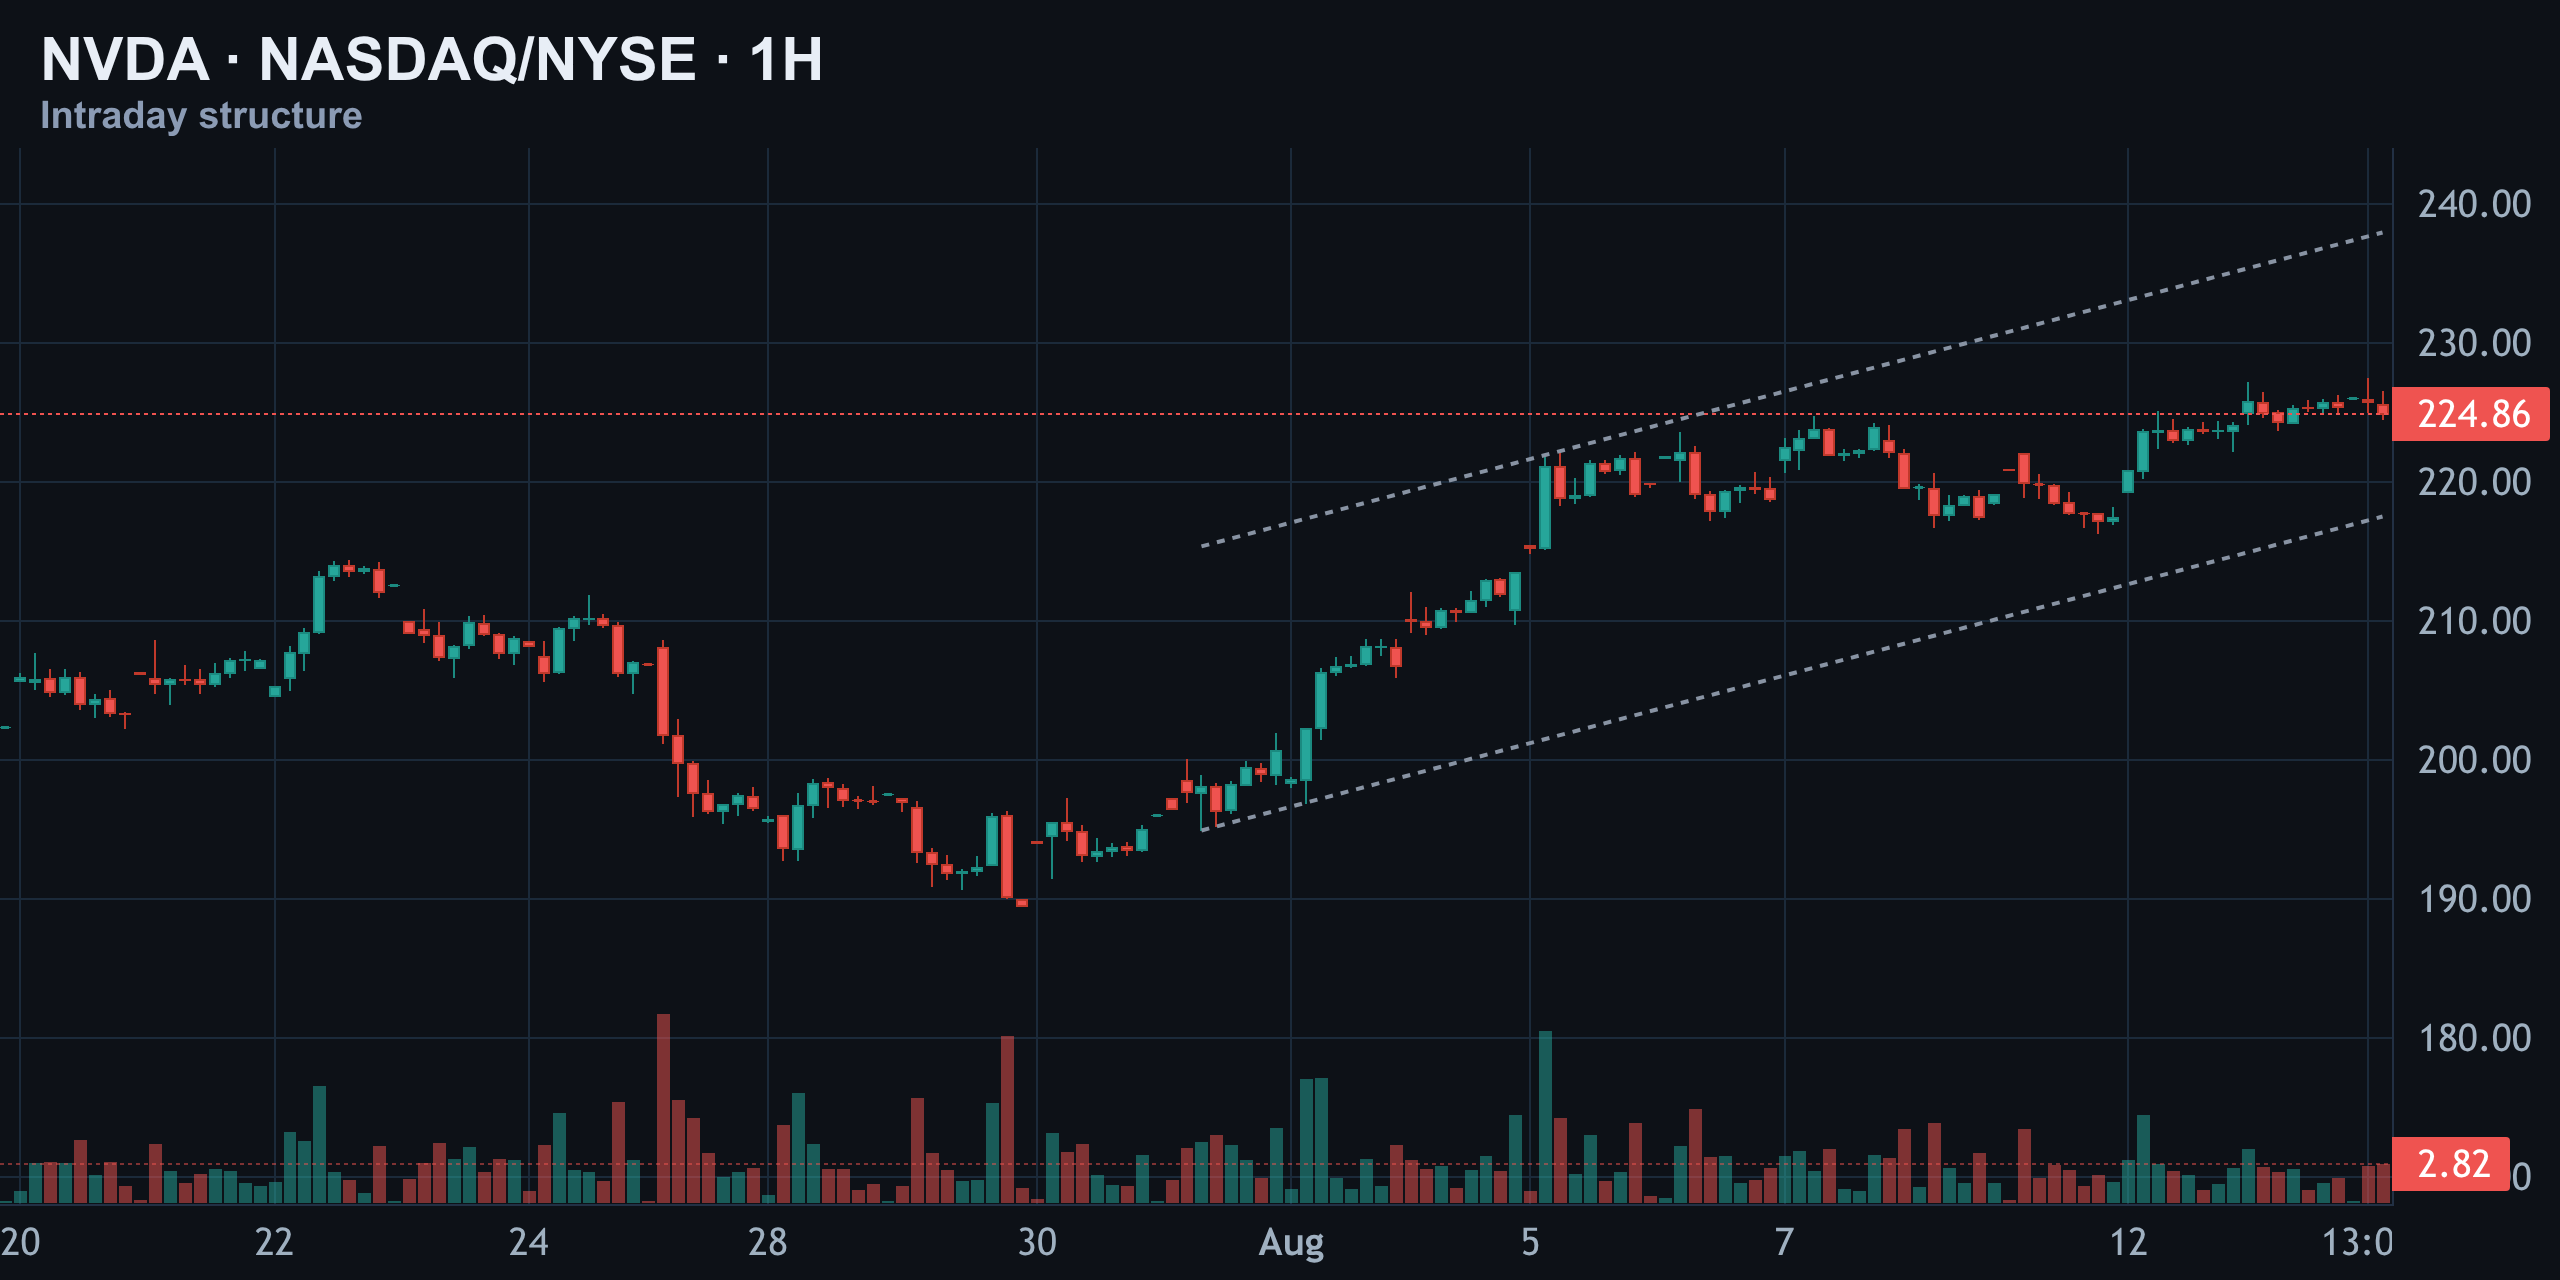
This is healthy, controlled buying — not a blow-off spike. Blow-off tops tend to be vertical and euphoric; this move is methodical, with dips being bought in an orderly staircase pattern. That distinction matters for anyone trying to gauge whether the current strength has real legs or is running out of gas.
Weekly Elliott Wave: Are We in the Final Stage of a Correction?
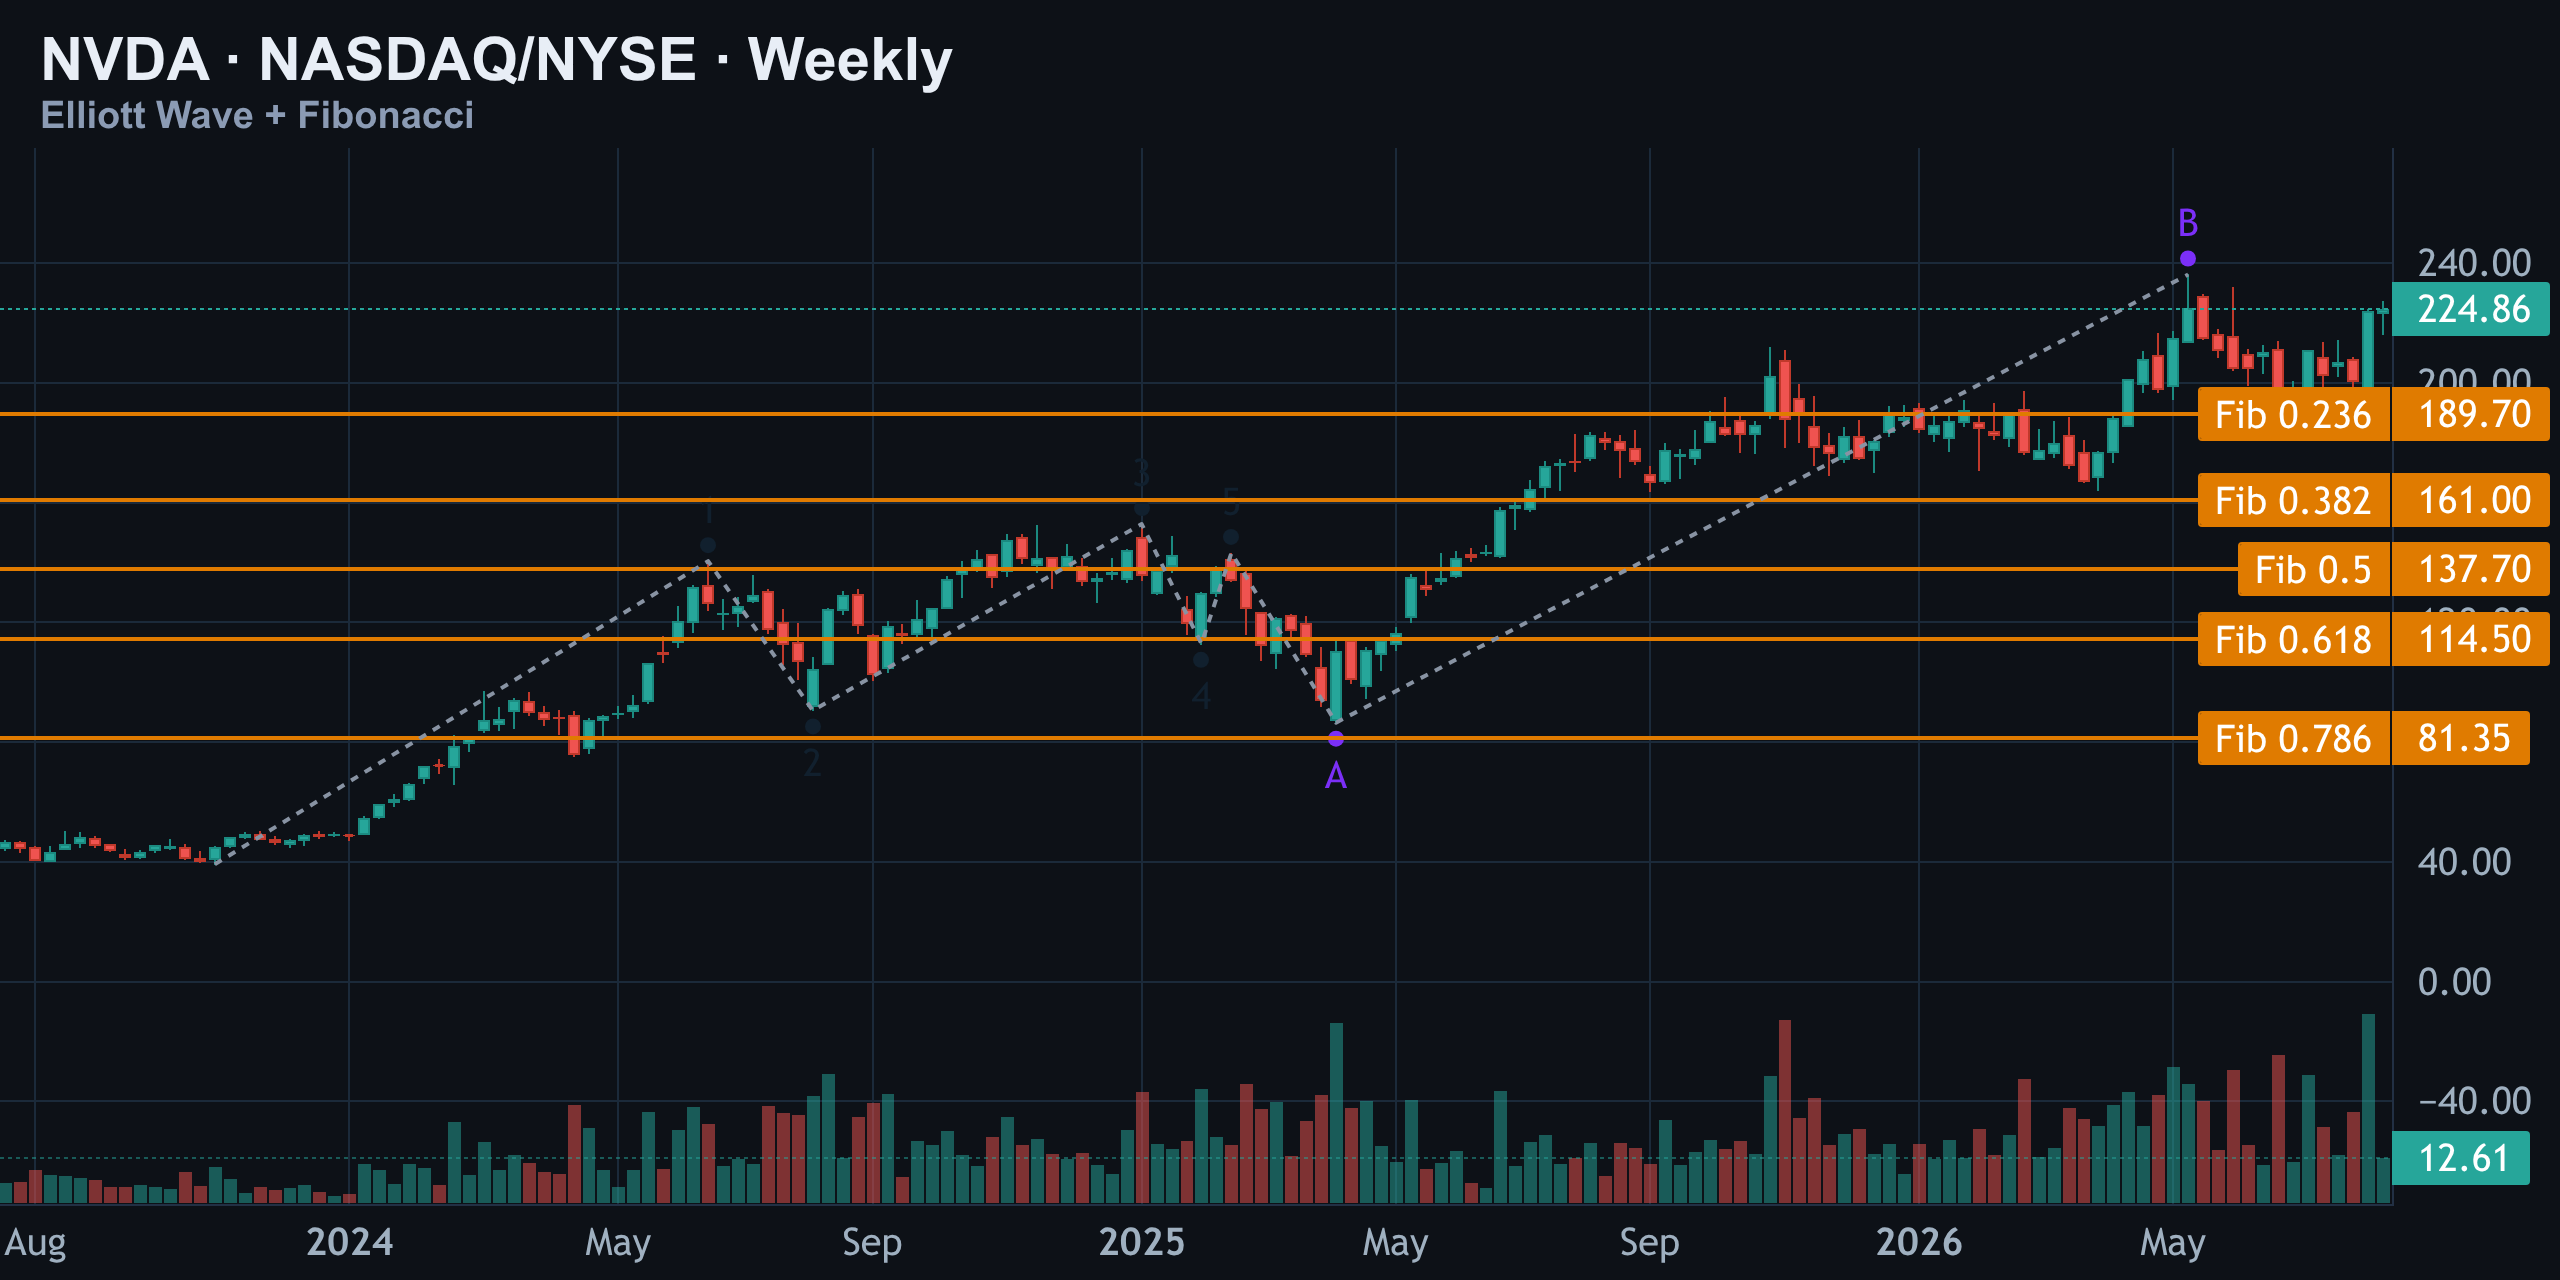
The weekly Elliott Wave count adds a layer of nuance that pure price action alone doesn't capture. It shows a completed five-wave impulse — from wave 1 at $140.48 through wave 5 at $143.21 — followed by an A-B-C correction. Wave A bottomed near $86.50, and wave B just topped out at $236.26, which also happens to be the stock's all-time high.
Wave Count & Scenarios
| Scenario | Trigger | Implication |
|---|---|---|
| Bearish (Wave C ahead) | Rejection below $236.26 | Correction continues; downside targets in the $161–$114.50 fibonacci zone |
| Bullish (correction over) | Convincing close above $236 | Wave B invalidated; fresh impulsive leg higher begins |
| Base case (current) | Price coiling under $225–$236 | Market undecided; range persists until a breakout confirms direction |
If the corrective count is correct, this looks like the tail end of wave B in a larger A-B-C structure, with wave B topping right at the old all-time high. In that scenario, a wave C move lower could eventually test the fibonacci zones between $161 and $114.50. But if price pushes convincingly above $236, the correction may already be over, and a fresh impulsive leg higher could be starting. This is the single biggest swing factor for anyone positioning with a multi-week or multi-month horizon.
Moving Averages, RSI, and MACD: The Trend Signals Line Up Bullish
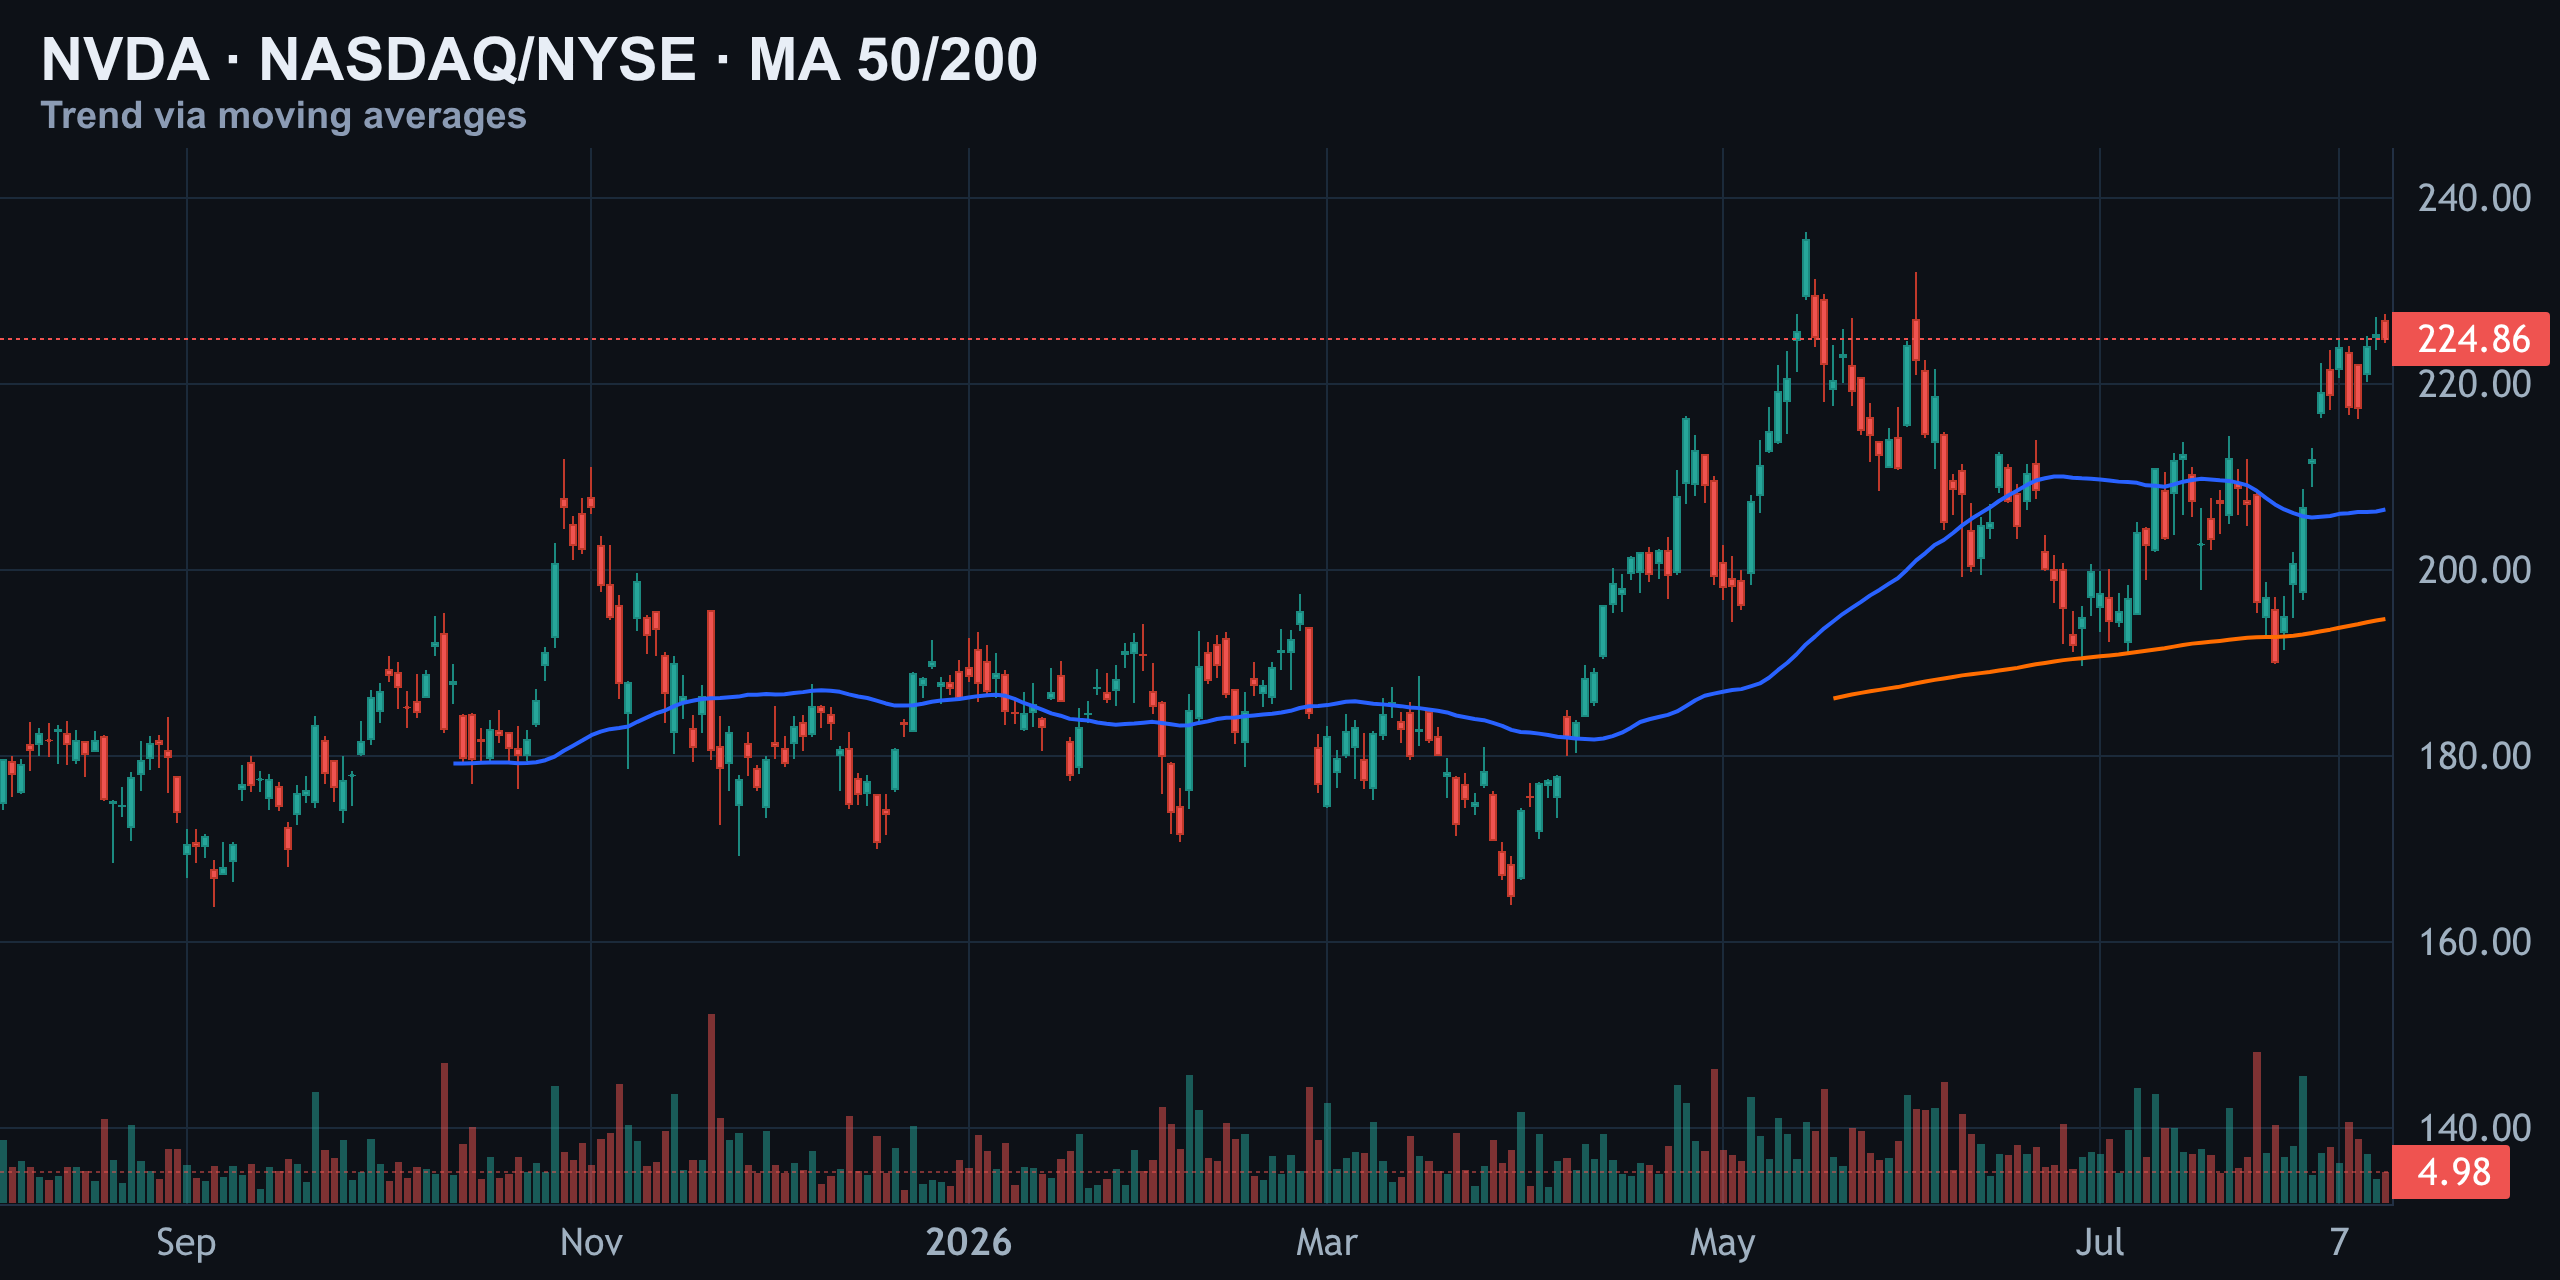
Strip away the wave theory and options jargon for a moment, and the plain-vanilla trend indicators tell a fairly consistent story: this is a market in an uptrend, not one breaking down.
| Indicator | Reading | Signal |
|---|---|---|
| Price vs. 50-day MA | $224.86 vs. $206.49 | Bullish — trading above |
| Price vs. 200-day MA | $224.86 vs. $194.74 | Bullish — trading above |
| RSI (14) | 63 | Neutral, leaning bullish (not yet overbought) |
| MACD | Above signal line, histogram positive | Bullish momentum confirmed |
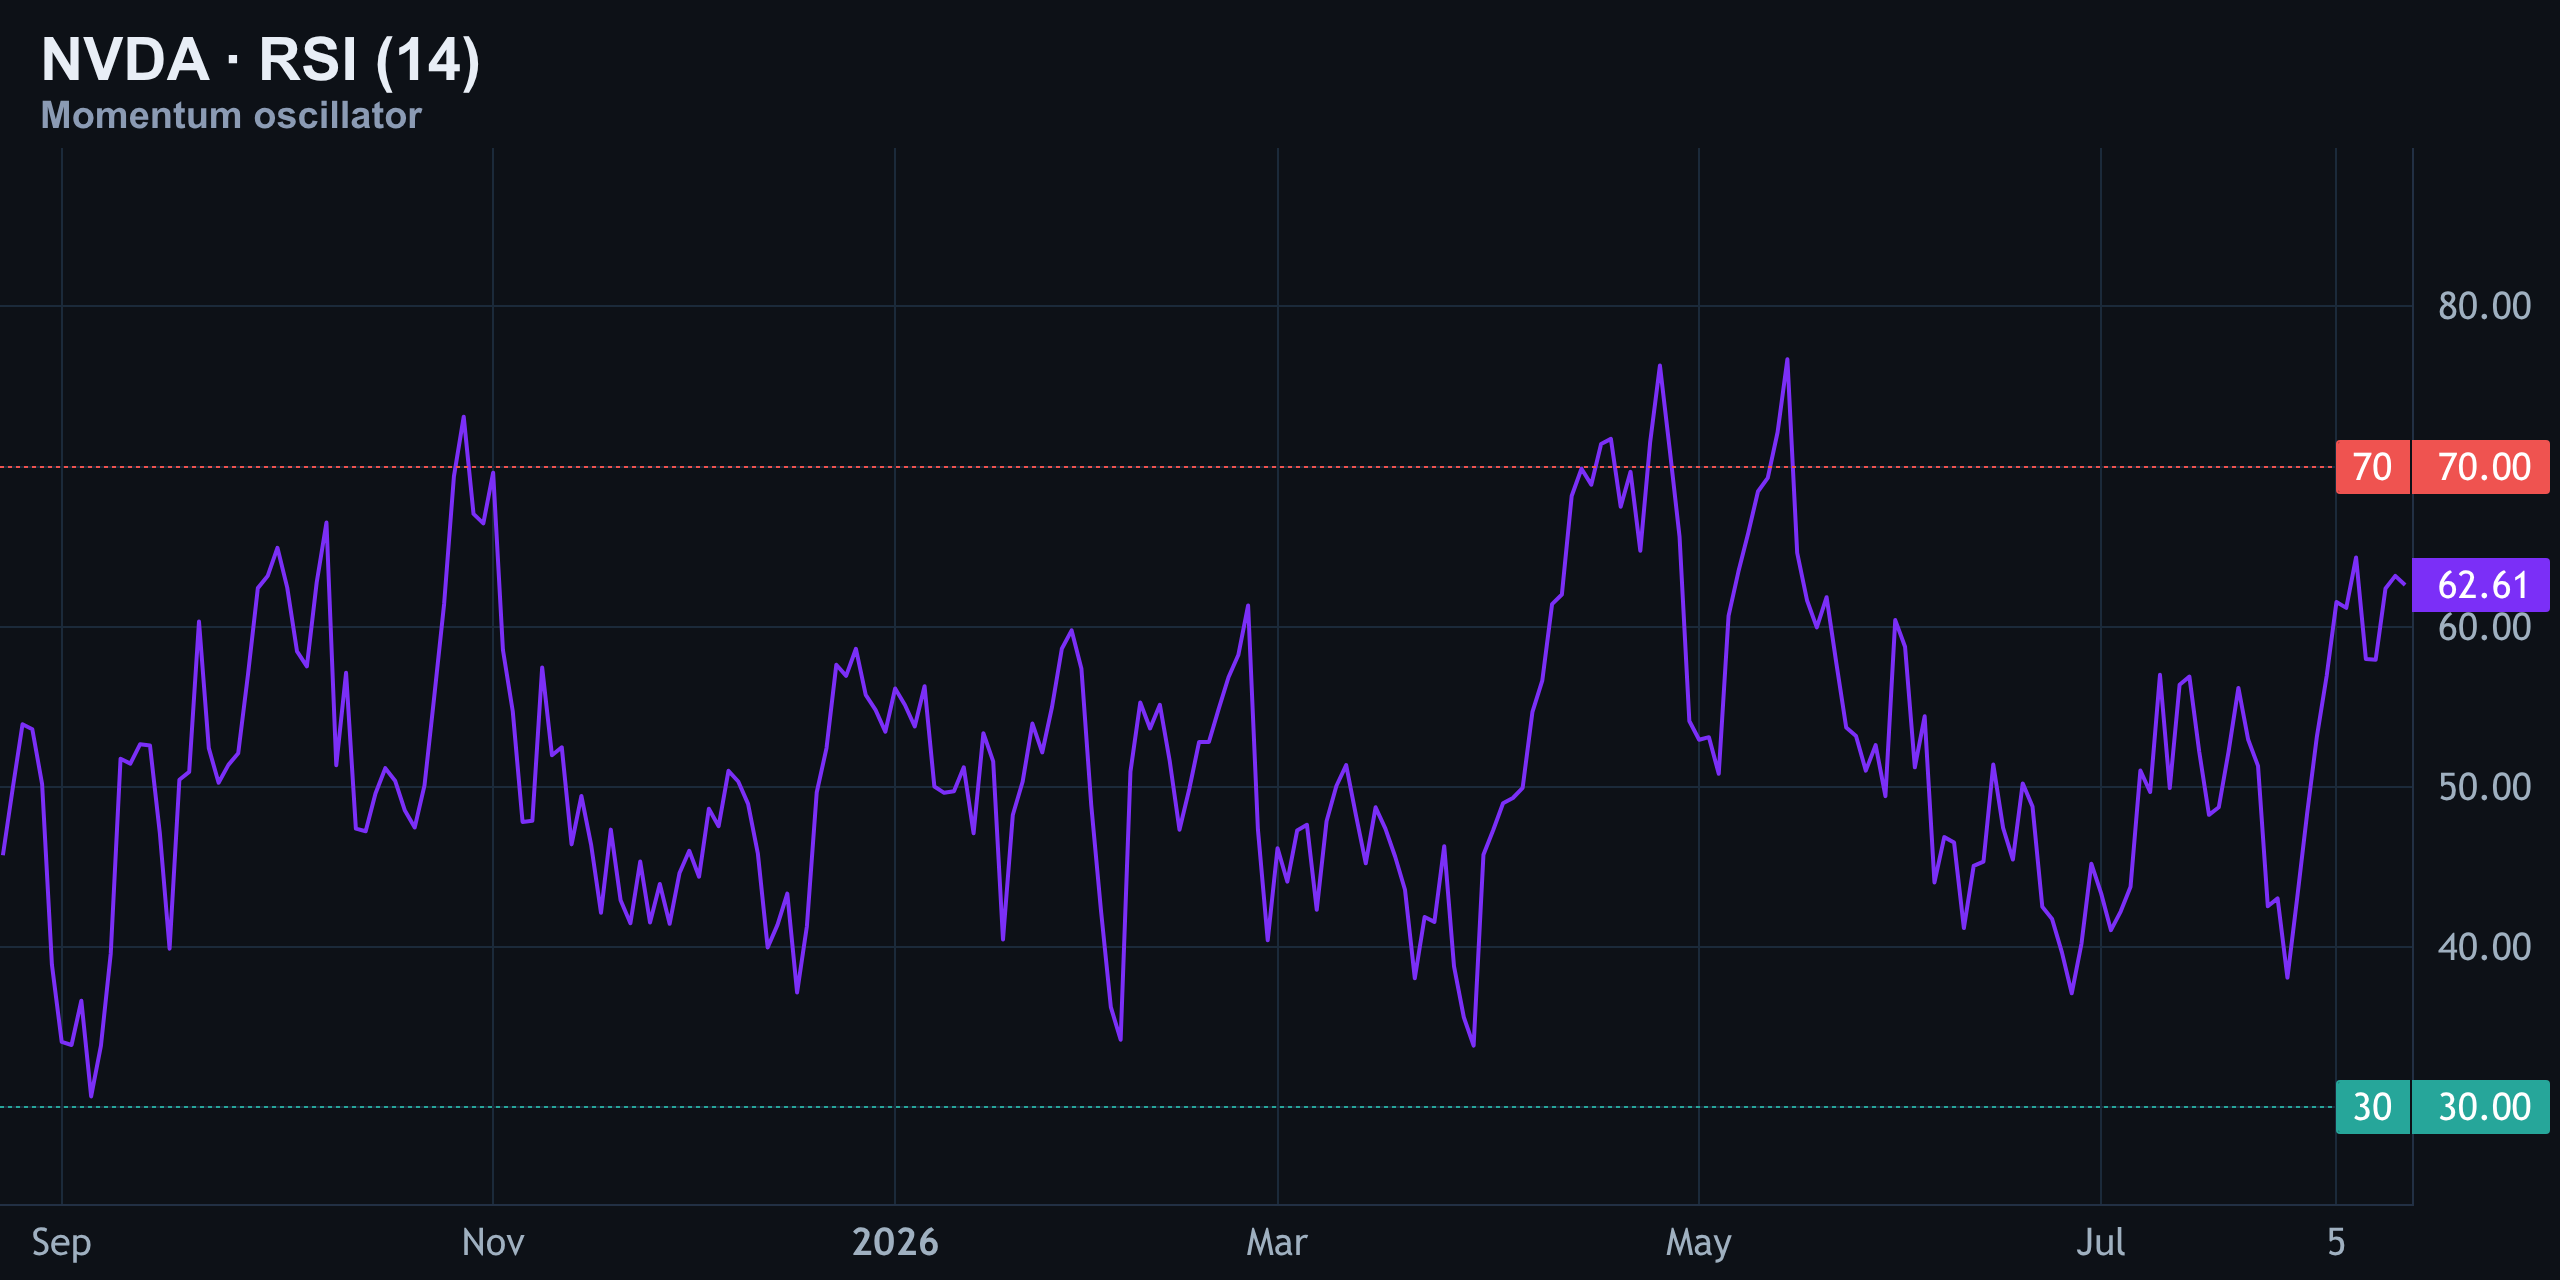
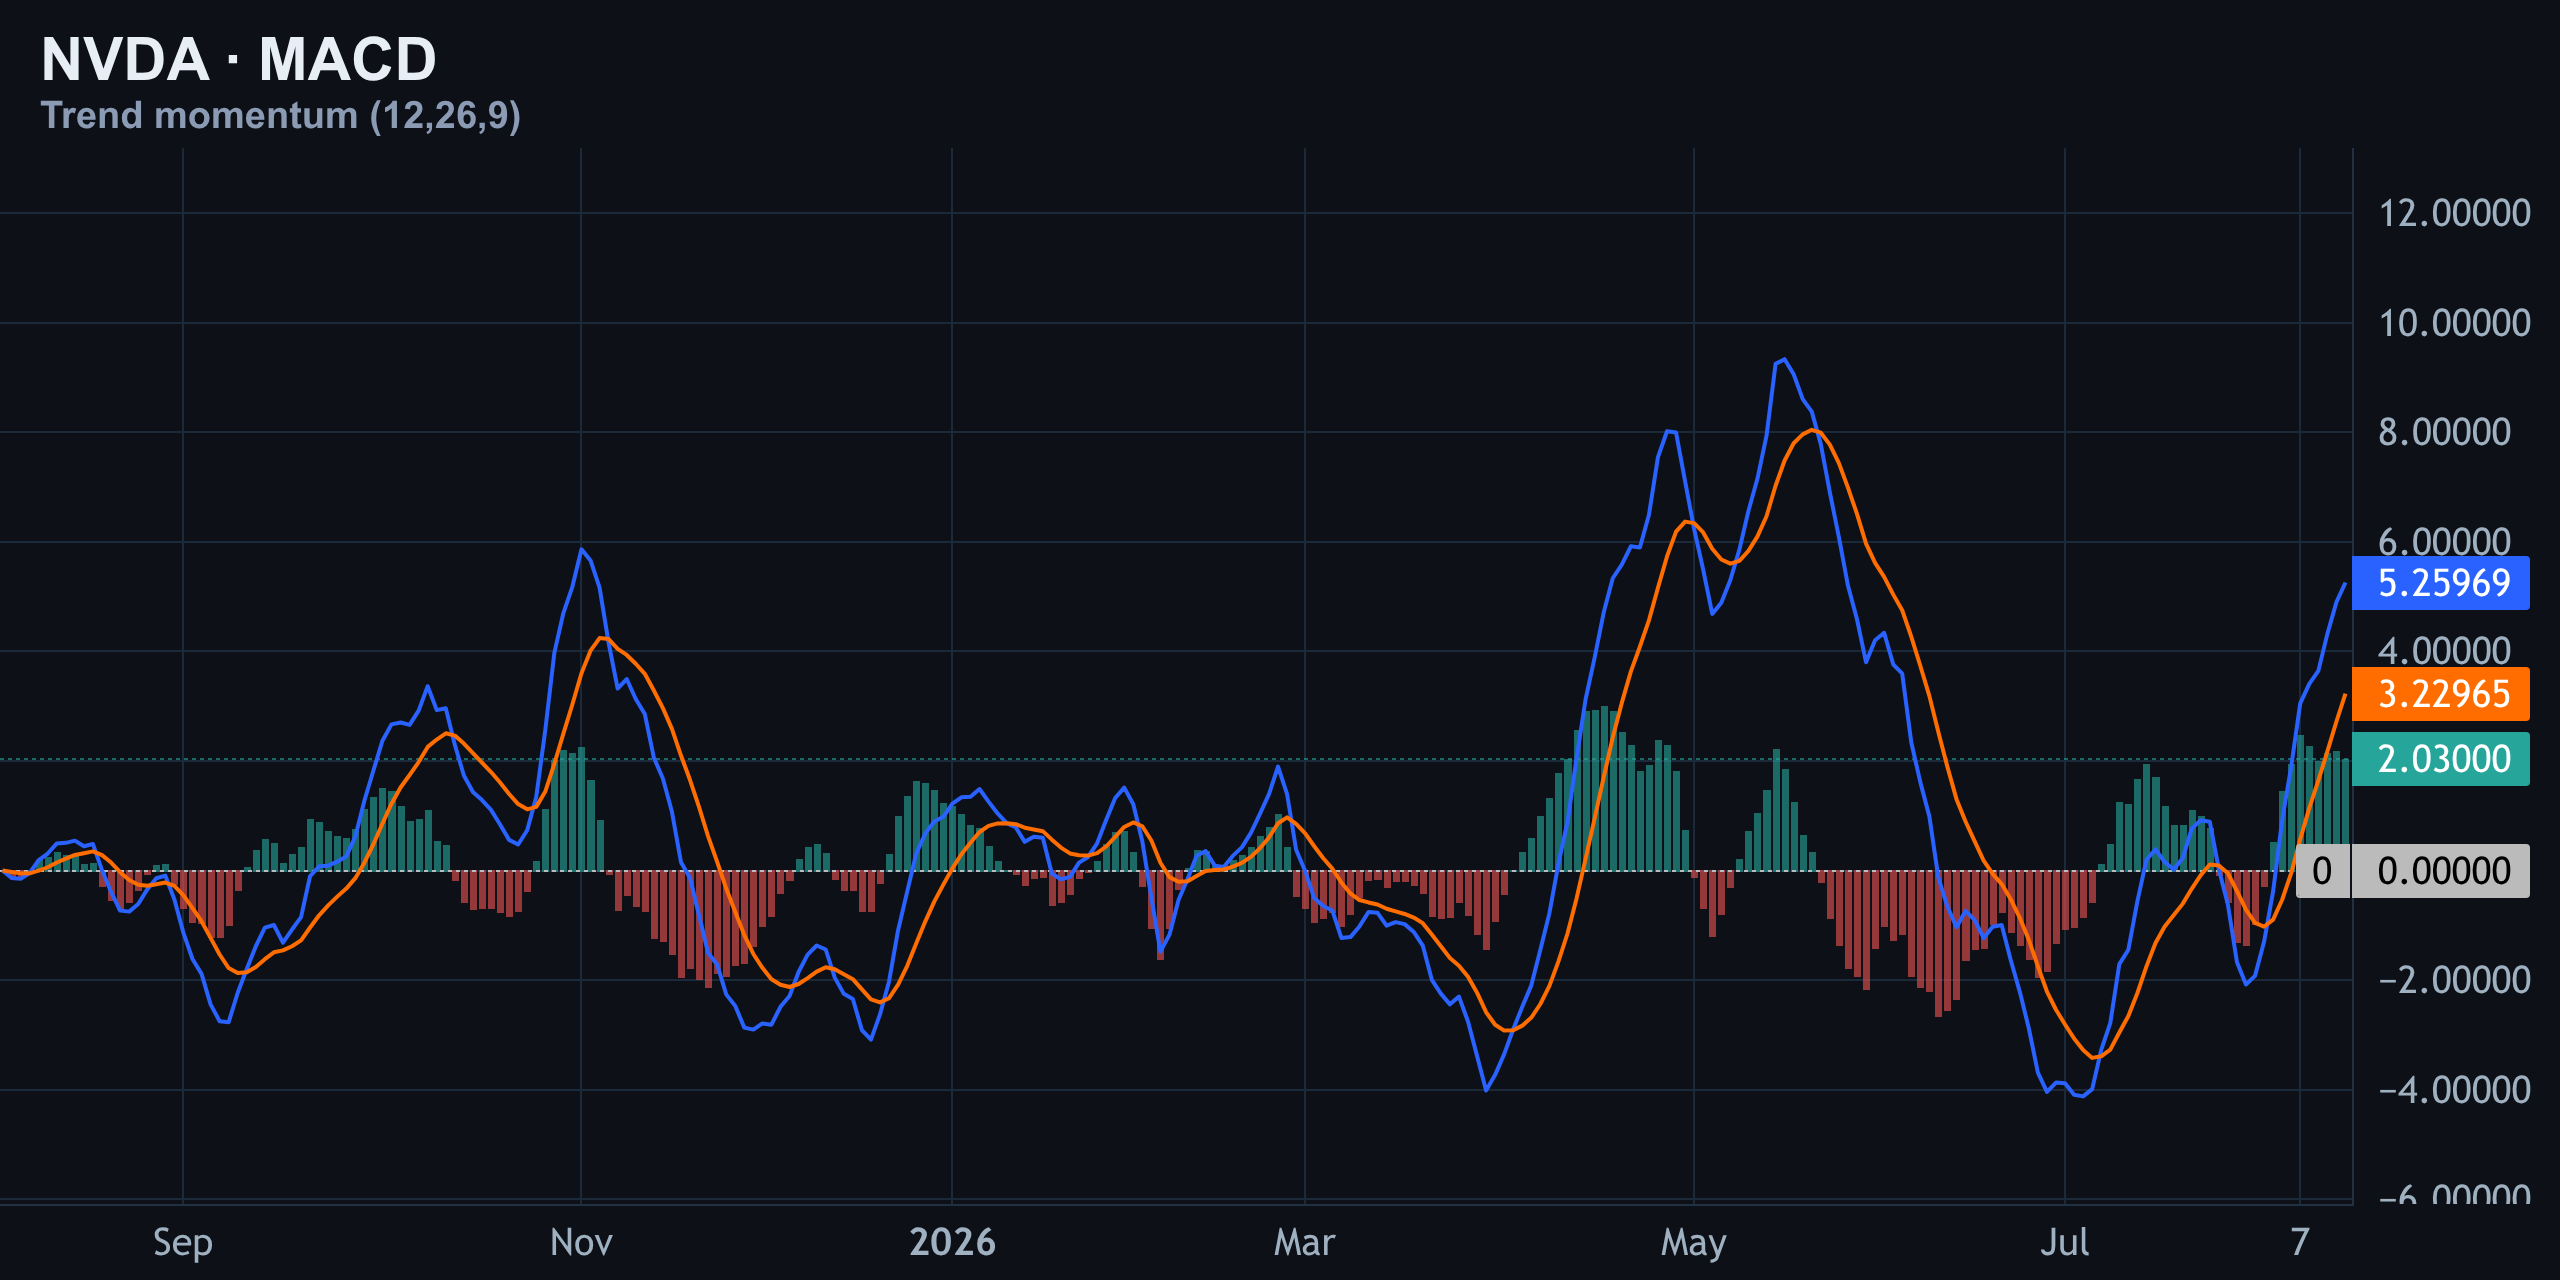
The RSI reading of 63 is the standout detail here. It's firmly bullish territory without being stretched — there's no glaring overbought signal screaming for an immediate pullback. Combined with a positive MACD histogram, the momentum backdrop supports continuation rather than exhaustion, at least on a trend-following basis.
The Institutional Edge: What Options Gamma Is Telling Us
This is where the story gets more interesting — and more actionable for short-term traders. Options positioning shows positive dealer gamma, with the flip point at $220. That means dealers are actively dampening moves above that line by selling into rallies and buying into dips, which tends to compress volatility and keep price pinned in a range.
Heavy call gamma at $225 is acting like a lid on the market — a wall of hedging flow that has capped every rally attempt so far. On the other side, put gamma at $205 forms a floor, giving dealers a reason to step in and buy if price slips that far.
If bulls manage to push through the $225 call wall, the setup below could flip from a slow grind into a fast, dealer-fueled gap higher — because once dealers are forced to buy back their hedges above that strike, the move can accelerate quickly. As long as price holds above the $220 zero-gamma flip, dealers keep buying dips and the bullish structure stays intact.
Levels to Watch: The Complete Map
Pulling every layer of this analysis together — daily structure, hourly channel, Elliott Wave, and options gamma — gives a clear map of the levels that matter most right now.
| Level | Price | What It Represents |
|---|---|---|
| All-time high ceiling | $236.26 | Bigger structural resistance; wave B top |
| Call wall resistance | $225.00 | Immediate options resistance / gamma lid |
| Current price | $224.86 | Testing resistance shelf directly |
| Zero-gamma flip | $220.00 | Line between dealer-suppressed and dealer-amplified moves |
| Put gamma floor | $205.00 | Options-driven support zone |
| 50-day MA | $206.49 | Trend support |
| 200-day MA | $194.74 | Longer-term trend support |
| April structural low | $164.09 | Deeper structural support |
Every one of these levels has a job to do. Above $225, dealer hedging flips from a headwind to a tailwind, which is precisely why that strike is the line in the sand for a genuine breakout rather than another failed poke at resistance.
The Takeaway: Coiled Spring, Not a Coin Flip
Nvidia is coiling right beneath its all-time high with bullish trend signals across the board — price above both major moving averages, positive MACD momentum, and an RSI with room to run — but a heavy options wall is capping the immediate upside. That's not a contradiction; it's exactly what a healthy pre-breakout setup often looks like.
- Trend structure (daily, hourly, MAs, MACD) all lean bullish
- Elliott Wave count leaves open a corrective scenario if $236.26 doesn't break
- Options gamma at $225 is the immediate gatekeeper for a fast move higher
- A close below $220 would hand control back to dealers hedging downside, opening a path toward the $205 floor
The earnings print later this month adds another layer of uncertainty, with some analysts expecting the update to reignite the rally and others flagging that gains may need guidance confirmation first. Watch how price reacts at $225 and $236.26 for the next directional clue — those two levels, more than any single indicator, will decide whether this coil breaks out or fakes out.
Key takeaways
- NVDA trades above both its 50-day ($206.49) and 200-day ($194.74) moving averages, confirming an intact uptrend.
- A heavy call gamma wall at $225 is the immediate ceiling; a break above could trigger a fast dealer-driven gap higher.
- Elliott Wave analysis leaves open a corrective scenario (wave C) unless price closes convincingly above the $236.26 all-time high.
- The zero-gamma flip at $220 and put floor at $205 are the key downside levels if bullish momentum stalls.
- RSI at 63 and a positive MACD histogram show healthy, non-overbought momentum heading into this month's earnings print.
Frequently asked questions
What is the key resistance level for NVDA stock right now?
The immediate resistance is the $225 call gamma wall, with the bigger structural ceiling at the $236.26 all-time high set in May.
Is NVDA stock currently bullish or bearish?
The overall bias is bullish — price trades above both the 50-day and 200-day moving averages with positive MACD momentum — though a heavy options wall at $225 is capping near-term upside.
What happens if NVDA breaks above $225?
A close above the $225 call wall could trigger accelerated dealer hedging flow, potentially turning a slow grind into a fast gap toward the $236.26 all-time high.
What is the zero-gamma flip level for NVDA?
The zero-gamma flip sits at $220. Above this level, dealers tend to buy dips and dampen volatility; below it, hedging flows can amplify downside moves.
Could NVDA still fall based on the Elliott Wave count?
Yes. If the current rally is wave B of a larger A-B-C correction, a failure to close above $236.26 could open the door to a wave C decline toward the $161–$114.50 fibonacci zone.