
Analysis
XCN Daily Pulse July 27: Third-Cent Standoff Continues
Where XCN Stands Right Now
Onyxcoin (XCN) is trading around $0.00352, essentially flat on the session after slipping roughly half a percent since yesterday's call. That's a quiet number on the surface, but the chart underneath it is anything but settled. Independent trackers currently peg XCN between $0.0034 and $0.0035 with a market cap in the $130–137 million range, confirming the coin is hovering right at the same third-of-a-cent pivot we flagged a day ago.
This is the fourth straight session Onyxcoin has spent boxed inside a falling channel, and today's price action does nothing to break that pattern. Below, we walk through every timeframe — fifteen-minute, four-hour, daily — plus the momentum readings and the liquidation map that ties it all together.
15-Minute Chart: Lower Highs Inside the Falling Channel
Zoom into the fifteen-minute chart and the story is discipline, not chaos. Onyxcoin has printed a clean run of lower highs since yesterday's spike near $0.00358, with each bounce weaker than the last. The dashed channel on the chart has held for over twelve hours — every touch of the upper rail gets sold into.
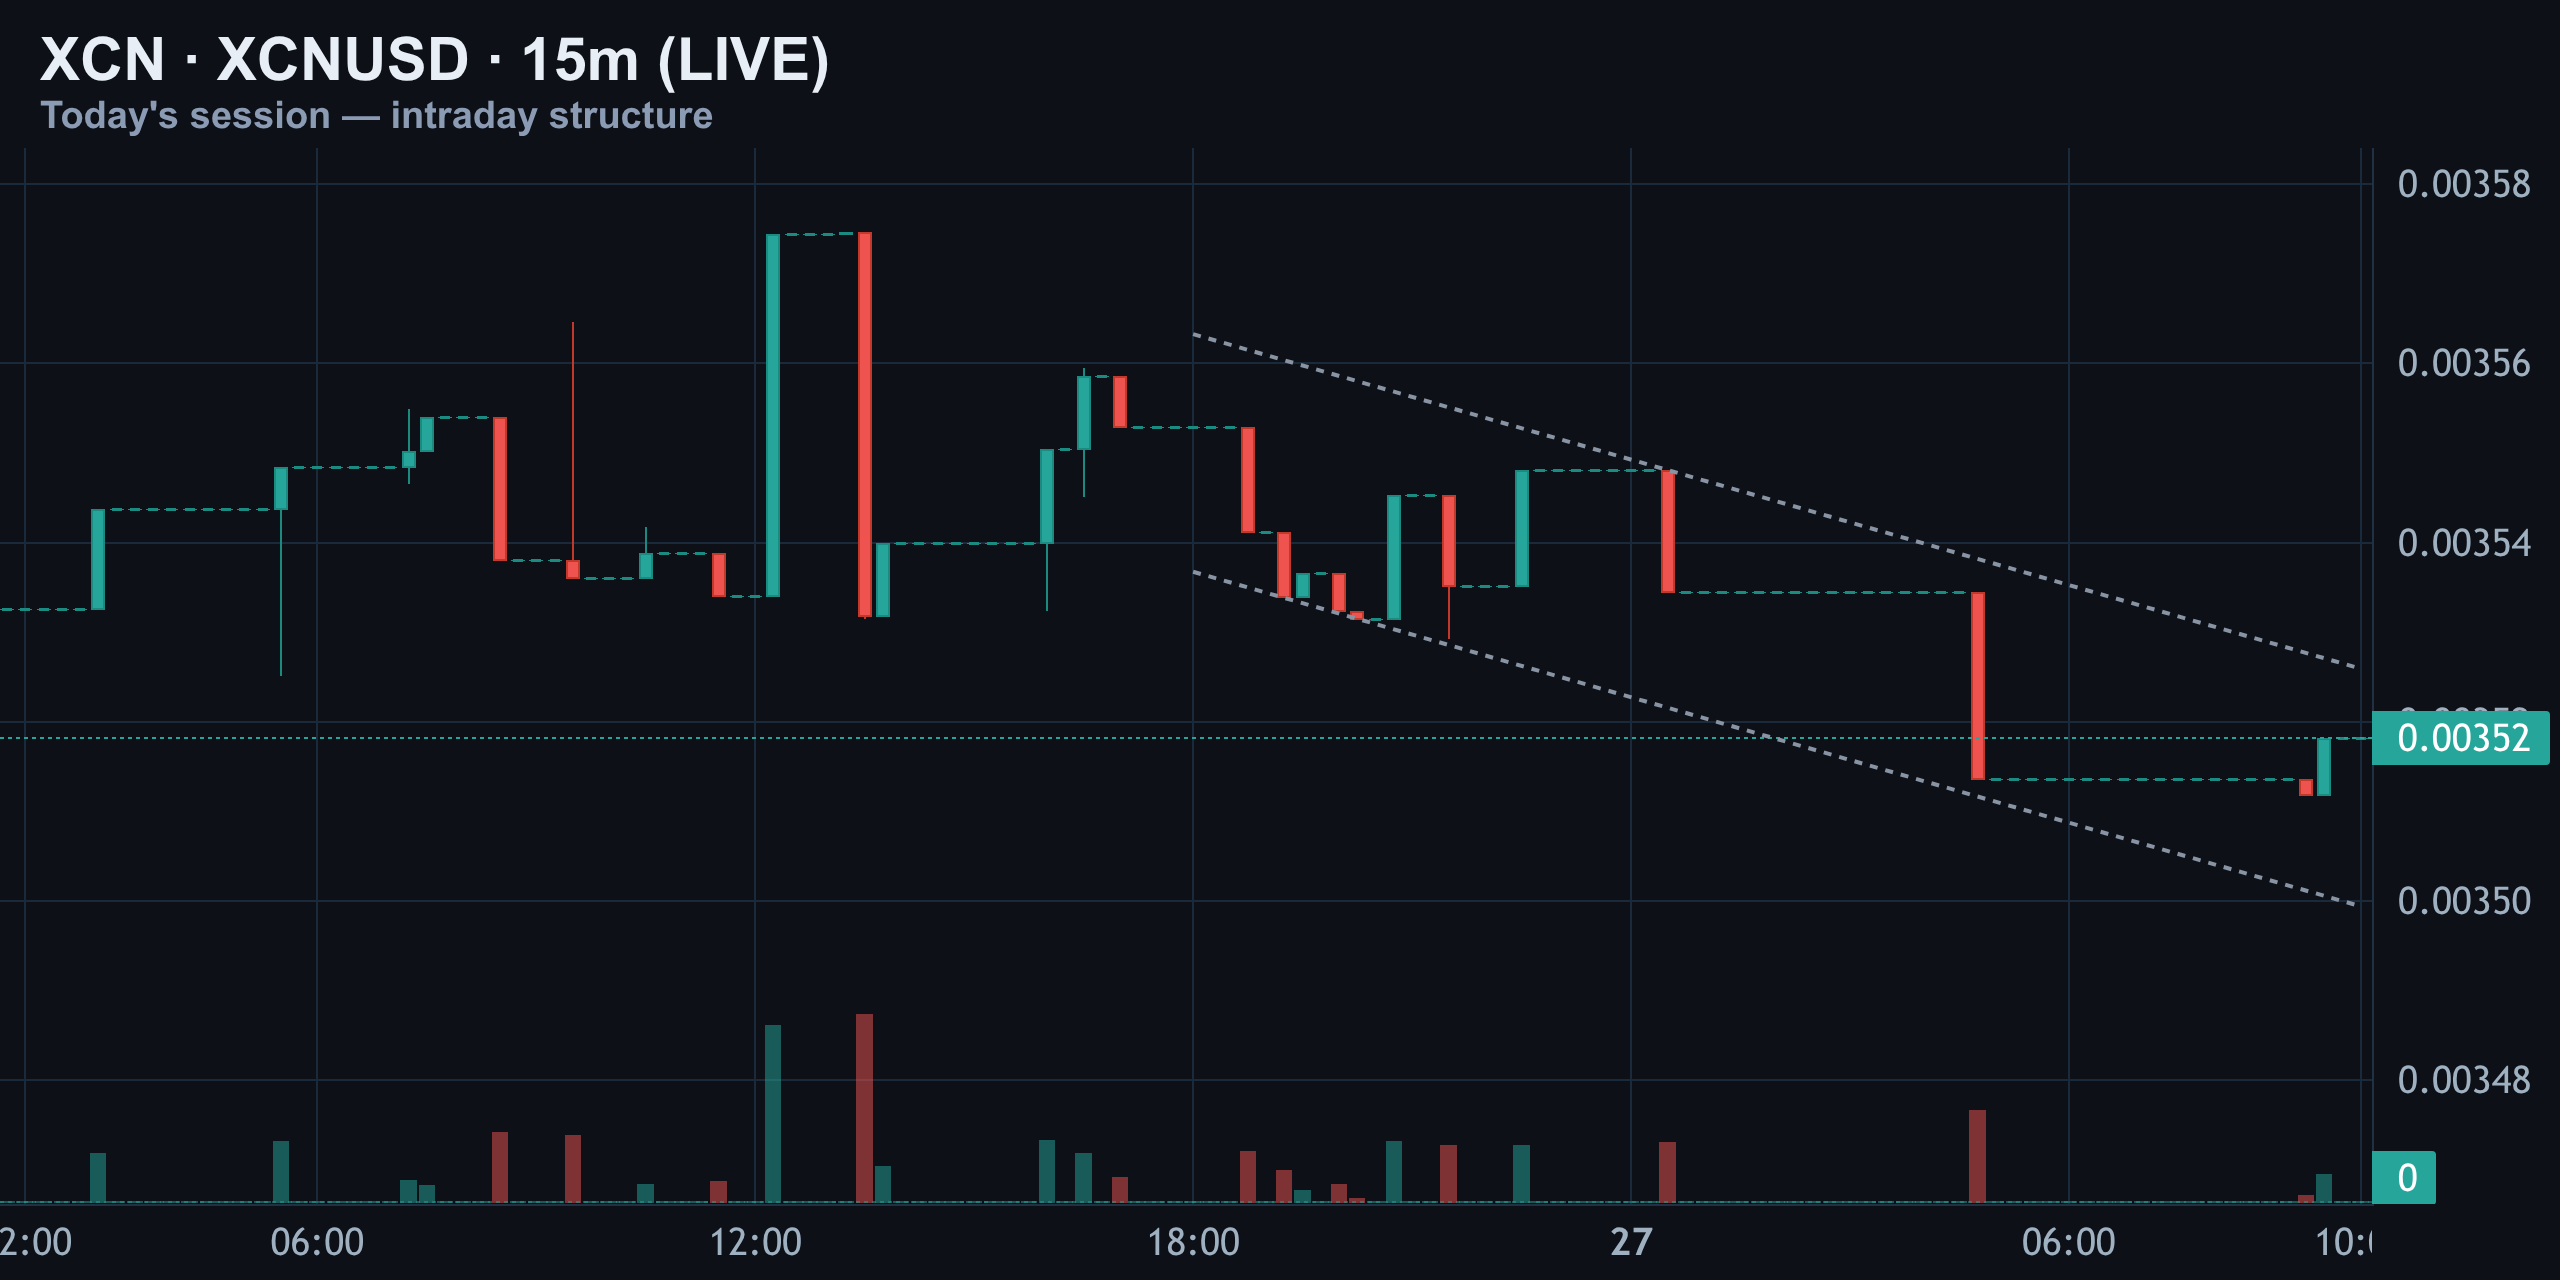
Right now price sits near $0.00352, dead center of that channel, with sellers still in control every time buyers try to push back toward $0.00354. In plain terms: Onyxcoin keeps making lower highs inside a falling price channel, and until that pattern breaks, short-term momentum stays with the bears.
4-Hour Structure: The Bigger Cage Since July 17th
Step back to the four-hour chart and you can see the larger structure Onyxcoin's been trapped in since July 17th. A descending trendline up top has capped every rally attempt, including the failed push toward $0.0037–0.0038 around July 19th and 20th.
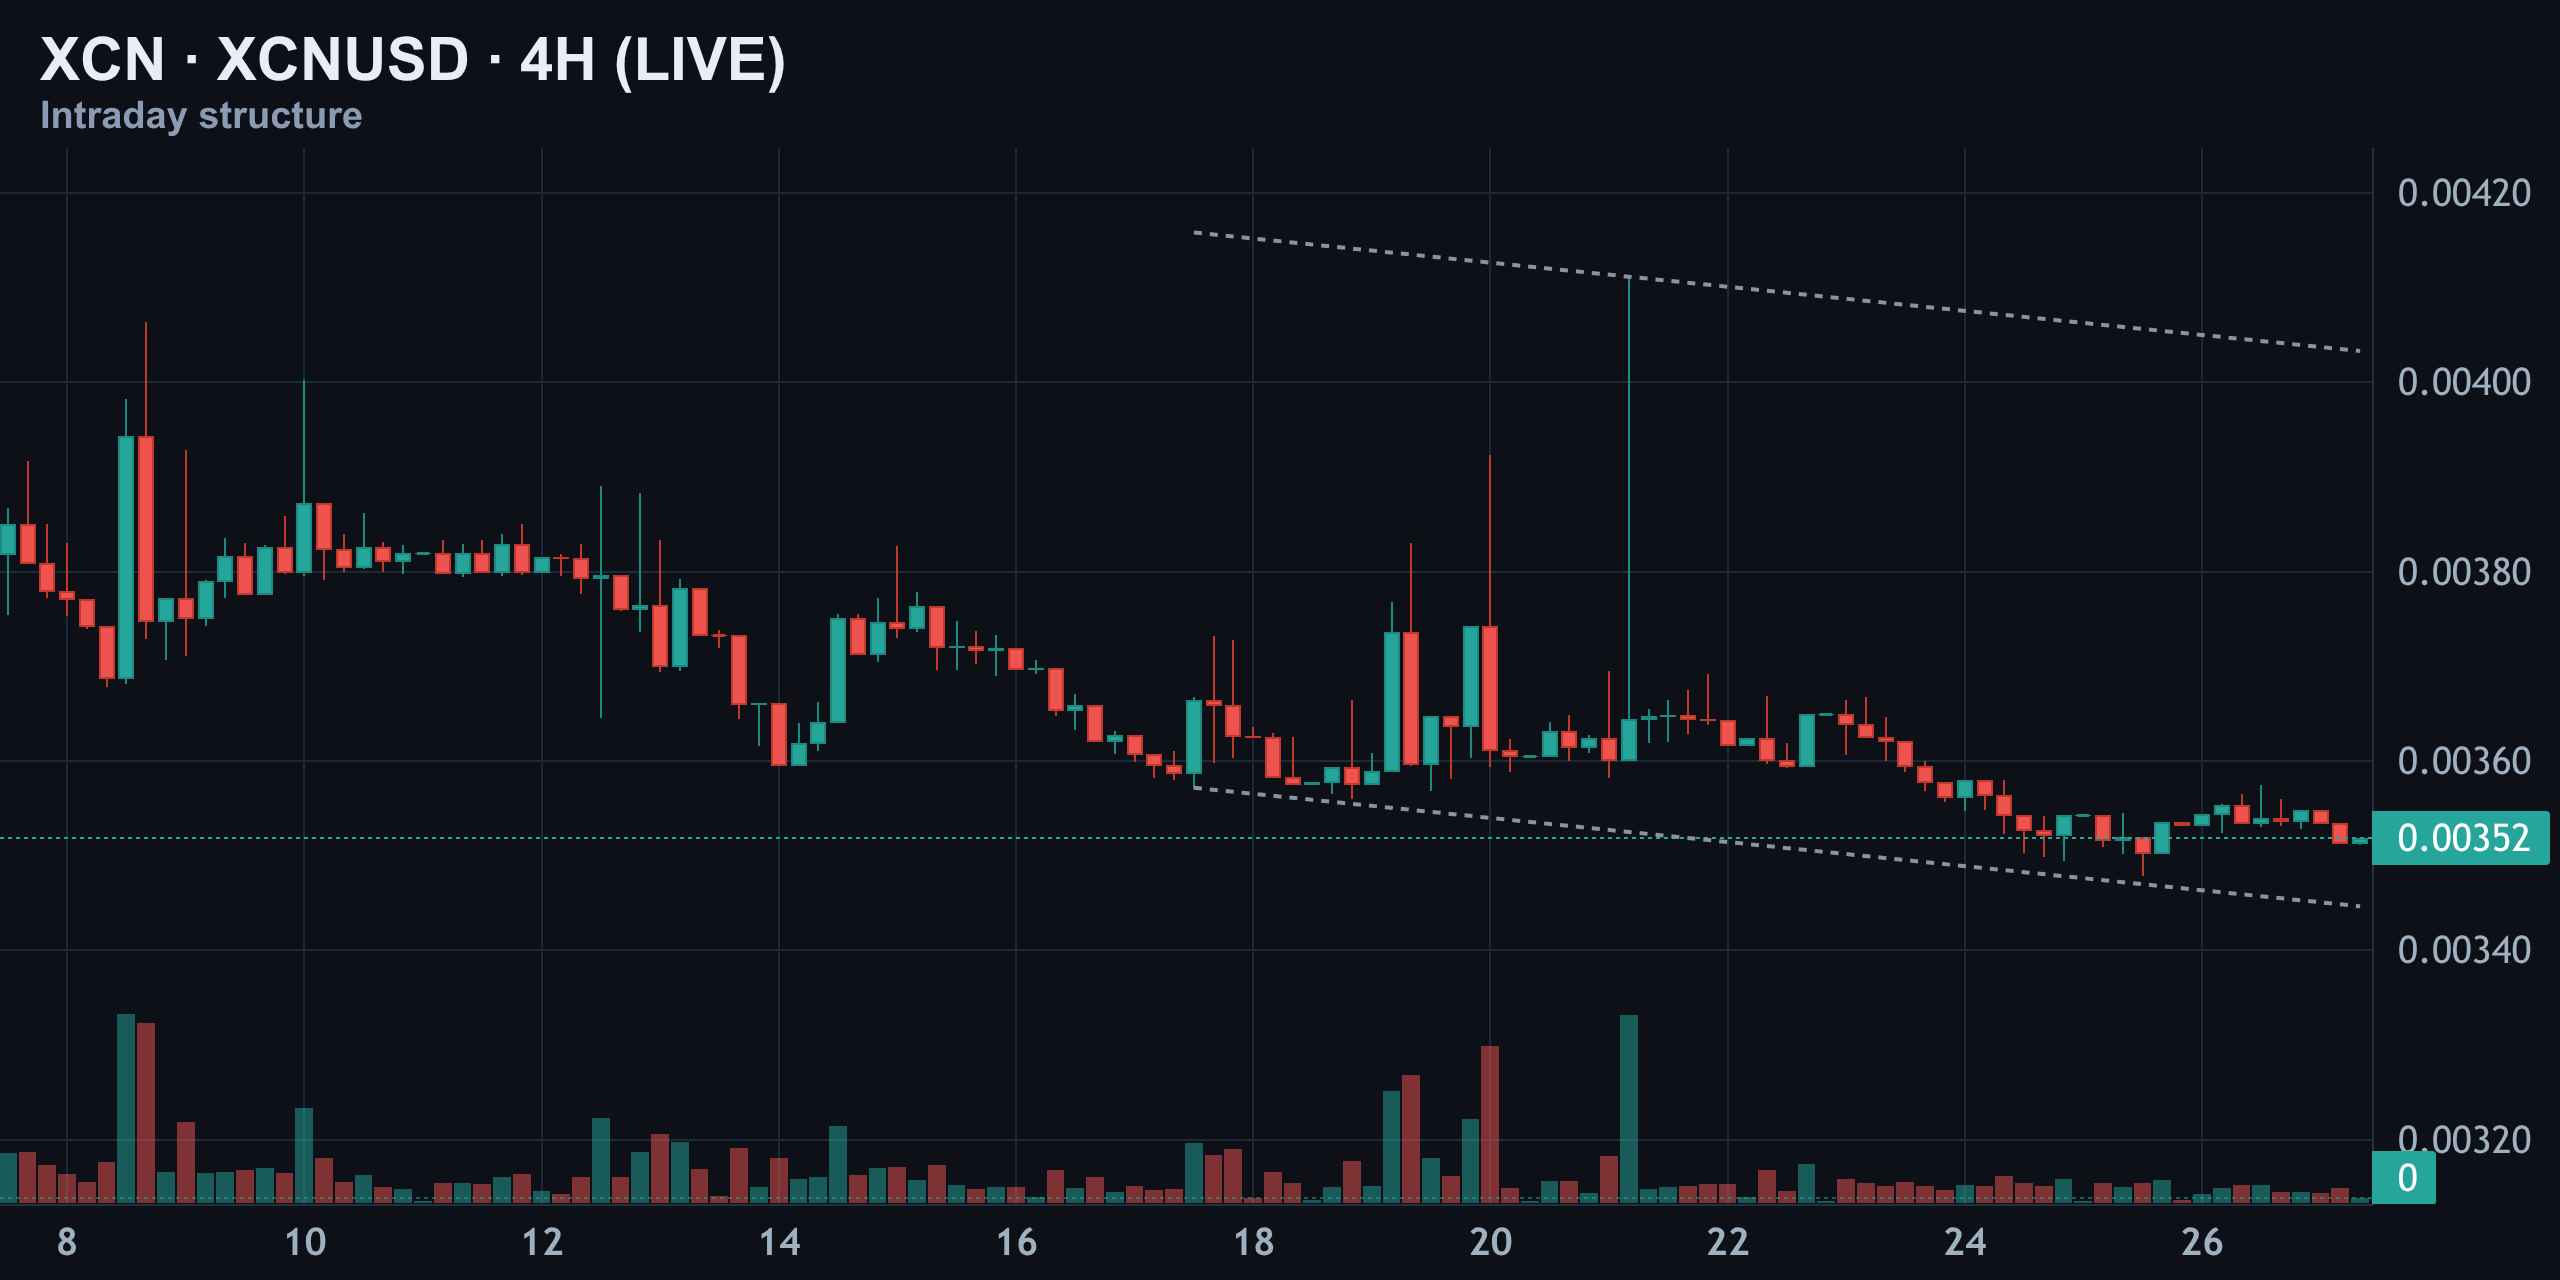
Price has been grinding down the lower rail of this channel for a full week now, and today's candles are sitting right on that support line near $0.00352. Volume is drying up into the squeeze — a classic pre-breakout signature, though direction is still unconfirmed. In plain terms: XCN has been sliding lower inside the same channel for over a week.
Daily Chart: Squeezed Between Distant Resistance and Nearby Support
The daily chart tells the bigger-picture story in one glance. Way up at $0.0088, April's spike high is ancient history now — a total non-factor for today's trade. What matters is right here: Onyxcoin is testing support at $0.00348, the same floor that's held since June.
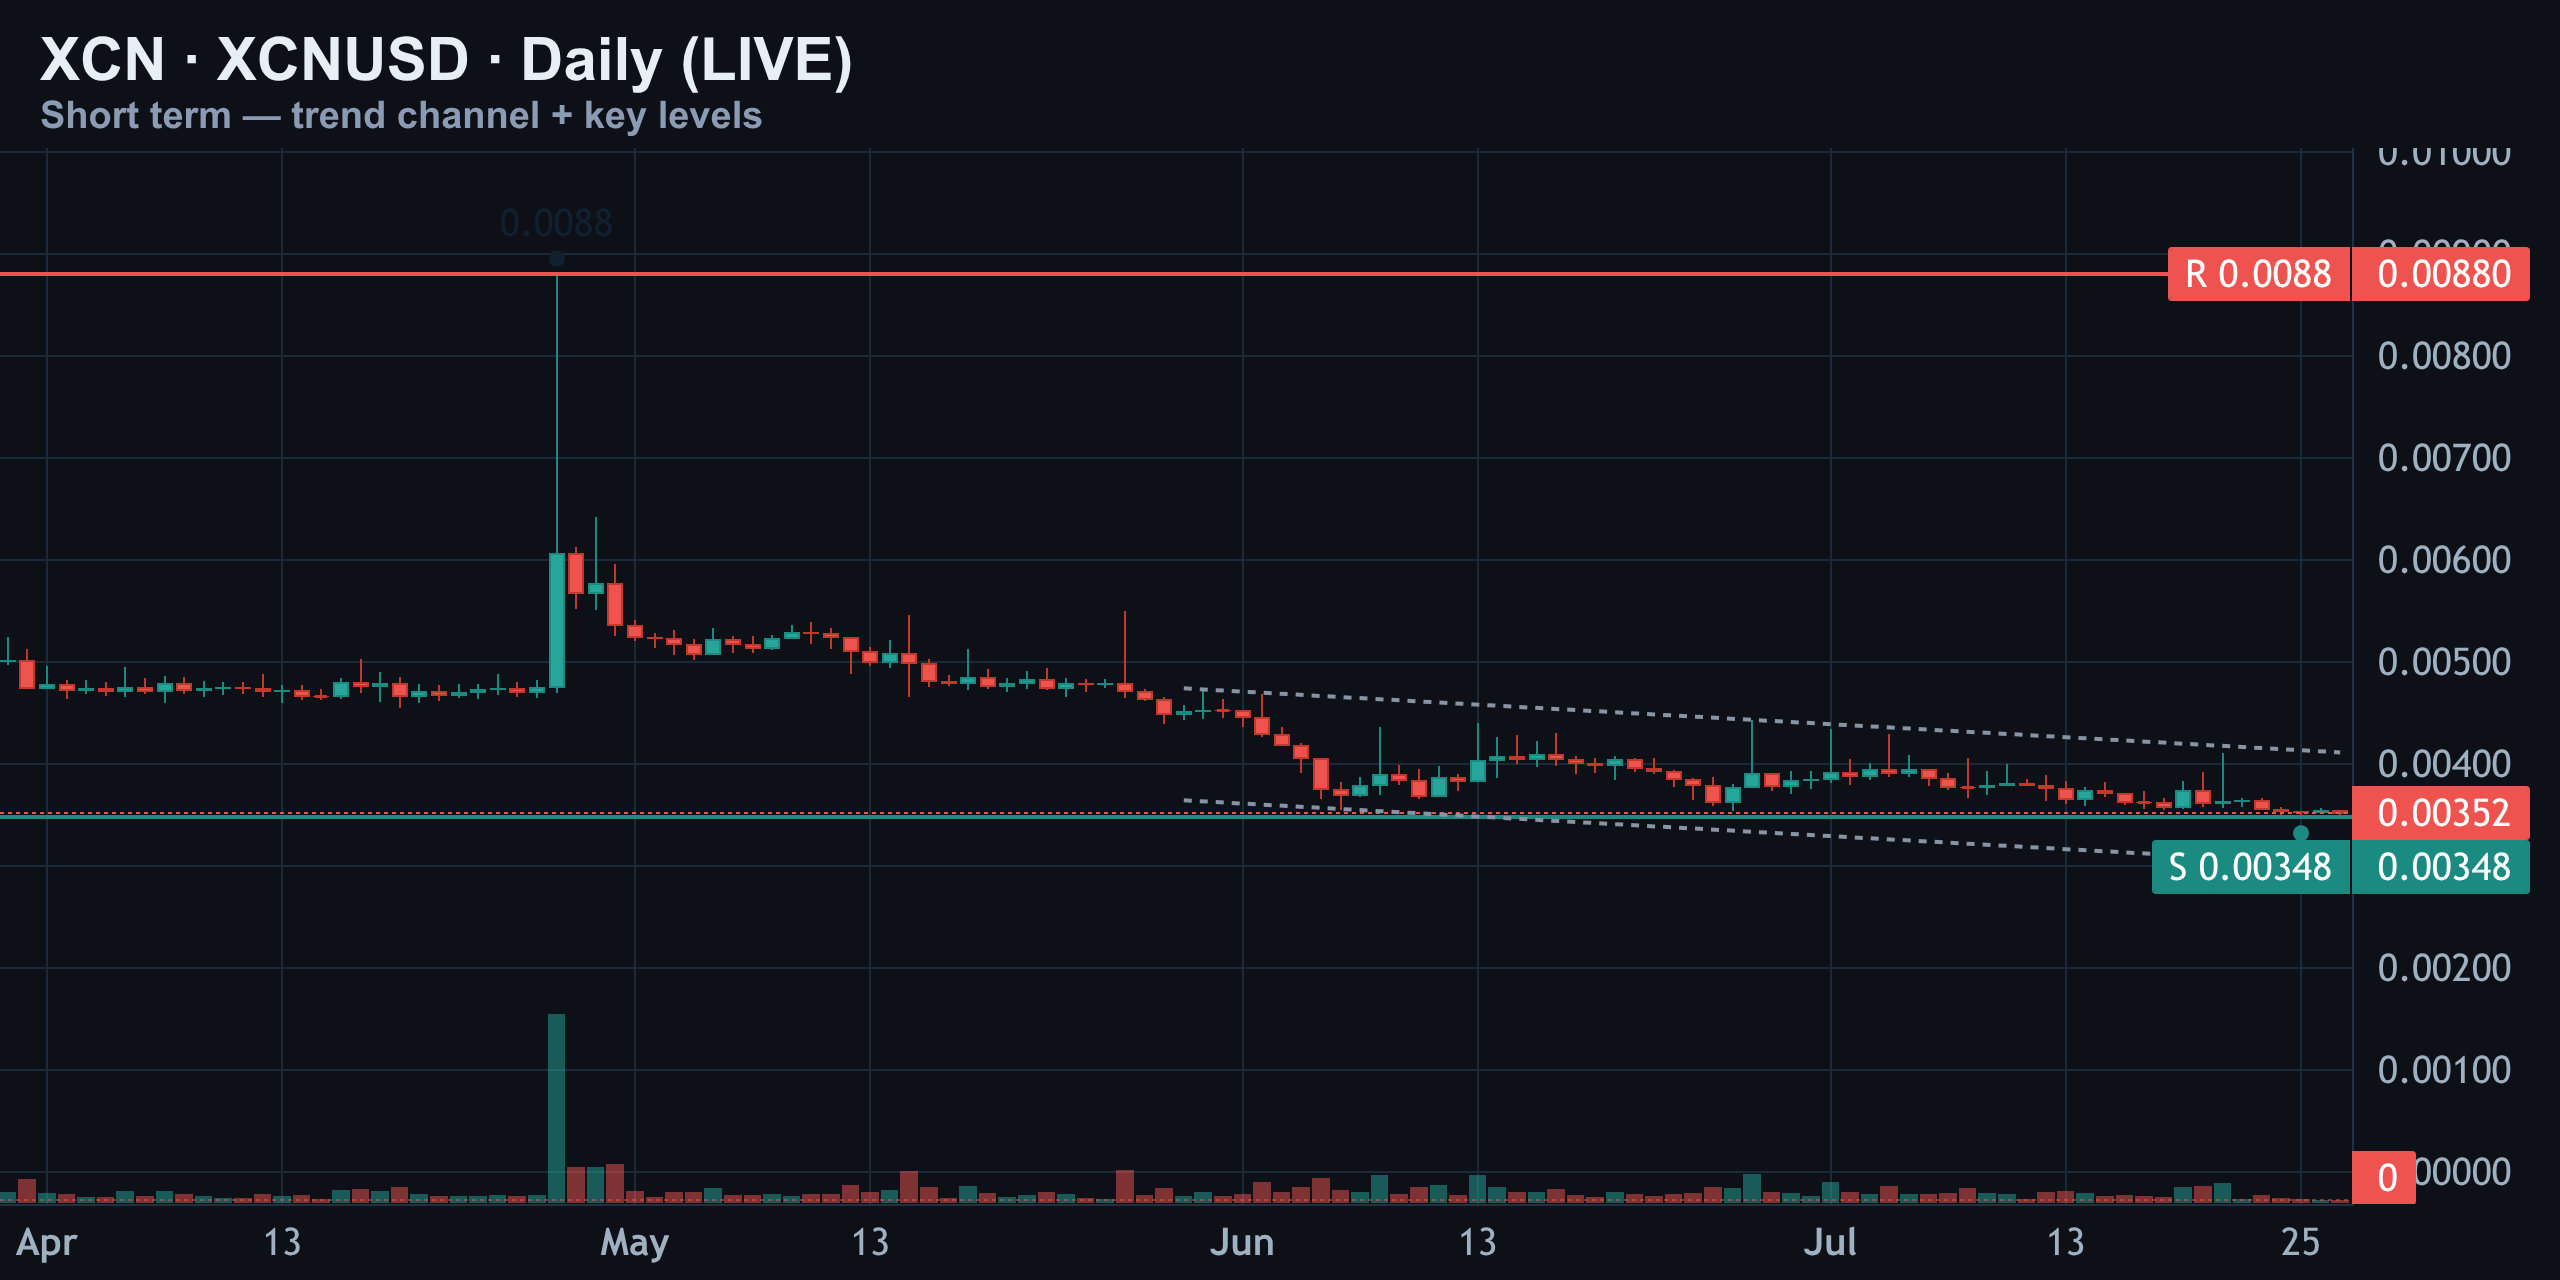
The grey dashed channel visible on the daily has contained every bounce for two months straight, and price is currently pressed right against the bottom of it — exactly why today's setup leans short until that channel breaks. Longer-range forecasting models remain far more optimistic over a multi-year horizon, projecting XCN could revisit the $0.007–0.0086 zone by year-end 2026 if broader market conditions improve, but that's a different timeframe from the one this setup trades. In plain terms: price is testing a support floor inside a two-month falling channel.
Momentum Check: RSI and MACD Tell the Same Story
RSI on the daily sits at thirty-six right now, and that number matters because of what it isn't. It isn't oversold. Thirty is the line that usually triggers bounce buyers, and we're still six points above it. That means there's no momentum floor forcing a reversal here — sellers still have room to push before this gets stretched.
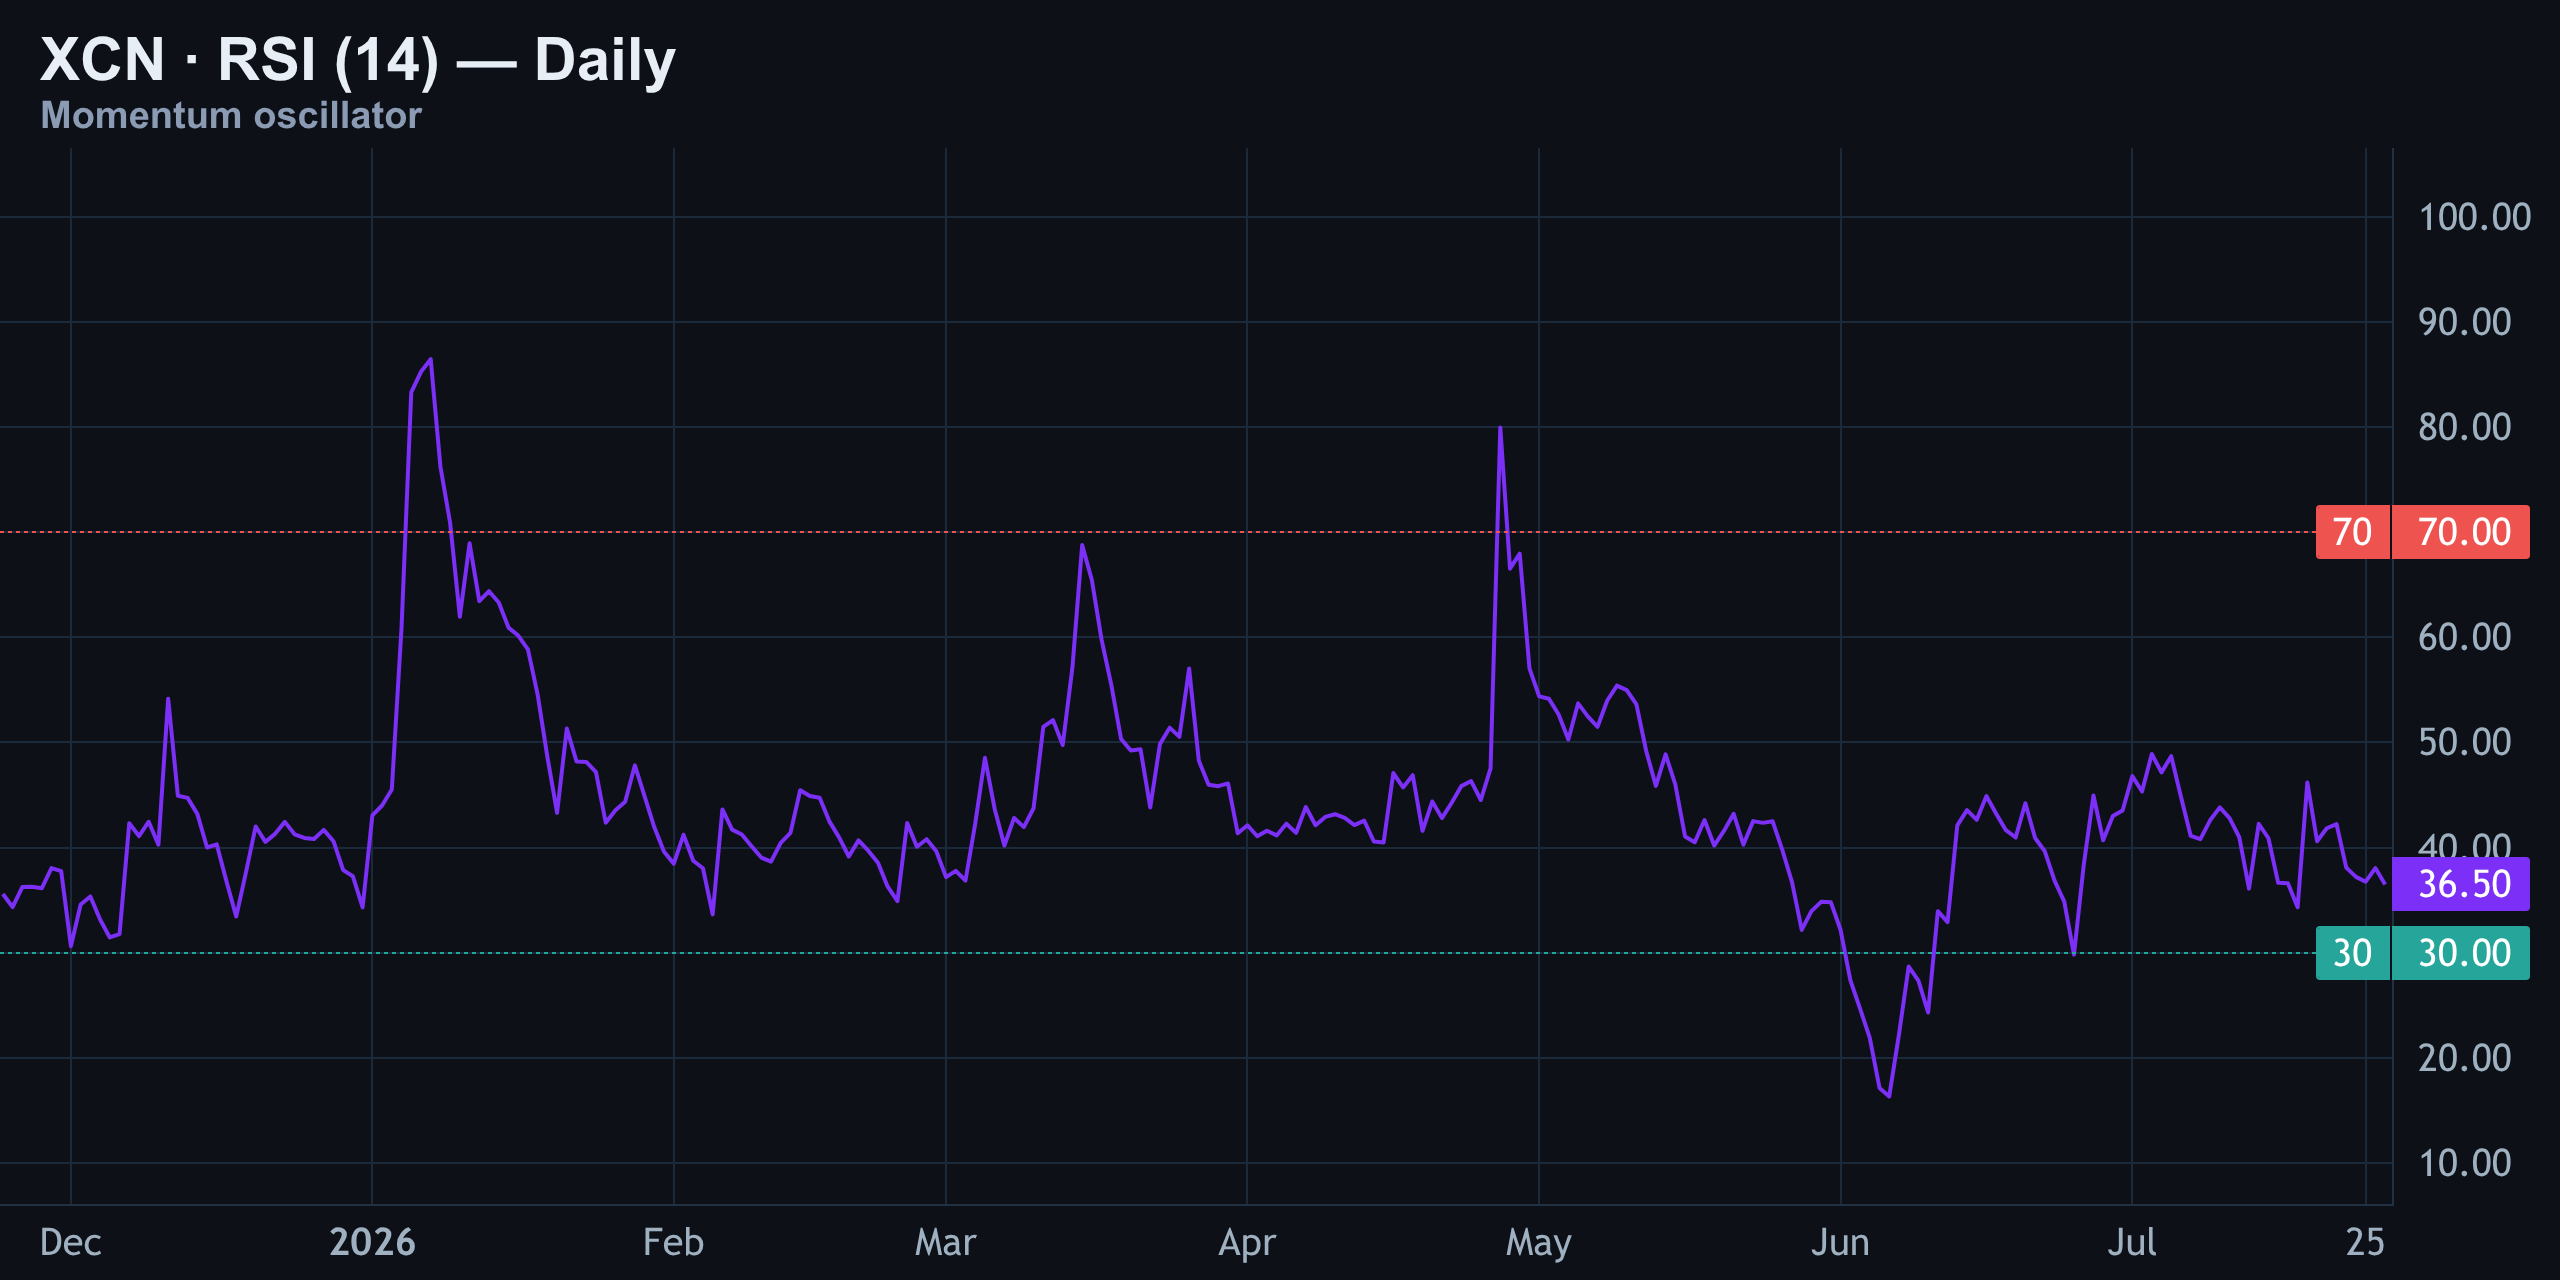
Compare that to June's actual oversold dip near twenty, and today's reading looks almost lazy by comparison. Neutral momentum plus falling price is not a bullish combination.
MACD backs up everything the price chart is showing. The blue line sits under the orange signal line, and the histogram bars are still printing red, meaning the gap between them is widening, not closing. There's no early bullish crossover forming here, unlike the small bounce attempts seen back in April and May.
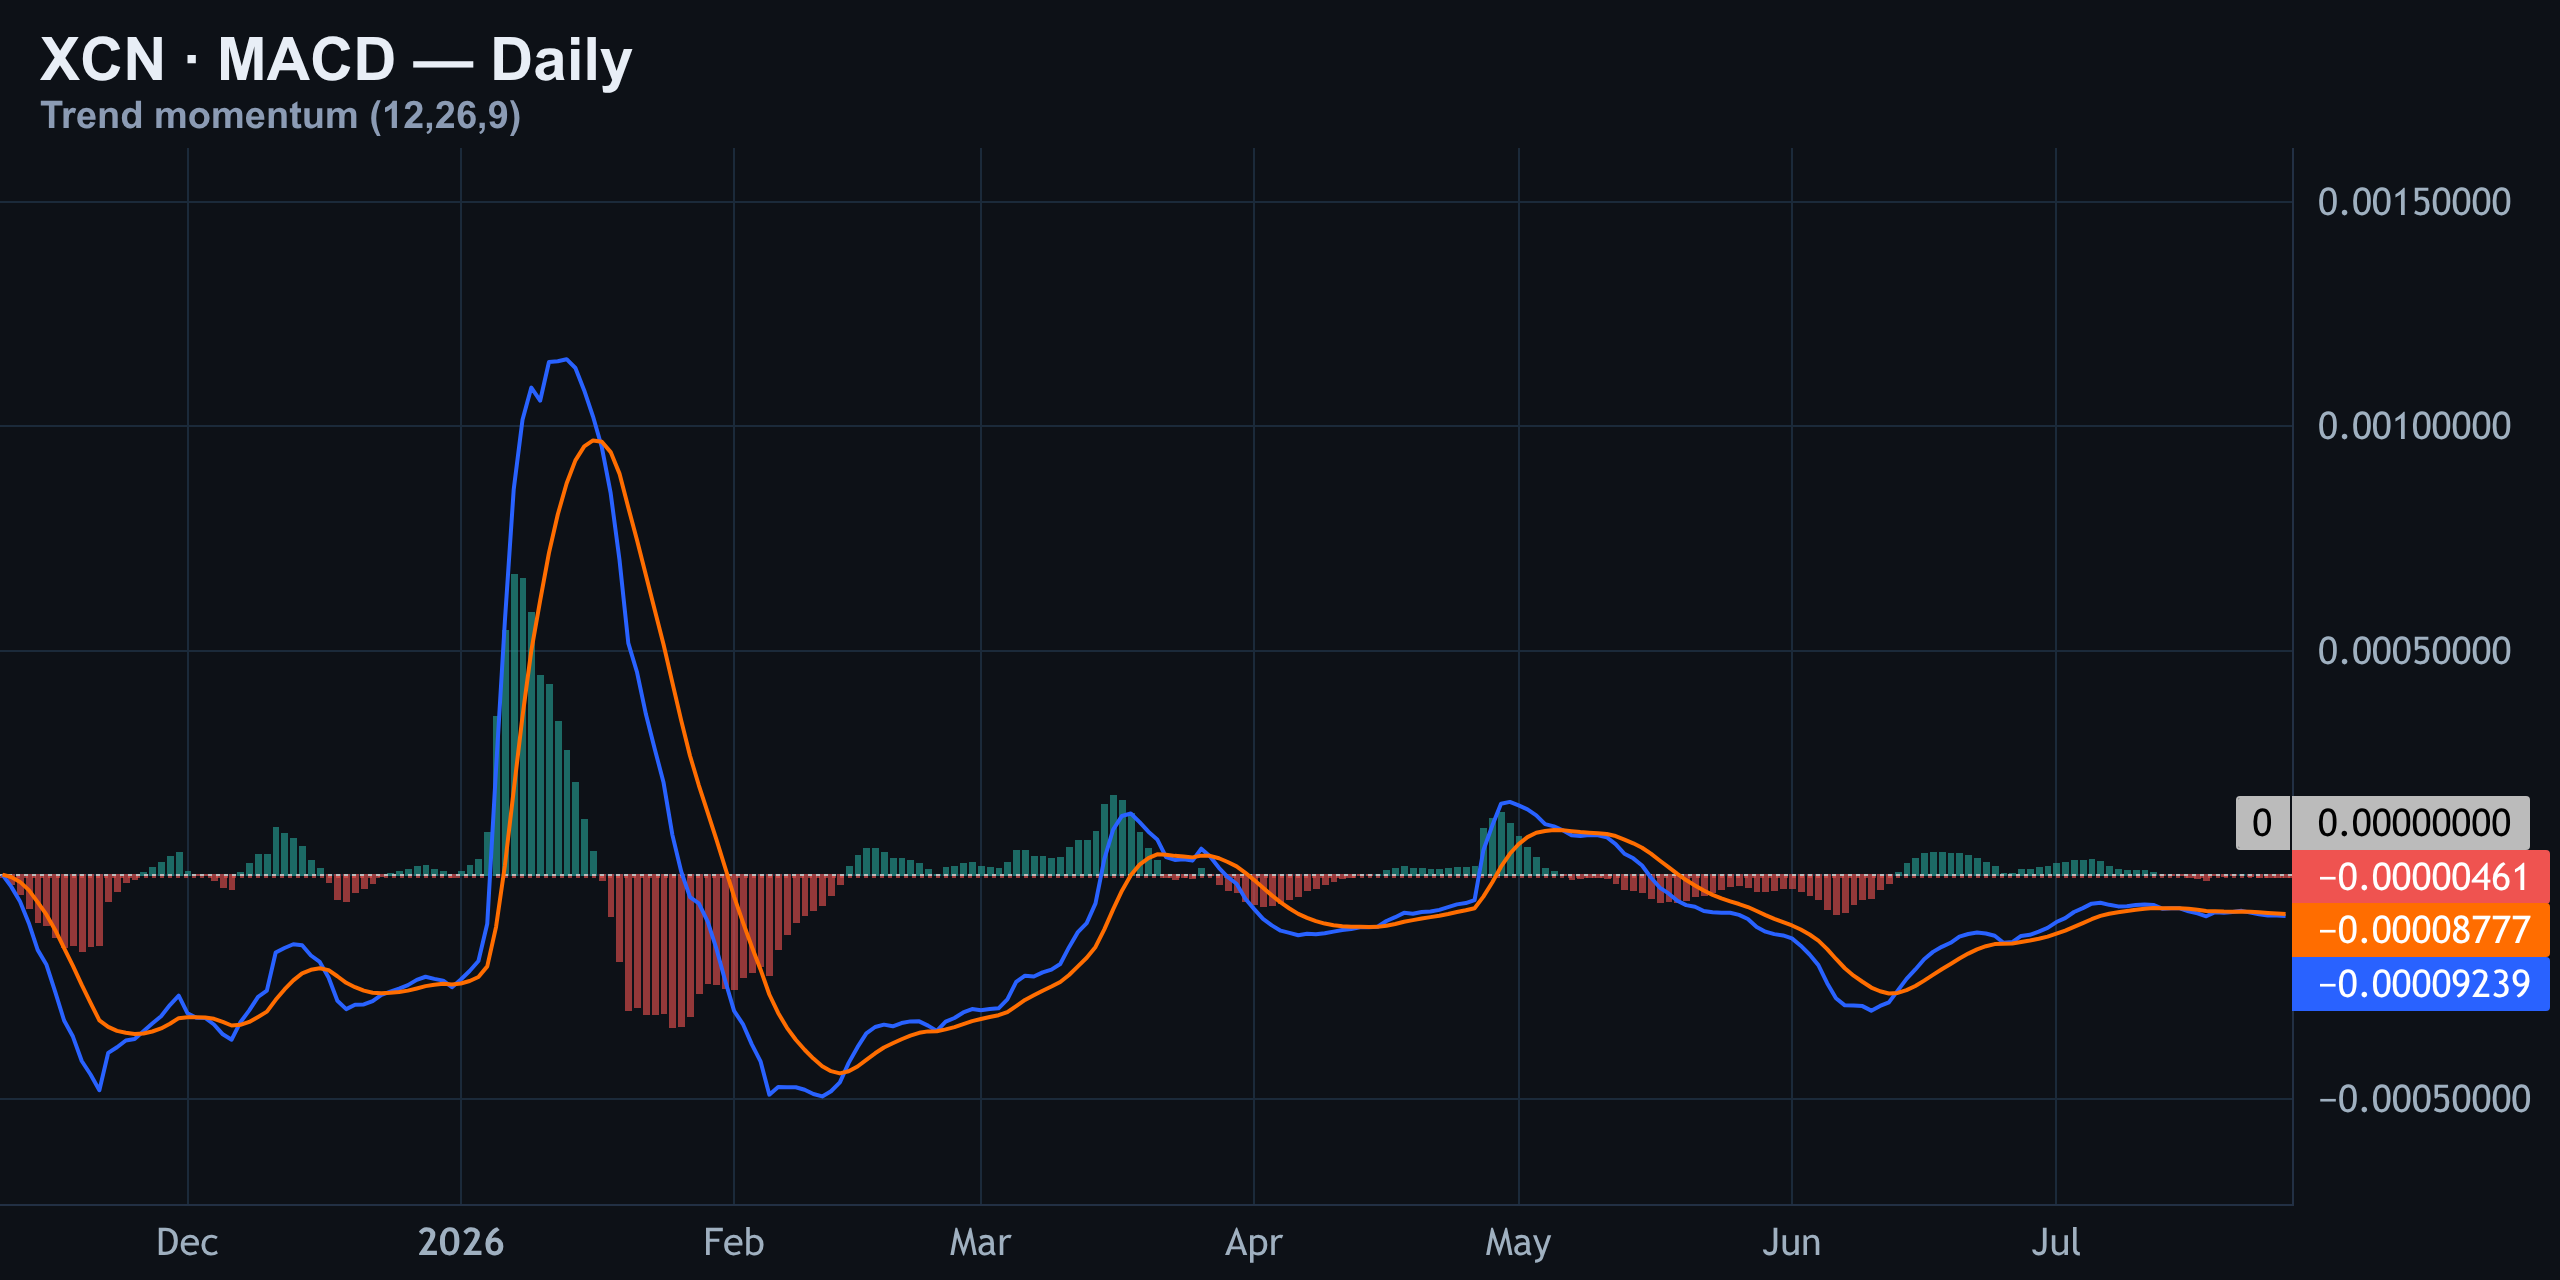
This setup actually rhymes with early June, right before Onyxcoin took its bigger leg down toward that eventual low. Momentum agrees with structure: sellers still have the edge.
The Levels That Matter Today
Here's the level map for today's session. Entry sits at $0.00354, stop just above at $0.00357, target down at $0.00347 — that's the computed short, carried over and tightened from yesterday.
| Level Type | Price |
|---|---|
| Entry (short) | $0.00354 |
| Stop-loss | $0.00357 |
| Target | $0.00347 |
| Daily support floor | $0.00348 |
| Distant resistance (April high) | $0.00880 |
Layered on top, the liquidation heatmap shows clusters at $0.003874, $0.003671, and right at $0.003541 — that last one overlaps our entry, adding real confluence to this trade. These are the prices where leverage has actually been cleared out over the last 14 days, so they mark levels the market already fought over rather than levels it's aiming at next.
| Liquidation Zone | Notional Cleared |
|---|---|
| $0.003874 (above spot, densest zone) | $7,000 |
| $0.003671 (above spot) | $1,000 |
| $0.003541 (above spot, overlaps entry) | $1,000 |
| $0.003504 (below spot) | $1,000 |
What's Shaping Sentiment Beyond the Chart
None of this week's headlines mention Onyxcoin directly, but they're shaping the mood it trades in. Storj's bankruptcy filing and the Bitkub hack complaint out of Thailand are fresh reminders that infrastructure risk hasn't gone away, which possibly keeps risk appetite for smaller-cap tokens like this one subdued.
Layer on a stacked week of central bank decisions from the U.S., U.K., and Japan, plus a busy corporate earnings calendar, and it's easy to see why traders are treating altcoins like XCN with extra caution right now. Broader liquidity conditions tend to dictate whether low-cap tokens get room to breathe or get sold alongside risk assets across the board.
Trading volume for XCN has been reported in the $1.3–1.5 million range across major venues in the past 24 hours, a relatively thin tape that helps explain why the price has been able to coil so tightly inside its channel without a decisive break either way.
The Trade Plan and Bottom Line
The setup remains a short-biased play with roughly a 1:2.5 risk-to-reward ratio, structured around the levels above. This is not financial advice — it's a read of the technical picture as it stands right now, and it should be sized and managed according to your own risk tolerance.
- Bias stays bearish while price trades below the mid-$0.0036 reclaim level.
- RSI at 36 means there's no oversold floor forcing a bounce yet — don't assume a reversal is imminent.
- MACD histogram still red and widening — no early bullish crossover in sight.
- The untouched $0.003874 liquidation wall above spot is the level to watch if bulls do get a bid going.
- Yesterday's short remains open and essentially unchanged — today's plan just tightens the stop as price compresses.
Until buyers can reclaim the mid-$0.0036 level and flip the four-hour structure, the path of least resistance stays down. Watch that support shelf near $0.00348 closely — a clean break opens the door toward the next target, while a hold there keeps the standoff alive for at least one more session.
Key takeaways
- XCN is trading around $0.00352, pinned inside a descending channel that's held since July 17th.
- RSI at 36 is neutral, not oversold — meaning sellers likely still have room to push lower before a bounce is forced.
- MACD stays bearish with a widening red histogram, confirming the daily downtrend has no early reversal signal yet.
- A dense, untouched liquidation wall sits near $0.003874 — the level bulls need to test to shift the narrative.
- Yesterday's short ($0.00355 entry, $0.00359 stop, $0.00347 target) is still live and essentially mirrored in today's tightened setup.
Frequently asked questions
What is the current price of Onyxcoin (XCN)?
XCN is trading around $0.0035, roughly flat on the day after slipping about half a percent from the prior session.
Is XCN bullish or bearish right now?
The technical bias remains bearish. Price is inside a descending channel on the 15-minute, 4-hour, and daily charts, and MACD is still printing a bearish crossover with a red histogram.
What does an RSI of 36 mean for XCN?
It signals weak, neutral momentum — not yet oversold. Since 30 is typically the threshold for bounce buyers to step in, XCN still has room to fall before hitting a technical floor.
Where is the key support level for XCN?
The main support sits near $0.00348, a floor that's held since June and forms the base of a two-month descending channel on the daily chart.
What is a liquidation heatmap and why does it matter here?
It shows price zones where leveraged positions were recently forced to close. XCN's densest zone near $0.003874 marks a level of past leverage stress, useful as a reference point rather than a target.