
Analysis
XCN Daily Pulse: Oversold RSI vs. Live Short Under $0.0034
XCN Price Today: Where the Scorecard Stands
Onyxcoin (XCN) is trading around $0.00332 as of this writing, continuing the slide that broke the third-of-a-cent floor yesterday. Pricing does vary slightly by venue — CoinMarketCap has it near $0.003329, down 2.86% on the day, while Kraken shows roughly $0.0034 and CoinGecko prints $0.003367, down 2.41%. TradingView's feed puts spot closer to $0.00332, off about 2.02% intraday.
That spread between venues isn't unusual for a lower-liquidity alt — XCN's 24-hour volume is running in the $3 million range, thin enough that quotes can drift a few basis points apart depending on where you're checking.
Here's the quick scorecard since yesterday's call, before we get into the charts:
| Metric | Yesterday | Today |
|---|---|---|
| Price | $0.003398 | $0.003321 |
| 24h Change | — | -2.3% |
| Short Entry | $0.003414 | Still open |
| Stop Loss | $0.003496 | Not hit |
| Target | $0.003209 | Not reached, trending toward it |
15-Minute Intraday: Grinding Along the Floor
Zoom into the last several hours and XCN has been stair-stepping lower inside a clean descending channel since the 18:00 candle. Every bounce toward the $0.003334 area has been sold immediately — four separate times overnight. That's the kind of repetitive rejection that tells you sellers, not buyers, are setting the pace right now.
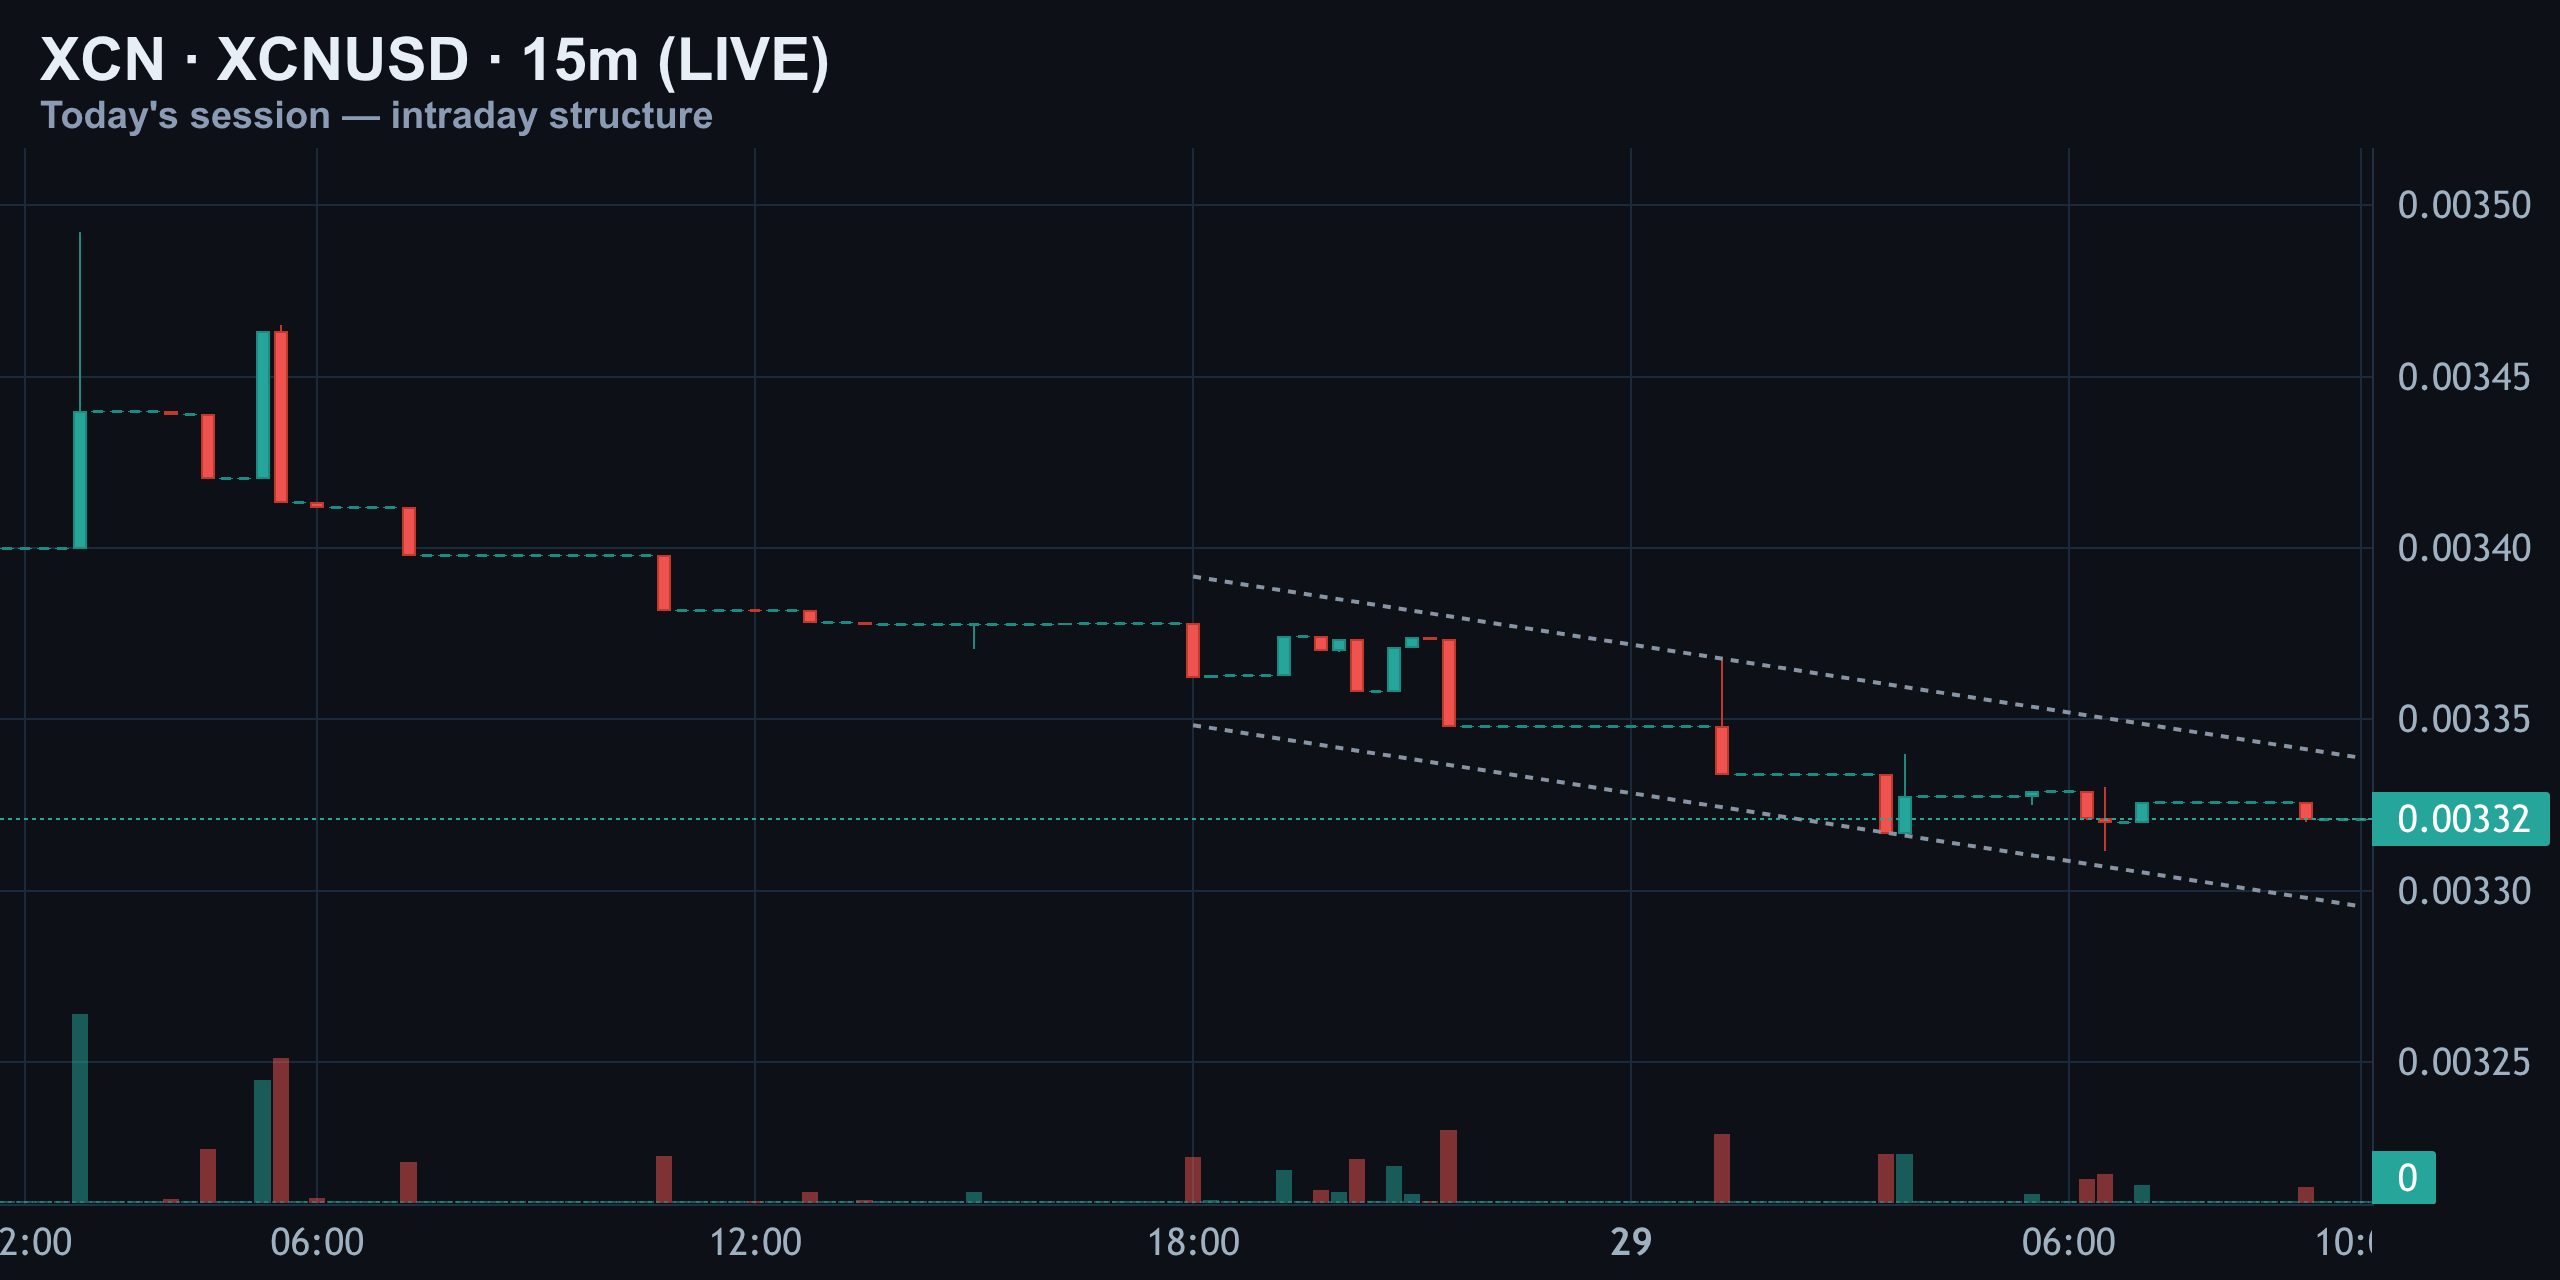
Volume on the down candles is visibly heavier than on the up candles, a classic tell that this isn't just noise — it's controlled distribution. Price is currently parked directly on the $0.003332 pivot, the same level flagged on the higher timeframes below. This is a coiling pattern, not a reversal signal. In plain terms: XCN keeps bouncing off the same low price and failing to climb higher, which is exactly the kind of price action that precedes either a breakdown or a sharp short squeeze — the RSI reading later in this piece will help decide which is more likely.
4-Hour Structure: The Channel Just Broke
The four-hour chart is where today's real story lives. XCN had been drifting lower inside a wide descending channel since around the 10th, off a high near $0.0042. That channel's lower rail finally gave way in the last two days, and price has now fallen clean through it toward the current $0.0033 zone.
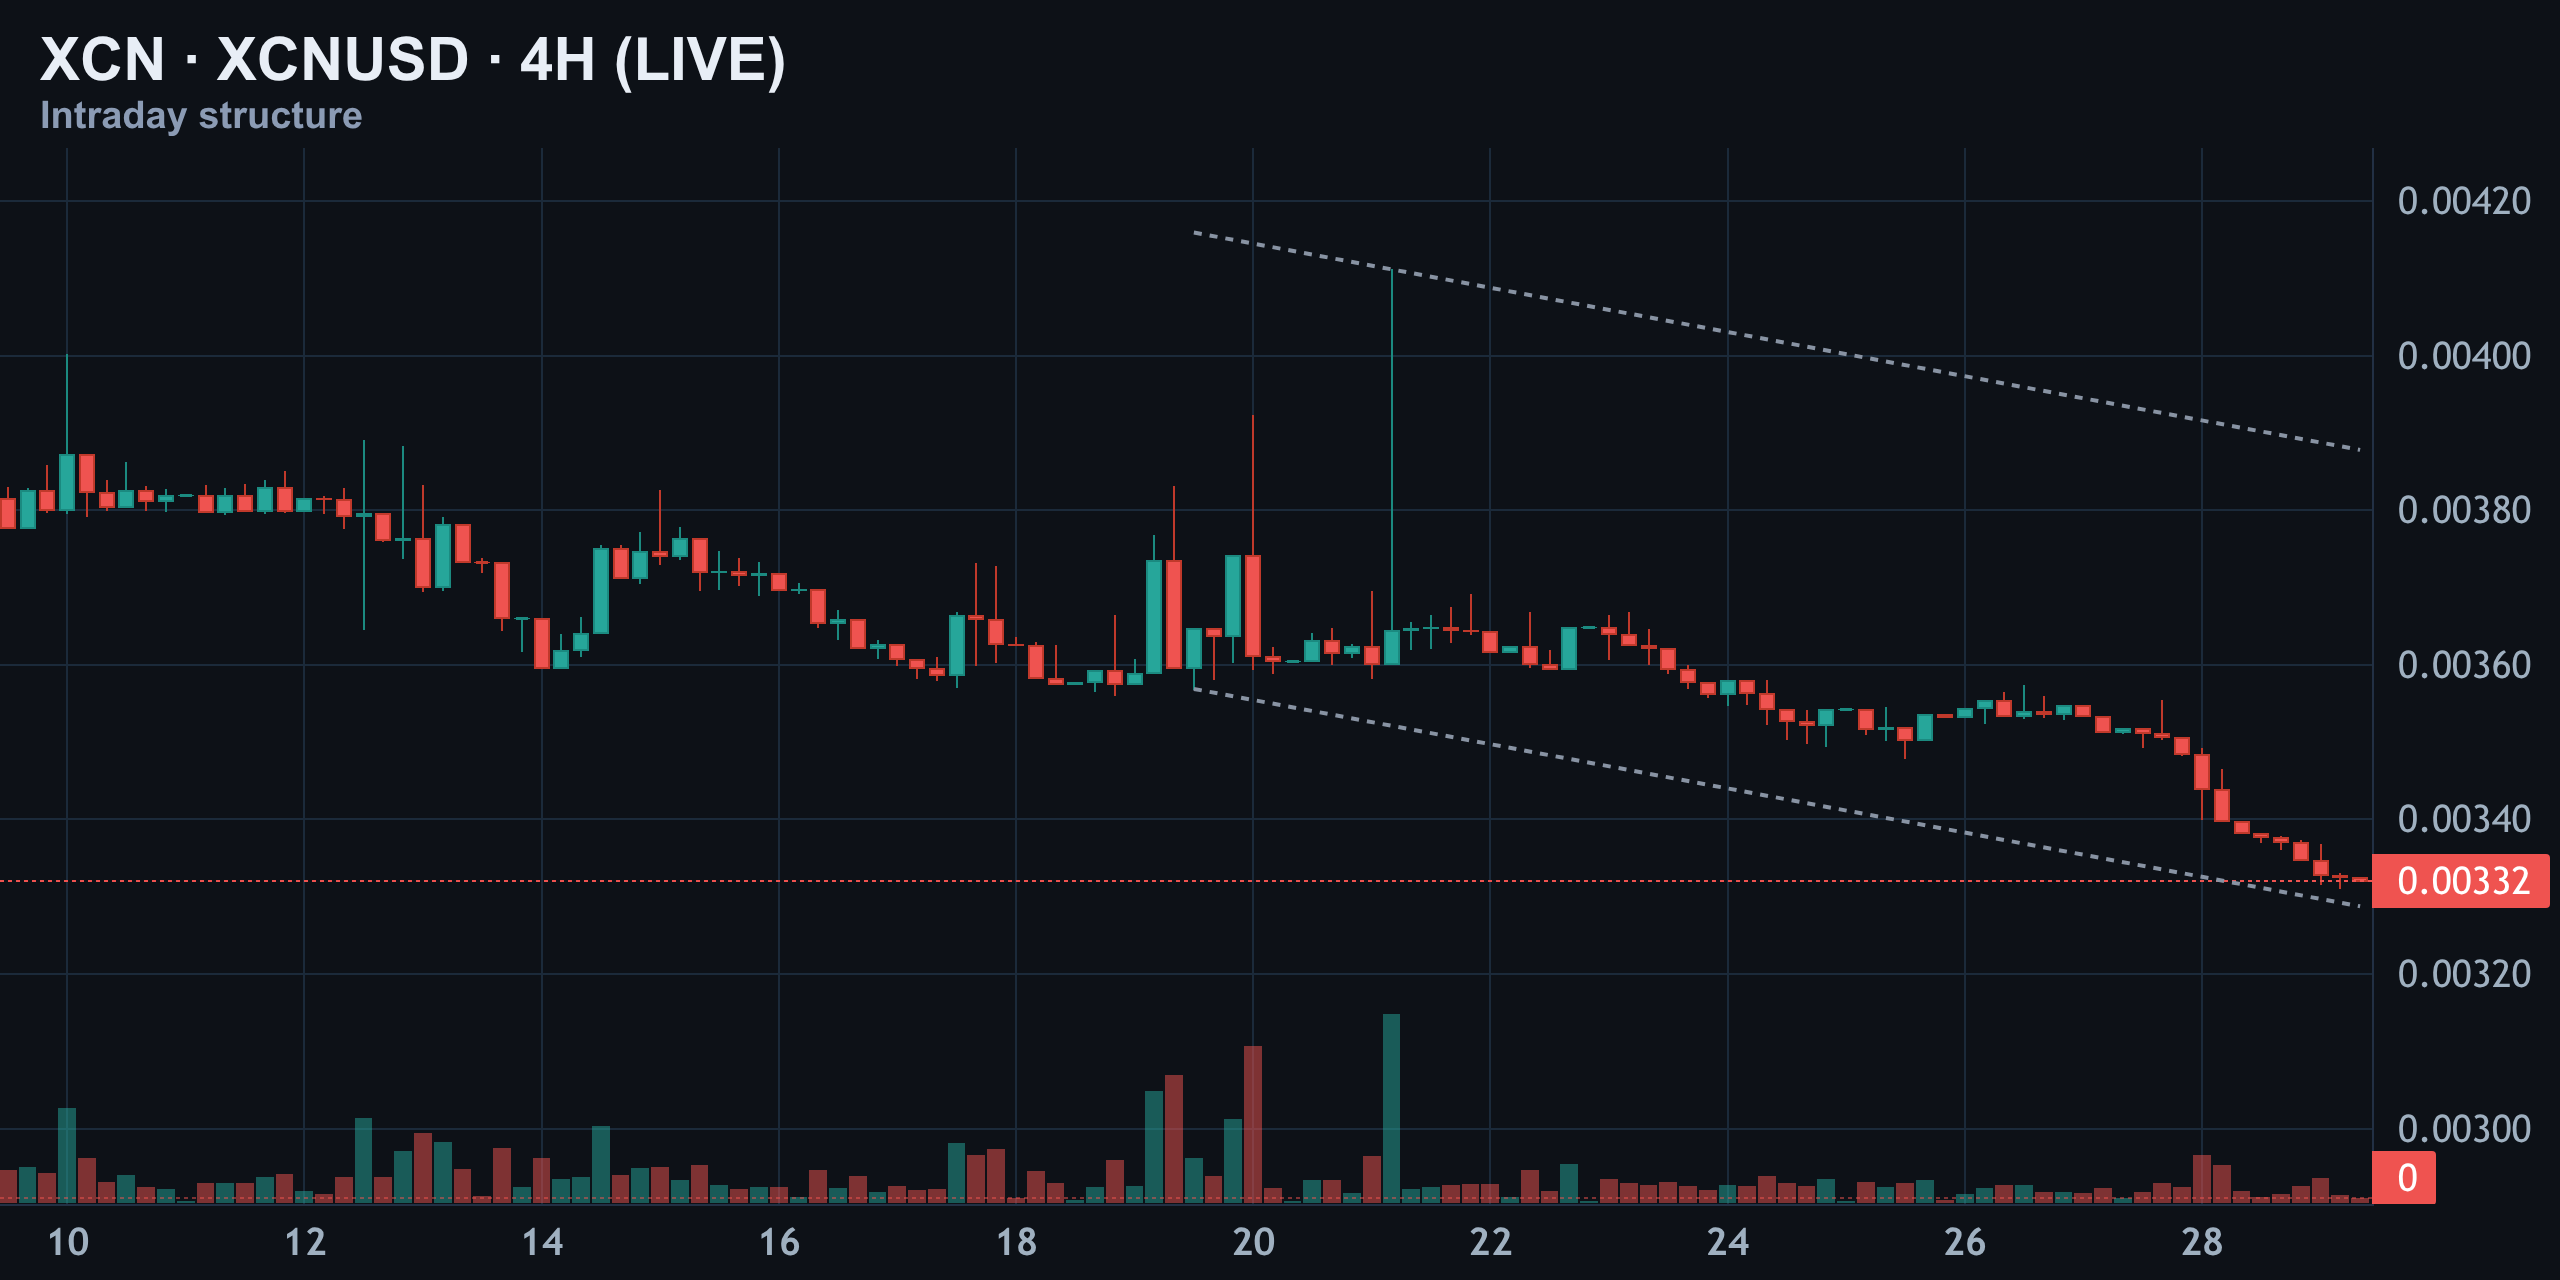
There was a volume spike on the 21st that looked like it might spark a bounce — it didn't hold. This is a structure that's accelerating lower, not stabilizing. In plain terms: the bigger four-hour trend just broke down further, confirming the slide rather than reversing it.
Daily Chart: Sitting on the One Floor That Matters
On the daily timeframe, XCN has been inside a descending channel since early June and is now testing the bottom rail almost exactly at the $0.0033120 support shelf. The old resistance up near $0.0088 from May's spike is completely out of range for this move — that's a level for a different market cycle, not this one.
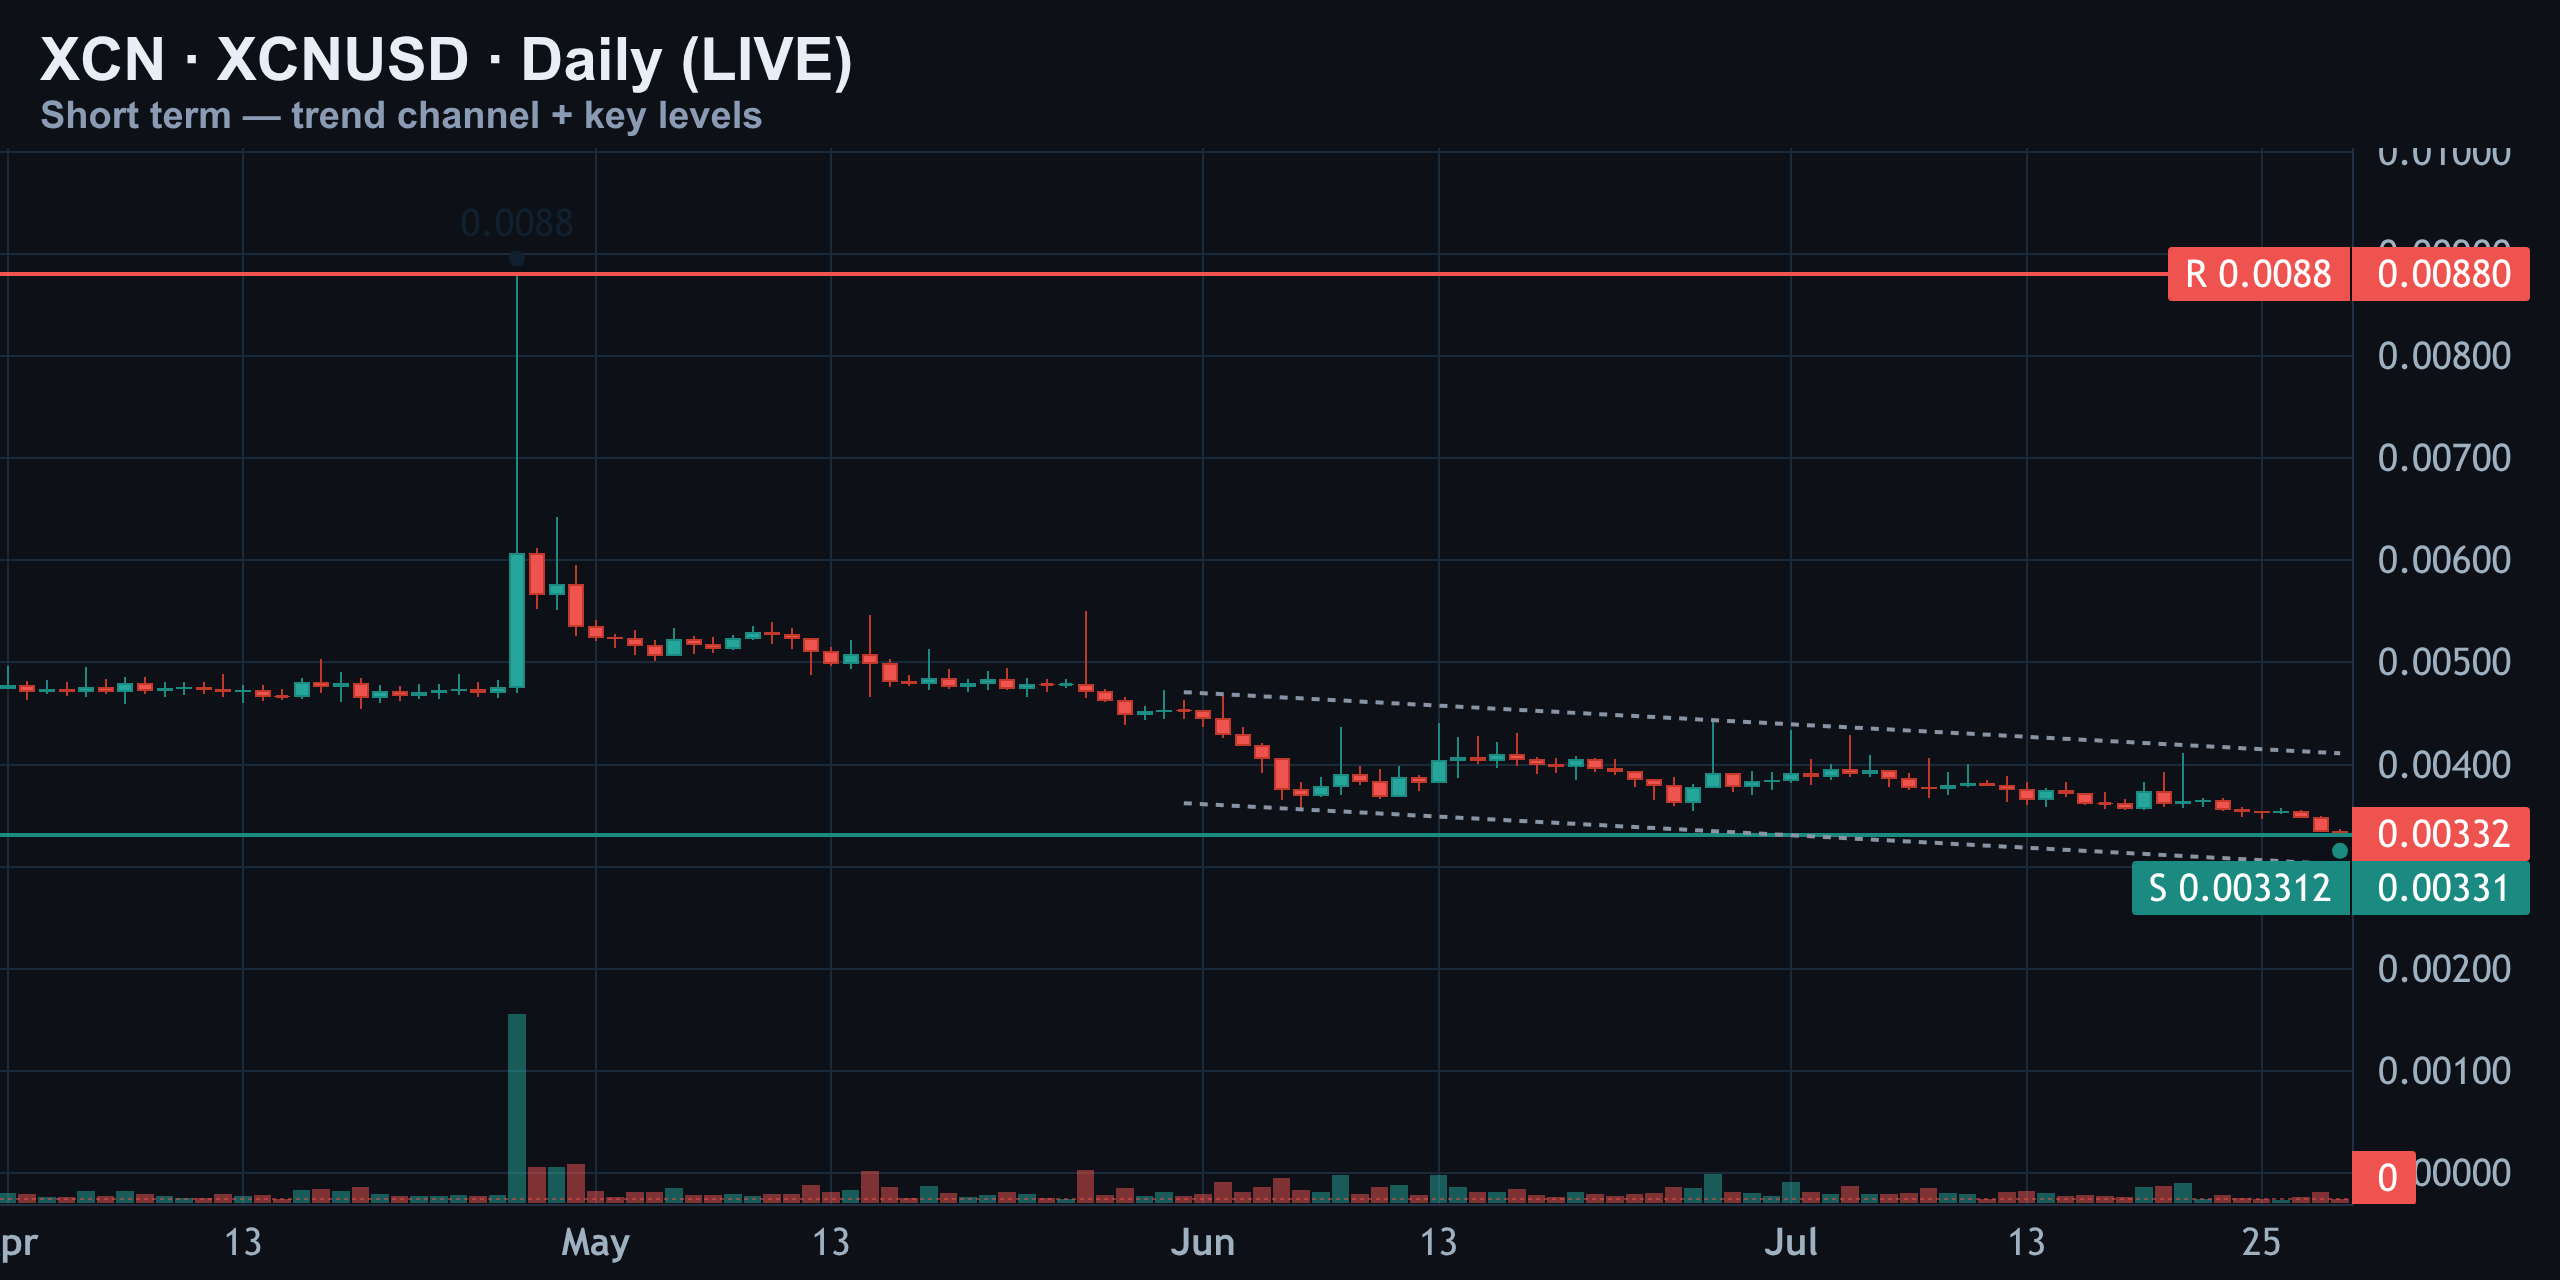
What matters right now is this shelf: it's the only real daily floor between here and meaningfully lower prices, and today's candle is sitting right on top of it. Lose this shelf convincingly and there isn't much stacked below to slow the next leg down — a point we'll return to in the liquidation map below.
RSI and MACD: Oversold, But Not Reversing Yet
Momentum confirms the pain. The daily RSI (14) is down at 28, solidly in oversold territory, which normally raises the odds of a relief bounce. But there's a catch: there's no bullish divergence here. RSI is making a fresh low right alongside price, not diverging from it — which is the more bearish version of an oversold reading.
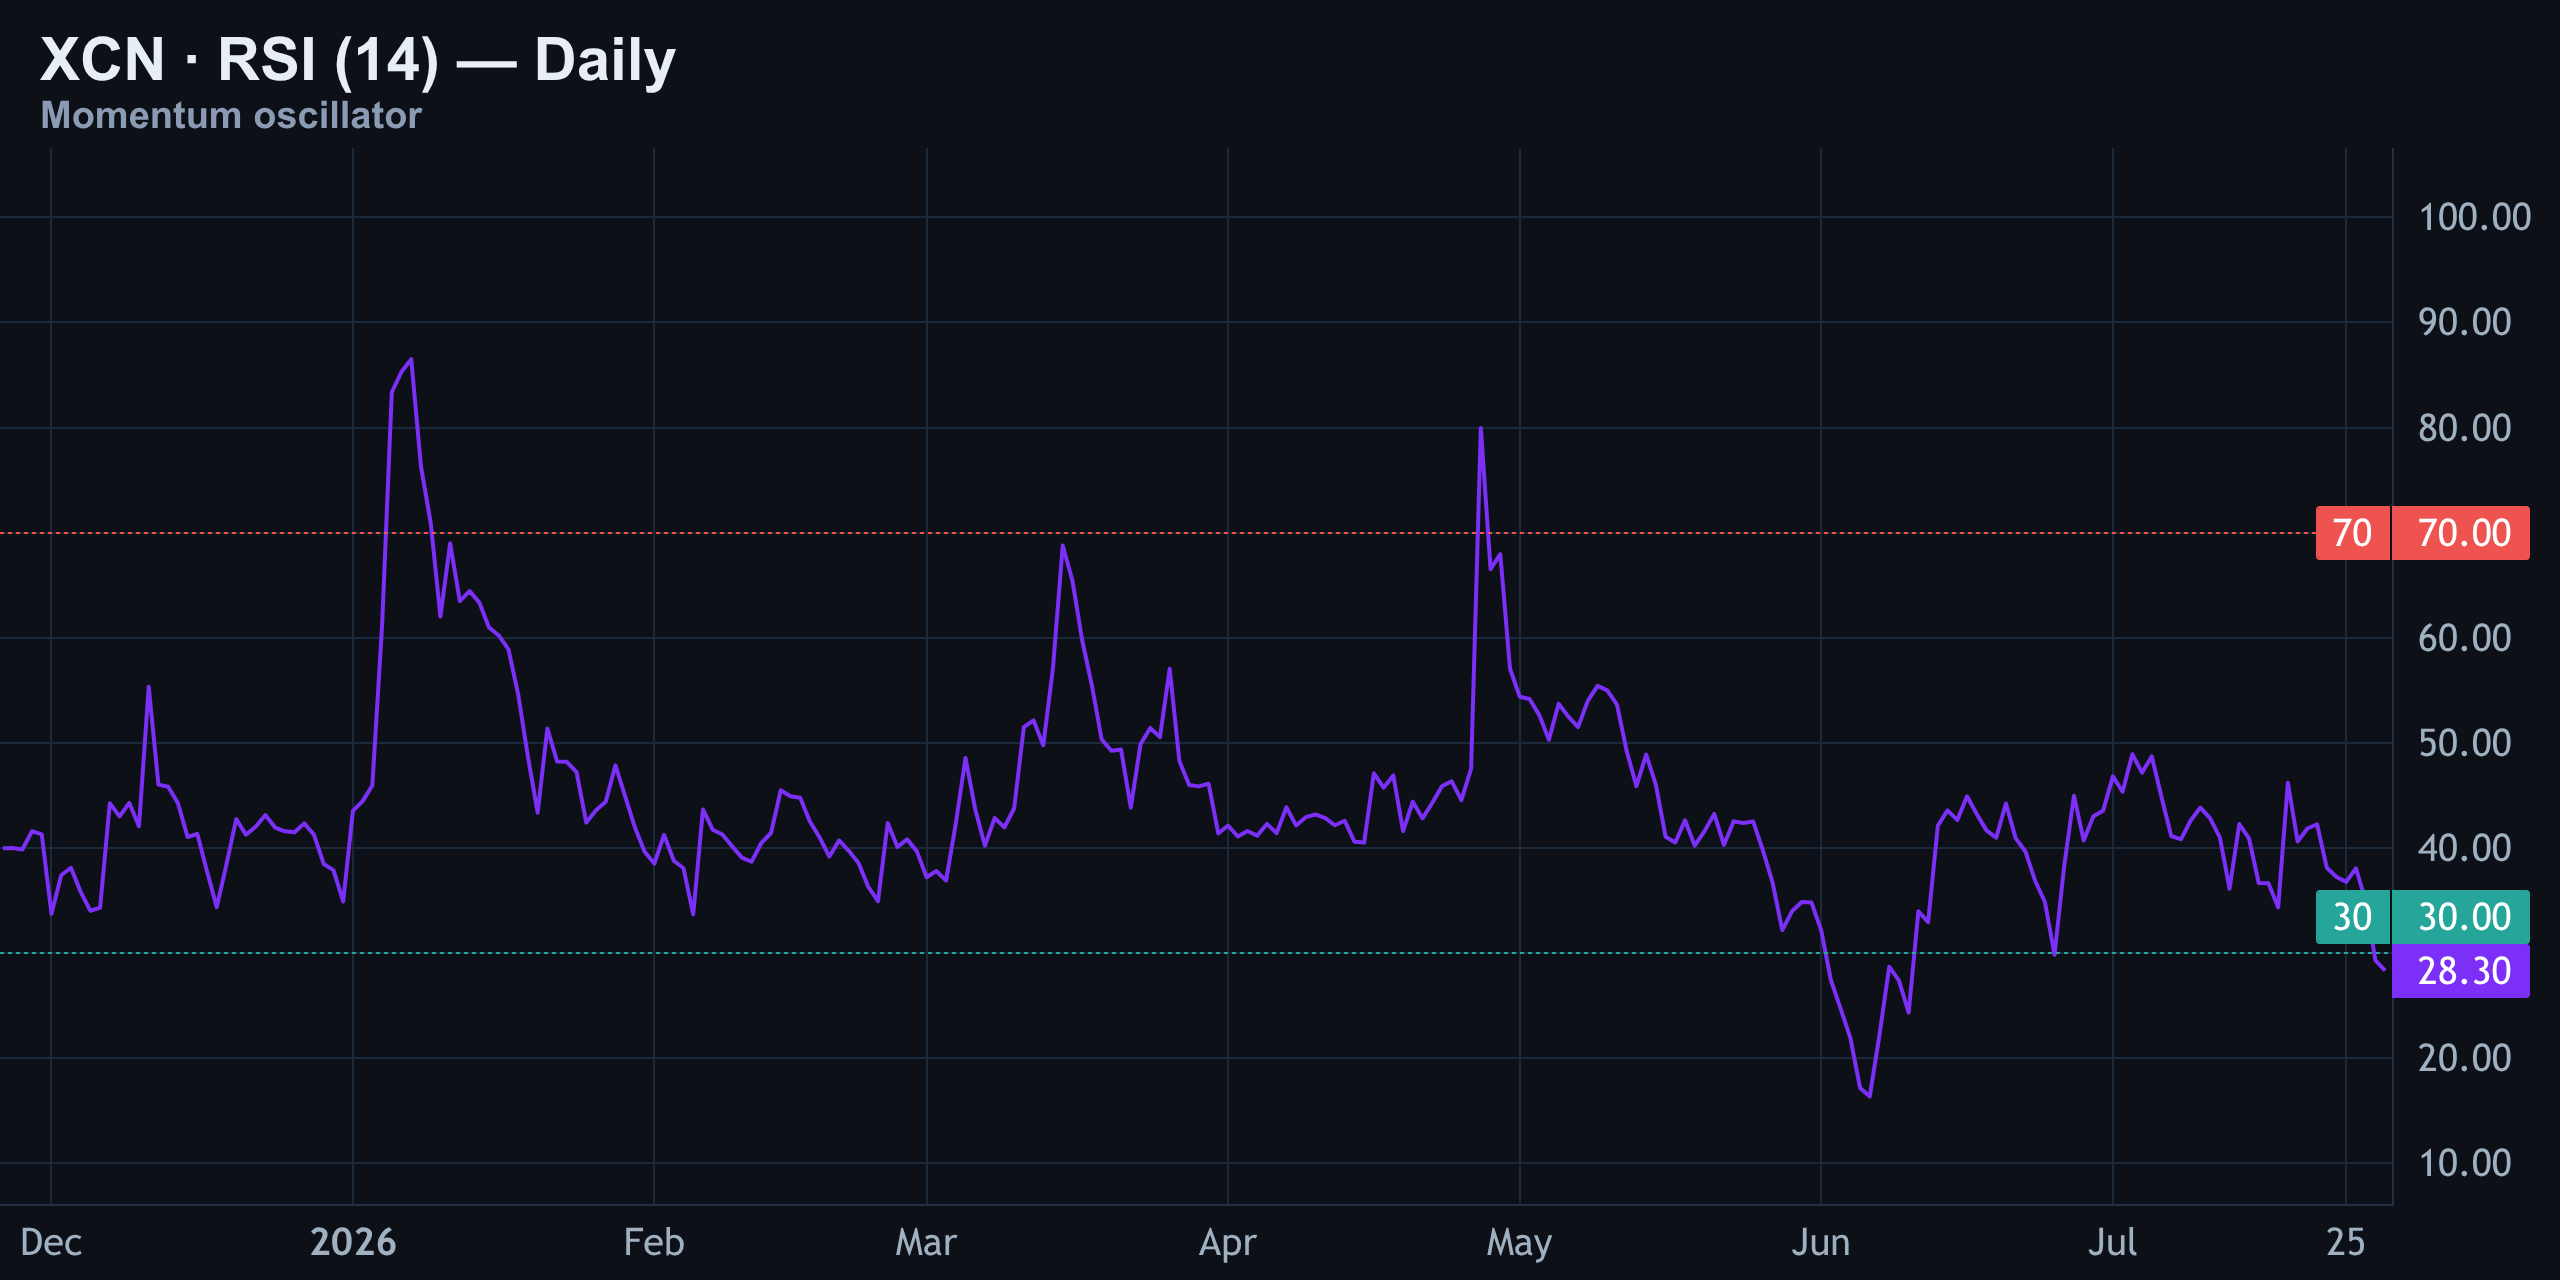
Context matters here. Back in June, XCN saw an even deeper oversold read near 20, and that only bought a few days of sideways chop before the downtrend resumed. In plain terms: momentum is stretched thin, but that alone hasn't been enough to reverse this trend recently.
MACD backs up the RSI story. The MACD line is sitting below the signal line, and the histogram bars are negative and creeping wider — meaning downside momentum is still building, not fading.
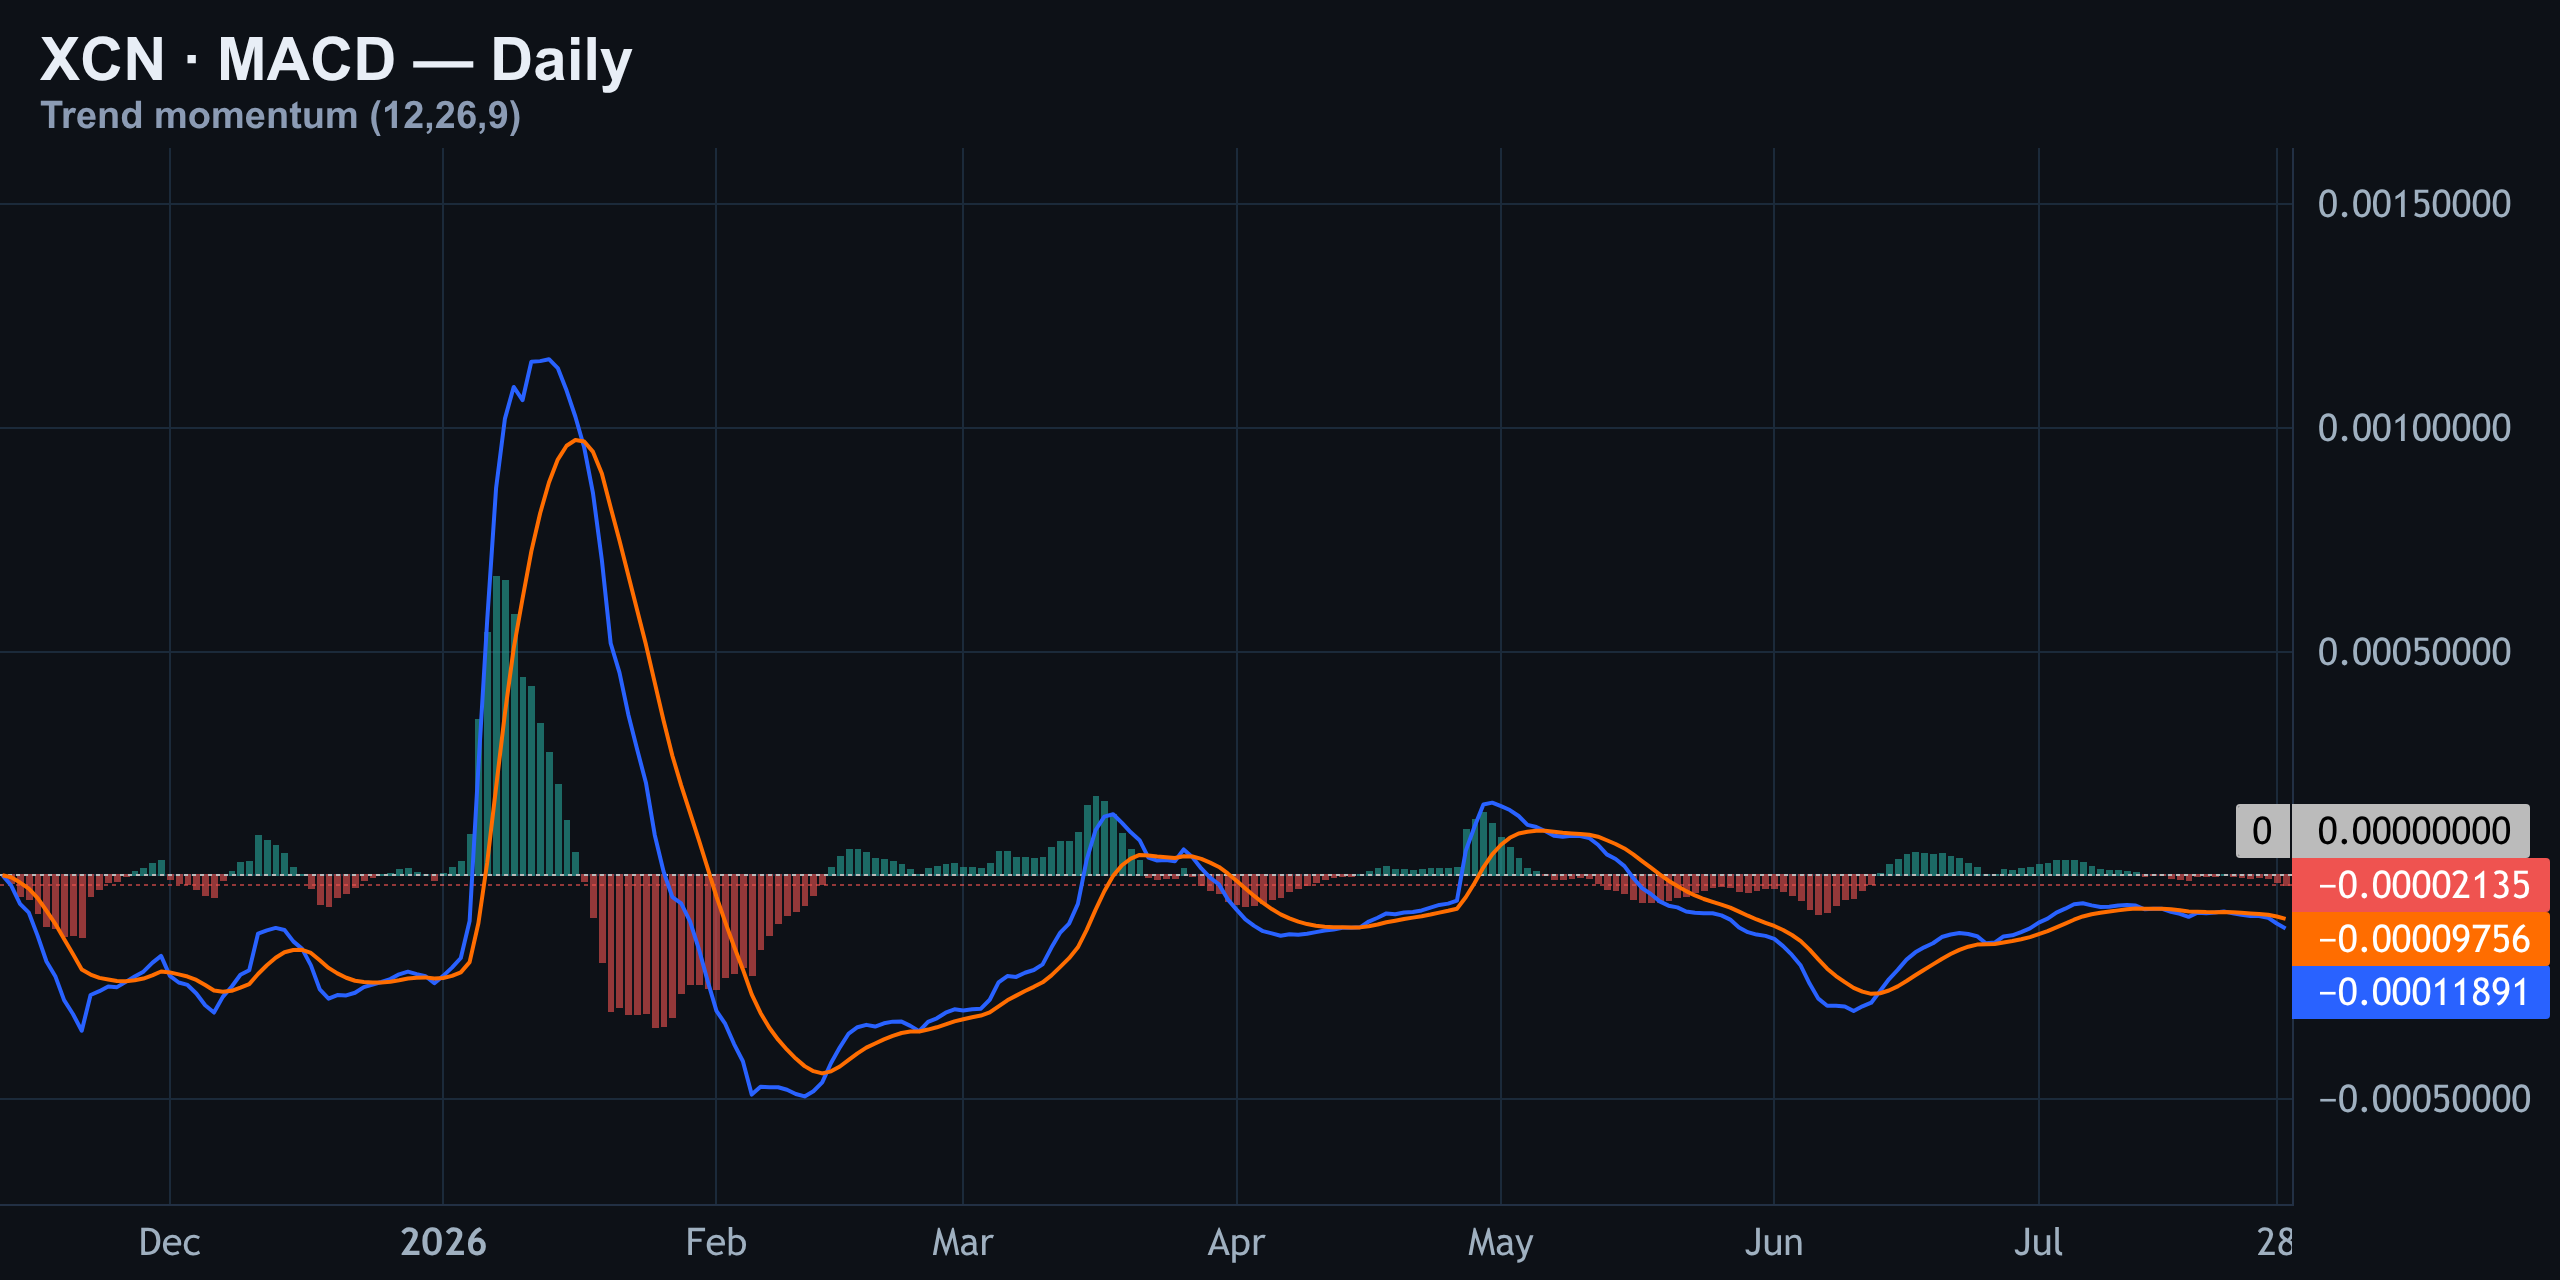
Compare that to the sharp green thrust back in early May — this move has none of that energy. It's a slow, grinding bleed rather than a violent capitulation, and grinding bleeds usually take longer to exhaust themselves than sharp panic drops do.
Levels to Watch: The Liquidation Map
The map is tight right now. Spot is hugging $0.003321, right against the daily support shelf at $0.0033120. Just above that sits the densest liquidation cluster of the last two weeks — real, fought-over leverage, not a target to aim for.
| Level | Price | Type |
|---|---|---|
| Daily support shelf | $0.0033120 | Structural floor |
| Densest liquidation cluster | $0.0033430 | Cleared leverage — resistance |
| Short-squeeze zone 1 | $0.0035010 | Prior liquidation wall |
| Short-squeeze zone 2 | $0.0036850 | Prior liquidation wall |
| Below spot | None stacked | Open air — fast-move risk |
Higher up, $0.0035010 and $0.0036850 mark where shorts got squeezed before — worth watching if a bounce does materialize, but not the base case right now.
Today's Macro Drivers: Why Sentiment Is Fragile
None of today's headlines are XCN-specific, but they still color the tape for smaller, less-liquid alt-coins like this one. Russia's Federal Security Service (FSB) charged Telegram founder Pavel Durov with facilitating terrorism on Wednesday, escalating pressure on the messaging platform that a large share of crypto-native communities rely on.
Headlines like that tend to add a layer of regulatory unease that weighs on risk appetite for smaller-cap tokens first, since they're the most sensitive to any pullback in speculative flow.
On the other side of the ledger, Morgan Stanley Investment Management launched spot Ethereum and Solana exchange-traded products on July 28, expanding beyond its earlier Bitcoin fund and offering a low-cost (0.14%) entry point for institutional exposure to ETH and SOL.
That's a bullish structural signal for the broader crypto market — institutional plumbing keeps getting built out — but it's a slow-burn tailwind for majors, not something that directly rescues a micro-cap alt sitting on a broken technical shelf today. For XCN specifically, the technical picture in front of us matters far more than the macro backdrop right now.
The Trade Setup: Entry, Stop, Target
Putting it together: bearish structure on the 15-minute and 4-hour charts, a daily shelf under direct pressure, oversold RSI with no divergence, and a MACD still favoring sellers. The higher-probability path remains bearish continuation, but expect chop before it resolves — oversold conditions this deep don't usually collapse in a straight line.
| Parameter | Level |
|---|---|
| Bias | Bearish continuation |
| Entry zone | Near $0.003414 (yesterday's short, still open) |
| Stop loss | $0.003496 |
| Target | $0.003209 |
| Risk:Reward | 1:2.5 |
The level that flips the whole bias is the daily shelf at $0.0033120. Hold it with a bounce back through $0.0034 and the oversold RSI argument gains real teeth. Lose it decisively and the path toward $0.00321 opens up with little in the way.
Not Financial Advice
Everything above is technical commentary based on publicly available price, volume, and liquidation data as of July 29, 2026. It is not financial advice, and crypto markets — especially lower-liquidity alt-coins like XCN — can move sharply against any thesis, technical or otherwise. Position size accordingly, use your own risk management, and never risk more than you can afford to lose.
Prices referenced here can differ by exchange; always check live venue pricing before acting.
Key takeaways
- XCN is down 2.3% to roughly $0.00332, testing the one daily support shelf ($0.0033120) standing between here and much lower prices.
- RSI at 28 is deeply oversold but shows no bullish divergence — a fresh low in RSI alongside price, the more bearish version of oversold.
- MACD remains bearish with a widening negative histogram, meaning downside momentum is still building, not fading.
- The densest liquidation cluster sits just above spot at $0.0033430 — cleared leverage, not a target — while nothing is stacked below spot yet.
- Yesterday's live short (entry $0.003414, stop $0.003496, target $0.003209) remains open and untriggered as of today's session.
Frequently asked questions
What is the XCN price today, July 29, 2026?
XCN is trading around $0.00332–$0.0034 depending on the exchange, with CoinMarketCap and TradingView showing roughly $0.00332 and Kraken/CoinGecko slightly higher near $0.0034.
Is XCN oversold right now?
Yes — the daily RSI (14) is at 28, a deeply oversold reading. However, there's no bullish divergence, meaning RSI is making fresh lows alongside price rather than diverging from it, which is the more bearish flavor of oversold.
What is the key support level for XCN?
The main daily support shelf sits at $0.0033120, the level price is currently testing. A clean break below opens room toward the $0.00321 area with little support in between.
Is the current XCN short trade still active?
Yes. Yesterday's short call (entry $0.003414, stop $0.003496, target $0.003209) has not been stopped out and has not yet reached its target, though price has moved in the direction of the trade.
What would flip the bearish bias on XCN?
A decisive close back above the daily shelf near $0.0034, followed by a reclaim of $0.0034–$0.0035, would meaningfully weaken the bearish continuation thesis.