
Analysis
XRP: Longs Liquidated as Smart Money Flips 1.66:1 Long
XRP's Rough Week: From $1.16 to $1.05
XRP has had a brutal seven days. Price opened the week near $1.14, pushed twice into resistance around $1.15–$1.16 on the 21st and 22nd, got rejected both times, and then simply bled lower — a slow grind through $1.12, then $1.10, into the $1.08–$1.09 pocket by the 24th and 25th.
There was a brief relief bounce back toward $1.10–$1.11 heading into the 27th, but it didn't hold. On the 28th, the floor gave way — a sharp red candle sliced straight through $1.08 and dropped price into the $1.05 area, where XRP is trading right now.
That's not a gentle pullback. That's a market that tried twice to go higher, failed, and then accelerated to the downside once it broke support. The question this article is built around is simple: is that move done, or just getting started?
The Twin $2.9M Liquidation Magnets
Our desk tracks liquidity pools sitting above and below current price — clusters of leveraged positions that get force-closed if price wicks through them. Right now XRP is boxed in by two nearly identical pools, each worth $2.9 million.
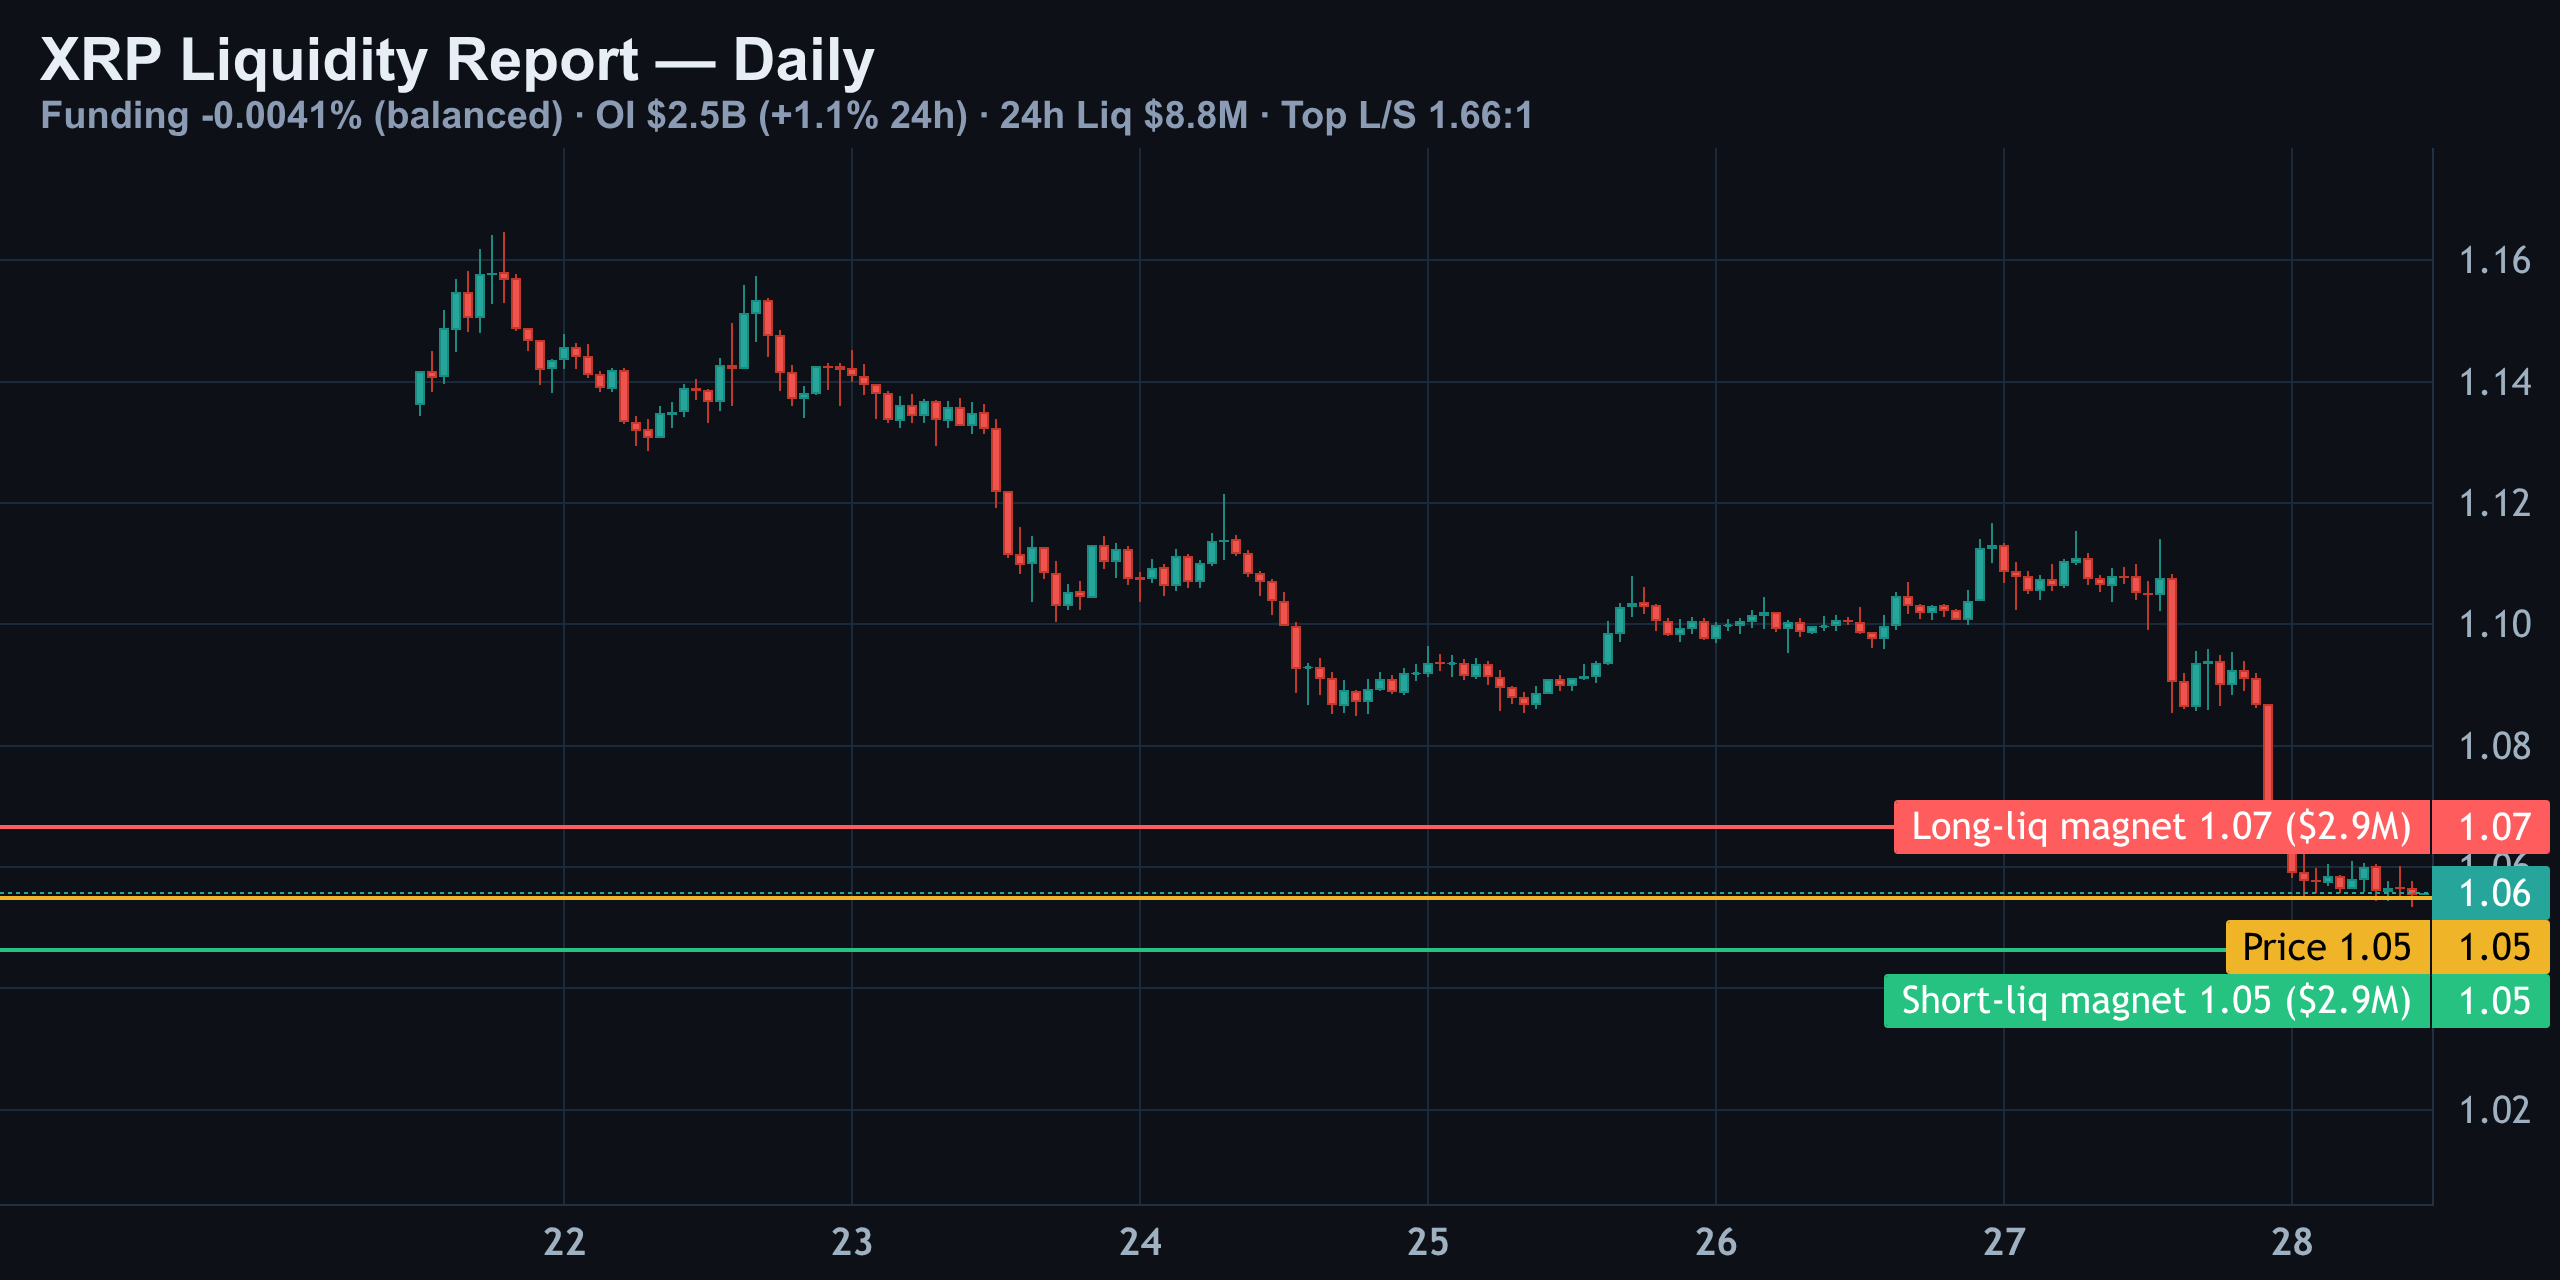
The red line up at $1.07 is the long-liquidation magnet — leveraged longs that get wiped out if price wicks back up through it. The green line down at $1.05 is the short-liquidation magnet — an equal-sized pool of shorts that get liquidated if price pushes lower still. Price has essentially already fallen into that lower pool, which is exactly why the next move matters so much: whichever magnet gets triggered first tends to accelerate price toward it, then snap back once the liquidity is cleared.
| Magnet | Level | Size | Trigger |
|---|---|---|---|
| Long liquidation | $1.07 | $2.9M | Price wicks up through it |
| Short liquidation | $1.05 | $2.9M | Price wicks down through it |
Funding, Open Interest & Liquidations: The Mechanical Story
Before reading positioning, you have to read the mechanics. Here's the current derivatives snapshot on XRP:
| Metric | Value |
|---|---|
| Funding rate | -0.0041% (roughly -4.5% annualized) |
| Open interest | $2.5B (+1.1% in 24h) |
| 24h liquidations (total) | $8.8M |
| Long liquidations (24h) | $8.6M |
| Short liquidations (24h) | $136.5K |
| Top-trader long/short ratio | 1.66:1 long |
| Retail long/short ratio | 0.96:1 (near even) |
| 4h RSI | 27.9 (oversold) |
Funding sitting at essentially zero is the first thing to rule out. There's no crowded long side getting bled and no crowded short side either — whatever happens next isn't a classic funding squeeze, because the leverage simply isn't lopsided enough to create one.
Open Interest Rising Into a Falling Price — Read the Combination
Open interest climbed 1.1% to $2.5 billion over the same 24 hours that price dropped from ~$1.10 to ~$1.05. Read that combination literally: rising open interest plus falling price means new short positions are being opened, not just old longs closing out.
That's the more aggressive version of a selloff. It tells you sellers are pressing in with fresh leveraged capital, not simply watching existing longs get unwound. On its own, this is a bearish signal — traders are willing to add size to the downside at these levels, not just ride the move passively.
But open interest and price action never tell the whole story on their own. You have to weigh it against what actually got liquidated, and who's still holding size.
$8.6M in Longs Liquidated: A One-Sided Flush
Over the past 24 hours, $8.6 million in long positions were liquidated against just $136.5K in shorts — roughly 1,942 orders total, almost all in one direction. This is a lopsided flush, not a two-sided shakeout.
- Longs took ~98.4% of total liquidation volume in the past 24 hours
- Shorts were barely touched, losing just over $136K
- The imbalance suggests over-leveraged long positions were the ones cleared out, not shorts
When a flush is this one-sided, it usually means the weak, over-leveraged side of the market has already been forced out. The real question becomes whether the selling behind that flush was genuine distribution, or a stop-hunt that's now mostly spent its ammunition. That's exactly where the next data point becomes decisive.
The Divergence: Smart Money Flips 1.66:1 Long While Retail Sits Even
Here's the tension at the heart of this setup. Binance's top-trader long/short ratio — position-weighted, tracking the accounts running the biggest size — currently sits at 1.66:1 in favor of longs. Compare that to the broader retail crowd, where the long/short ratio is nearly split down the middle at 0.96:1.
| Cohort | Long/Short Ratio | Read |
|---|---|---|
| Top traders | 1.66:1 long | Leaning long, real size added |
| Retail crowd | 0.96:1 | Essentially split, no clear bias |
That's a genuine divergence, not noise. Smart money is adding long exposure into a move that just liquidated a wave of longs and printed fresh short open interest at the same time. Layer in the 4-hour RSI at 27.9, deep in oversold territory, and you've now got three separate signals — the lopsided liquidation flush, the top-trader lean, and the oversold reading — all quietly arguing this downside move is stretched, even as the raw open-interest-versus-price mechanics still technically favor more selling.
What This Means for Your Next Move
Put the pieces together and here's the honest summary: funding gives you nothing — it's flat, so there's no crowded side coiled up for a squeeze. Open interest rising into falling price is a real bearish tell, evidence of fresh short capital rather than long capitulation alone. But the liquidation data shows nearly all of today's pain landed on longs, which typically signals the weak hands are already flushed out. And the top-trader book just diverged sharply from retail, flipping 1.66:1 long while the crowd sits near even.
- Watch the $1.07 magnet — a reclaim above it risks triggering the long-liquidation pool and could accelerate a short squeeze
- Watch the $1.05 magnet — a break below it clears the remaining short liquidity and could open room for a deeper flush
- Neutral funding means don't expect a violent squeeze purely from leverage imbalance — this is a positioning story, not a funding story
- The top-trader vs. retail divergence is the single most important data point here — smart money rarely leans this hard without conviction
Nothing here is a guarantee — derivatives data describes positioning and pressure, not certainty. But when the crowd is split down the middle and the biggest accounts on the book have quietly leaned 1.66:1 long into an oversold flush, that's worth paying attention to before assuming the selloff simply continues in a straight line.
Key takeaways
- XRP fell from ~$1.16 to ~$1.05 over the past week after two rejections at resistance
- $8.6M in longs were liquidated in 24 hours vs. just $136.5K in shorts — a one-sided flush
- Open interest rose 1.1% to $2.5B while price fell, pointing to fresh short capital entering
- Top traders flipped to 1.66:1 long even as retail sits near even at 0.96:1 — a real divergence
- Two $2.9M liquidation magnets sit at $1.07 (longs) and $1.05 (shorts), framing the next move
Frequently asked questions
Why did XRP longs get liquidated so heavily?
XRP dropped sharply from the $1.10 area to $1.05 on July 28, triggering stop-outs on over-leveraged long positions. $8.6M in longs were liquidated versus just $136.5K in shorts over 24 hours.
What does a 1.66:1 top-trader long/short ratio mean?
It means the largest, most position-weighted accounts on the exchange are leaning long by a ratio of 1.66-to-1, in contrast to the broader retail crowd, which sits at a nearly even 0.96:1.
Is rising open interest bullish or bearish for XRP right now?
Open interest rose 1.1% while price fell, which typically signals fresh short positions being opened rather than longs simply closing out — a bearish mechanical signal on its own.
What are the key XRP liquidation levels to watch?
There are two $2.9M liquidity pools: a long-liquidation magnet at $1.07 and a short-liquidation magnet at $1.05, both likely to influence short-term price action.
Is XRP oversold right now?
The 4-hour RSI sits at 27.9, which is in oversold territory, adding to signs that the recent downside move may be stretched.