Daily market analysis
XRP (XRP) technical analysis today
Last updated
XRP Daily Pulse Aug 19, 2026: One Dollar and the Squeeze
Where We Left It: Yesterday's Short Call Is Still Live
Quick scorecard before we dive in. Since our last update, XRP climbed roughly one percent, moving from around ninety-nine point eight cents to just above one dollar and seven-tenths of a cent. Yahoo Finance data confirms XRP is currently changing hands around $1.0058, up about 1.09% on the day.
The short call we flagged yesterday — entry at $1.007, stop at $1.018, target near $0.9795 — is still open. It hasn't been stopped out, and it hasn't hit target either. Price bounced overnight, but crucially, it stayed under the ceiling that entire call was built around. That's an important detail: a bounce that respects resistance isn't a trend change, it's a retest.
15-Minute Intraday: Riding the Rising Channel
Zoom into the fifteen-minute chart and today's story is a steady grind higher inside a rising channel. Price dipped to around ninety-three cents overnight, then a sharp volume spike kicked off the move that's carried XRP back above one dollar.
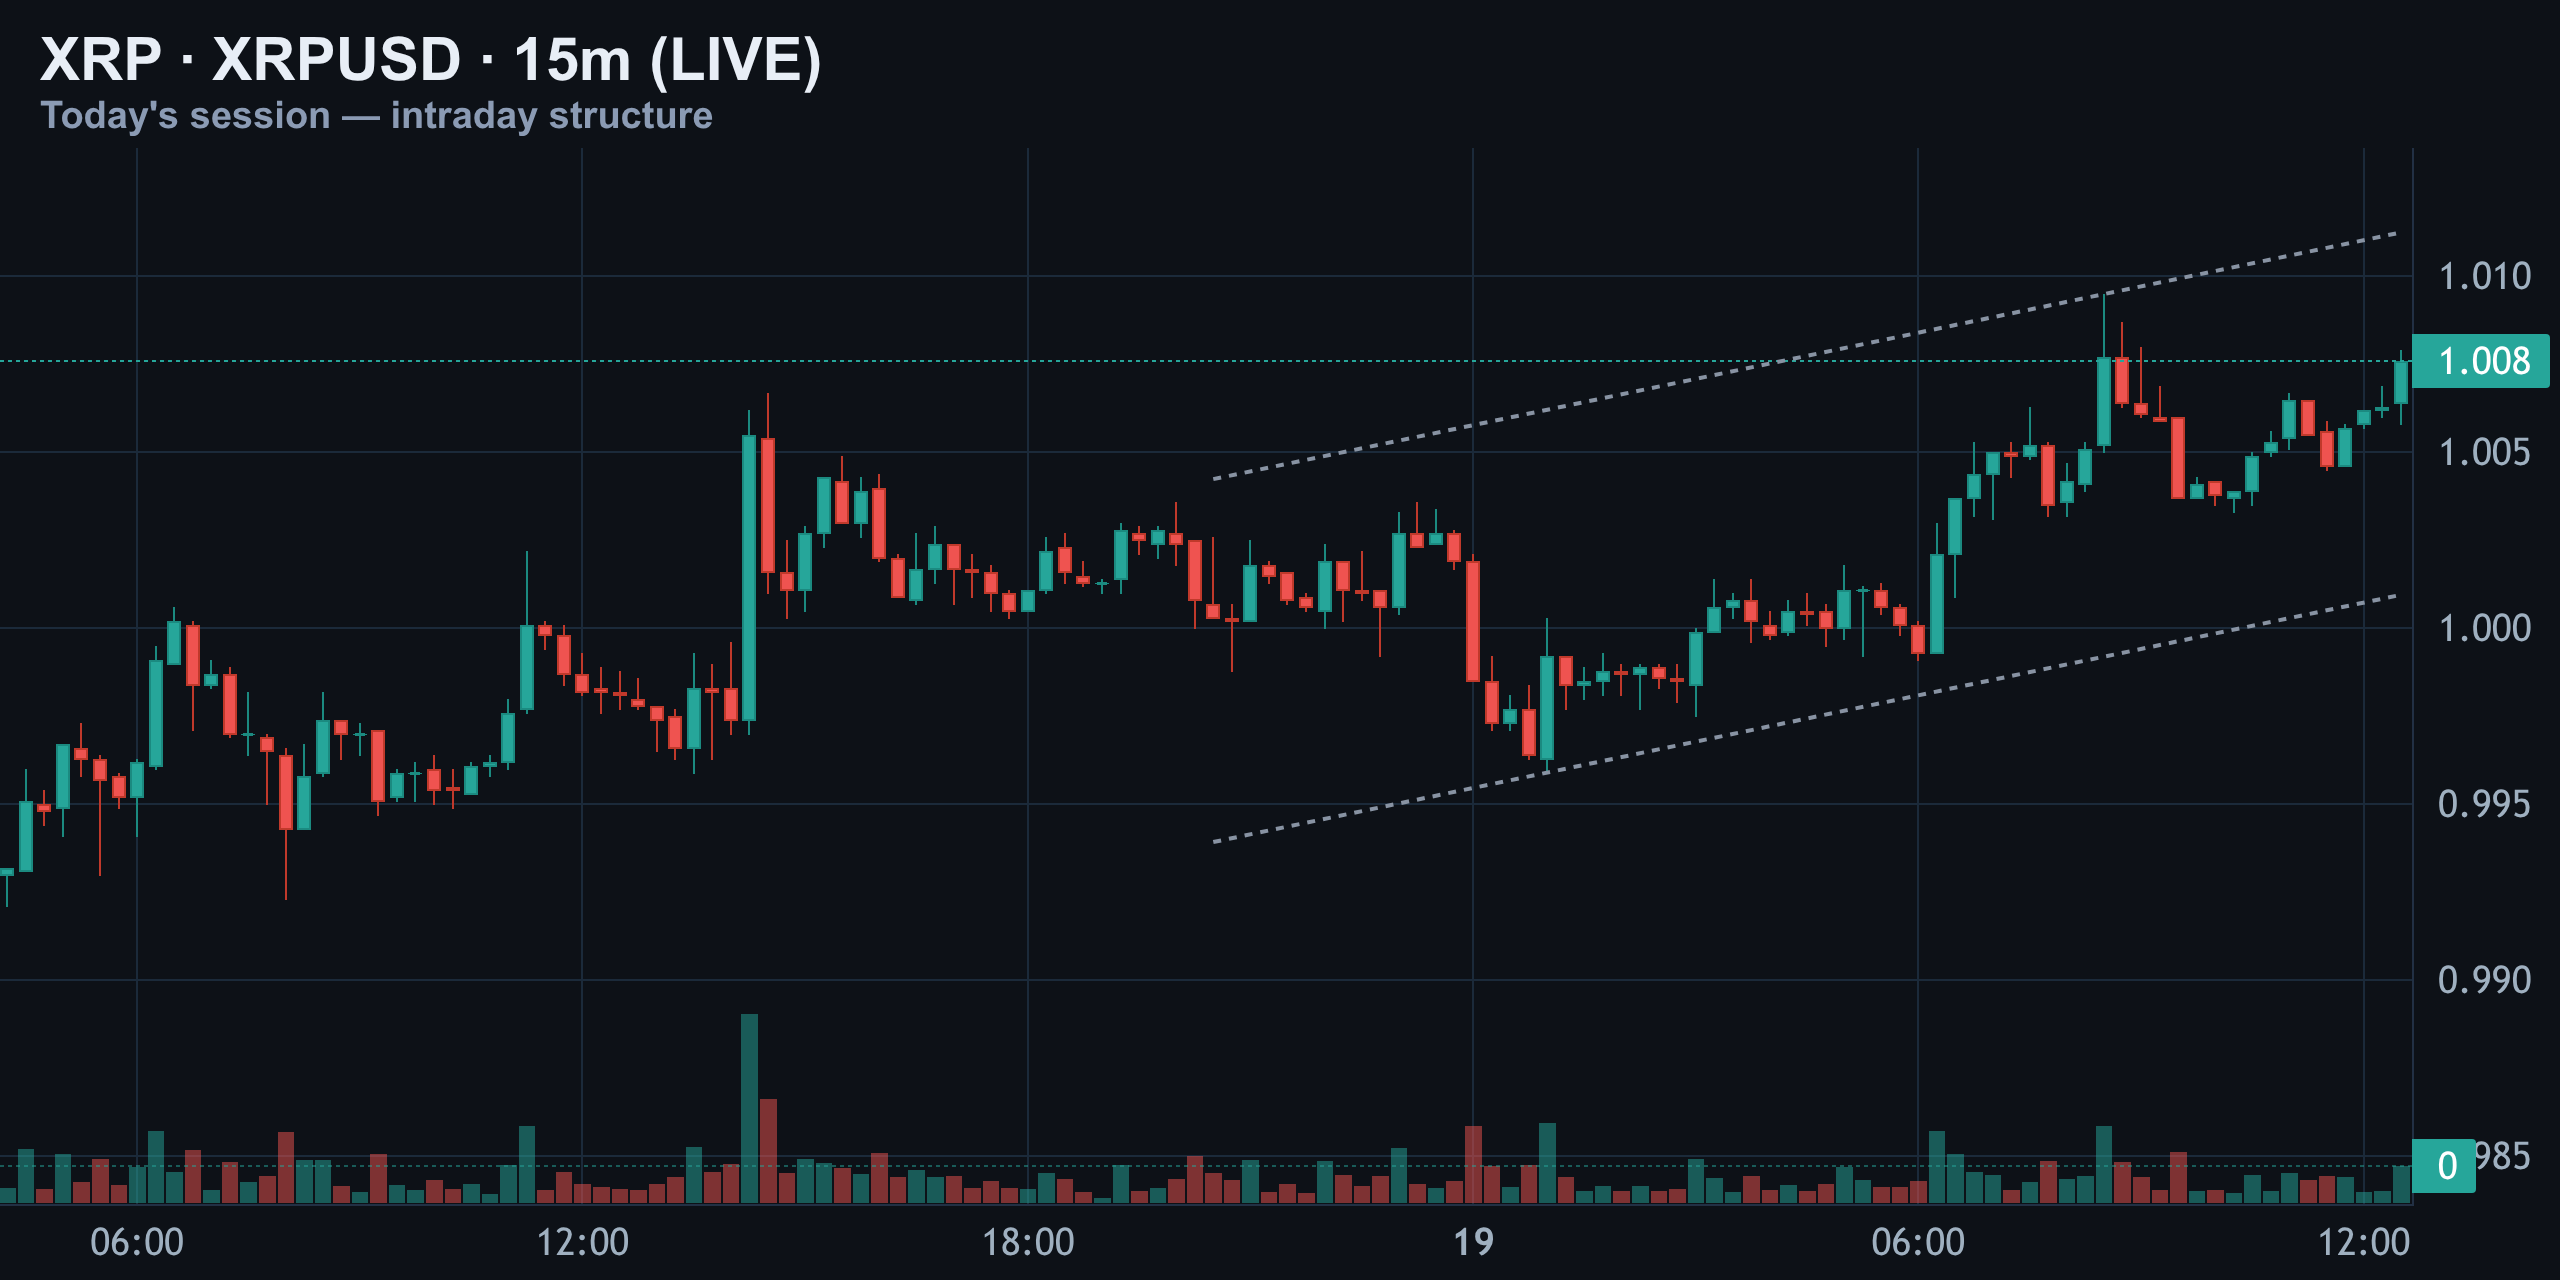
Right now price is testing the top rail of that channel near $1.008. That's the first thing to watch today — a clean push through this rail with volume behind it, or a rejection right back into the channel. In plain terms: price has been climbing steadily today, but it's testing its ceiling.
4-Hour Structure: Still Under the Bigger Ceiling
Step back to the four-hour timeframe and the picture is noticeably less friendly. XRP topped out above $1.09 in early August and has been carving lower highs ever since, inside a clear descending channel.
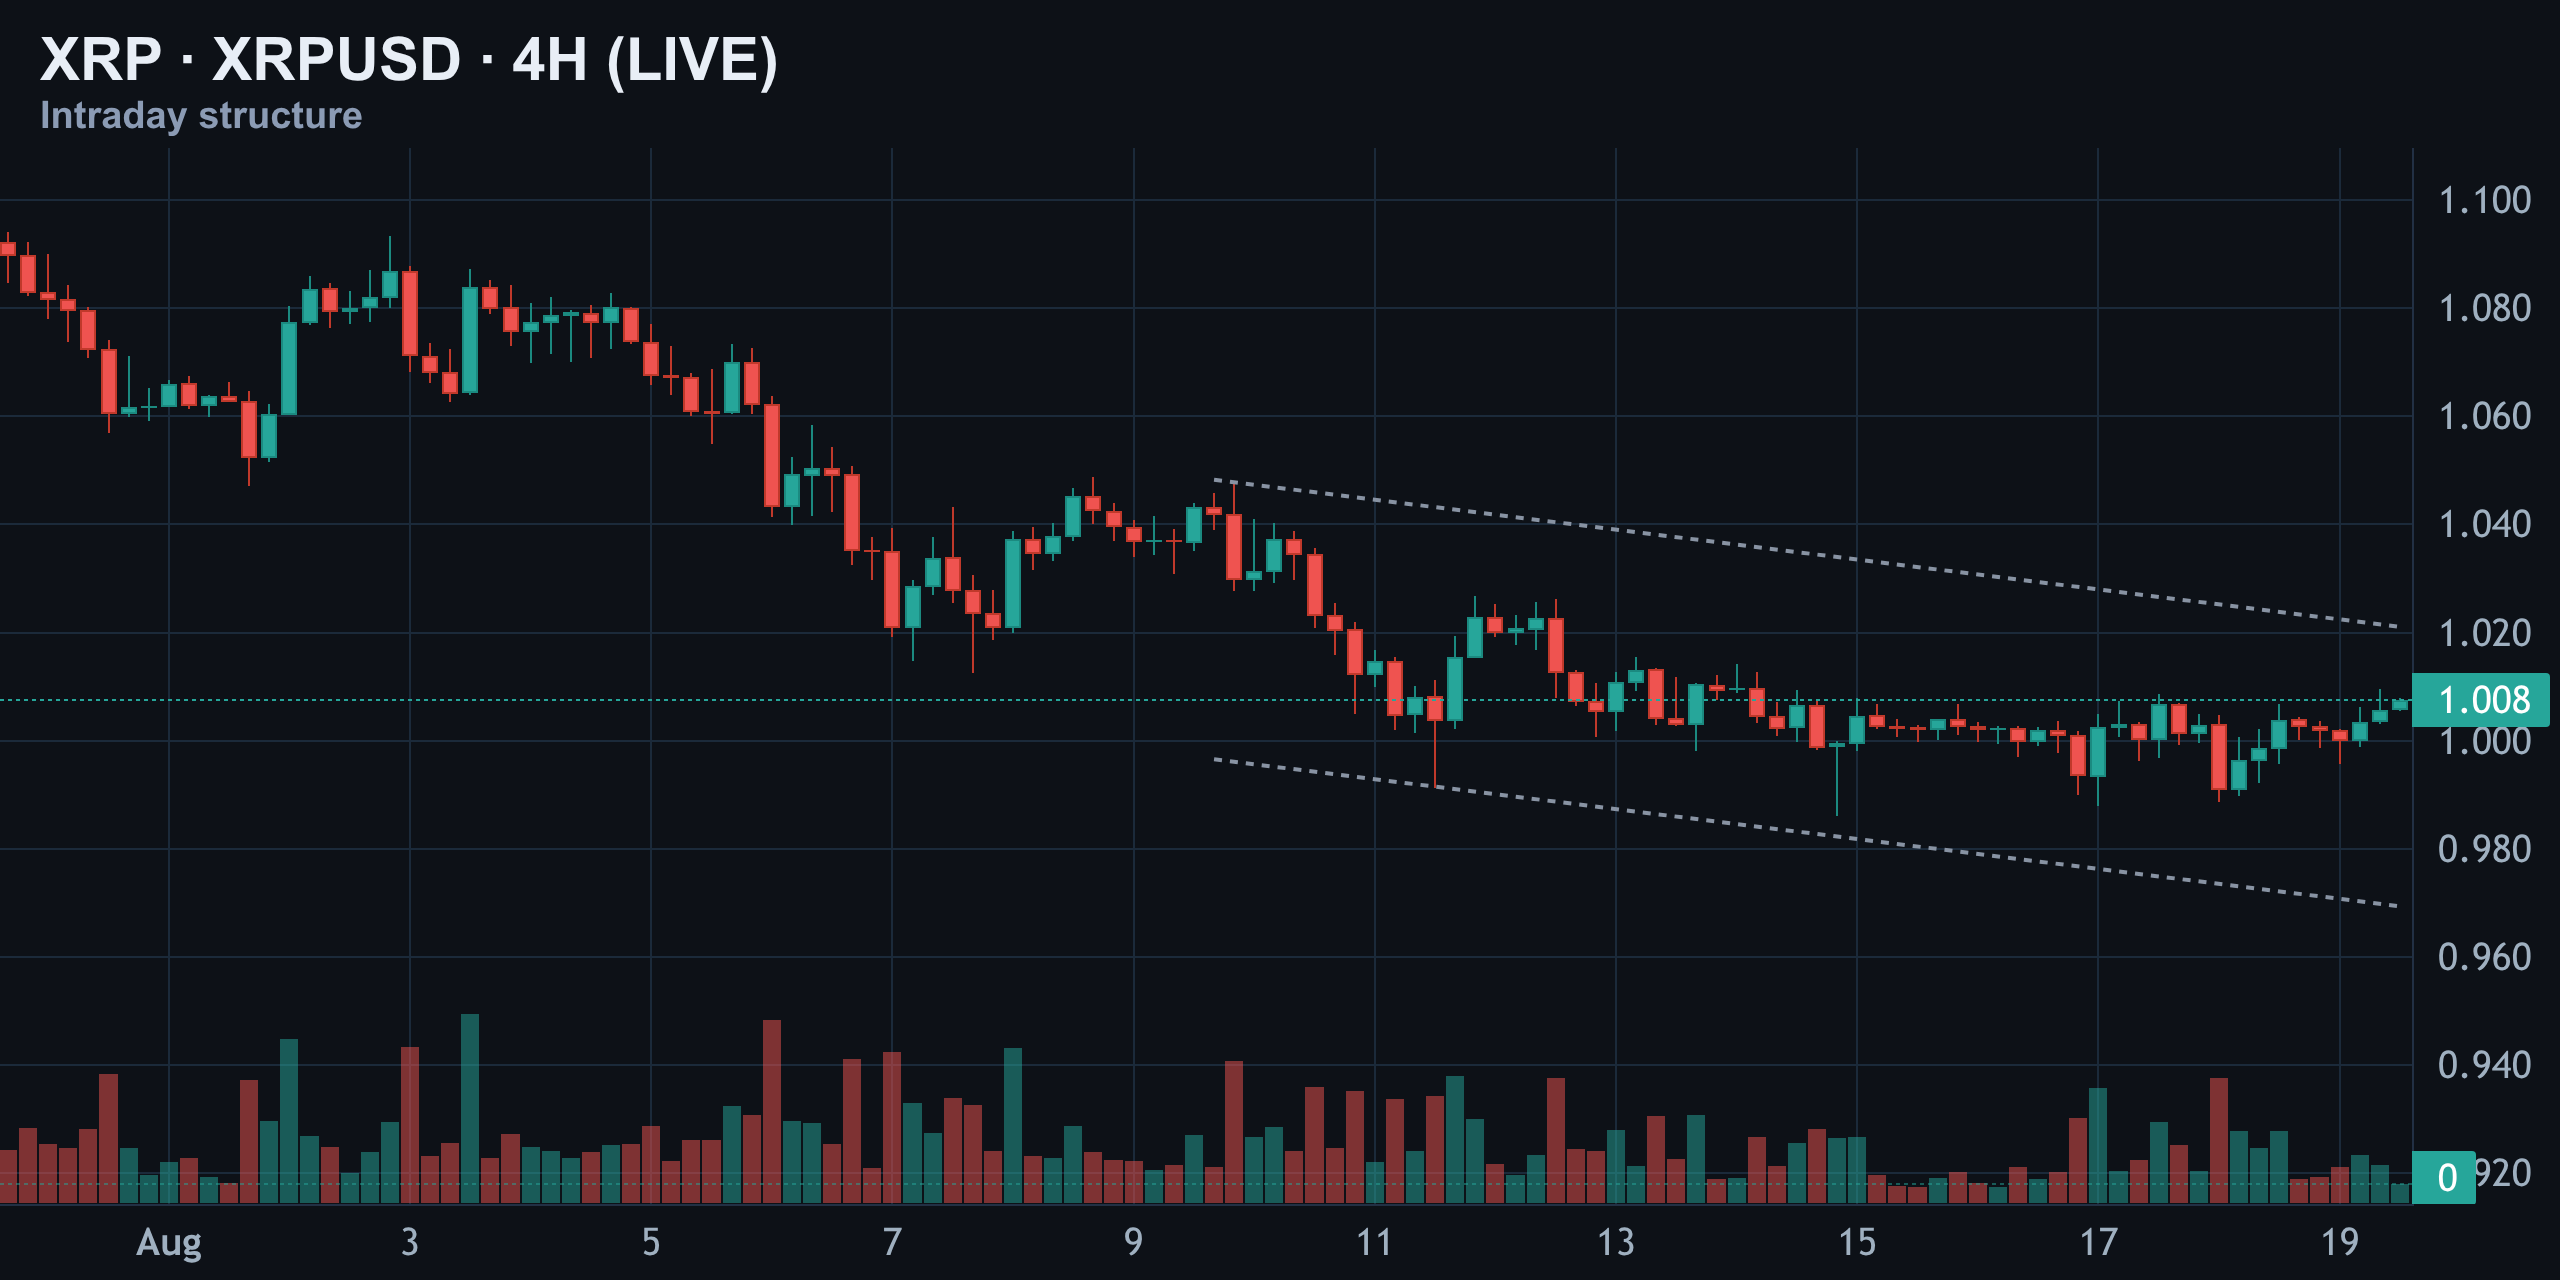
The bounce over the last two sessions has lifted price back toward the one-dollar mark, but it's still trading underneath that channel's resistance line. This is the frame that matters most for today — the fifteen-minute strength is happening inside a structure that's still technically bearish until proven otherwise. In plain terms: today's bounce is happening inside a bigger downtrend that hasn't broken yet.
| Level | Price | What It Means |
|---|---|---|
| 4H Resistance (ceiling) | $1.03 | Bulls need a close above this to shift bias |
| Current Price | $1.008 | Testing the rising-channel top rail |
| Daily Support (floor) | $0.9862 | Held for nearly a week, no clean breakdown yet |
Daily Chart: Compressing Into the Apex
The daily chart shows XRP compressing into the apex of a falling channel that's been intact since mid-July. Support sits at $0.9862, and price has been hugging that floor for the better part of a week without a clean breakdown.
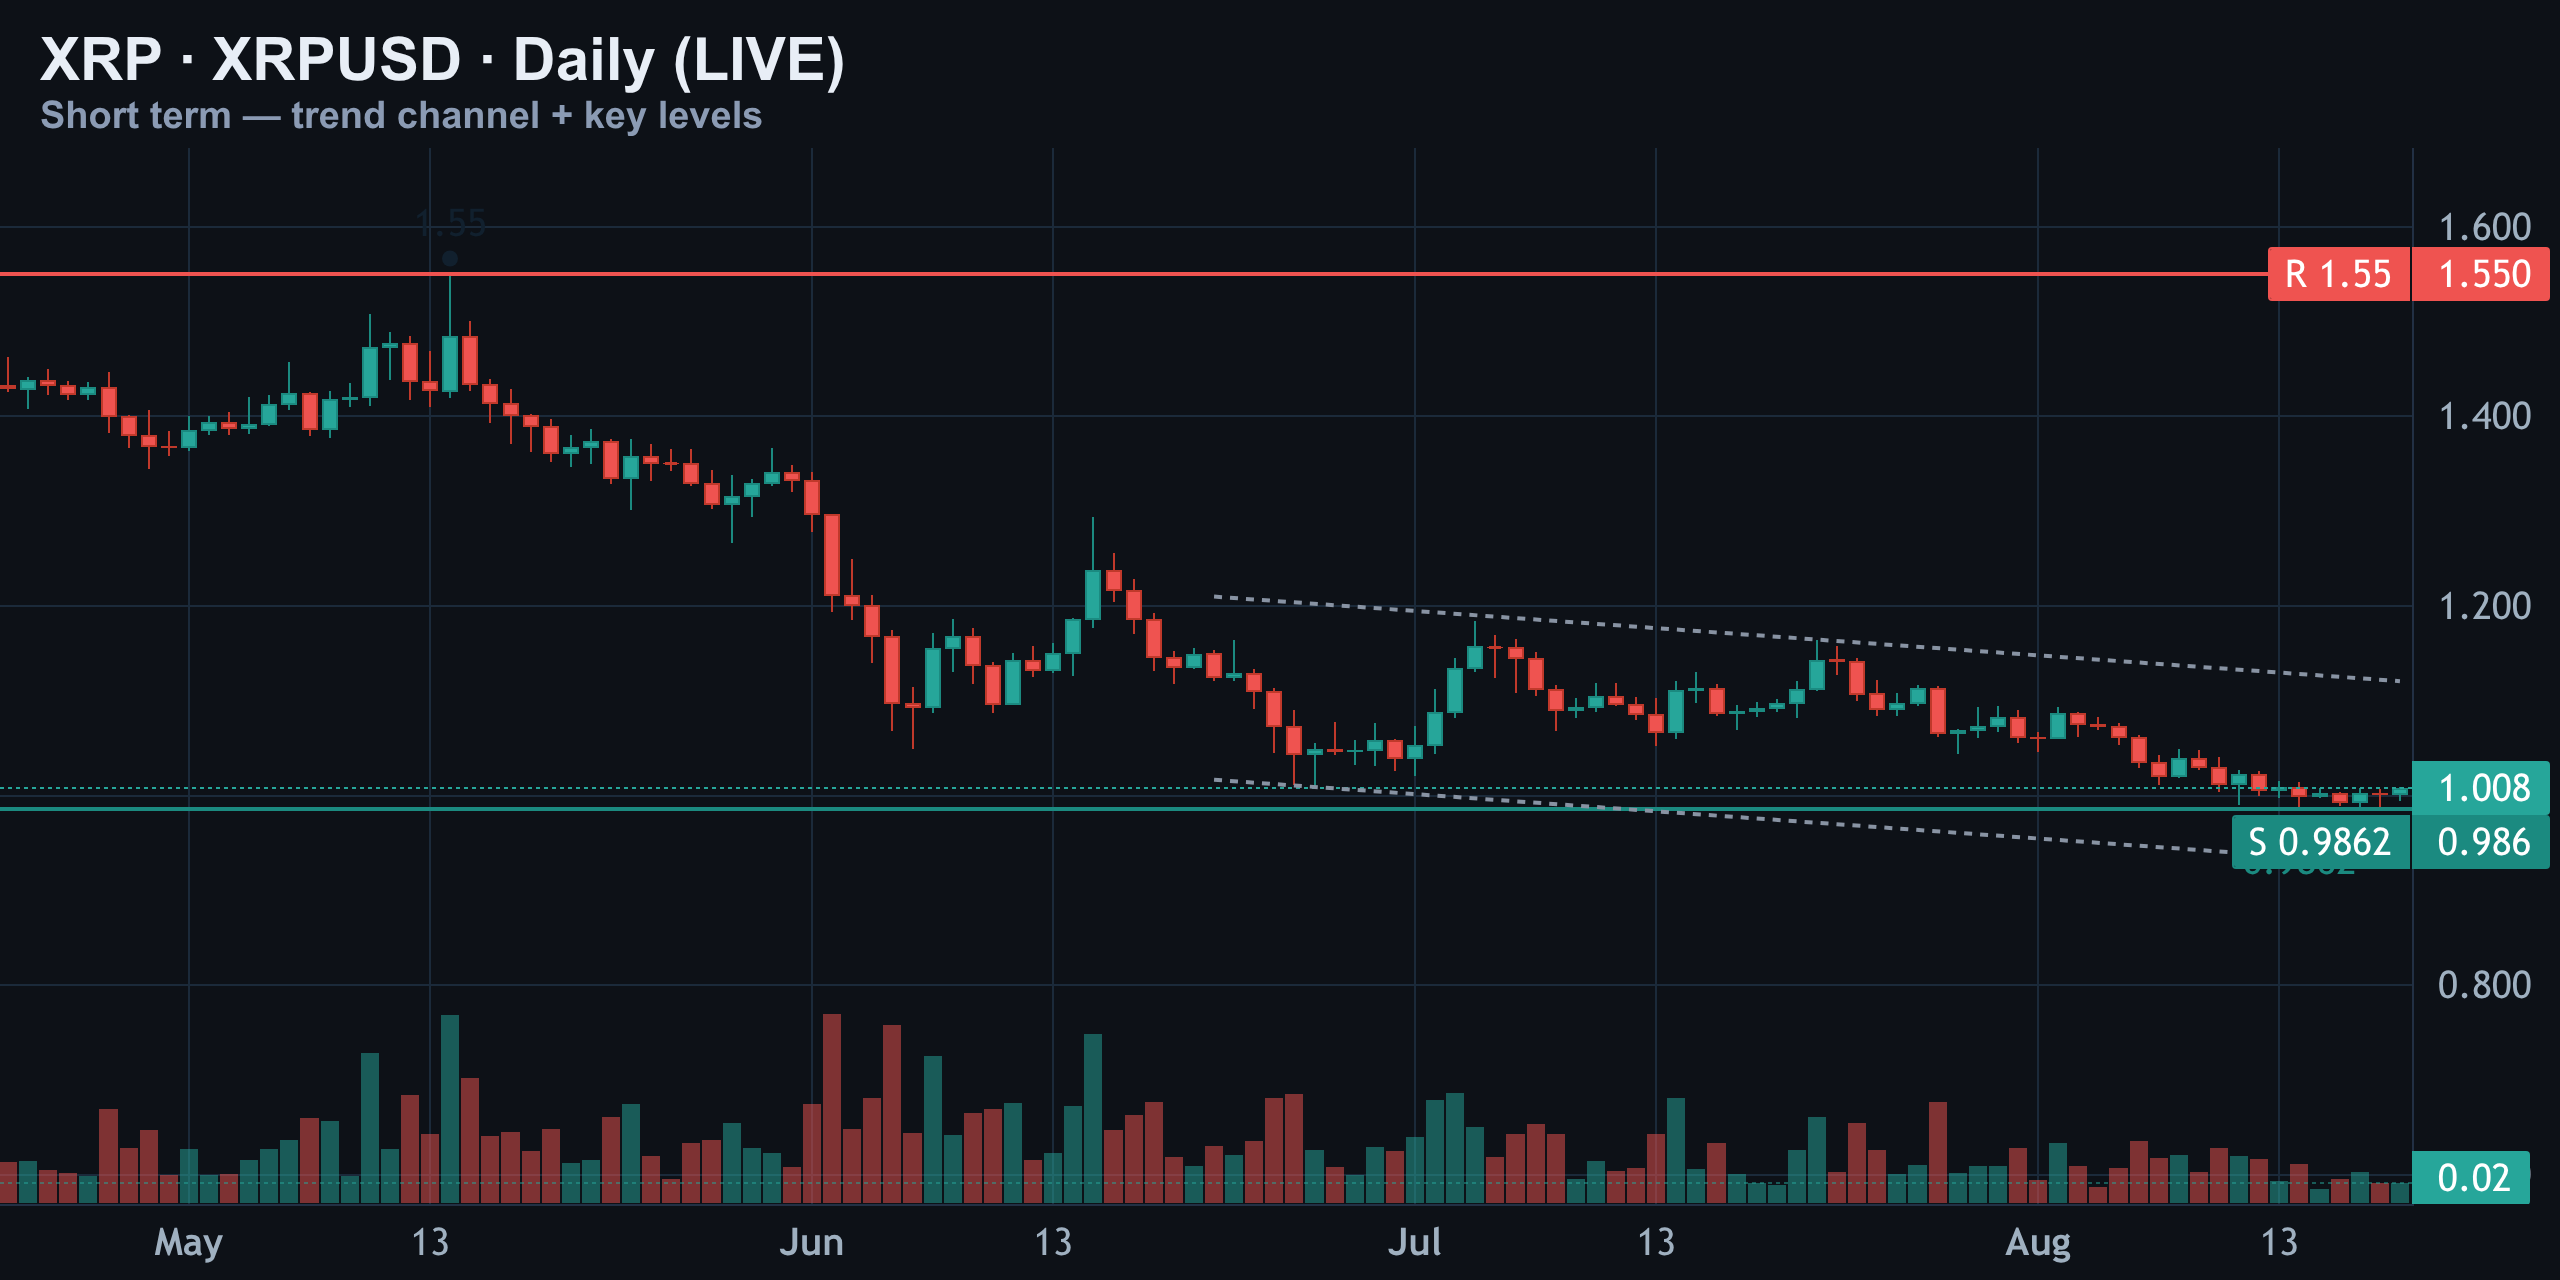
That's actually a tell — sellers haven't been able to force a decisive break lower, even with momentum soft. The $1.55 level up top is old news; the real decision is happening in this tight band right here. In plain terms: price is squeezed near a key floor and can't break it yet.
Momentum Check: RSI and MACD Still Lean Bearish
Momentum confirms the caution. RSI (14) on the daily sits at 40 — that's neutral territory, not oversold, but still below the 50 midline that separates bullish and bearish control.
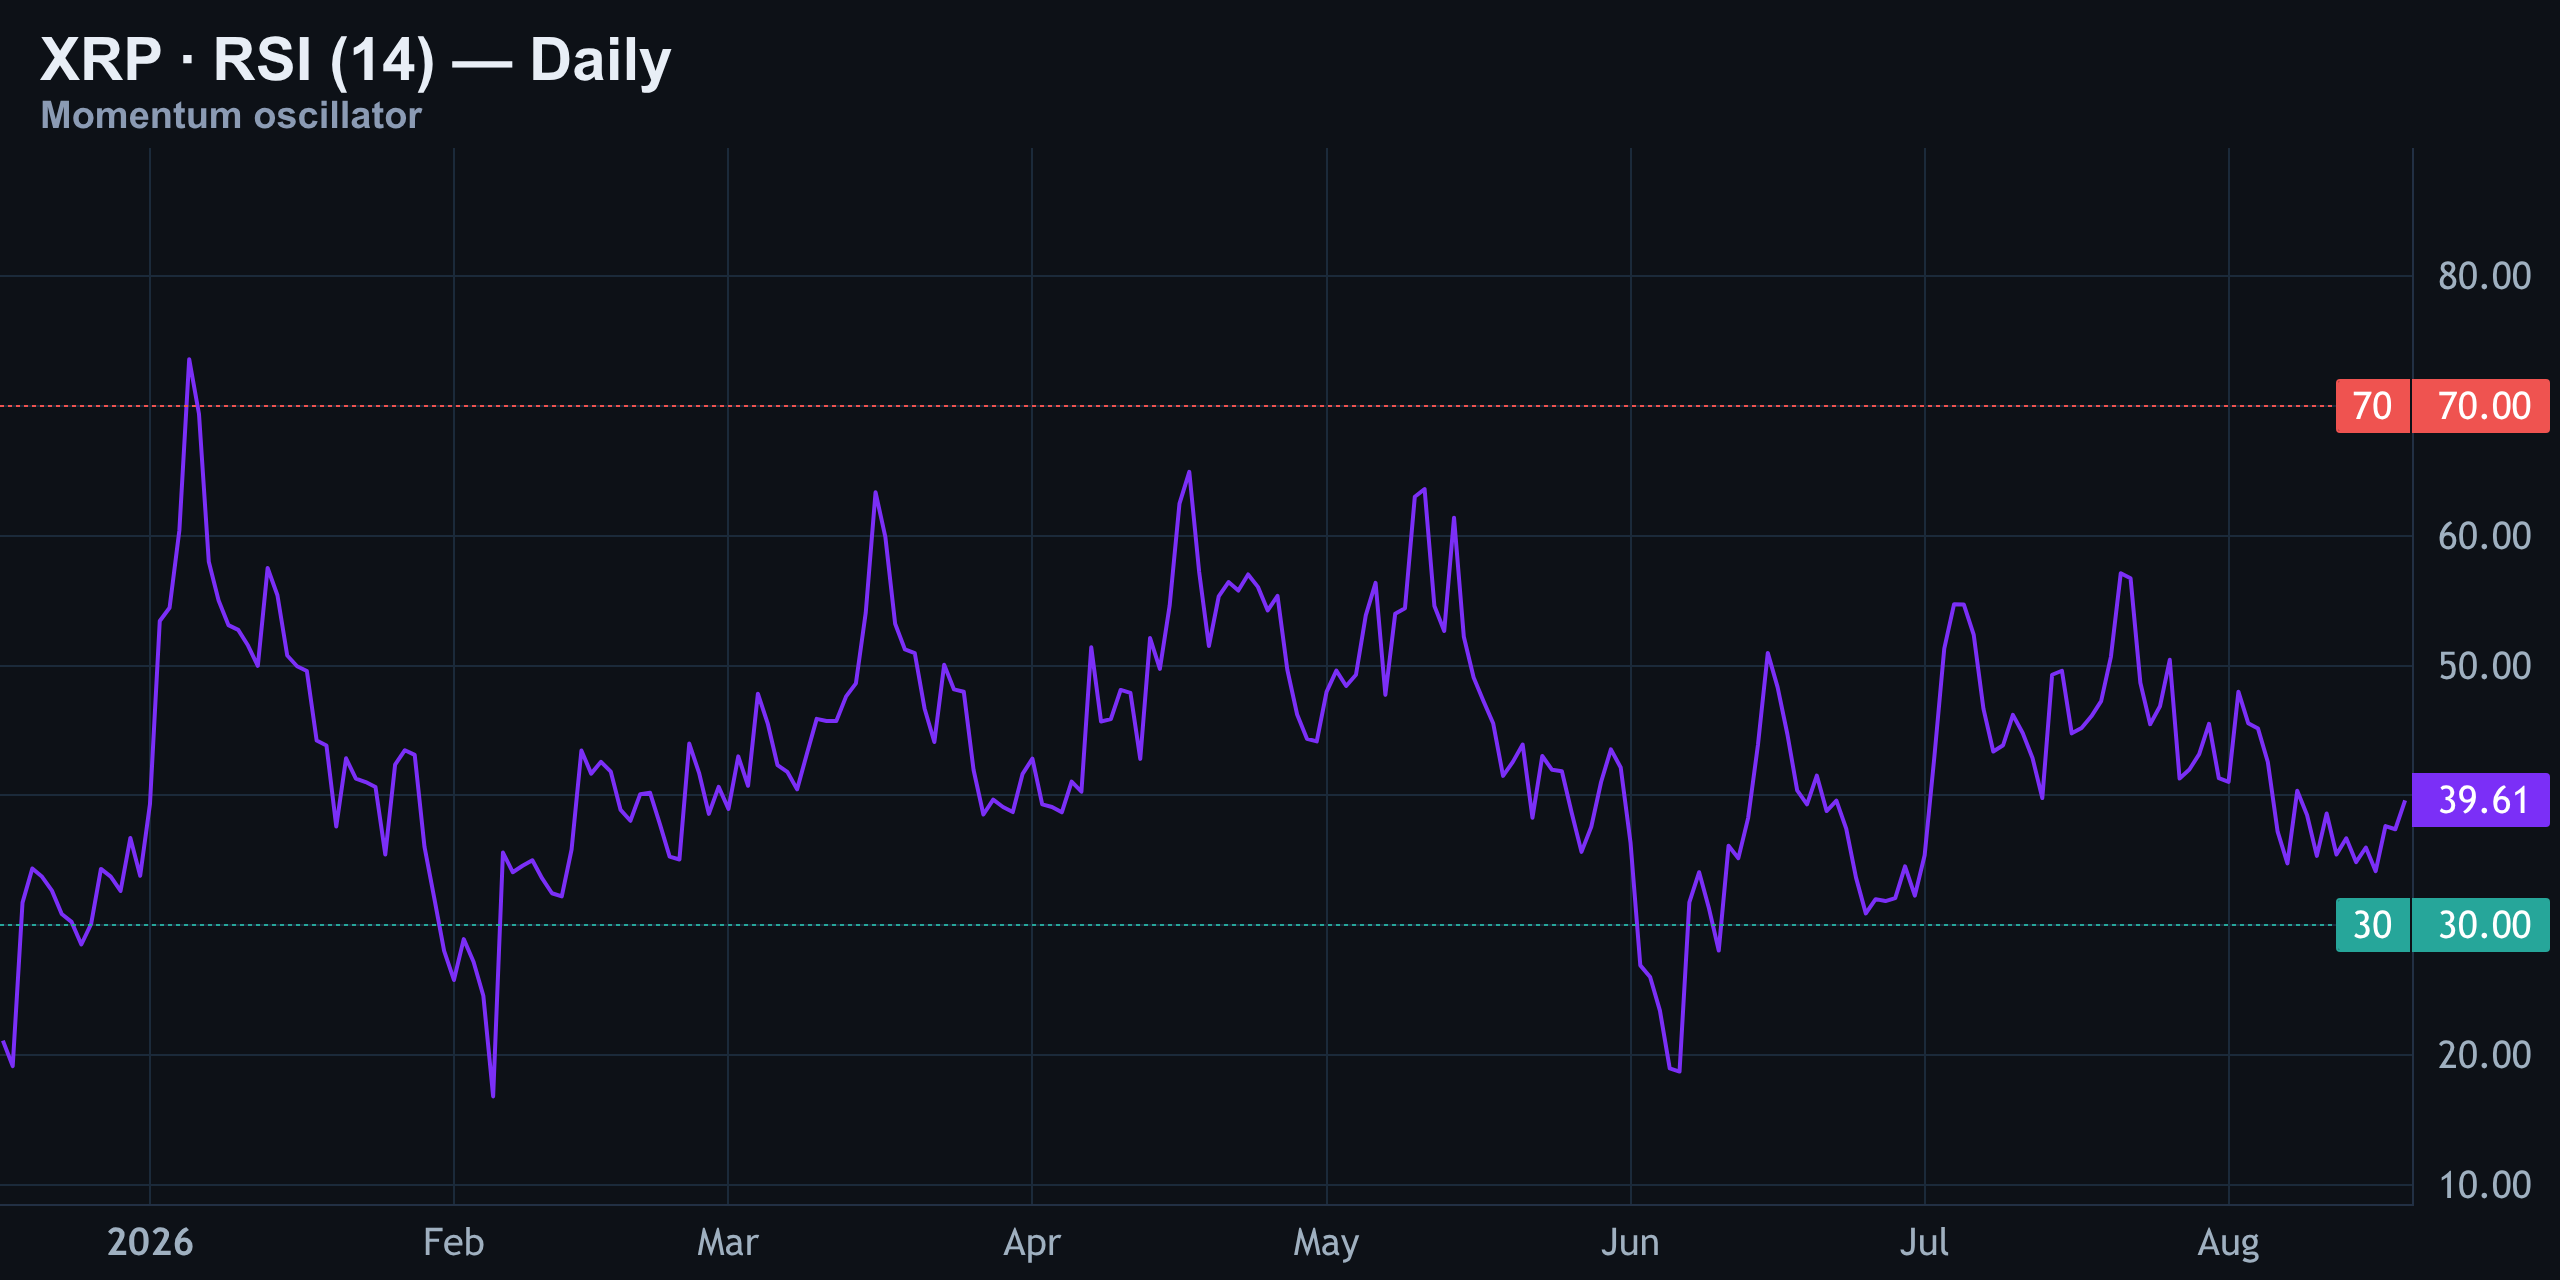
Since peaking near 65 back in June, RSI has been carving a pattern of lower highs, mirroring the price structure. There's no divergence here flashing a reversal signal. Momentum is simply tired, sitting in no-man's-land, waiting for a catalyst in either direction.
The MACD tells the same quiet story. The MACD line is still running below its signal line, and the histogram is negative — though just barely, essentially flatlining right near the zero mark.
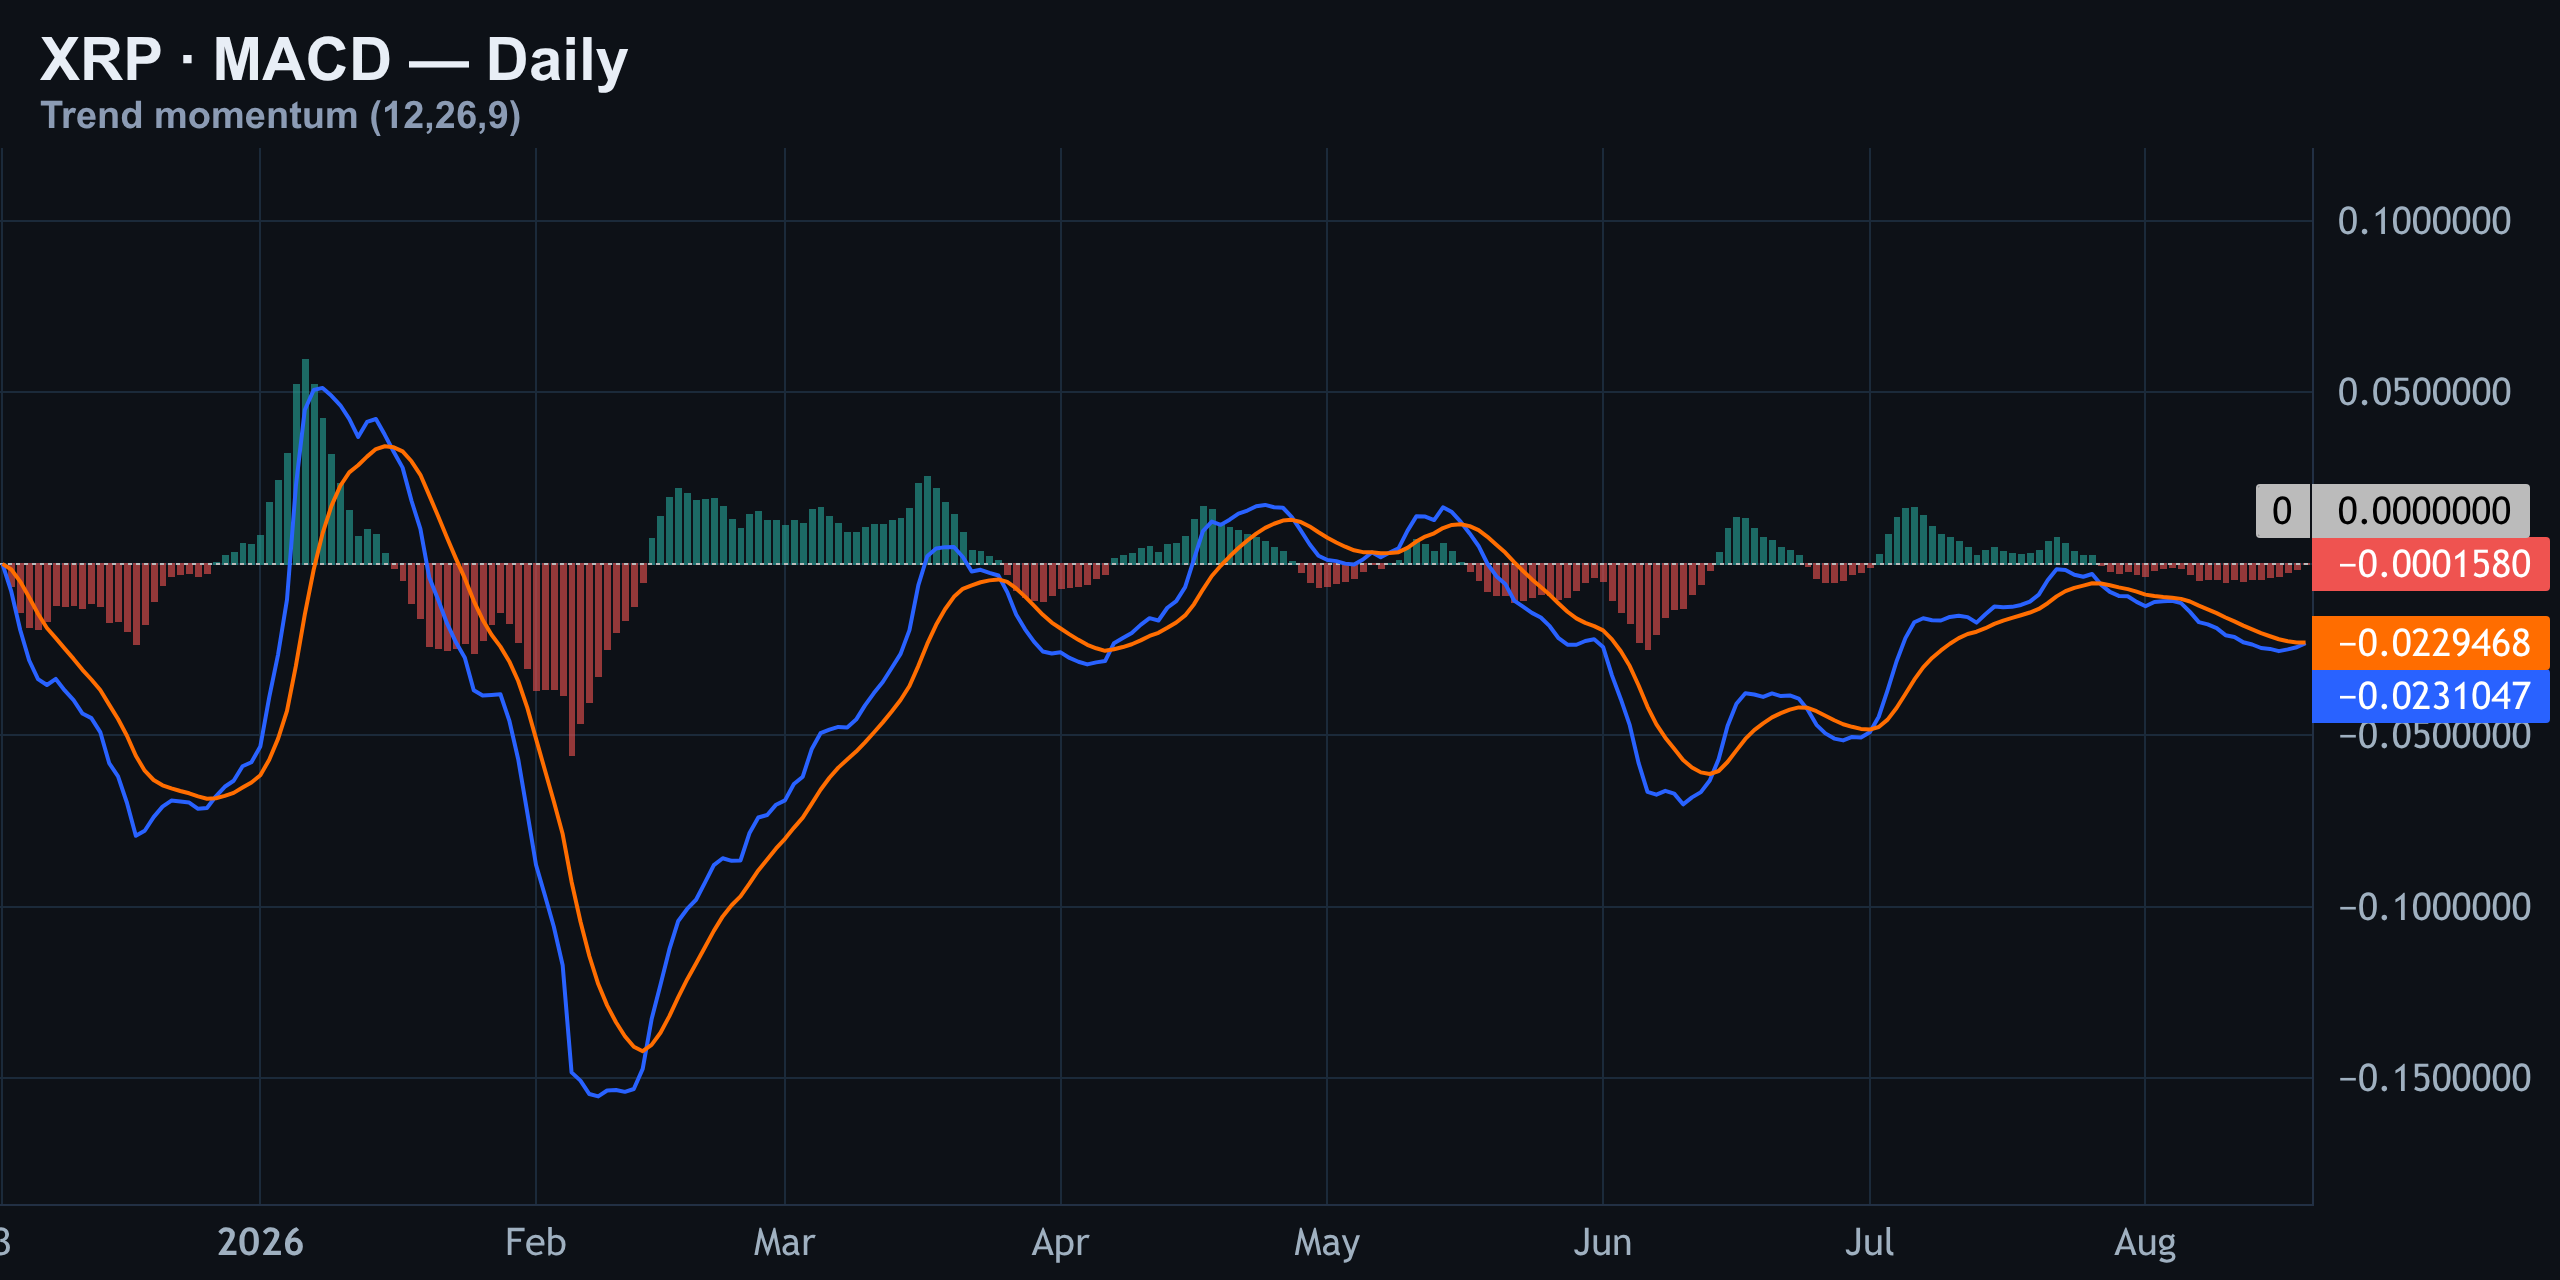
That's a market catching its breath, not one that's decisively turned. Until that histogram flips into green bars and the MACD line crosses back above signal, the technical bias on momentum stays with the bears, even if it's a soft grip.
Levels to Watch and Today's News Drivers
Mapping it out: XRP is sitting around one dollar right now. Overhead resistance on the four-hour lines up near $1.03 — that's the ceiling bulls need to crack. Below, daily support holds at $0.9862, a floor that's held for days.
| Level Type | Price | Significance |
|---|---|---|
| Overhead Resistance (4H) | $1.03 | Ceiling that must break and hold to flip bias bullish |
| Current Spot Price | $1.008 | Up ~1% over the last 24 hours |
| Daily Support Floor | $0.9862 | Untested breakdown despite a week of pressure |
| Old Structural High | $1.55 | No longer relevant to near-term decision zone |
What's Moving the Broader Narrative
On the news side, the SEC dropped a notable regulatory pivot — proposing new crypto asset rules and fundraising exemptions while Congress stalls on the CLARITY Act. That's possibly a signal regulators want to move faster than lawmakers, which markets have historically read as a mild net positive for the sector long-term.
Meanwhile, a US accounting body floating stablecoins as a 'cash equivalent' classification could quietly matter for institutional adoption down the line. Elsewhere, sentiment across the broader market remains mixed — some trackers are flagging renewed bullish chatter around other large-cap tokens pushing toward key psychological levels, a reminder that risk appetite in crypto right now is uneven across the board.
The Crowded-Trade Trap Nobody's Talking About
Here's the contradiction that should make you pause before piling onto either side of this trade: on-chain and derivatives data show three out of four open long positions on XRP stacked on one side of the book right now — and funding just went negative anyway.
That's unusual. Negative funding typically shows up when shorts dominate, not when longs are this heavily crowded. When positioning and funding disagree like this, it's often a signal that a squeeze — in either direction — is building pressure under the surface. It doesn't tell you which way the squeeze breaks, but it does tell you that whichever side is wrong is going to get flushed hard, and probably fast.
- Crowded longs + negative funding = a setup ripe for a violent shakeout
- This kind of imbalance rarely resolves calmly — expect a sharp wick, not a slow grind
- It reinforces why the invalidation level on any trade here needs to be respected, not nudged
The Computed Setup: Entry, Stop, Target
Putting it all together, here's the computed setup based on where the chart currently sits. This is a short-bias trade, built around the four-hour ceiling holding.
| Parameter | Level | Note |
|---|---|---|
| Entry Trigger | $1.014 | A move up into this zone triggers the short |
| Stop Loss | $1.03 | A 4-hour close above this invalidates the thesis |
| Target | $0.9745 | Roughly aligned with the daily support floor |
| Risk-to-Reward | 1 : 2.5 | Standard structure for this kind of squeeze setup |
The stop isn't arbitrary — it sits right where a genuine four-hour close would prove the descending channel has broken, flipping the entire bias from bearish to neutral-or-better. Until that happens, the lean stays with the sellers, even if it's a soft grip rather than a firm one.
Previous days
08/18/2026 — XRP Daily Pulse Aug 18: Dollar Ceiling Holds Firm
XRP Daily Pulse Aug 18: Dollar Ceiling Holds Firm
Where We Left It: Yesterday's Call Is Still Live
Since yesterday's update, XRP has basically gone nowhere fast — down about 0.2%, slipping from roughly $0.9998 to around $0.9979. That sounds boring, and in a way it is. But underneath the flat line, the market structure is doing something worth paying attention to.
The prior short call — entry at $1.003, stop at $1.01, target at $0.9855 — is still live. It hasn't been stopped out, and it hasn't hit target either. It's just sitting there, patiently working, while price continues to chop under the same overhead resistance that's capped every rally since late July.
Until that pattern breaks, this stays a sell-the-bounce market, not a buy-the-dip one. Here's the full picture, timeframe by timeframe.
15-Minute Intraday: Chop Inside a Falling Channel
Zooming into today's 15-minute chart, XRP tried to push higher early in the session, got turned away almost immediately, and spent most of the day grinding lower inside a tight falling channel. Price dipped toward the low-$0.90s zone before dip-buyers stepped back in and dragged it back up to about $0.998.
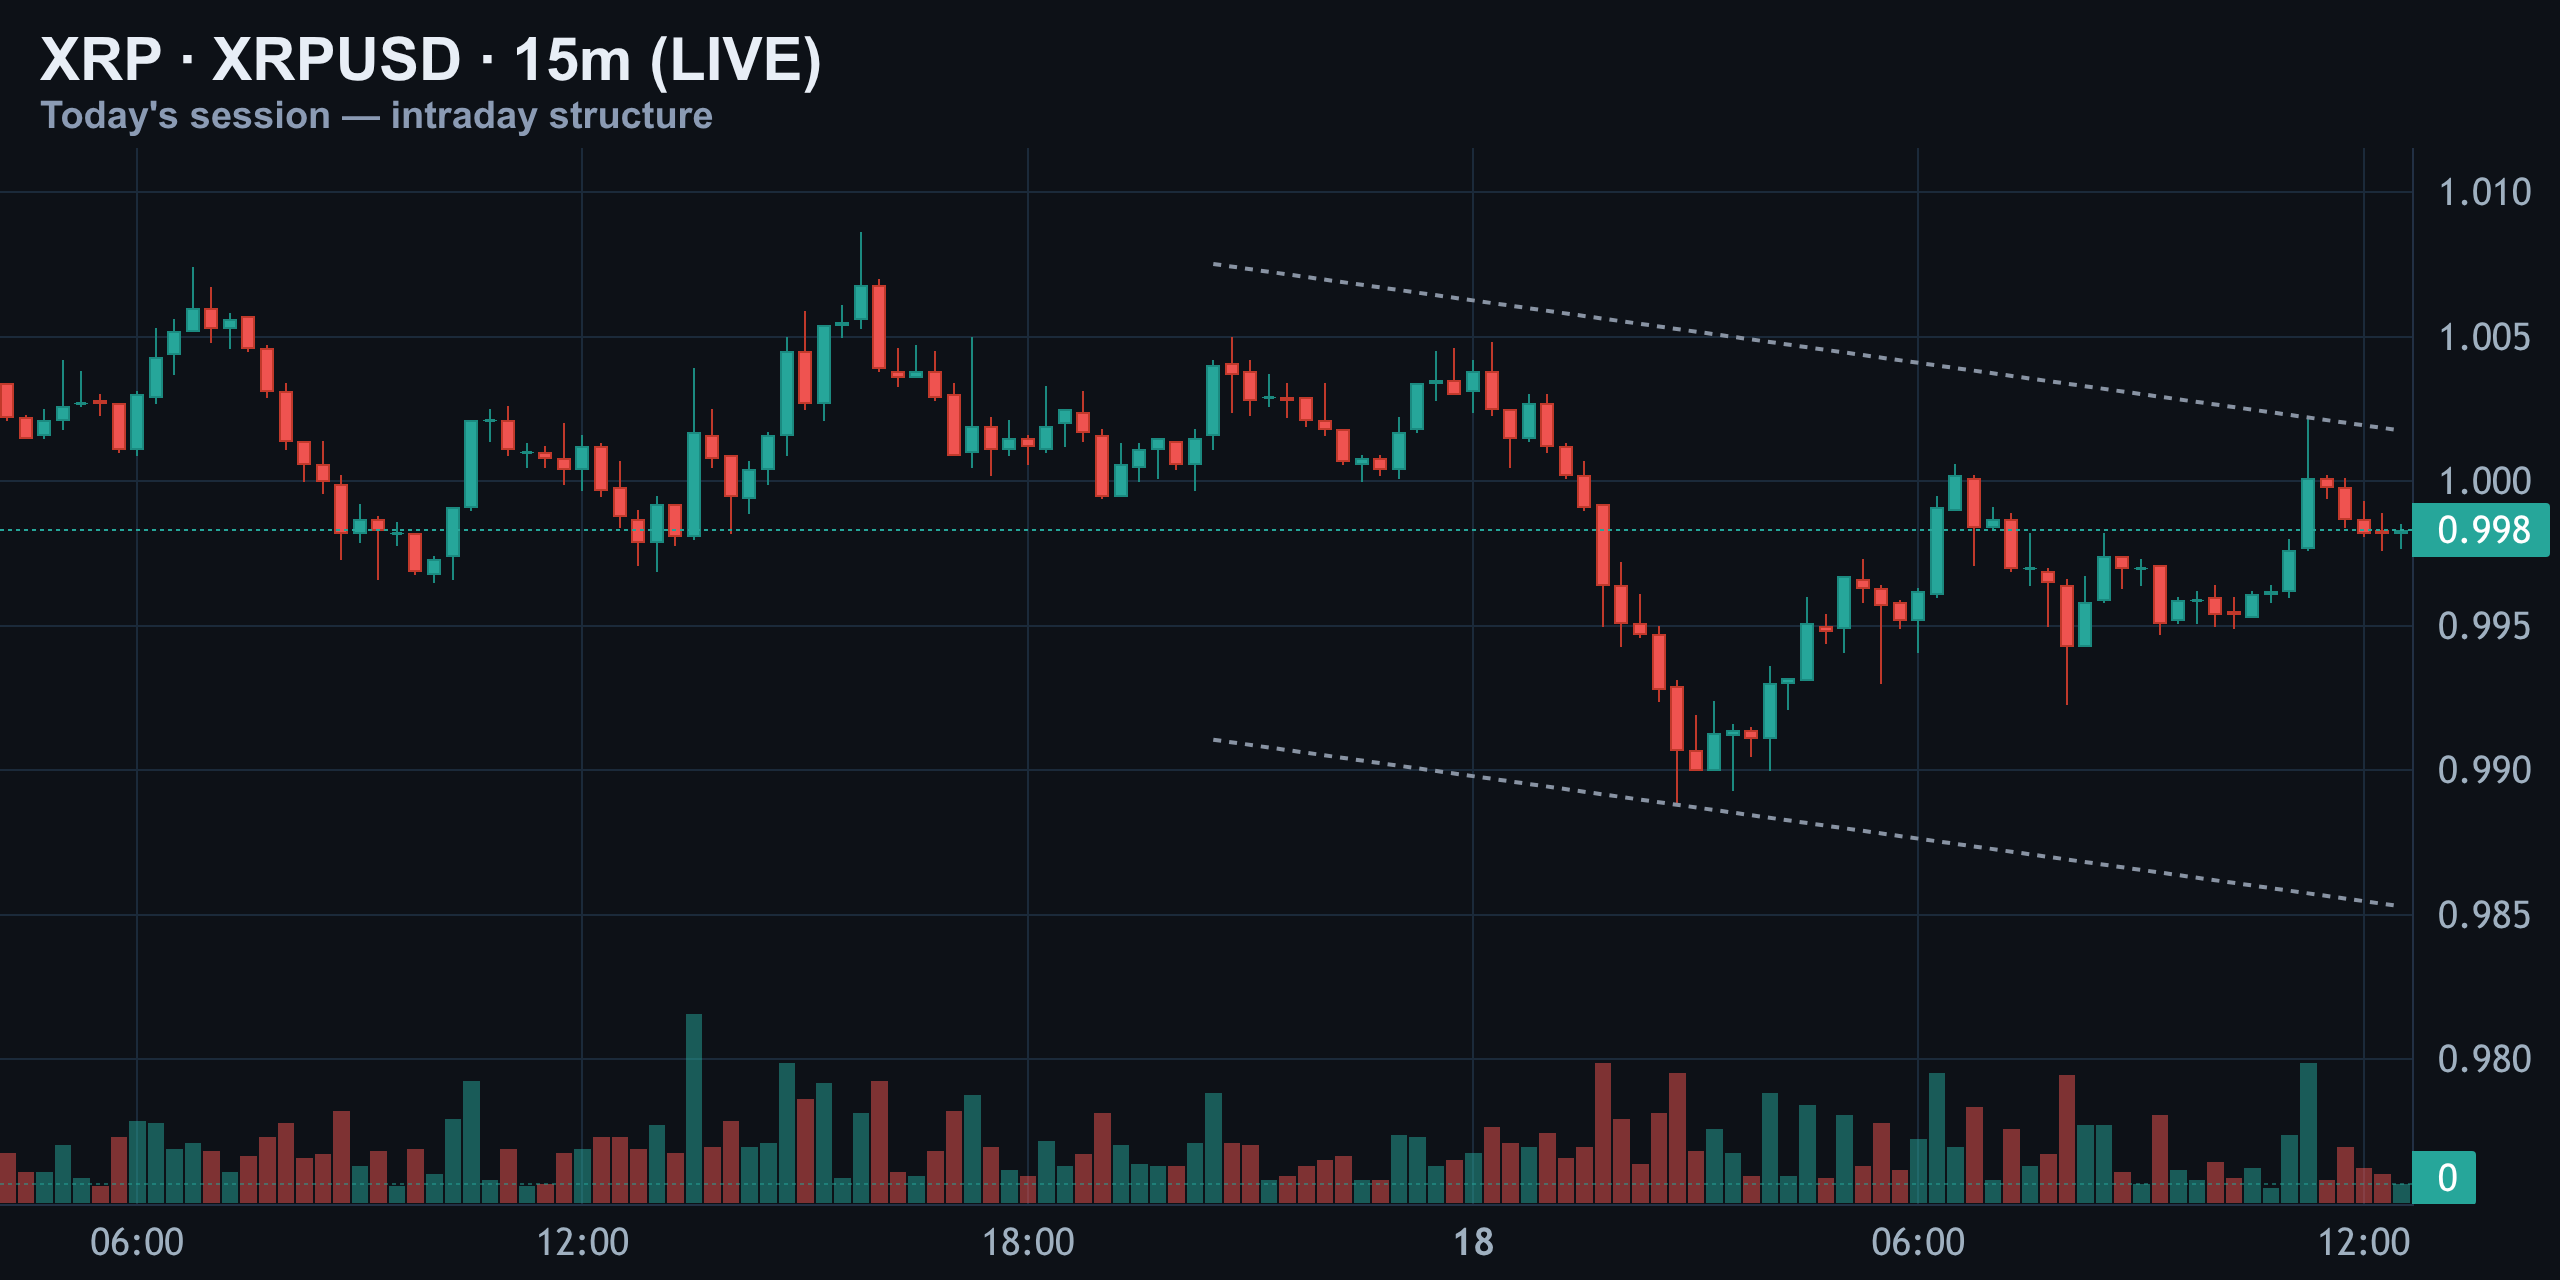
The structure is choppy, but the lower highs inside that channel tell you sellers are still setting the intraday pace. In plain terms: XRP bounced around all day but stayed stuck below $1. No breakout, no breakdown — just controlled chop with a slight downward lean.
4-Hour Structure: Lower Highs Since Late July
Step back to the 4-hour chart and the picture sharpens. XRP has been carving lower highs since that swing peak near $1.10 back on July 30th. Every rally since then has run into the same descending trendline and gotten sold straight back down.
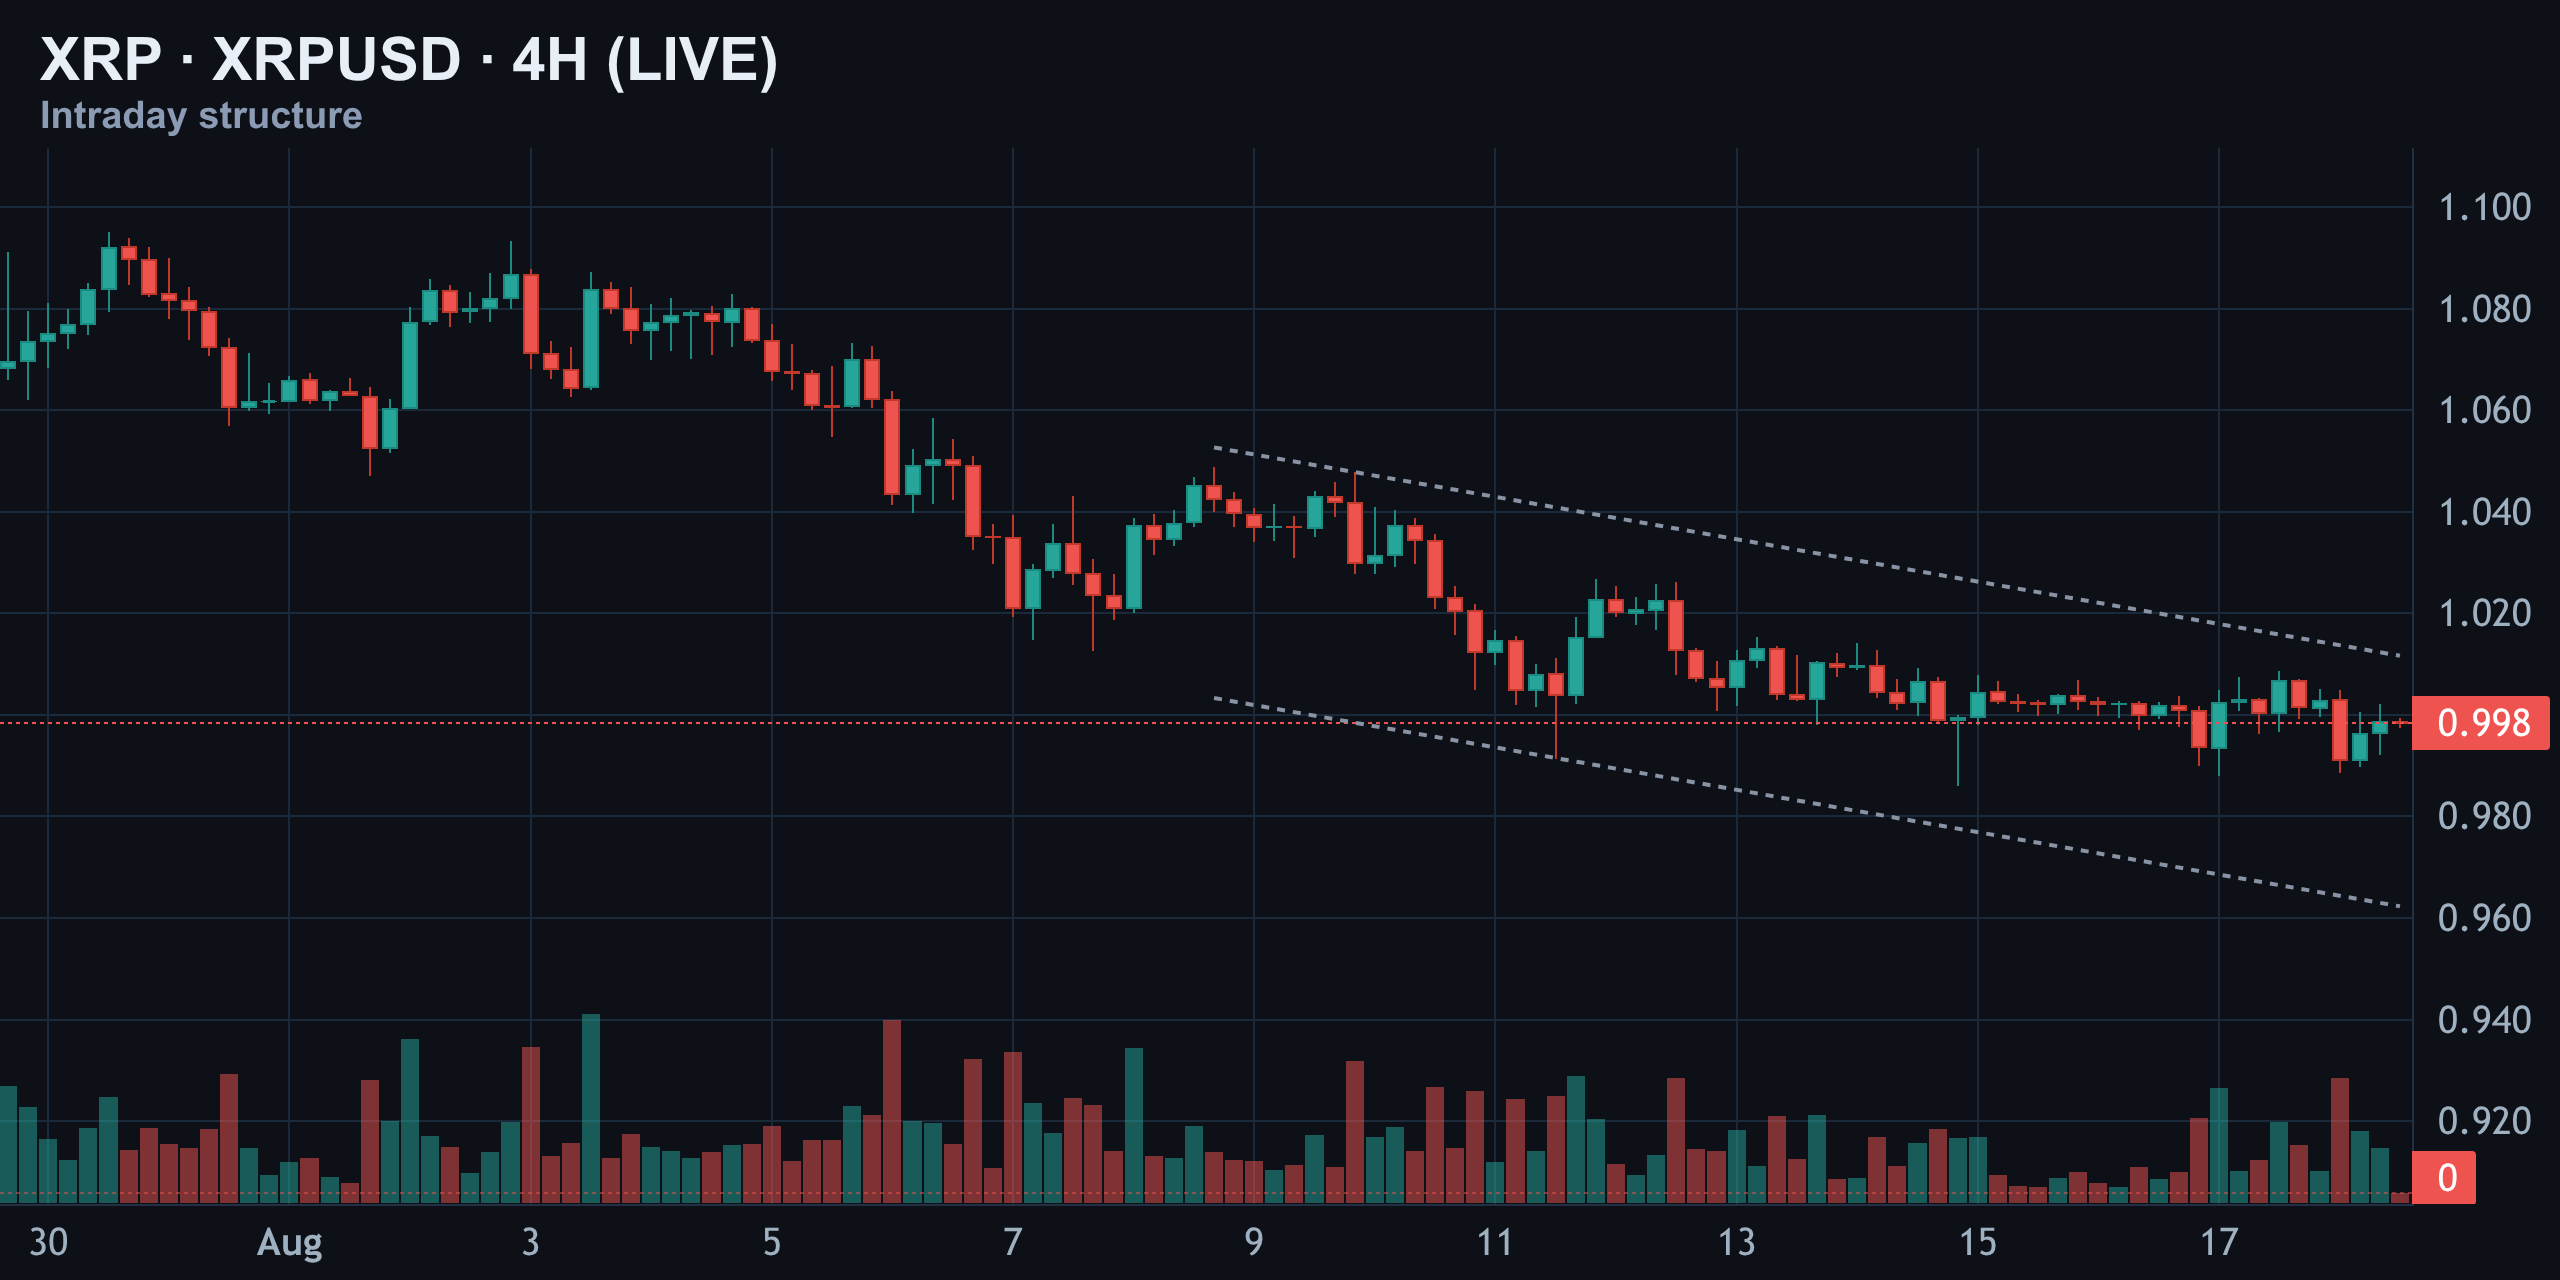
Right now, price is sitting almost exactly on that trendline again — which makes this a genuine decision point. Either buyers finally reclaim it and force a shift in structure, or sellers keep the pattern intact and push XRP into another leg down. In plain terms: the bigger 4-hour trend is still pointing down, and today's price action hasn't done anything to change that yet.
Daily Chart: Pressing the $0.9862 Floor
On the daily timeframe, the trend since May has been one long staircase down. Right now XRP is leaning directly on a support shelf near $0.9862, a level that has already held more than once this week.
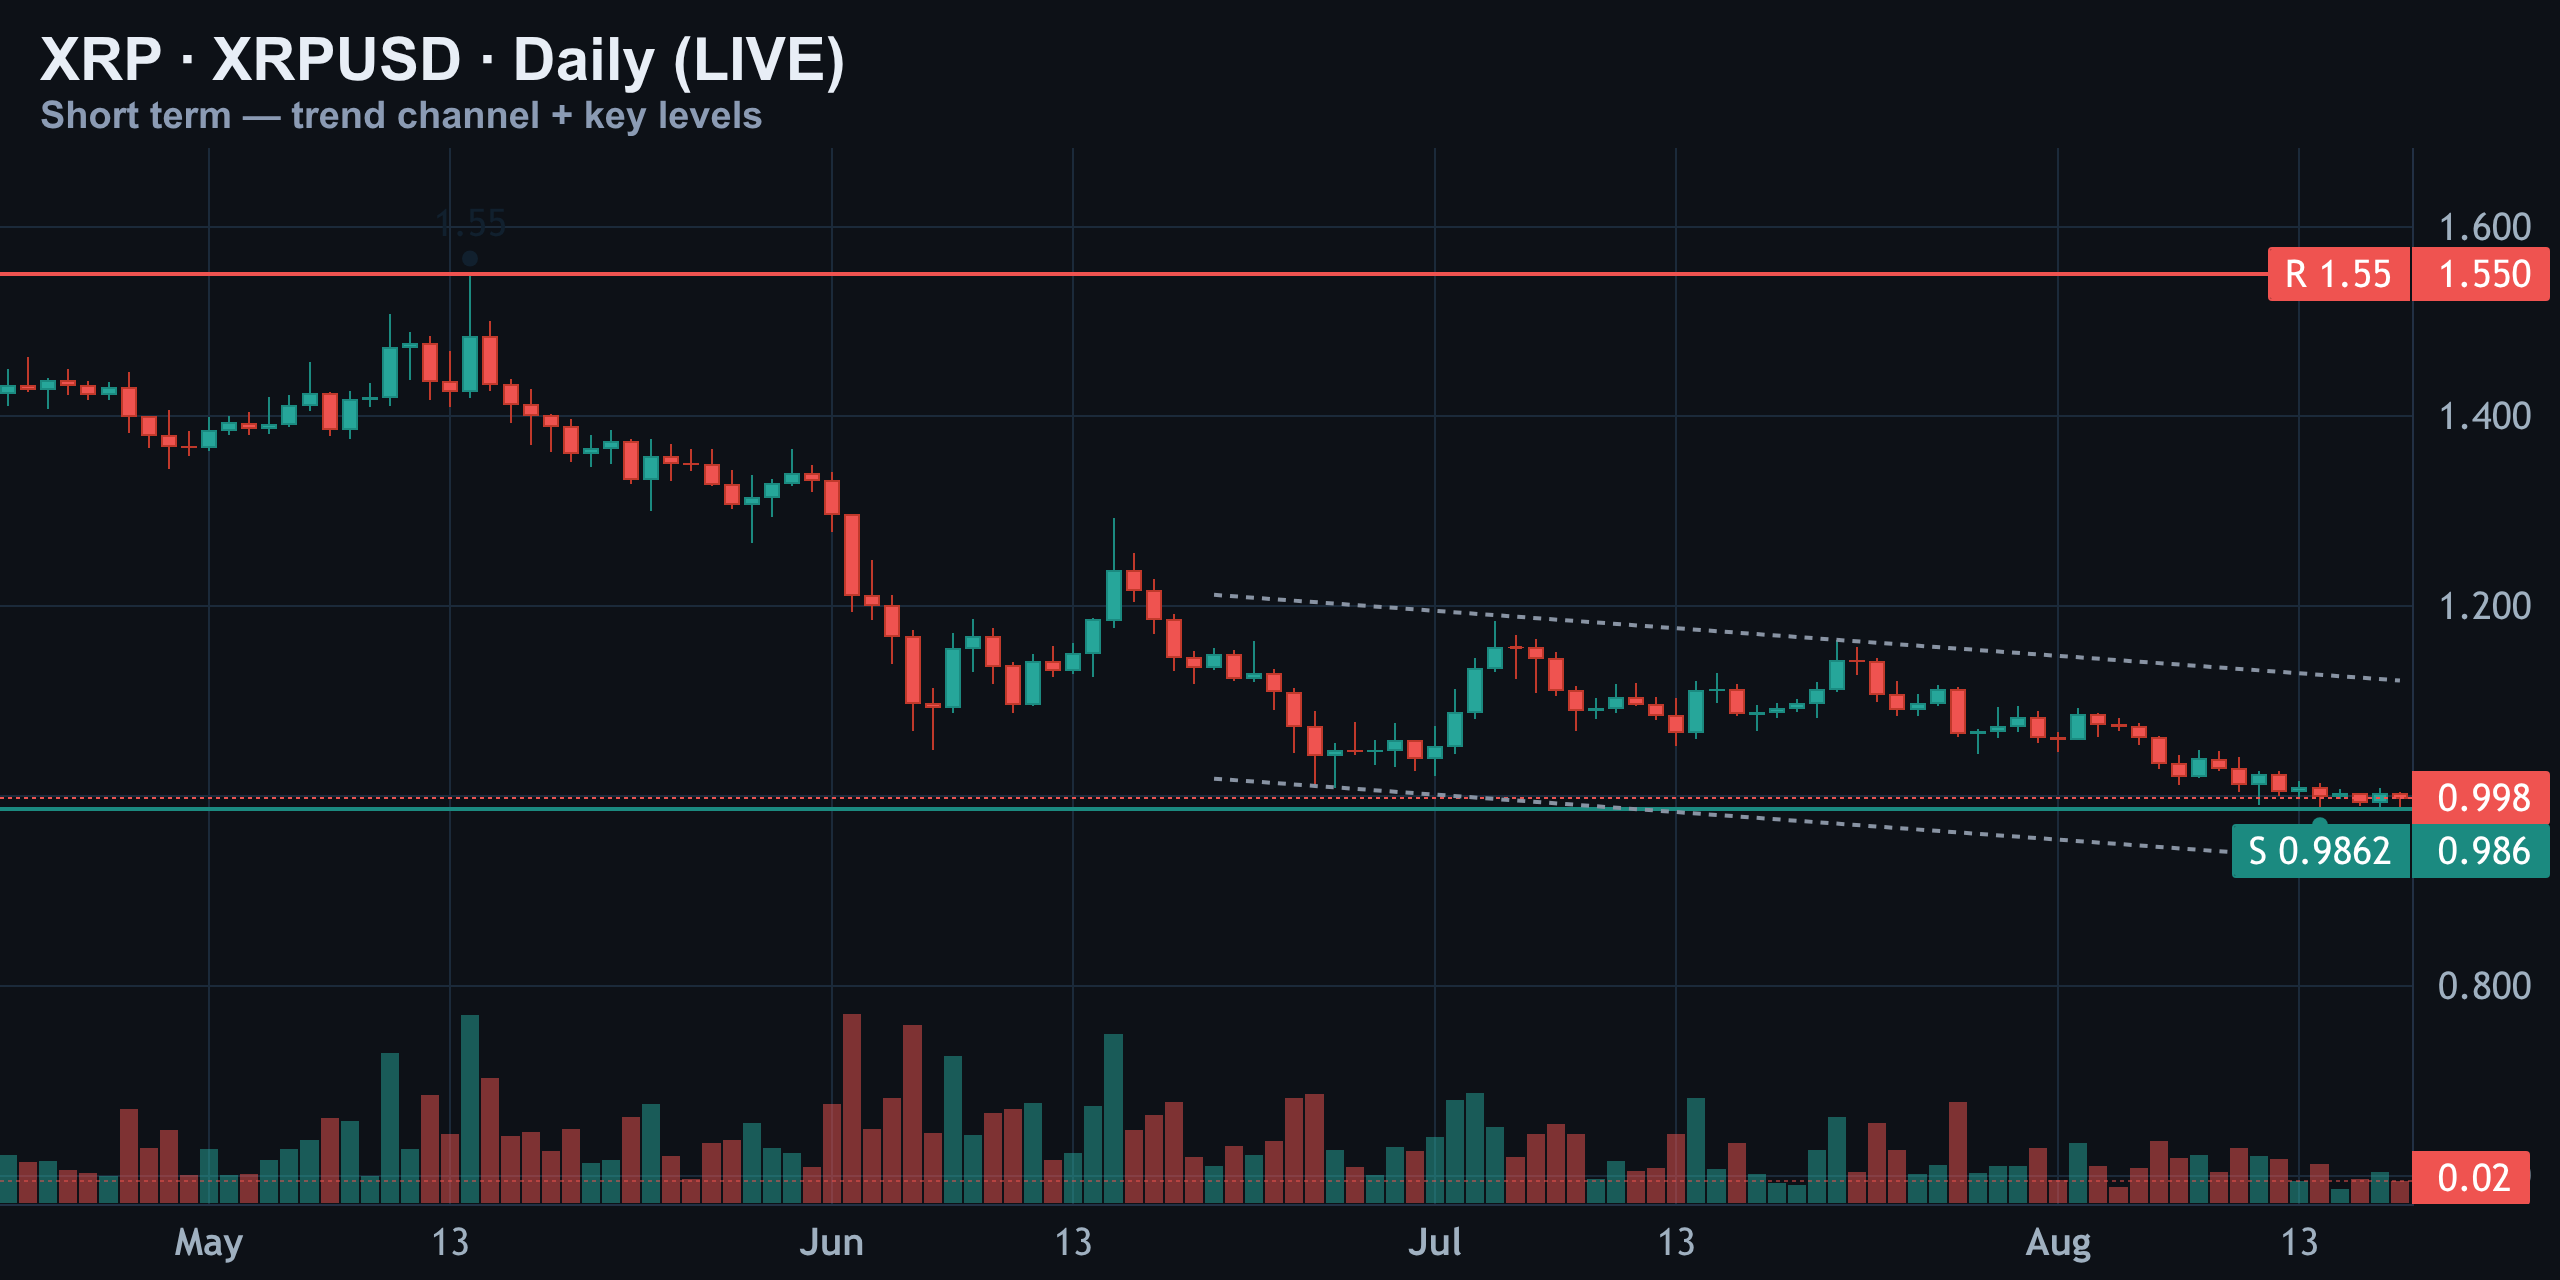
The old resistance zone near $1.55 is essentially irrelevant at this point — that's a relic from a completely different market regime. What actually matters right now is this tightening channel between the $0.9862 floor and the $1.04 ceiling, and whether the floor holds one more time before something breaks.
| Level | Price | Type |
|---|---|---|
| Ask wall (resistance) | $1.04 | Heavy sell orders |
| Psychological level | $1.00 | Round-number resistance |
| Daily floor | $0.9862 | Held multiple times this week |
| Bid wall (support) | $0.95 | Large buy orders |
| Legacy high | $1.55 | Irrelevant — different regime |
Momentum Check: RSI Is Soft, MACD Still Bearish
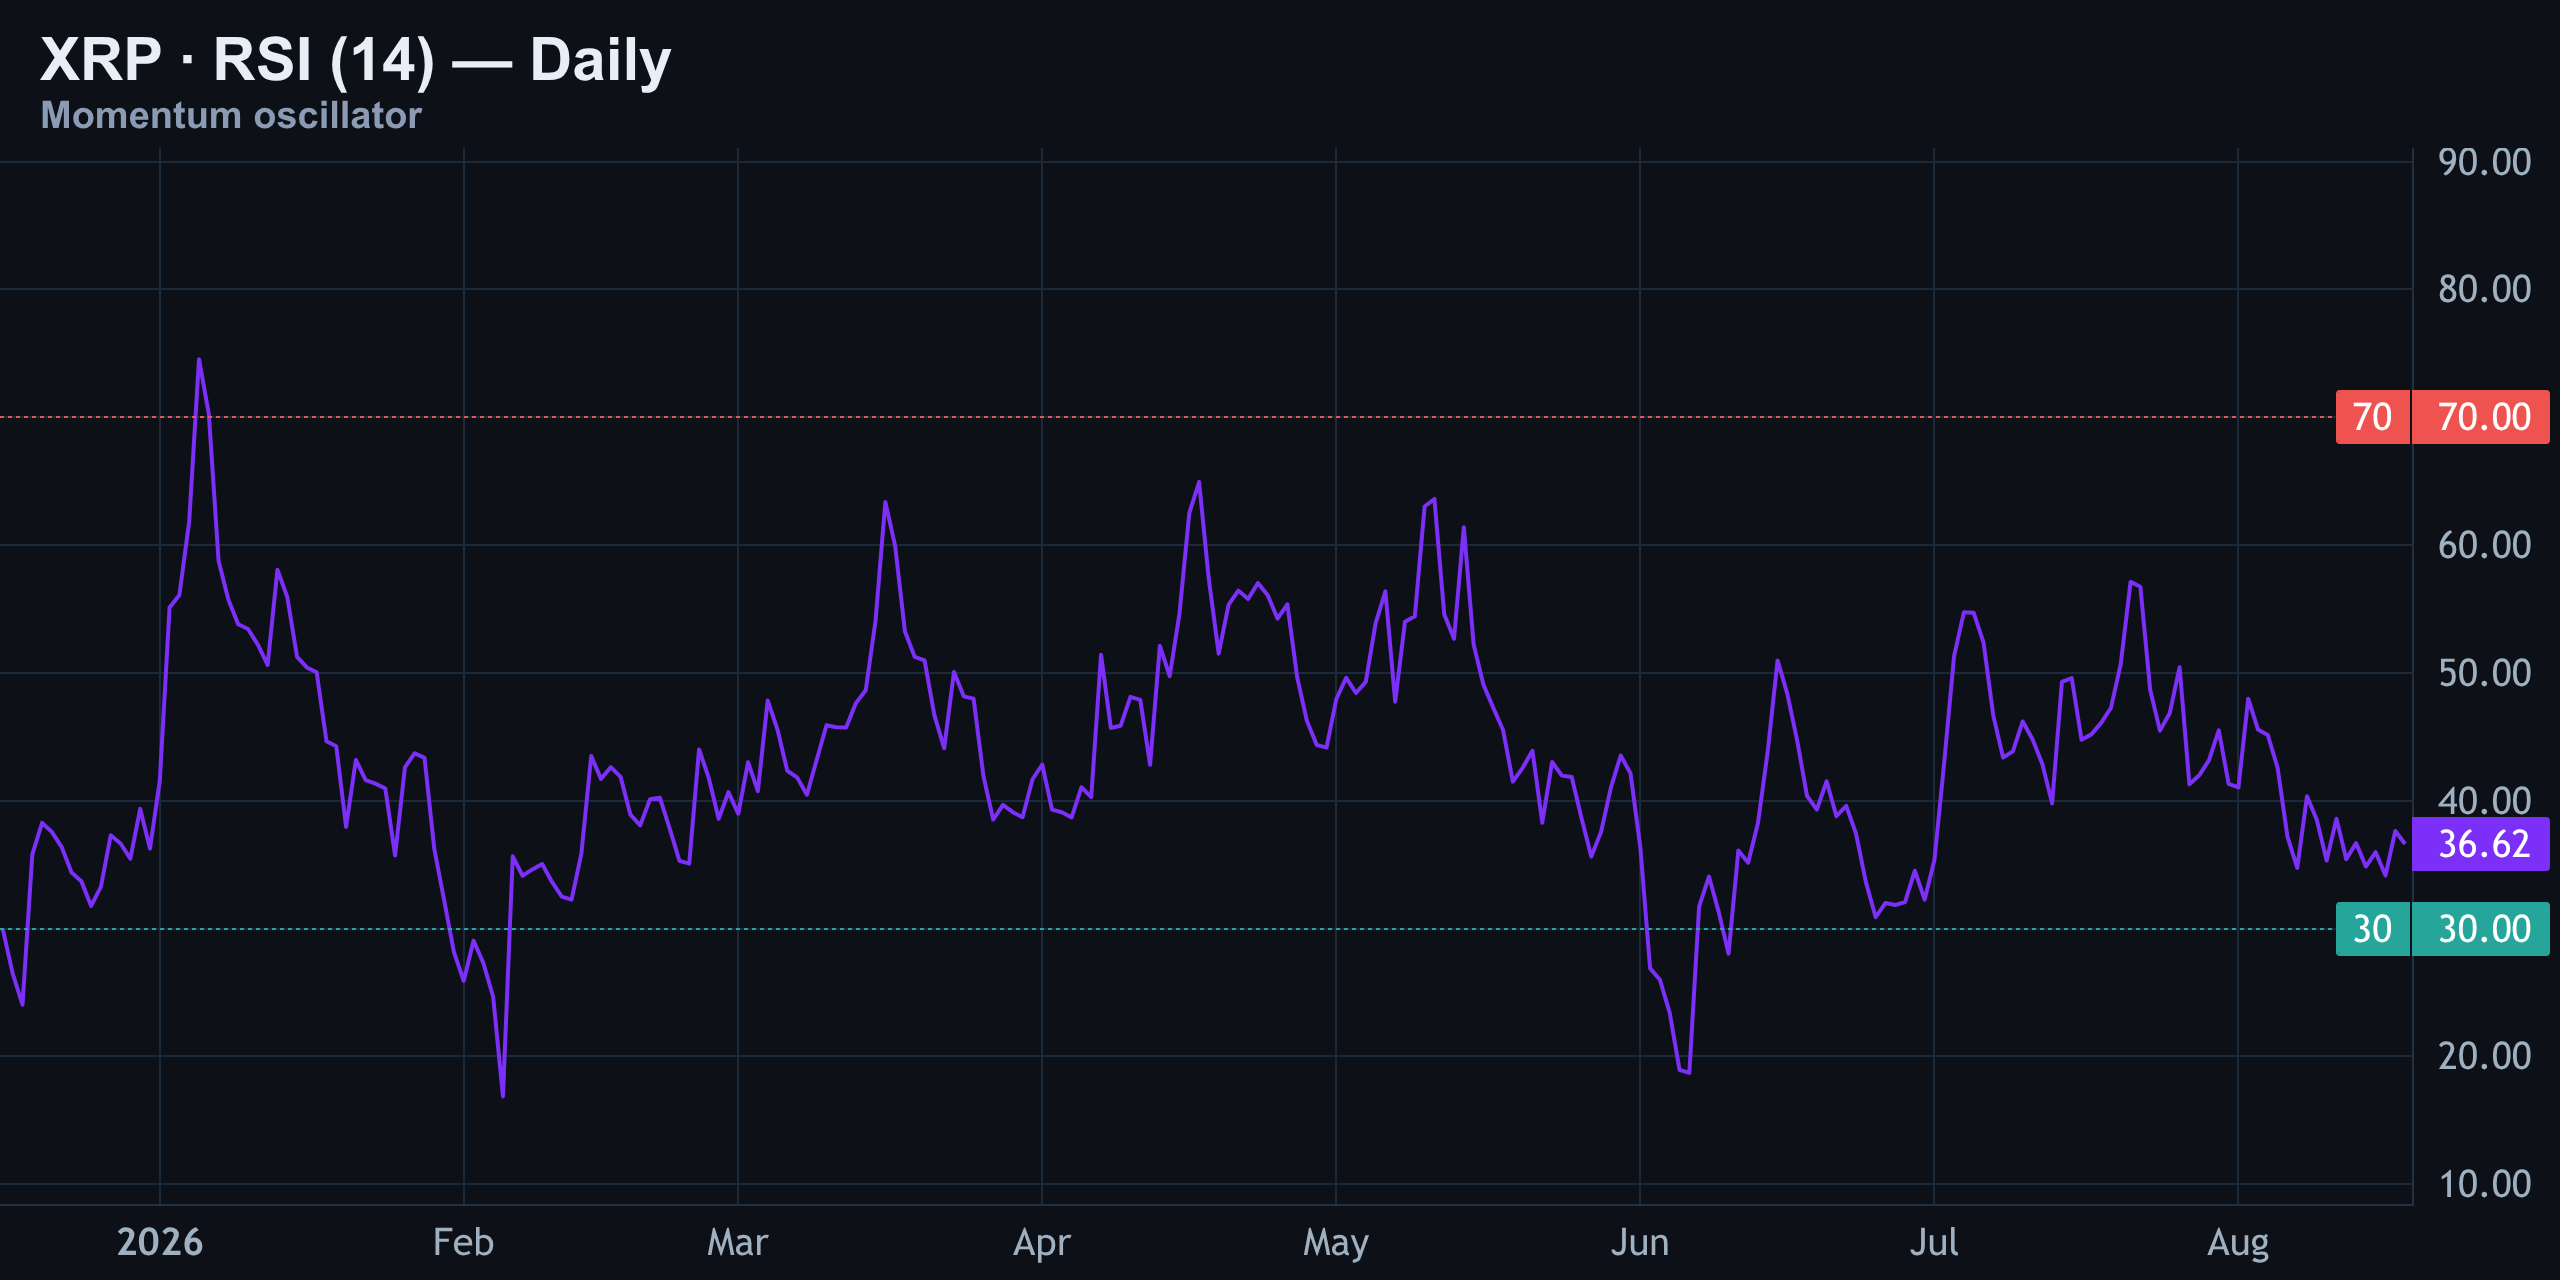
RSI (14) — Neutral, No Extreme Either Way
The daily RSI is sitting around 37. That's soft, below the 50 midline, but it's not down in oversold territory below 30. This isn't a market that's been beaten down to an extreme — it's just quietly losing momentum. There's no divergence flashing here either, meaning RSI is agreeing with price rather than fighting it.
MACD — Bearish Cross Still in Control
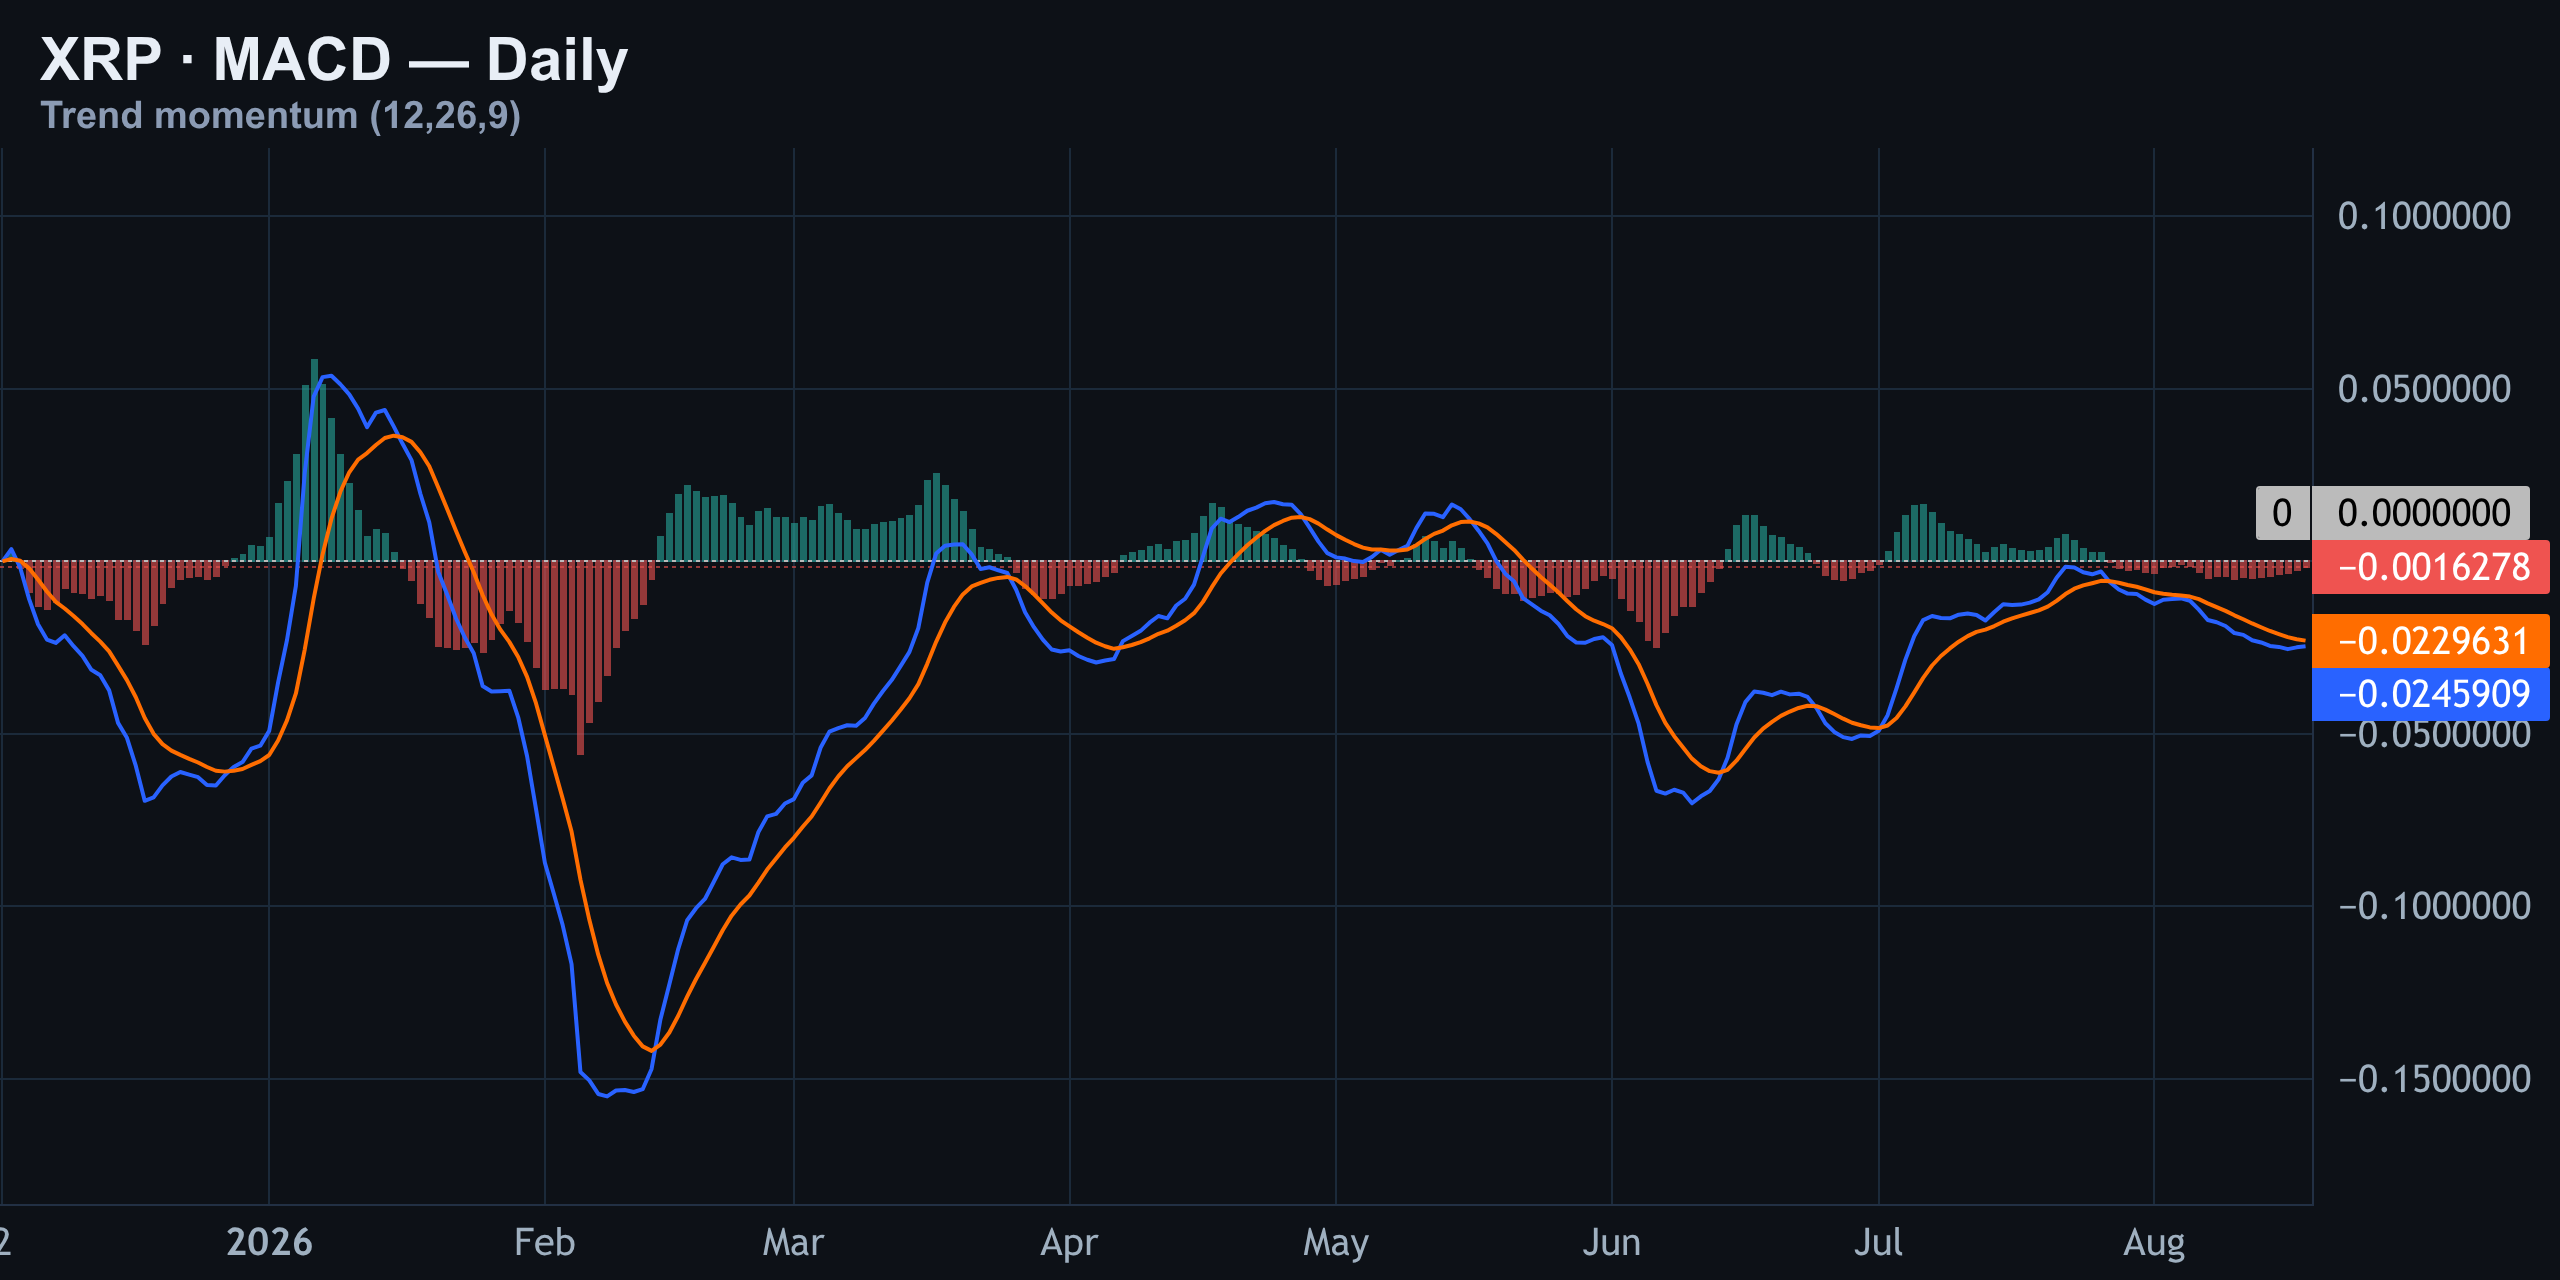
The MACD tells the same story from a different angle. Both the MACD line and the signal line sit below the zero line, and the MACD is still under its signal — a bearish setup. The histogram bars are negative, meaning the gap between the two lines is still working in sellers' favor. Nothing here has flipped since the last real bullish push faded out in early July.
Positioning & Order Flow: Retail Is Long, Smart Money Is Cautious
Funding is basically flat at 0.006%, so there's no crowded directional bet showing up in the funding rate itself. But open interest has climbed 13% over the past week, meaning fresh leverage is stacking up into this exact range — right where price keeps stalling.
| Metric | Reading | Read |
|---|---|---|
| Funding rate | 0.006% | Flat, no crowded bet |
| Open interest (7d) | +13% | Fresh leverage building |
| Retail positioning | ~3:1 long | Crowded, leaning bullish |
| Top-trader positioning | ~2:1 long | More cautious than retail |
| Taker buy/sell ratio | 1.24 : 1 | Buyers slightly ahead |
| Order book bids | 58% | Bid-heavy near spot |
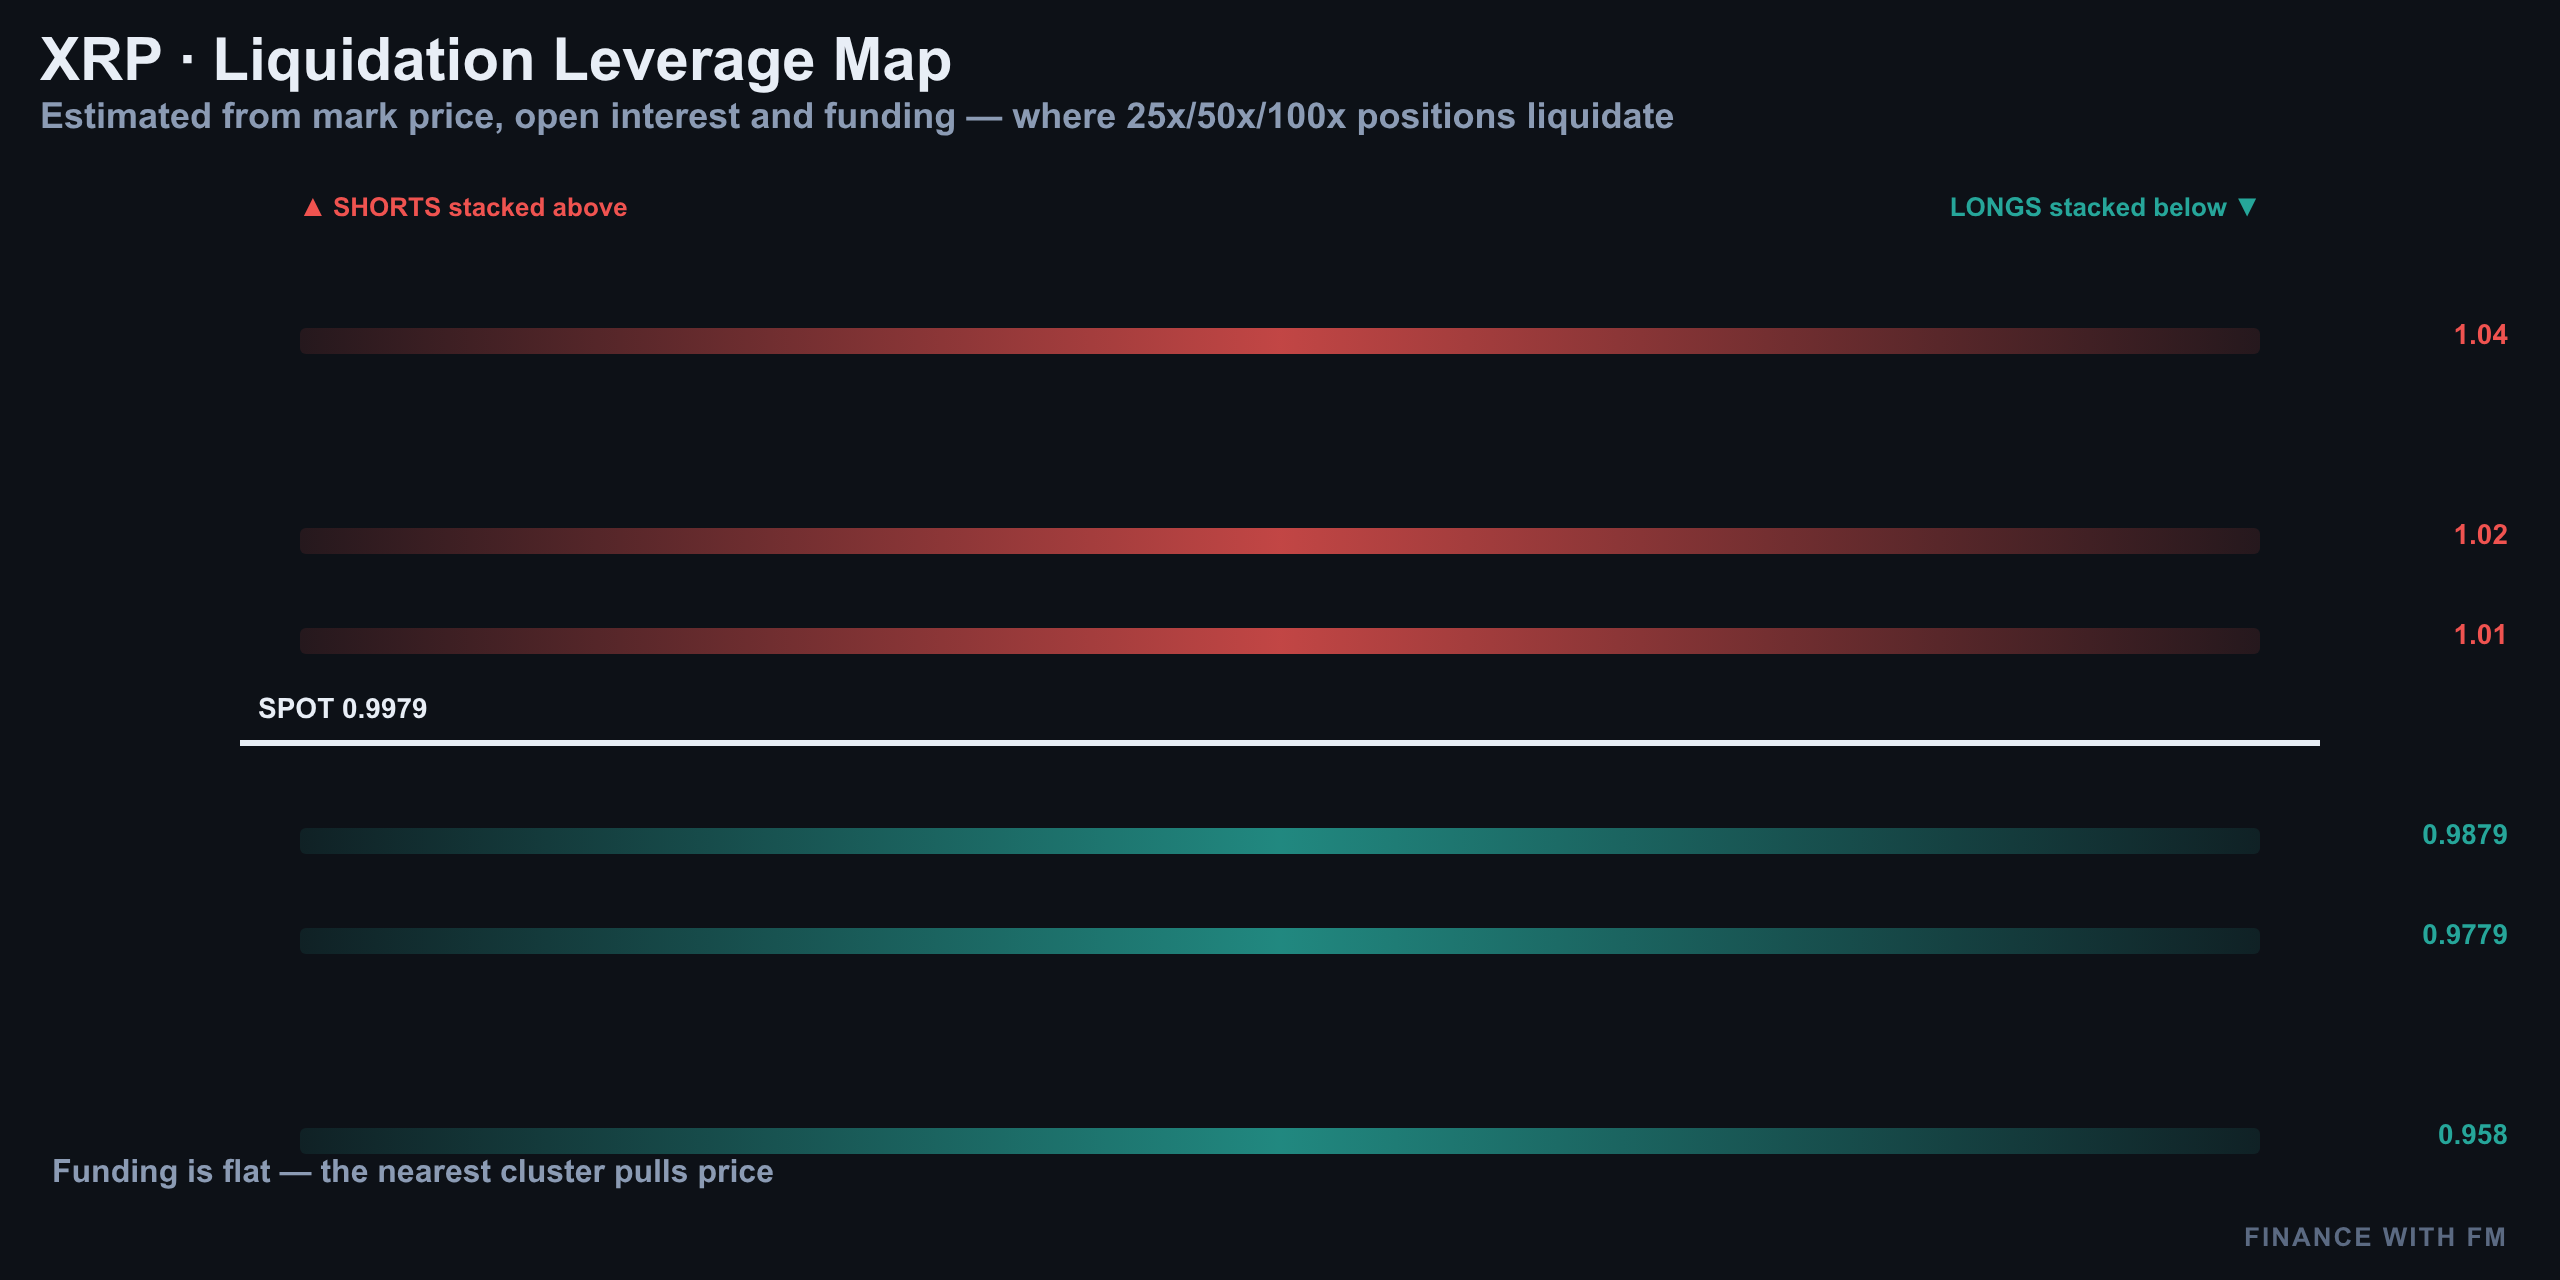
Translation: retail is leaning long into resistance while smart money hedges — a classic setup for a squeeze against the crowd if that ask wall near $1.04 doesn't give way. The liquidation heatmap above shows exactly why that wall matters — a cluster of leveraged longs sits stacked just under $1.04, meaning a rejection there could cascade quickly if stops start triggering.
Today's Drivers: Sentiment, Stablecoins, and a Billion-Dollar Bitcoin Bet
Away from the charts, sentiment trackers show XRP mood at its most bearish in three months — even though on-chain activity is actually holding up. That gap between bearish sentiment and steady usage is often a contrarian tell worth watching.
Longer-horizon models are still treating the $1.00–$1.06 range as a floor for any eventual recovery, and one popular price-prediction model from Binance keeps XRP pinned right around $1 heading into mid-September.
- A Treasury proposal addressing who can legally sell stablecoins is circulating in crypto policy circles
- Reports of a near billion-dollar Bitcoin position tied to Jane Street are making headlines
- Neither story is a direct XRP catalyst today — they're background macro hum that keeps overall risk appetite in focus
None of this changes the technical picture. It's context, not a catalyst — the real story today is still the chart.
The Setup: Trade Plan and What Flips the Bias
The desk read here is a short, playing the range rather than chasing a breakout. Risk-reward on this setup is roughly 1:2.5 — not investment advice, just how the levels line up on the chart.
| Parameter | Level |
|---|---|
| Trigger | $1.007 (rejection back into resistance) |
| Stop loss | $1.018 |
| Target 1 | $0.9862 (daily floor) |
| Target 2 (stretch) | $0.95 (bid wall) |
| Bias flips bullish above | $1.04 (ask wall, sustained close) |
The one level that kills this thesis is a clean, sustained close above $1.04. That's where the heavy ask wall sits, and that's where the lower-highs pattern on the 4-hour would finally break. Until then, every bounce toward $1 is a fade, not a breakout — and the floor at $0.9862 is the line in the sand for how much longer buyers can keep absorbing the pressure.
Summary: The Range Holds, For Now
XRP keeps punching at $1 and keeps getting sent back. Funding is flat, but leverage is quietly building underneath the surface. Retail traders are piling into longs at roughly a 3:1 ratio while the smarter, top-trader cohort stays far more cautious near 2:1. There's a wall of orders sitting just above spot at $1.04 that's doing a lot of the heavy lifting in this range — and yesterday's short call is still open, still working, still untouched.
Until XRP either reclaims $1.04 with conviction or loses the $0.9862 floor for good, this is a range to trade, not a trend to chase. We'll be back tomorrow with the next update.
08/17/2026 — XRP Price Today: The Dollar Wall Holds Again (Aug 17)
XRP Price Today: The Dollar Wall Holds Again (Aug 17)
Yesterday's Call: Still Live, Still Working
Before we get into today's setup, a quick scorecard. On August 16, we flagged the dollar wall and called a short from $1.0050, stop at $1.0116, target at $0.9775. Twenty-four hours later, price hasn't gone anywhere — from $1.00 down to $0.9998. That's essentially flat.
That flatness is the whole story of today's XRP price action. Underneath a boring candle, pressure is building. Let's walk through it layer by layer — intraday, structure, momentum, positioning — and land on what actually matters: the trade.
XRP Price Today: The Snapshot
XRP is sitting at $0.9999, basically flat on the day, boxed inside a range of $0.9882 to $1.01. On the surface, nothing's happening. Underneath, three things are diverging from that calm: open interest is surging, taker flow is aggressively selling, and momentum on both RSI and MACD is soft.
| Metric | Reading |
|---|---|
| Spot price | $0.9999 |
| 24h range | $0.9882 – $1.01 |
| 24h change | ~Flat |
| Bias | Bearish, leaning into resistance |
This isn't a base for a breakout — it reads more like consolidation before a decision. Nothing screams panic, but the weight of evidence leans toward the sellers into the $1.04 ask wall overhead.
15-Minute Intraday: Chop Inside the Chop
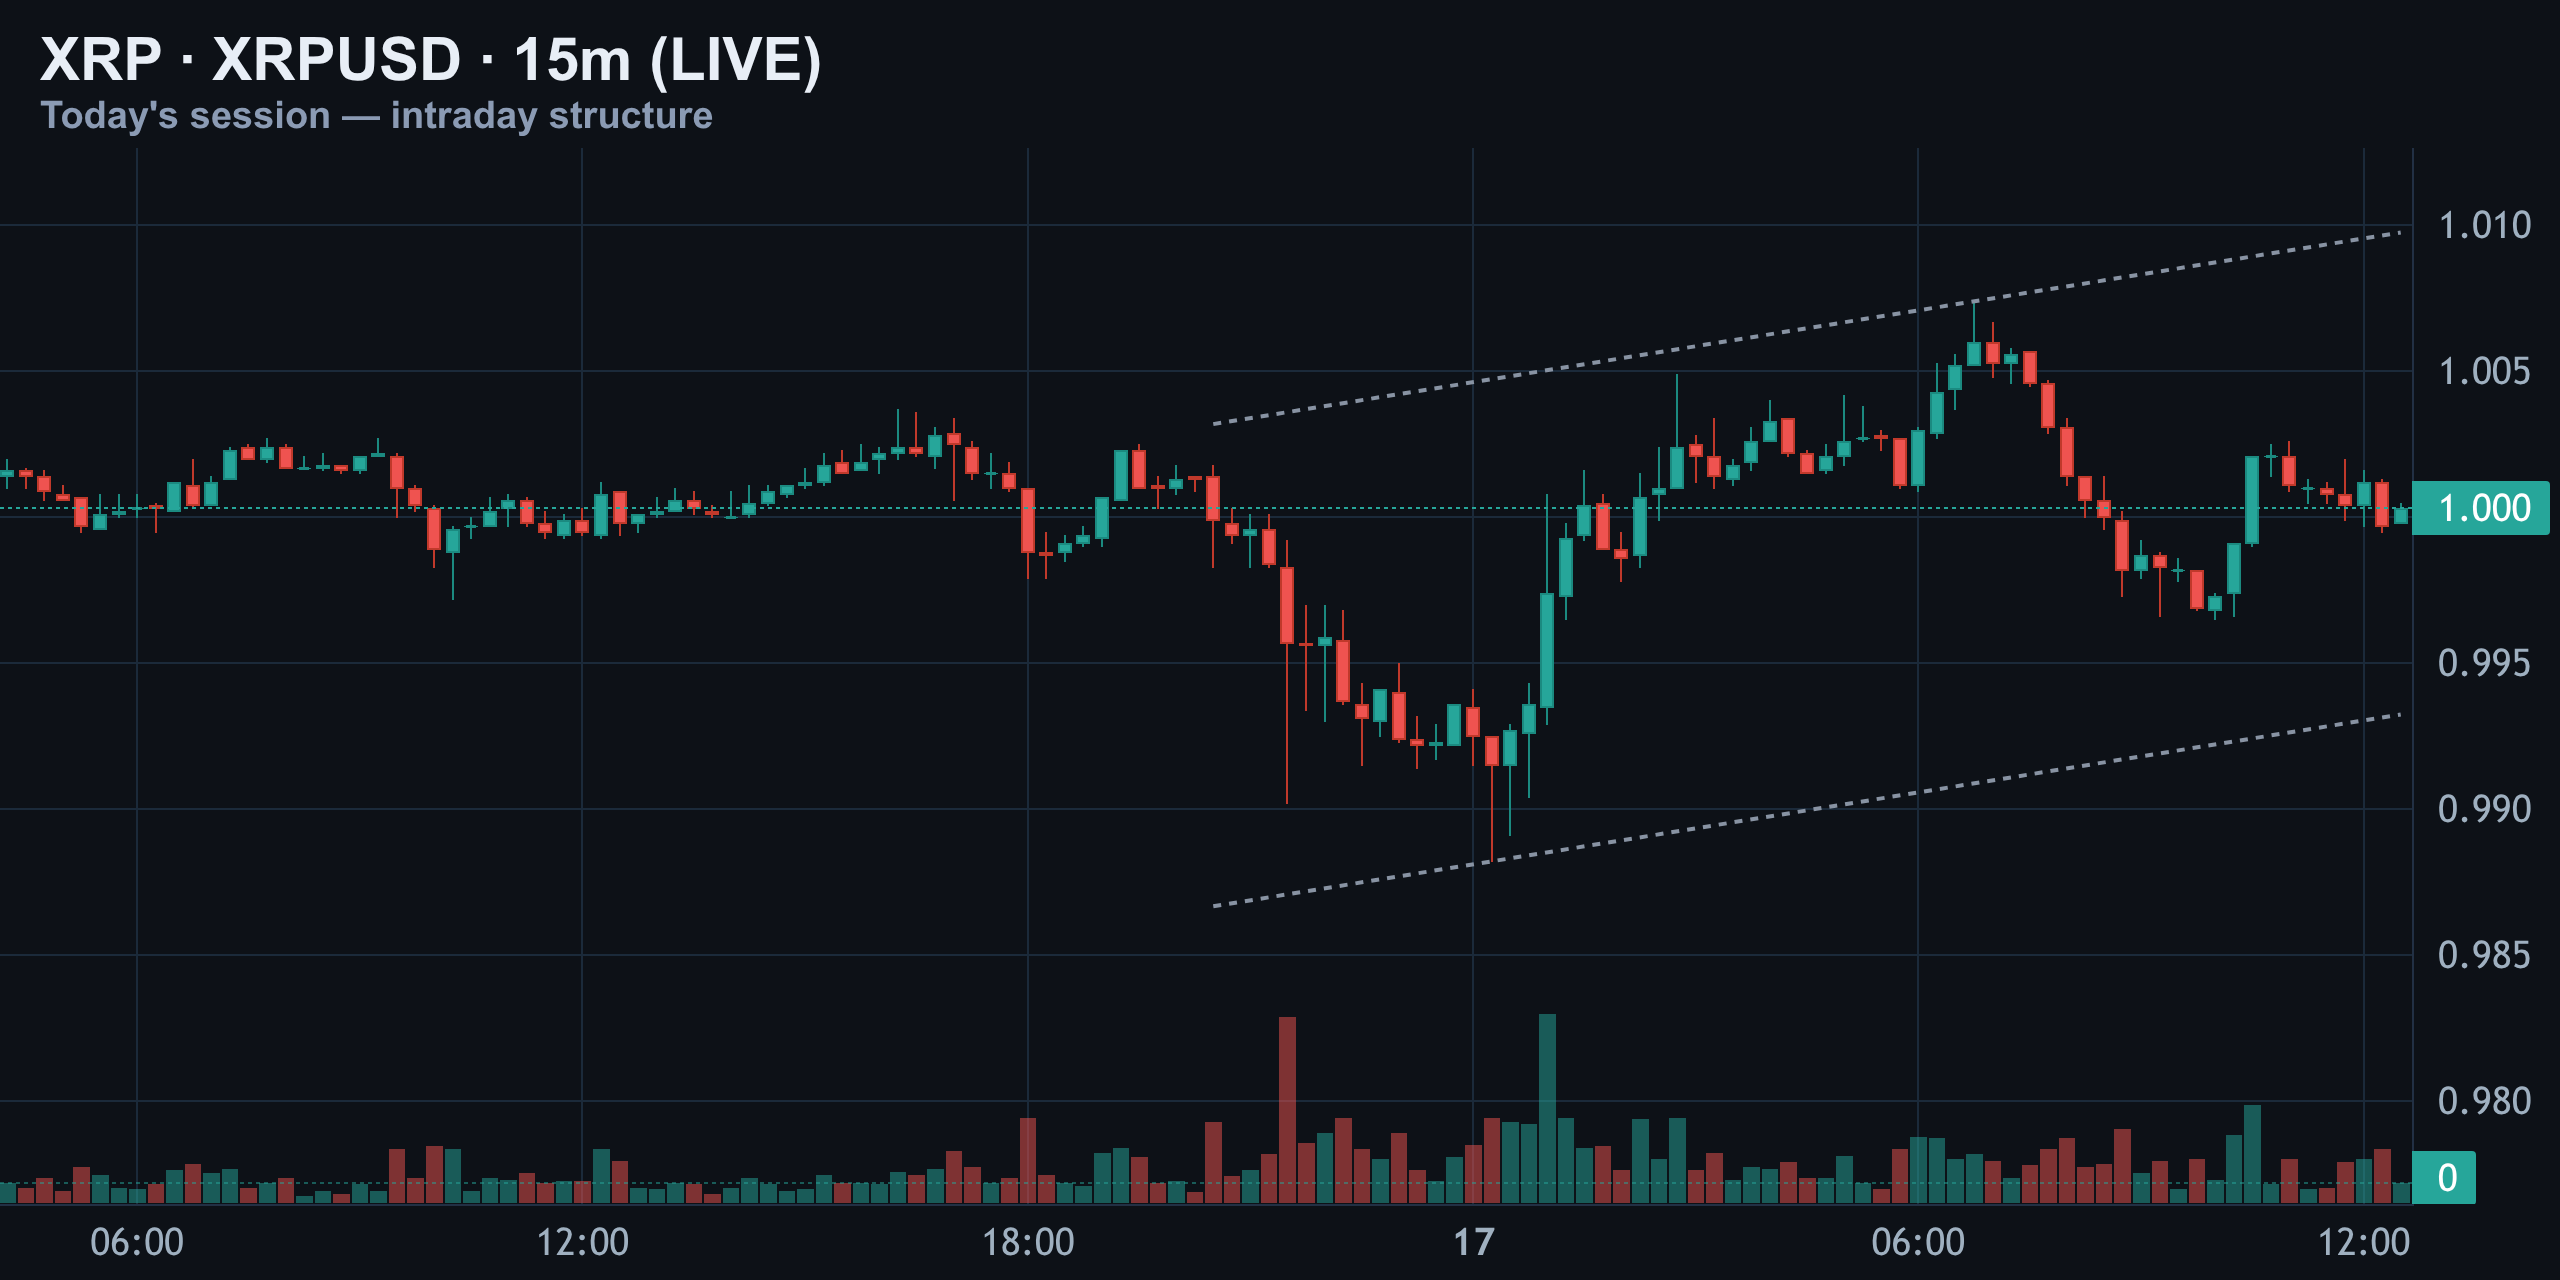
Zoom into today's session and XRP has been chopping hard between $0.99 and $1.01. There's a short-term rising channel building through the middle of the day — basically an uptrend nested inside a bigger sideways range. Two volume spikes stand out: one red, one green, marking spots where liquidity got swept on both sides of the book.
Right now price sits almost exactly back where it opened, at $1.00. That's a market digesting, not deciding. In plain terms: XRP is stuck bouncing around one dollar all day, and tight digestion like this usually resolves with a sharper move once it finally breaks one way.
4-Hour Structure: Pressing the Ceiling of a Downtrend
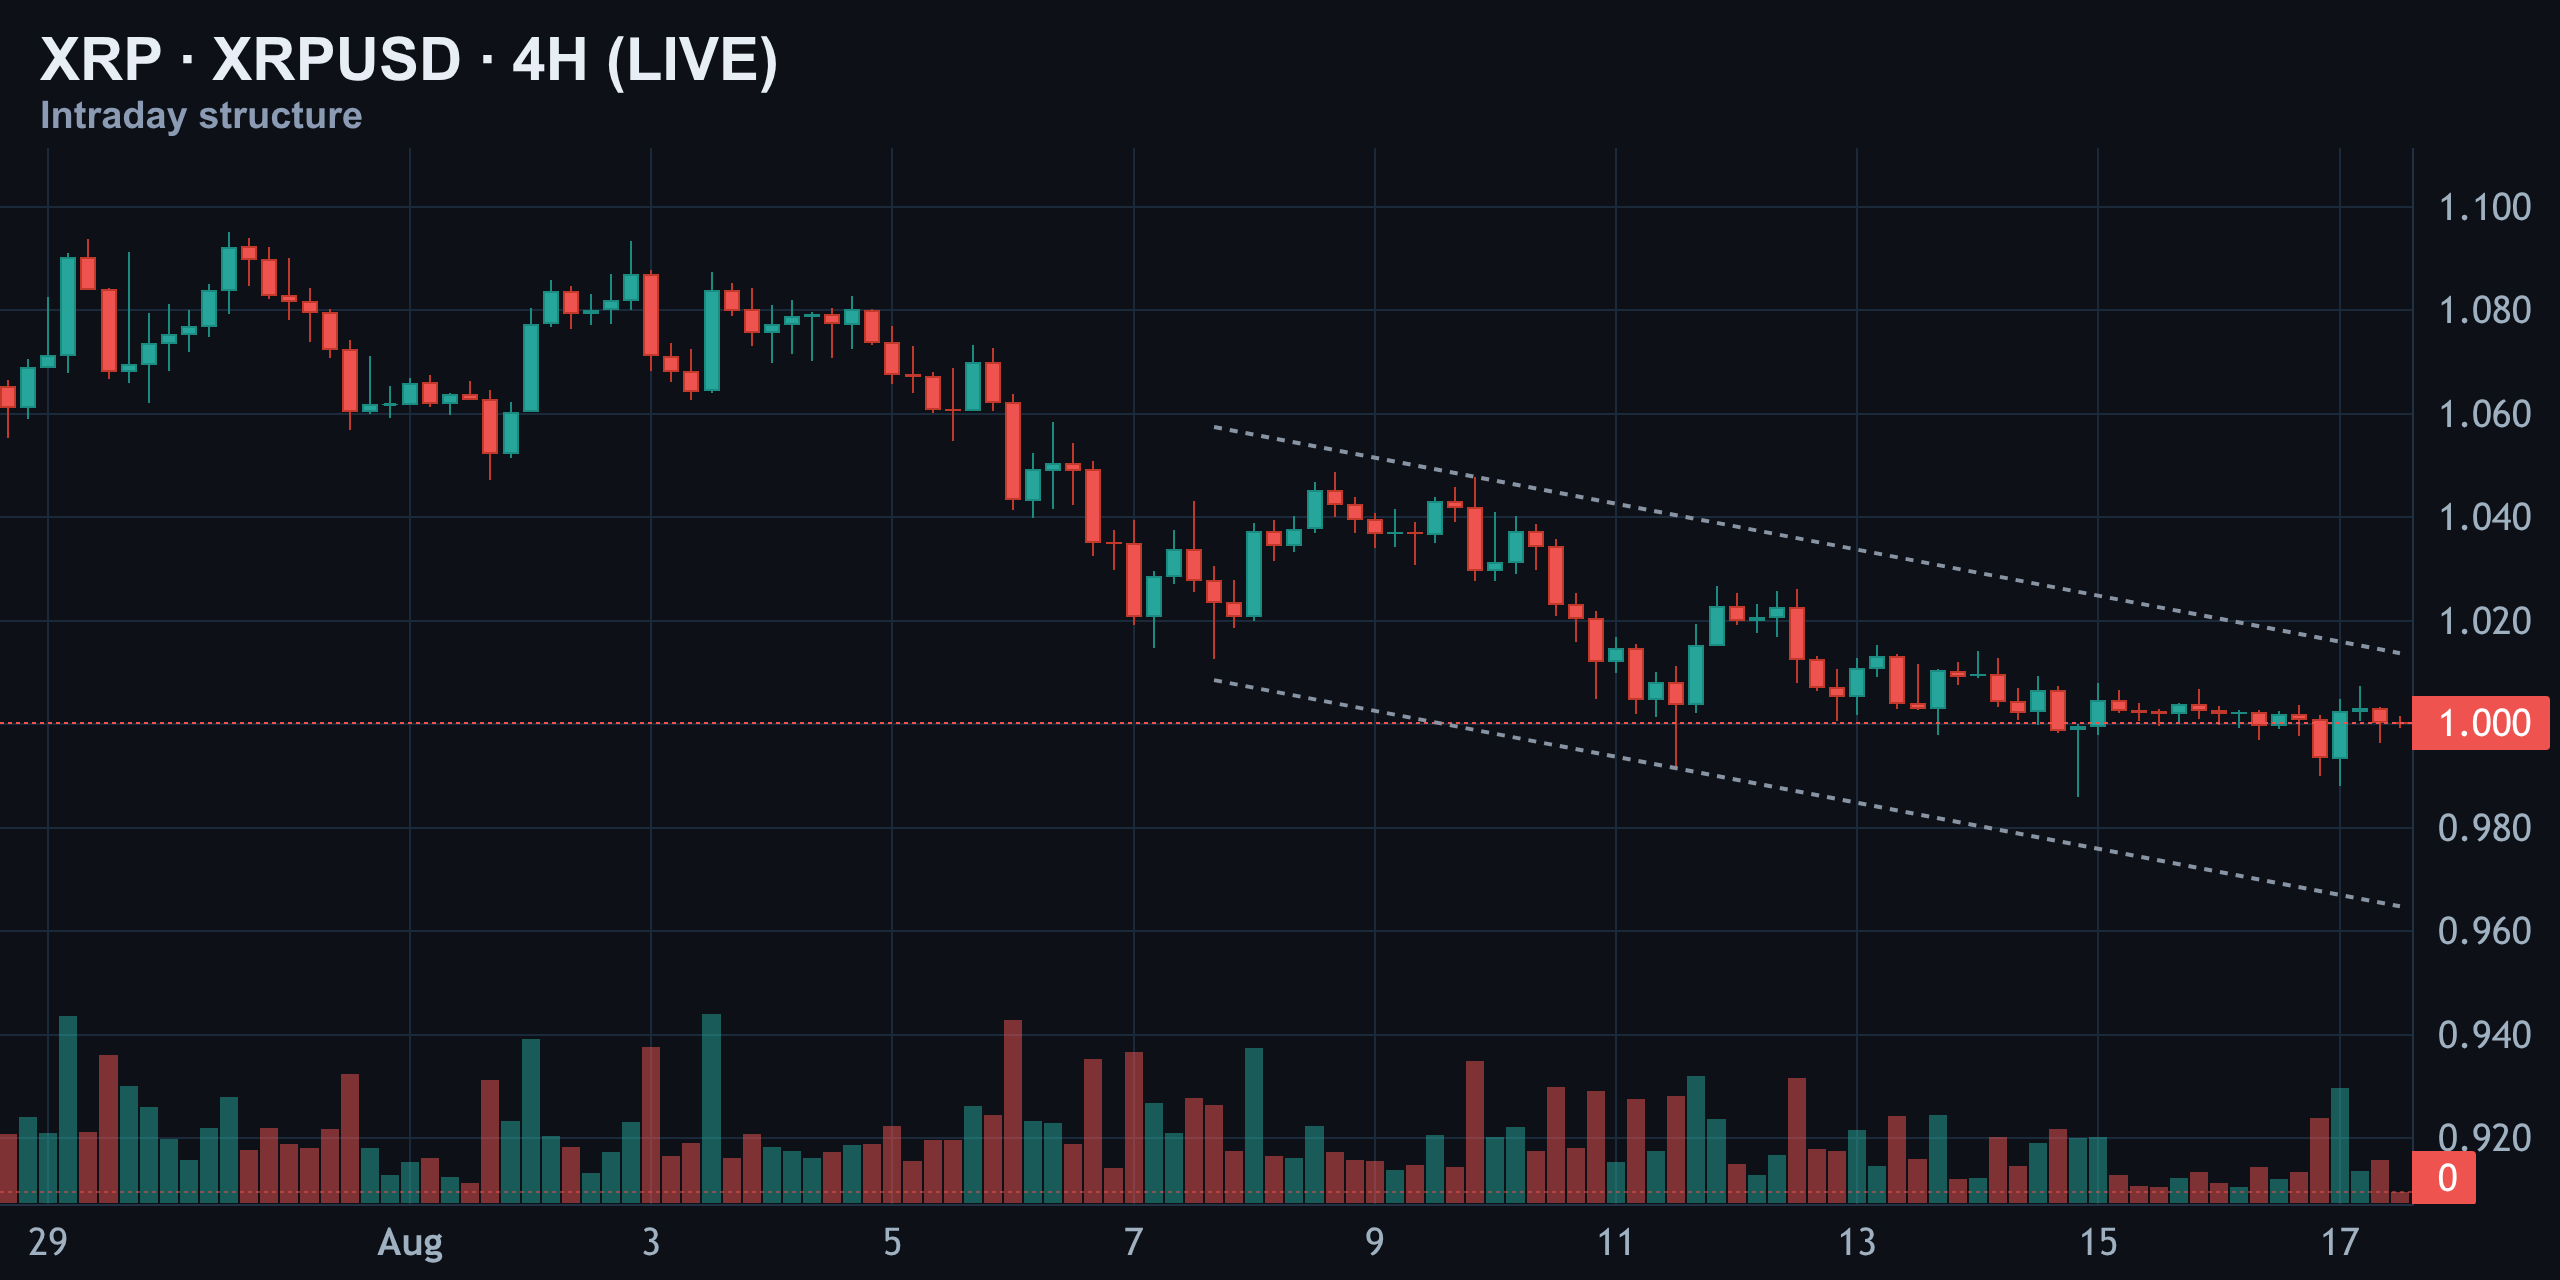
The bigger four-hour picture is less ambiguous. XRP has been sliding lower since the middle of the month — from highs near $1.09 down to today's dollar zone — all inside a clean descending channel. Price is currently pressing right against that channel's upper boundary, the exact spot that's rejected every bounce for the past week.
One detail worth flagging: volume on this latest test is shrinking compared to the sharp red bar mid-month. Sellers aren't showing up with the same force this time. That said, the trend structure itself hasn't changed — the downtrend since early August is still intact until proven otherwise.
Daily Chart: The Squeeze Toward $0.9862
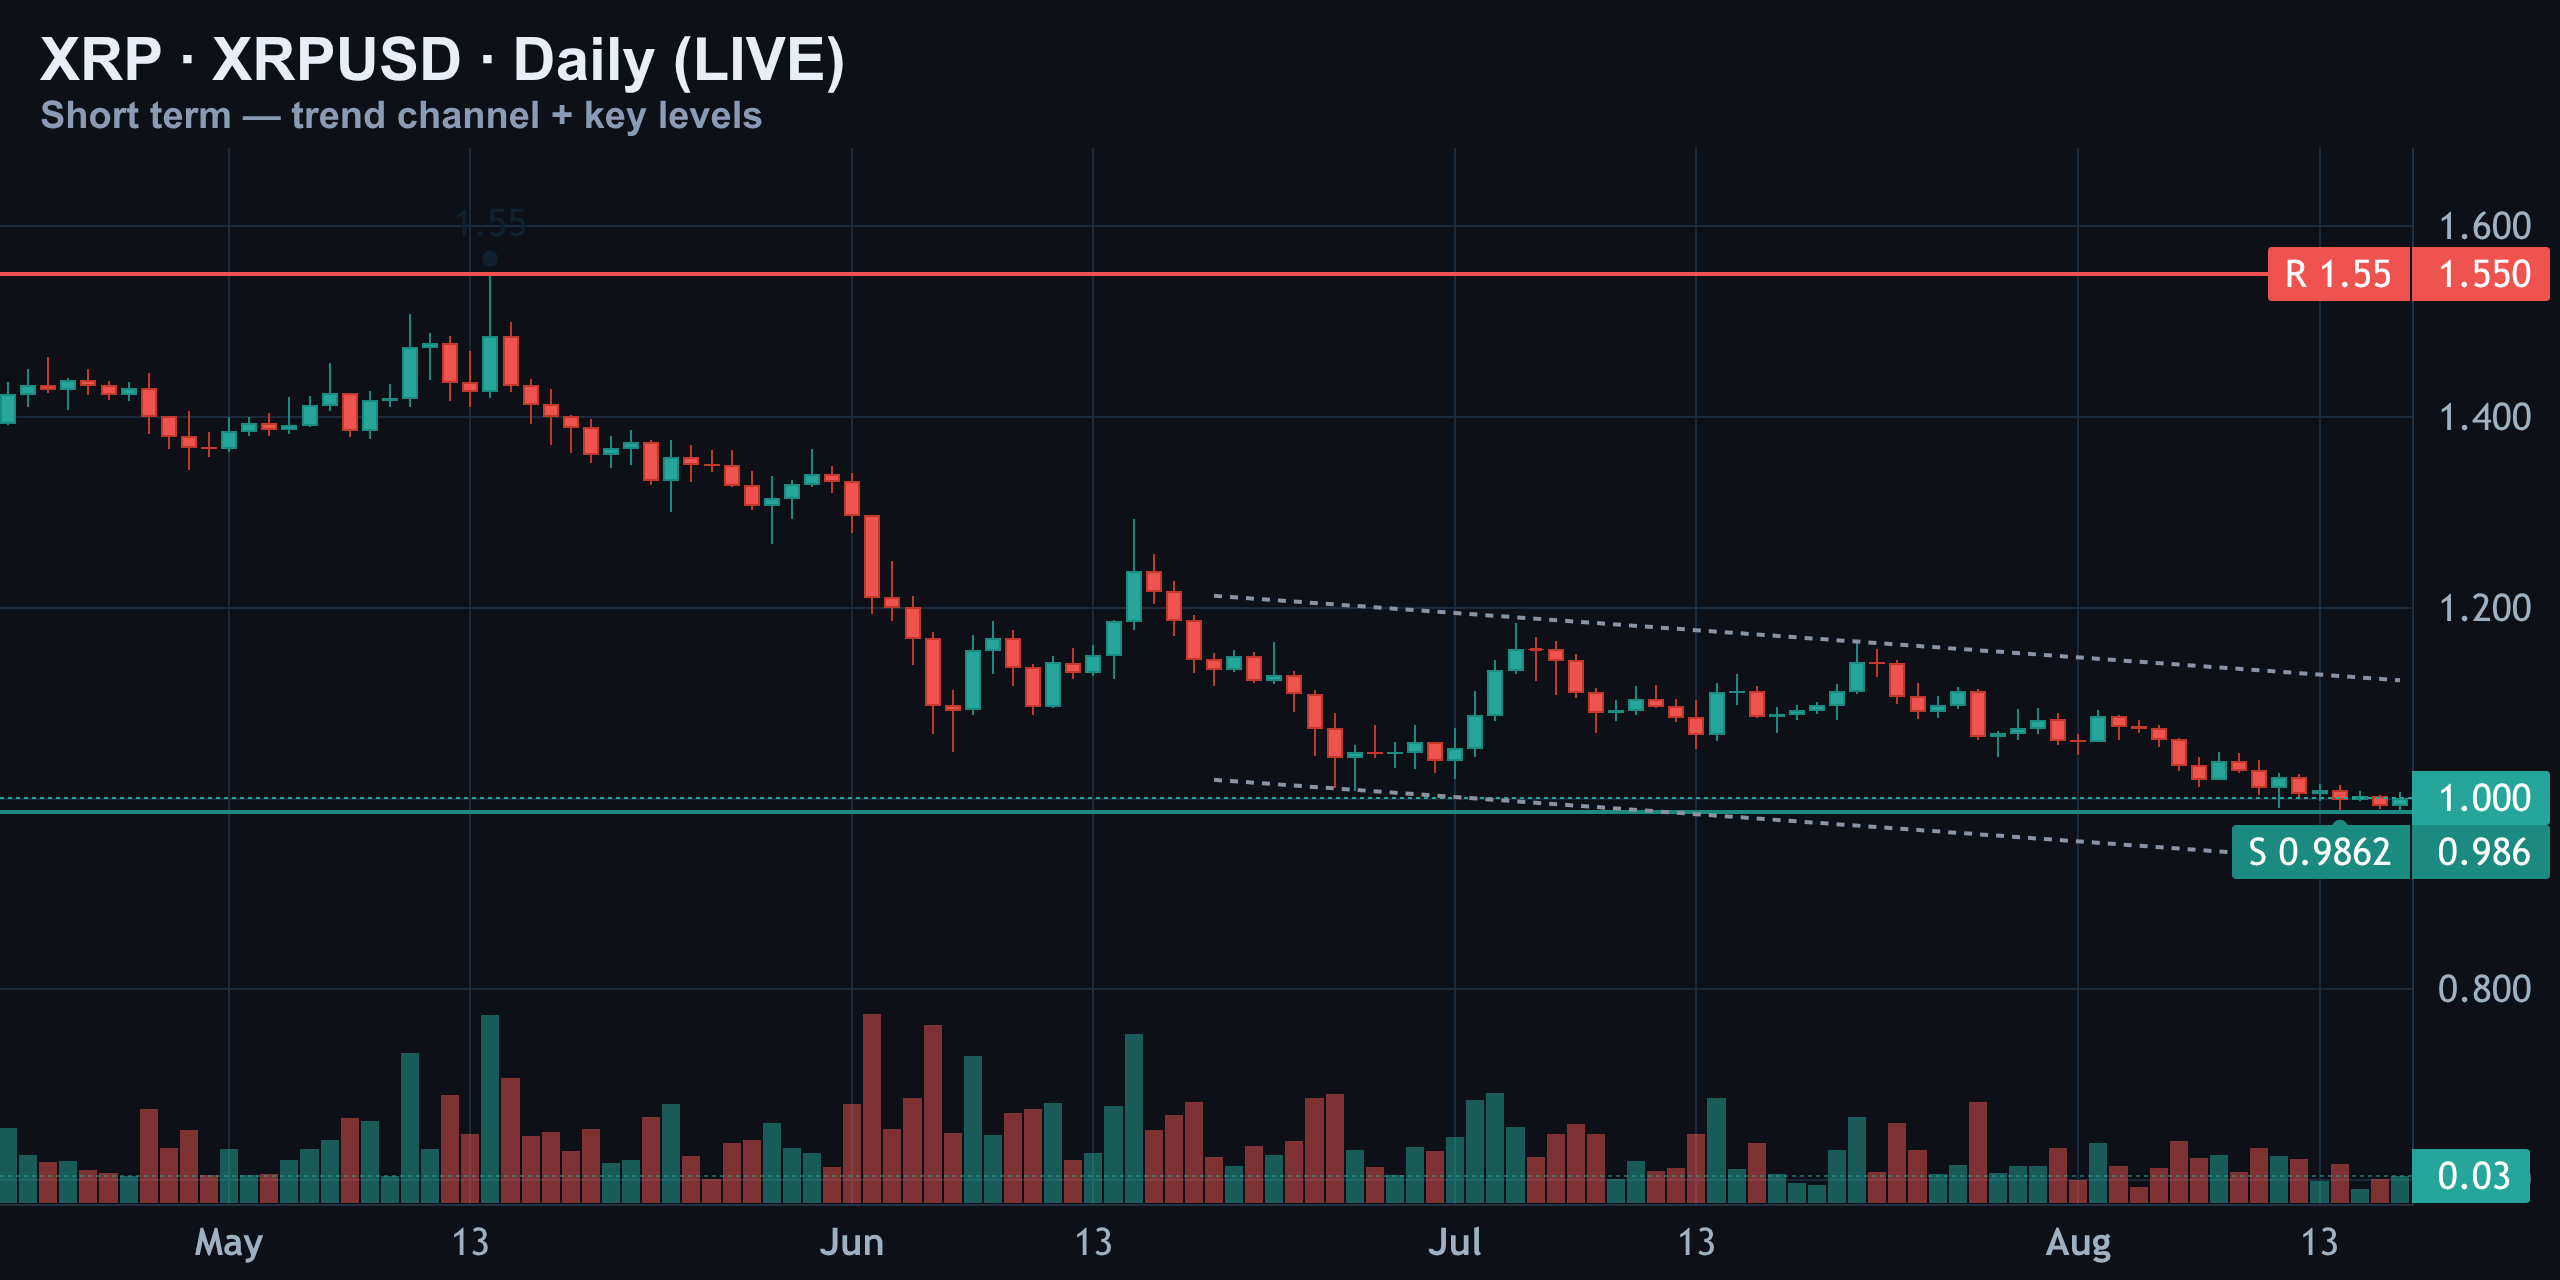
On the daily timeframe, the slide from over $1.50 back in May has flattened into a tightening channel just above $0.9862. That level is the nearby floor — price has tested and bounced off it multiple times over the past week.
| Level | Price | Relevance |
|---|---|---|
| Ask wall (ceiling) | $1.04 | Overhead resistance, defended repeatedly |
| Intraday high | $1.01 | Today's session cap |
| Spot | $0.9999 | Current price |
| Daily channel support | $0.9862 | Key floor, tested multiple times this week |
| Bid wall (floor) | $0.95 | Dealer-defended demand zone |
| May high | $1.55 | Historical, not relevant to this setup |
The $1.55 resistance up top is a relic of May's high; it's nowhere near today's action and doesn't matter for this trade. What matters is that price keeps compressing tighter and tighter into the $0.9862 floor — and that kind of compression usually means a decisive break isn't far off.
Momentum Check: RSI and MACD Both Say 'Not Yet'
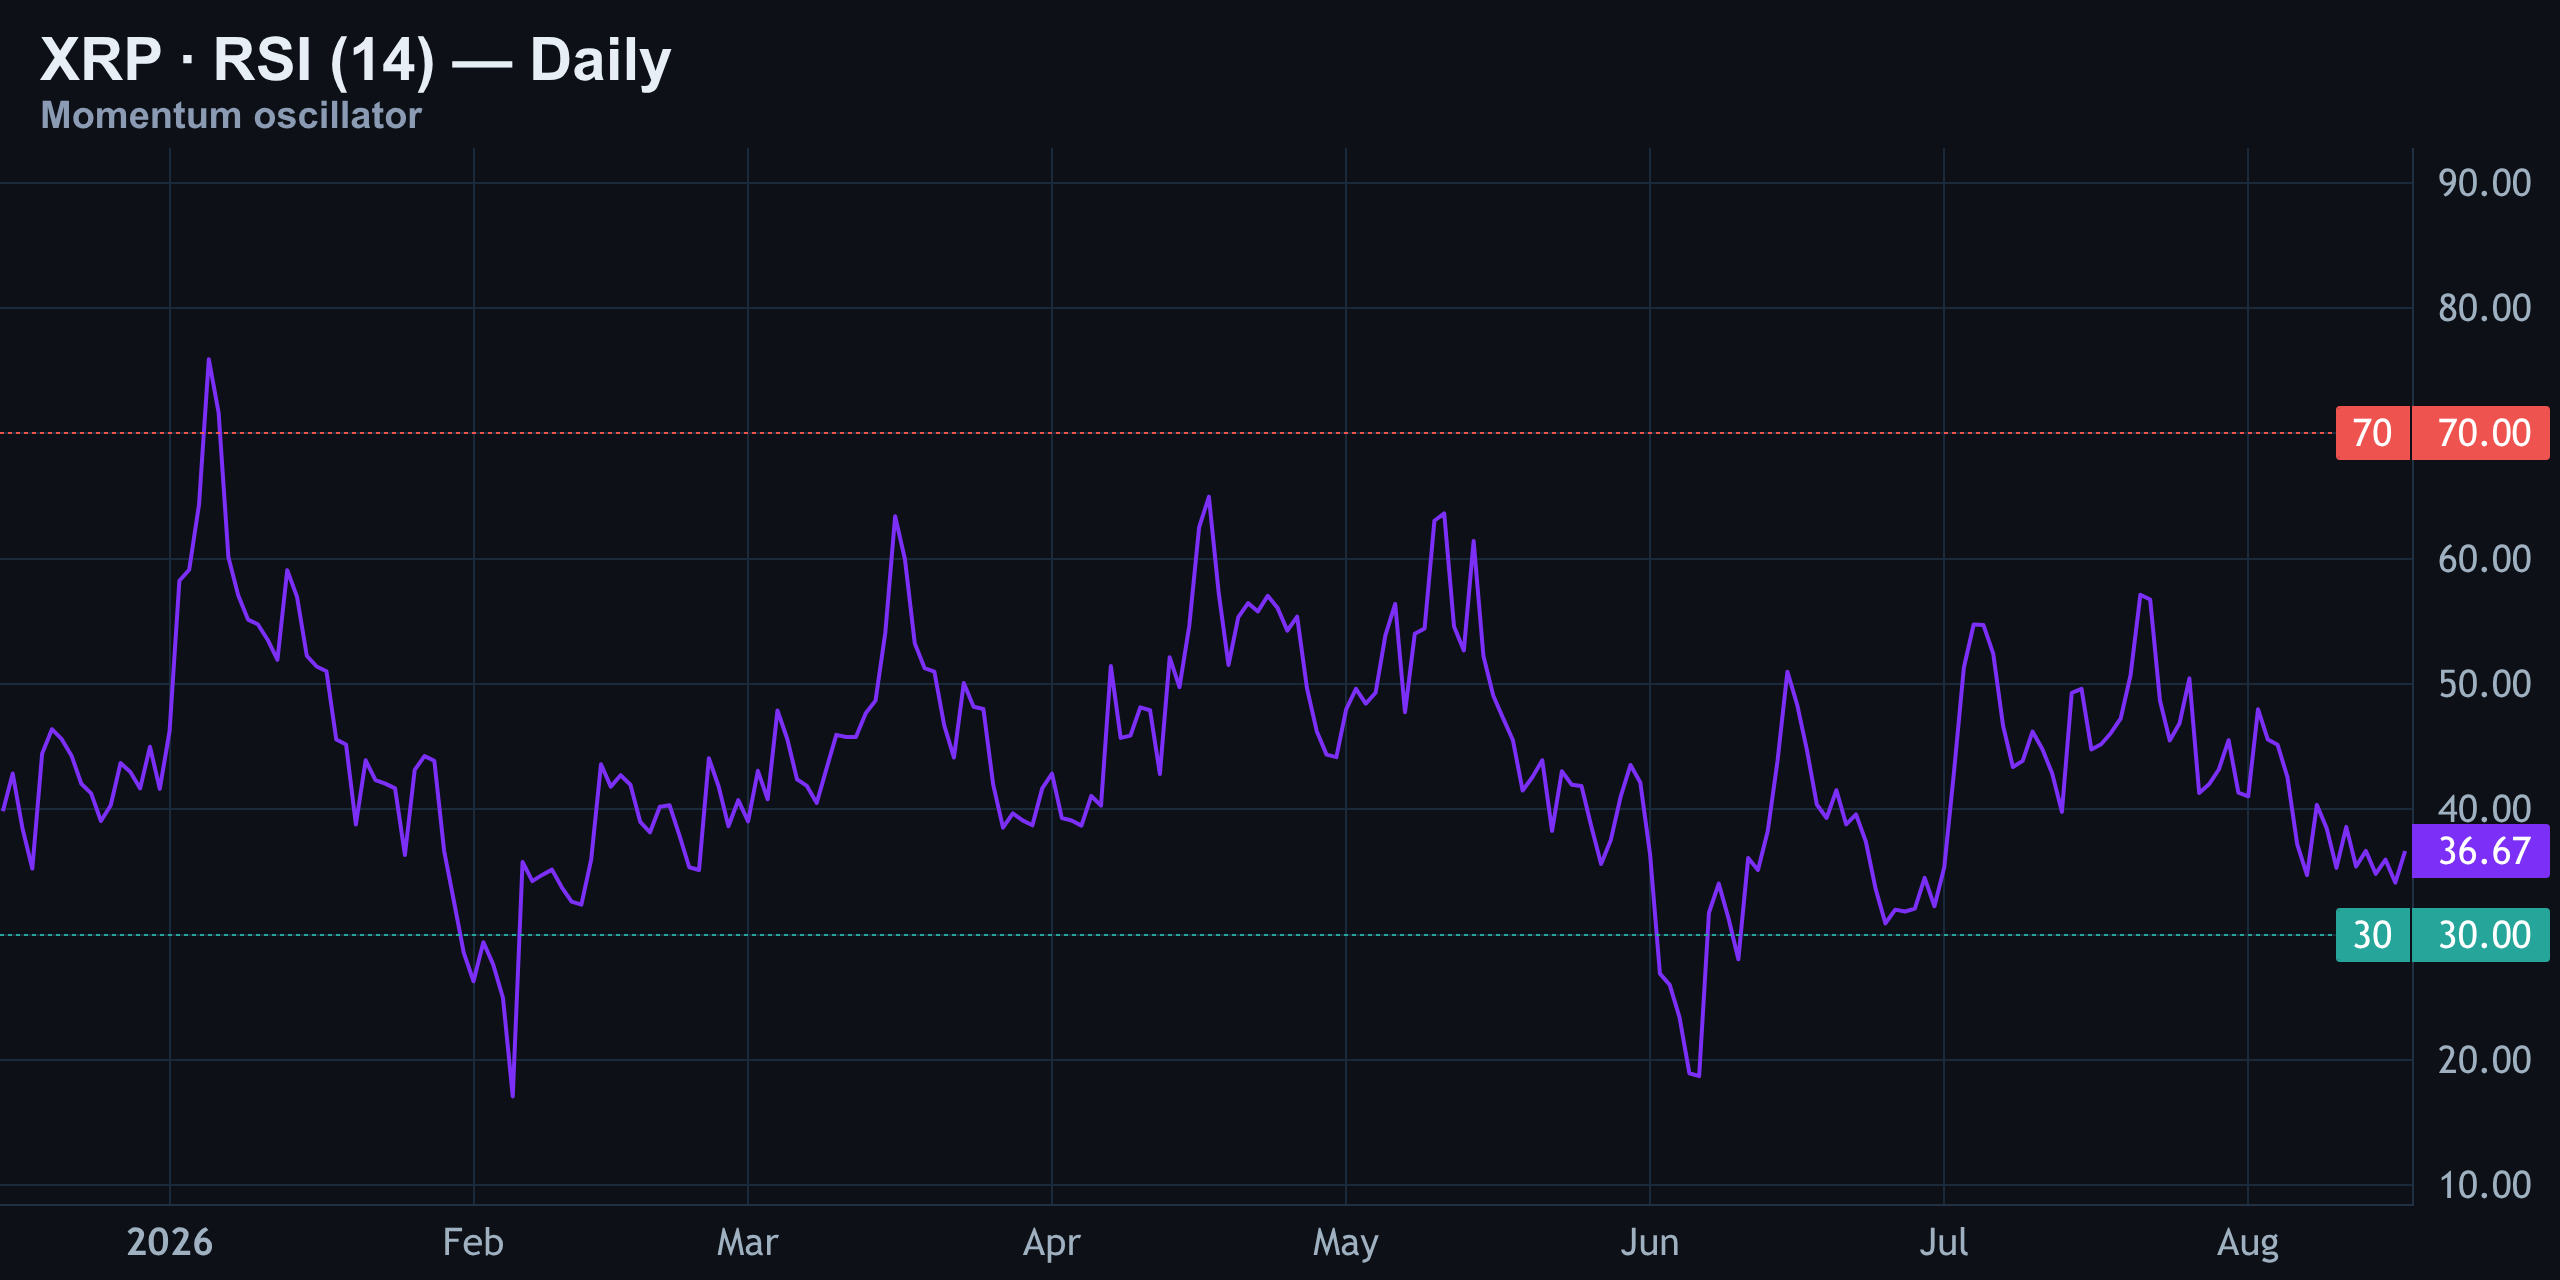
RSI is sitting at 37 right now — neutral territory, not the deeply oversold reading you'd want for a genuine bounce signal. Looking back across the year, RSI peaked near 70 in January and has been printing progressively lower highs since, matching price's own downtrend. There's no divergence forming yet, meaning momentum and price are still moving together, not fighting each other.
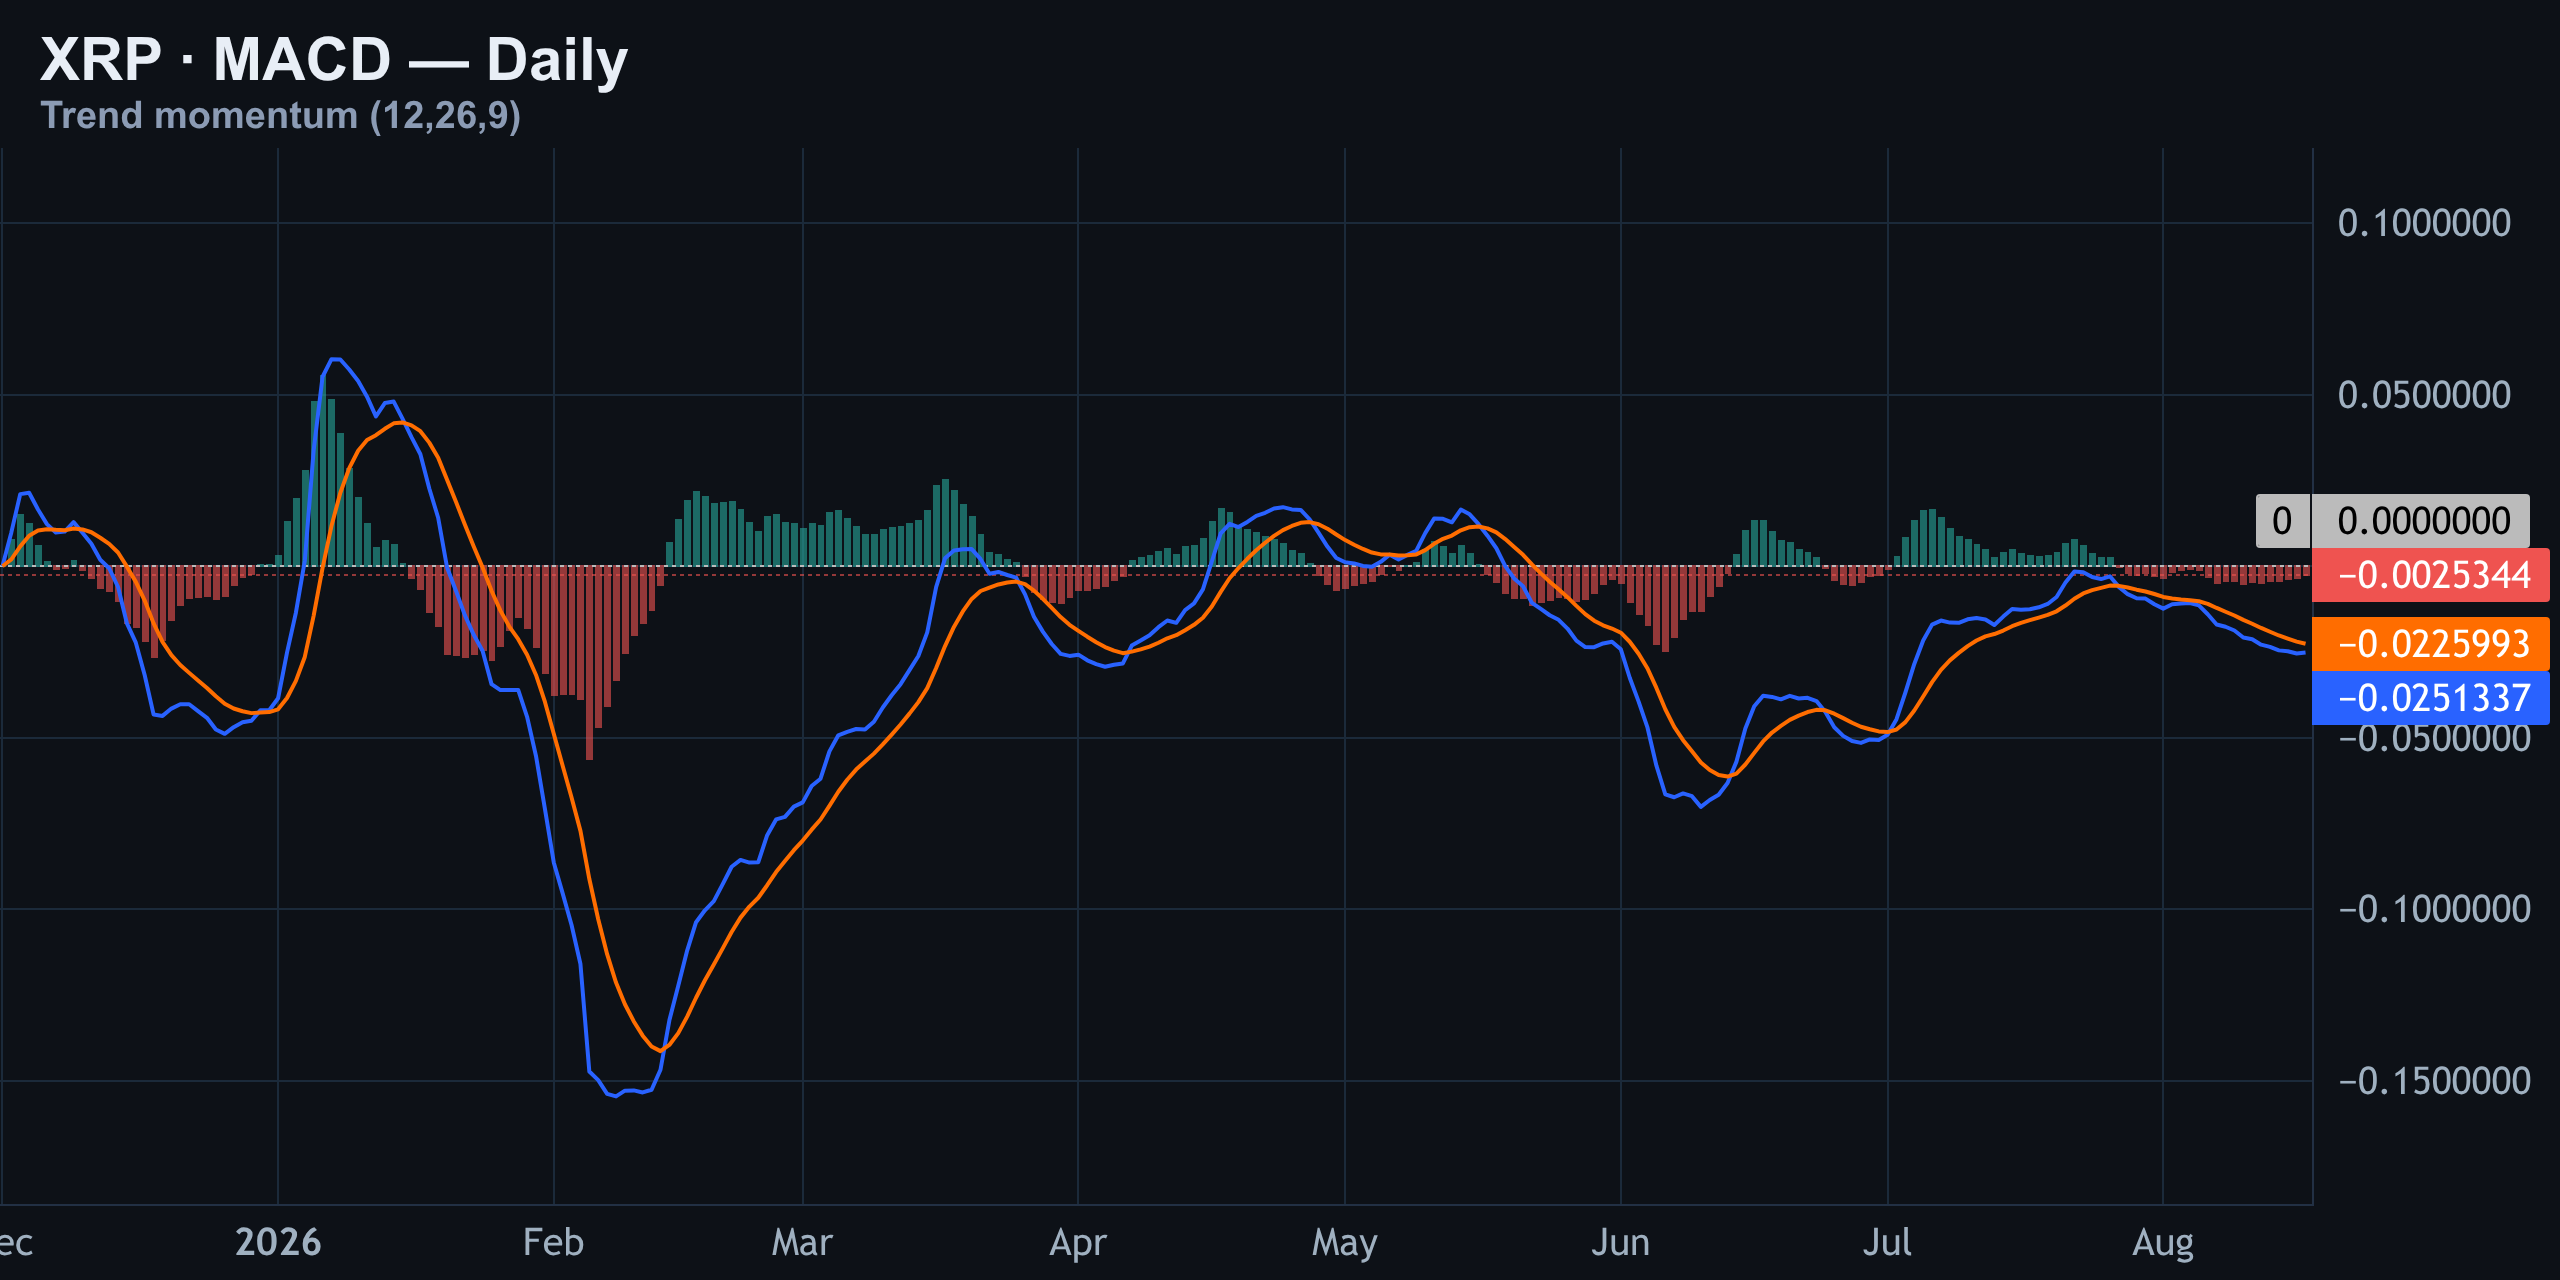
MACD tells the same story. The MACD line is running below its signal line and the histogram bars are printing negative — bearish momentum is still in charge, even if it's not accelerating. Compare that to the sharp positive histogram bars back in April and May: this current dip is shallow by comparison, more of a grind than a slide.
Liquidations, Order Flow, and the Retail Trap
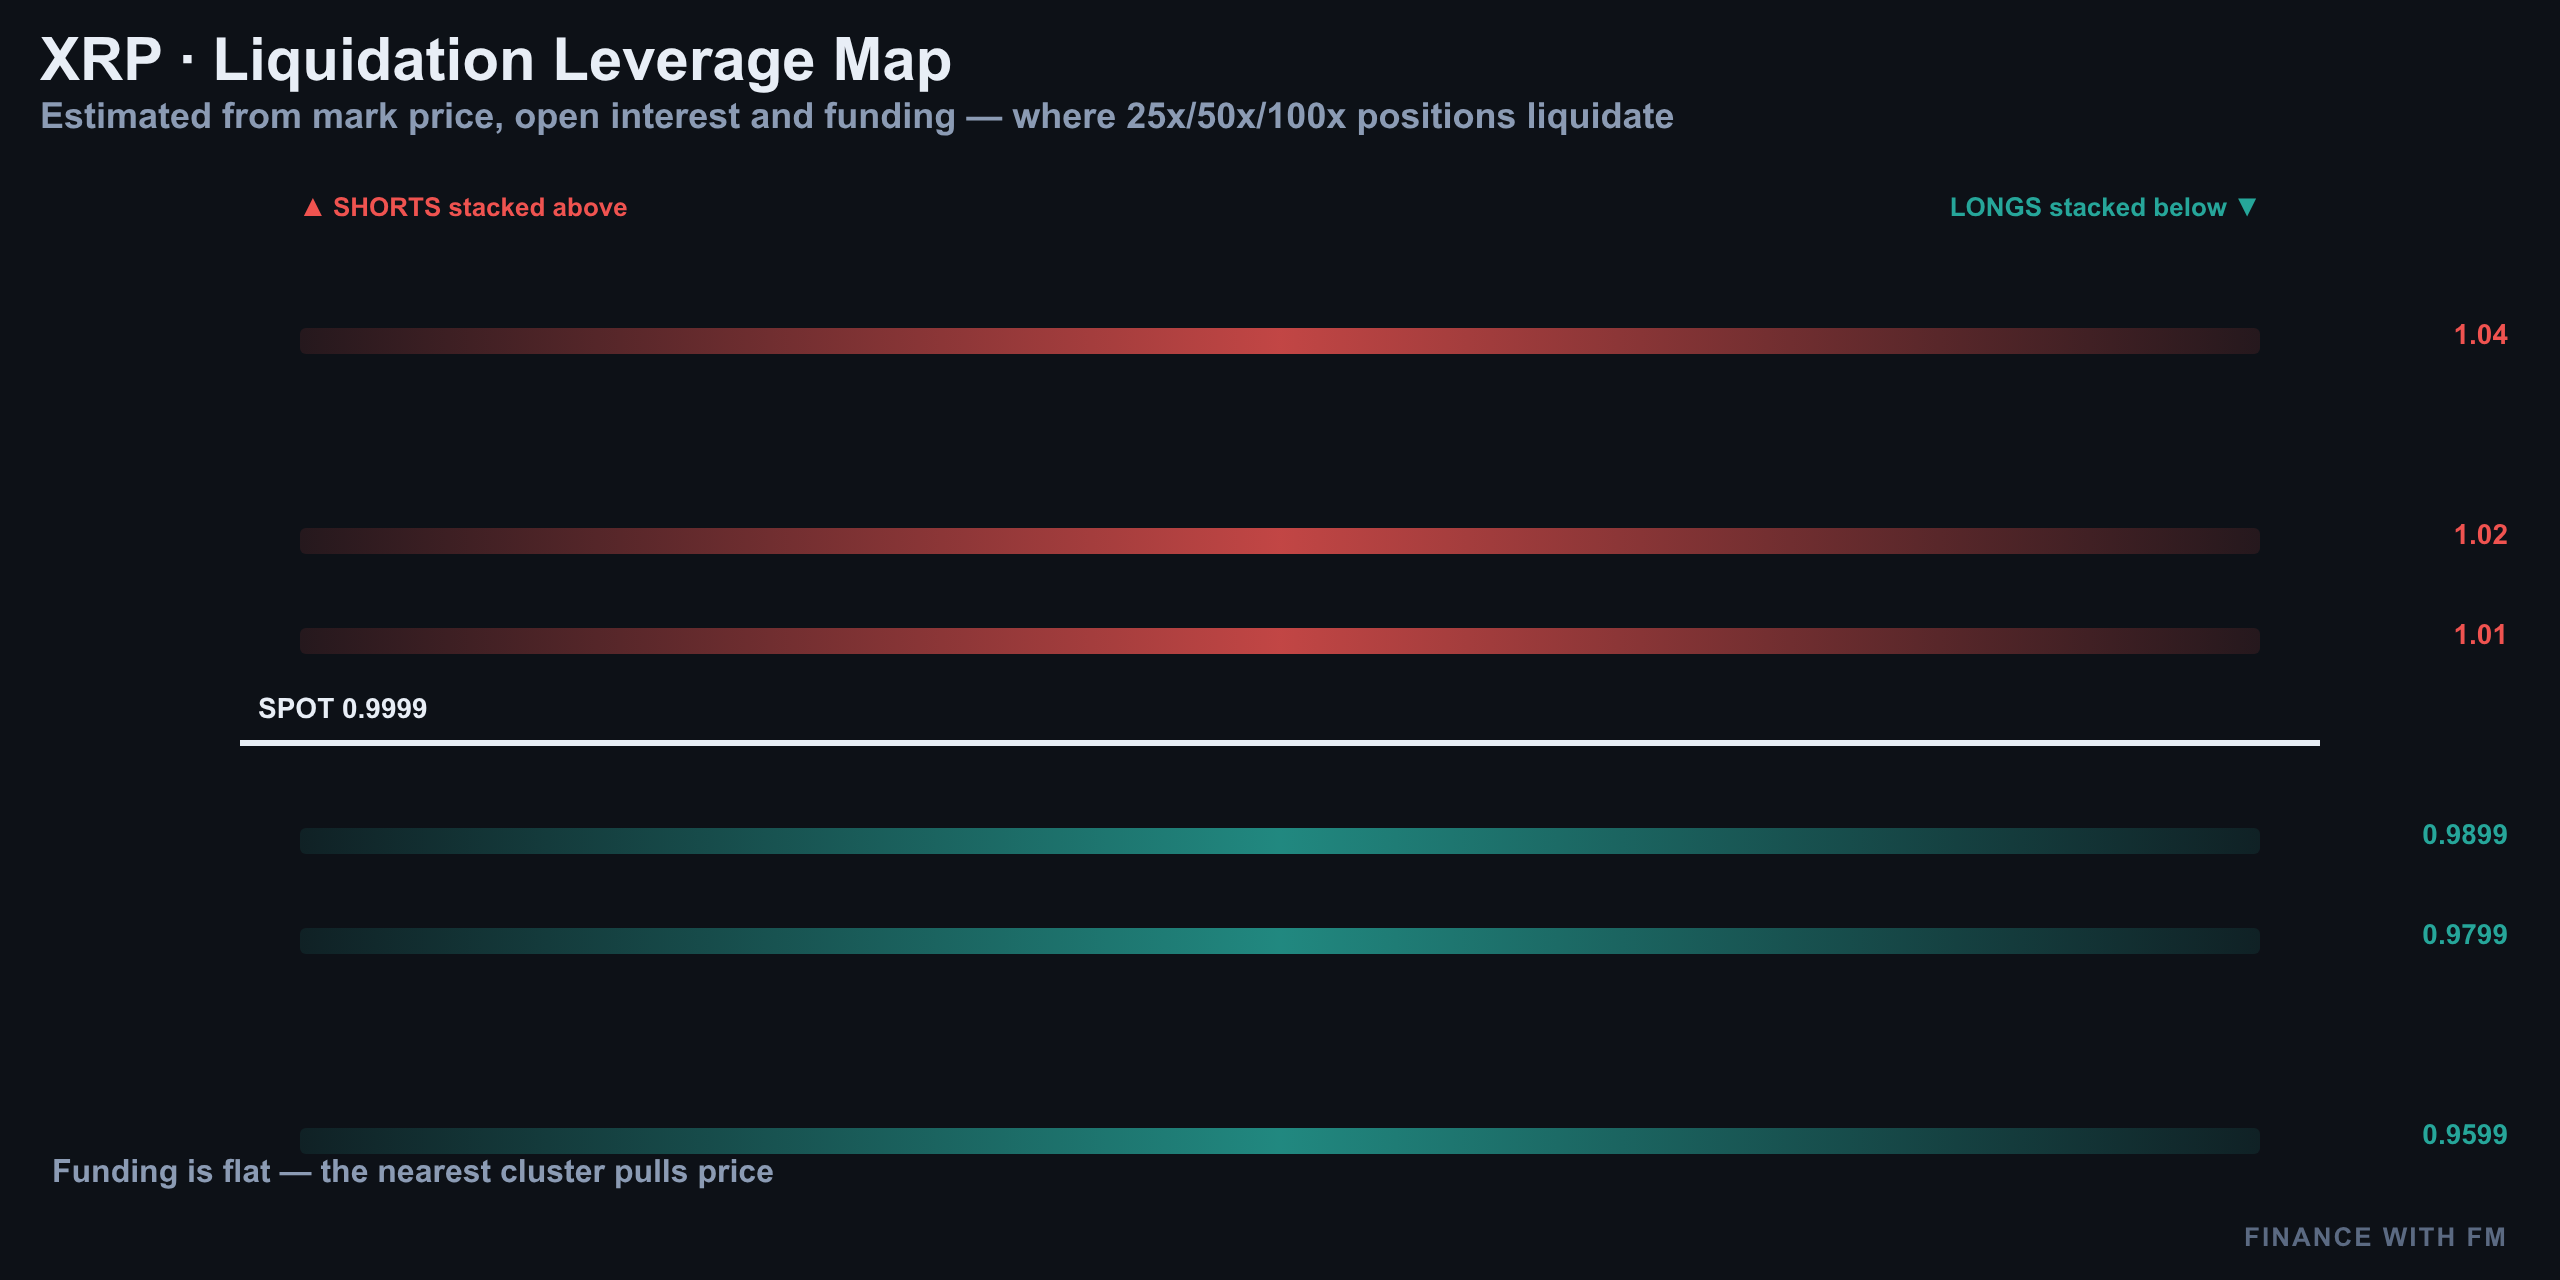
Funding is basically flat at -0.0017%, so leverage isn't skewed hard either way on cost. But open interest jumped over 25% in a week to around 414 million XRP — that's real leverage building into a flat price, and it's exactly the kind of setup that resolves violently once it breaks.
| Positioning Metric | Reading |
|---|---|
| Open interest (7-day change) | +25%+, ~414M XRP |
| Funding rate | -0.0017% (flat) |
| Retail long/short skew | 3:1 long |
| Top trader long/short skew | <2:1 long |
| Taker buy/sell ratio | 0.72 (sellers hitting bid harder) |
| Order book bid share | 55% |
| Ask wall vs bid wall size | $1.04 wall > $0.95 wall |
Here's the trap: retail is piling into longs three-to-one, while the smarter money — top traders — is far less convinced, sitting under two-to-one. Meanwhile actual taker flow at 0.72 shows sellers hitting the bid harder than buyers are lifting the ask. The order book leans 55% bids on paper, but the ask wall at $1.04 physically outweighs the bid wall at $0.95.
Translation: retail is leaning long into a market that's quietly getting sold. That's a classic setup for a squeeze lower once the range finally breaks — the crowd gets caught leaning the wrong way just as leverage unwinds.
The Trade Setup: Levels That Matter Today
Putting it together: flat price, rising open interest, sell-heavy taker flow, soft momentum, and a retail crowd leaning long into resistance. The weight of evidence still favors the bears into the $1.04 ceiling, with $0.9862 as the immediate battleground below.
| Trade Parameter | Level |
|---|---|
| Entry (short) | ~$1.0050 |
| Stop loss | $1.0116 |
| Target | $0.9775 |
| Risk/Reward | 1:2.5 |
| Invalidation | Daily close above $1.04 ask wall |
The bias flips the moment price closes decisively above the $1.04 ask wall on strong volume — that would suggest the shrinking-volume rejection we've seen all week has finally run out of sellers. Until then, the setup favors fading strength back toward $0.9862, with $0.95 as the deeper floor if that level gives way.
The Bottom Line
XRP's dollar wall held again today. Price barely moved, but the internals — open interest up 25%, taker flow sell-heavy, retail crowded into longs — tell a more interesting story than the candle does. This is compression, not calm, and compression this tight rarely stays quiet for long.
Keep $0.9862 and $1.04 on your radar. One is the level that keeps this bearish lean intact; the other is the one that kills it. Everything else is noise until one of those breaks.
More on XRP: elliott wave · derivatives
Analysis and education, not investment advice. See our editorial policy.