Daily market analysis
XRP (XRP) derivatives
Last updated
XRP Leverage Report: Fresh Shorts Press, Whales Stay Long
XRP Breaks Down to $1.01 as Open Interest Explodes
XRP has had a rough stretch. After trading near $1.08 earlier in the window, the token chopped lower through $1.06 and $1.04, briefly stabilized around a $1.03 shelf, then broke that support hard — sliding straight into the $1.01 zone where it now sits. Yahoo Finance data shows XRP printing an intraday low near $1.009 on August 11, down from a close above $1.03 just two sessions earlier.
That's not a slow grind lower — it's a sharp, decisive leg down in the final stretch of trading, and it's happening at the same time XRP's futures open interest is doing something unusual: expanding, not shrinking. Broader market forecasts had actually penciled in a range of $1.00 to $1.18 for August, with XRP entering the month near $1.06 — so this drop into the $1.01 zone puts price right at the lower edge of that expected band.
The Daily Chart: A Sharp Breakdown Into a Liquidity Pocket
Zooming into the structure, XRP rolled over from the $1.08 area early in this window, worked its way down through $1.06 and $1.04, found temporary footing around $1.03, and then broke that shelf decisively — dropping straight into the $1.01 zone where price is now trading. It's the kind of move that looks orderly on a weekly chart but feels violent in real time, especially with leverage stacked on both sides.
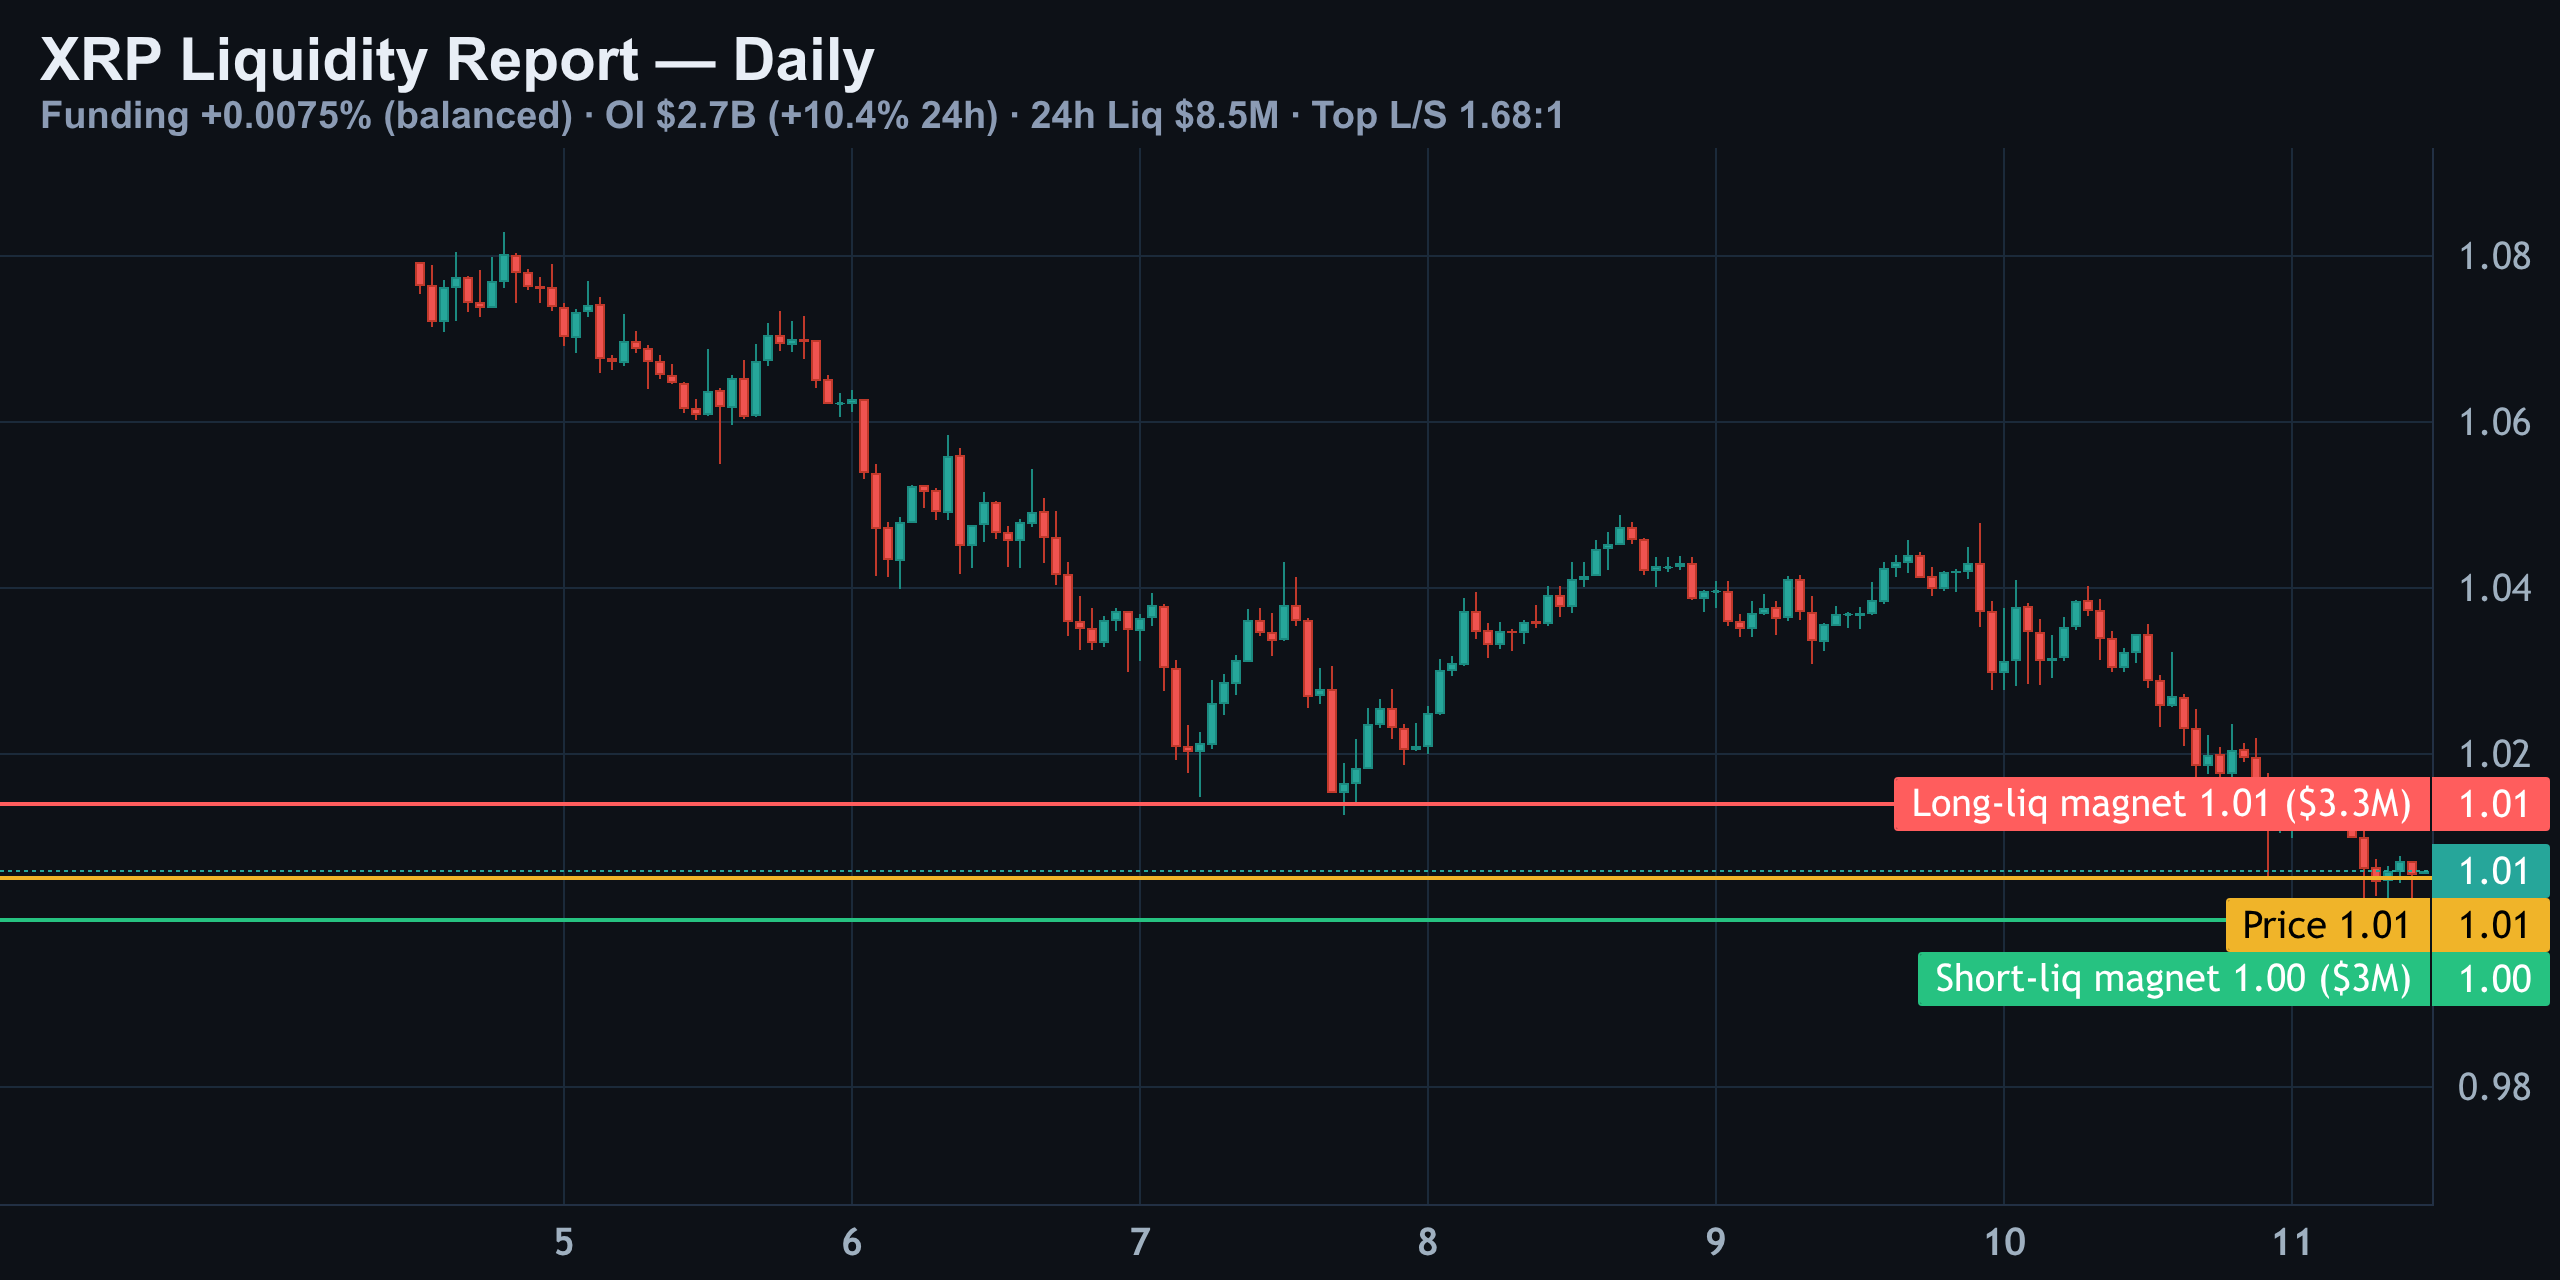
The overlay on this chart is the important part. Two horizontal lines sit right where price is currently wedged — a long-liquidation magnet just above at $1.01, and a short-liquidation magnet just below at $1.00. Price sitting almost exactly between two liquidation pools is precisely the setup that tends to produce sharp, fast moves rather than a slow drift in either direction, because whichever level breaks first triggers forced closing of leveraged positions that adds fuel to the move.
Funding, Open Interest and Liquidations: What the Strip Says
Start with funding, because it's the cleanest read here — and it's telling you almost nothing directional. Funding is printing +0.0075% per 8-hour period, which annualizes to roughly +8.2%. That's close to neutral. Nobody is paying up meaningfully to hold either side of this trade, which rules out the classic funding-driven squeeze setup where an overcrowded long or short gets bled dry by carrying costs.
| Metric | Value | Read |
|---|---|---|
| Funding rate (8h) | +0.0075% | Neutral — no crowded side |
| Open interest | $2.7B | Up 10.37% in 24h |
| OI change vs price | OI up, price down | Fresh shorts pressing in |
| 24h liquidations (total) | $8.5M across 1,633 orders | Longs took ~97% of the pain |
| Top-trader long/short | 1.68 : 1 | Smart money net long |
| Crowd-wide long/short | 0.89 : 1 | Broader base near-flat / slightly short |
| Taker buy volume (24h) | 47.0% | Slightly sell-heavy flow |
| 4h RSI | 31.2 | Oversold territory |
Open interest sitting at $2.7 billion, up 10.37% in 24 hours, while price fell over the same stretch, only really supports one story: new short sellers are actively adding size into the drop, not passively riding an existing position. That's aggressive positioning, and it's the dominant force behind today's leg lower.
But the liquidation data tells a second, separate story. Of the $8.5 million wiped out in the last 24 hours, $8.3 million came from long positions versus just $207,700 from shorts — meaning longs absorbed over 97% of the damage. The leveraged long crowd that was sitting on this market has already been flushed out. That's a meaningful detail: the weak hands on the long side are largely gone, which changes who's left to get hurt on the next move.
The Liquidation Magnets: $1.00 vs $1.01
With price wedged almost exactly between two liquidation pools, these two levels matter more than almost anything else on the chart right now.
| Level | Price | Exposure | What Triggers It |
|---|---|---|---|
| Long-liq magnet | $1.01 | $3.3M in leveraged longs | A push up through this level |
| Short-liq magnet | $1.00 | $3.0M in leveraged shorts | A drop through this level |
If the fresh short sellers keep winning, the path of least resistance is a hunt down toward the $1.00 short-liq magnet, unwinding roughly $3 million in short exposure along the way. If they're wrong — and the positioning data below suggests there's a real case for that — the $1.01 long-liq magnet becomes the more likely stop-hunt target on any short-covering bounce, unlocking $3.3 million in trapped long liquidity.
Smart Money Is Still Long — And That's the Real Tension
Here's where the picture gets genuinely split rather than clean. Binance's top-trader long/short ratio sits at 1.68-to-1, meaning the accounts running the largest position sizes are stacked meaningfully net long. Compare that to the crowd-wide ratio of 0.89-to-1 — essentially balanced-to-slightly-short across the broader account base.
- Top traders (position-weighted): net long at 1.68:1 — biggest players leaning bullish
- Crowd-wide (account-weighted): 0.89:1 — retail roughly split, slightly short-leaning
- Taker flow: 47.0% buy-side — actual executed flow is only marginally sell-heavy
- 4h RSI: 31.2 — momentum is stretched to the downside, bordering on oversold
That divergence matters because top-trader data is weighted by capital, not headcount — it tends to reflect where the money that can move markets is actually positioned, rather than where the largest number of small accounts happen to sit. Right now, that capital is leaning long even as fresh short flow presses price lower on the surface.
How This Compares to the Broader August Range
Zooming out, XRP has been oscillating inside a fairly well-defined band this month. Historical daily data shows the token moving from the low $1.07s down through the $1.02–$1.09 range across the first ten days of August before this latest breakdown into the $1.00–$1.01 zone.
| Date | Approx. Price | Note |
|---|---|---|
| Aug 1 | $1.06 | Month open |
| Aug 3–4 | $1.07–$1.09 | Local bounce |
| Aug 8–9 | $1.03–$1.04 | Shelf tested |
| Aug 11 | $1.01 | Breakdown into liq zone |
Prediction-market pricing tied to XRP's end-of-day level was also centered above $1.03–$1.04 heading into today's session, underscoring that the drop into the $1.01 zone is a fresh, live development rather than an already-priced-in move. Analysts covering the month had generally expected XRP to finish August closer to $1.10, which means today's breakdown is testing the lower boundary of that outlook rather than confirming it.
Score, Scenarios and What We're Watching Next
Scoring this setup honestly rather than forcing a clean narrative: funding is neutral and gives no directional edge. The open-interest-versus-price read is short-term bearish, with fresh shorts clearly pressing size into the drop. But two signals push the other way — the leveraged long crowd has already been liquidated out, and top traders remain net long at 1.68-to-1 against a roughly even broader market. When aggressive new flow and smart-money positioning disagree this openly, that's a 4 out of 10 — real tension, not a directional lean.
- Bear case: fresh shorts keep winning → price grinds toward the $1.00 short-liq magnet, unwinding ~$3M in short exposure
- Bull case: top-trader positioning proves right → short-covering bounce toward the $1.01 long-liq magnet, unlocking ~$3.3M in long liquidity
- Neutral case: price chops between $1.00–$1.01 as neither side commits fresh size while funding stays flat
The next directional move on XRP is likely to be sharp rather than gradual, simply because of how tightly price is wedged between these two liquidation pools. Whichever level breaks first should see forced closing add momentum to that move.
Your Take: Fresh Shorts or Smart-Money Longs?
XRP is currently a genuine coin-flip on the surface — falling price, expanding open interest, and neutral funding all point to fresh short conviction. But underneath, the biggest players on the exchange are still leaning long, and the leveraged long crowd that would have been vulnerable has already been cleared out by recent liquidations.
Previous days
08/07/2026 — XRP Leverage Split: Longs Bleed, Whales Stay 1.67:1 Long
XRP Leverage Split: Longs Bleed, Whales Stay 1.67:1 Long
XRP Daily: Price vs Liquidation Magnets
XRP has spent the week grinding sideways before rolling over hard. Price opened chopping in the $1.06–$1.08 band, pushed up toward $1.09 midweek, then broke down through the $1.06 long-liquidation magnet into August 6th and 7th, landing near $1.03 — just above the $1.01 short-liquidation pool below. Coinglass currently pegs XRP at roughly $1.02, with open interest sitting at $2.34 billion, while other trackers had XRP holding closer to $1.06–$1.07 with open interest at a six-month low just days earlier — a reminder of how fast this leverage picture is moving right now.
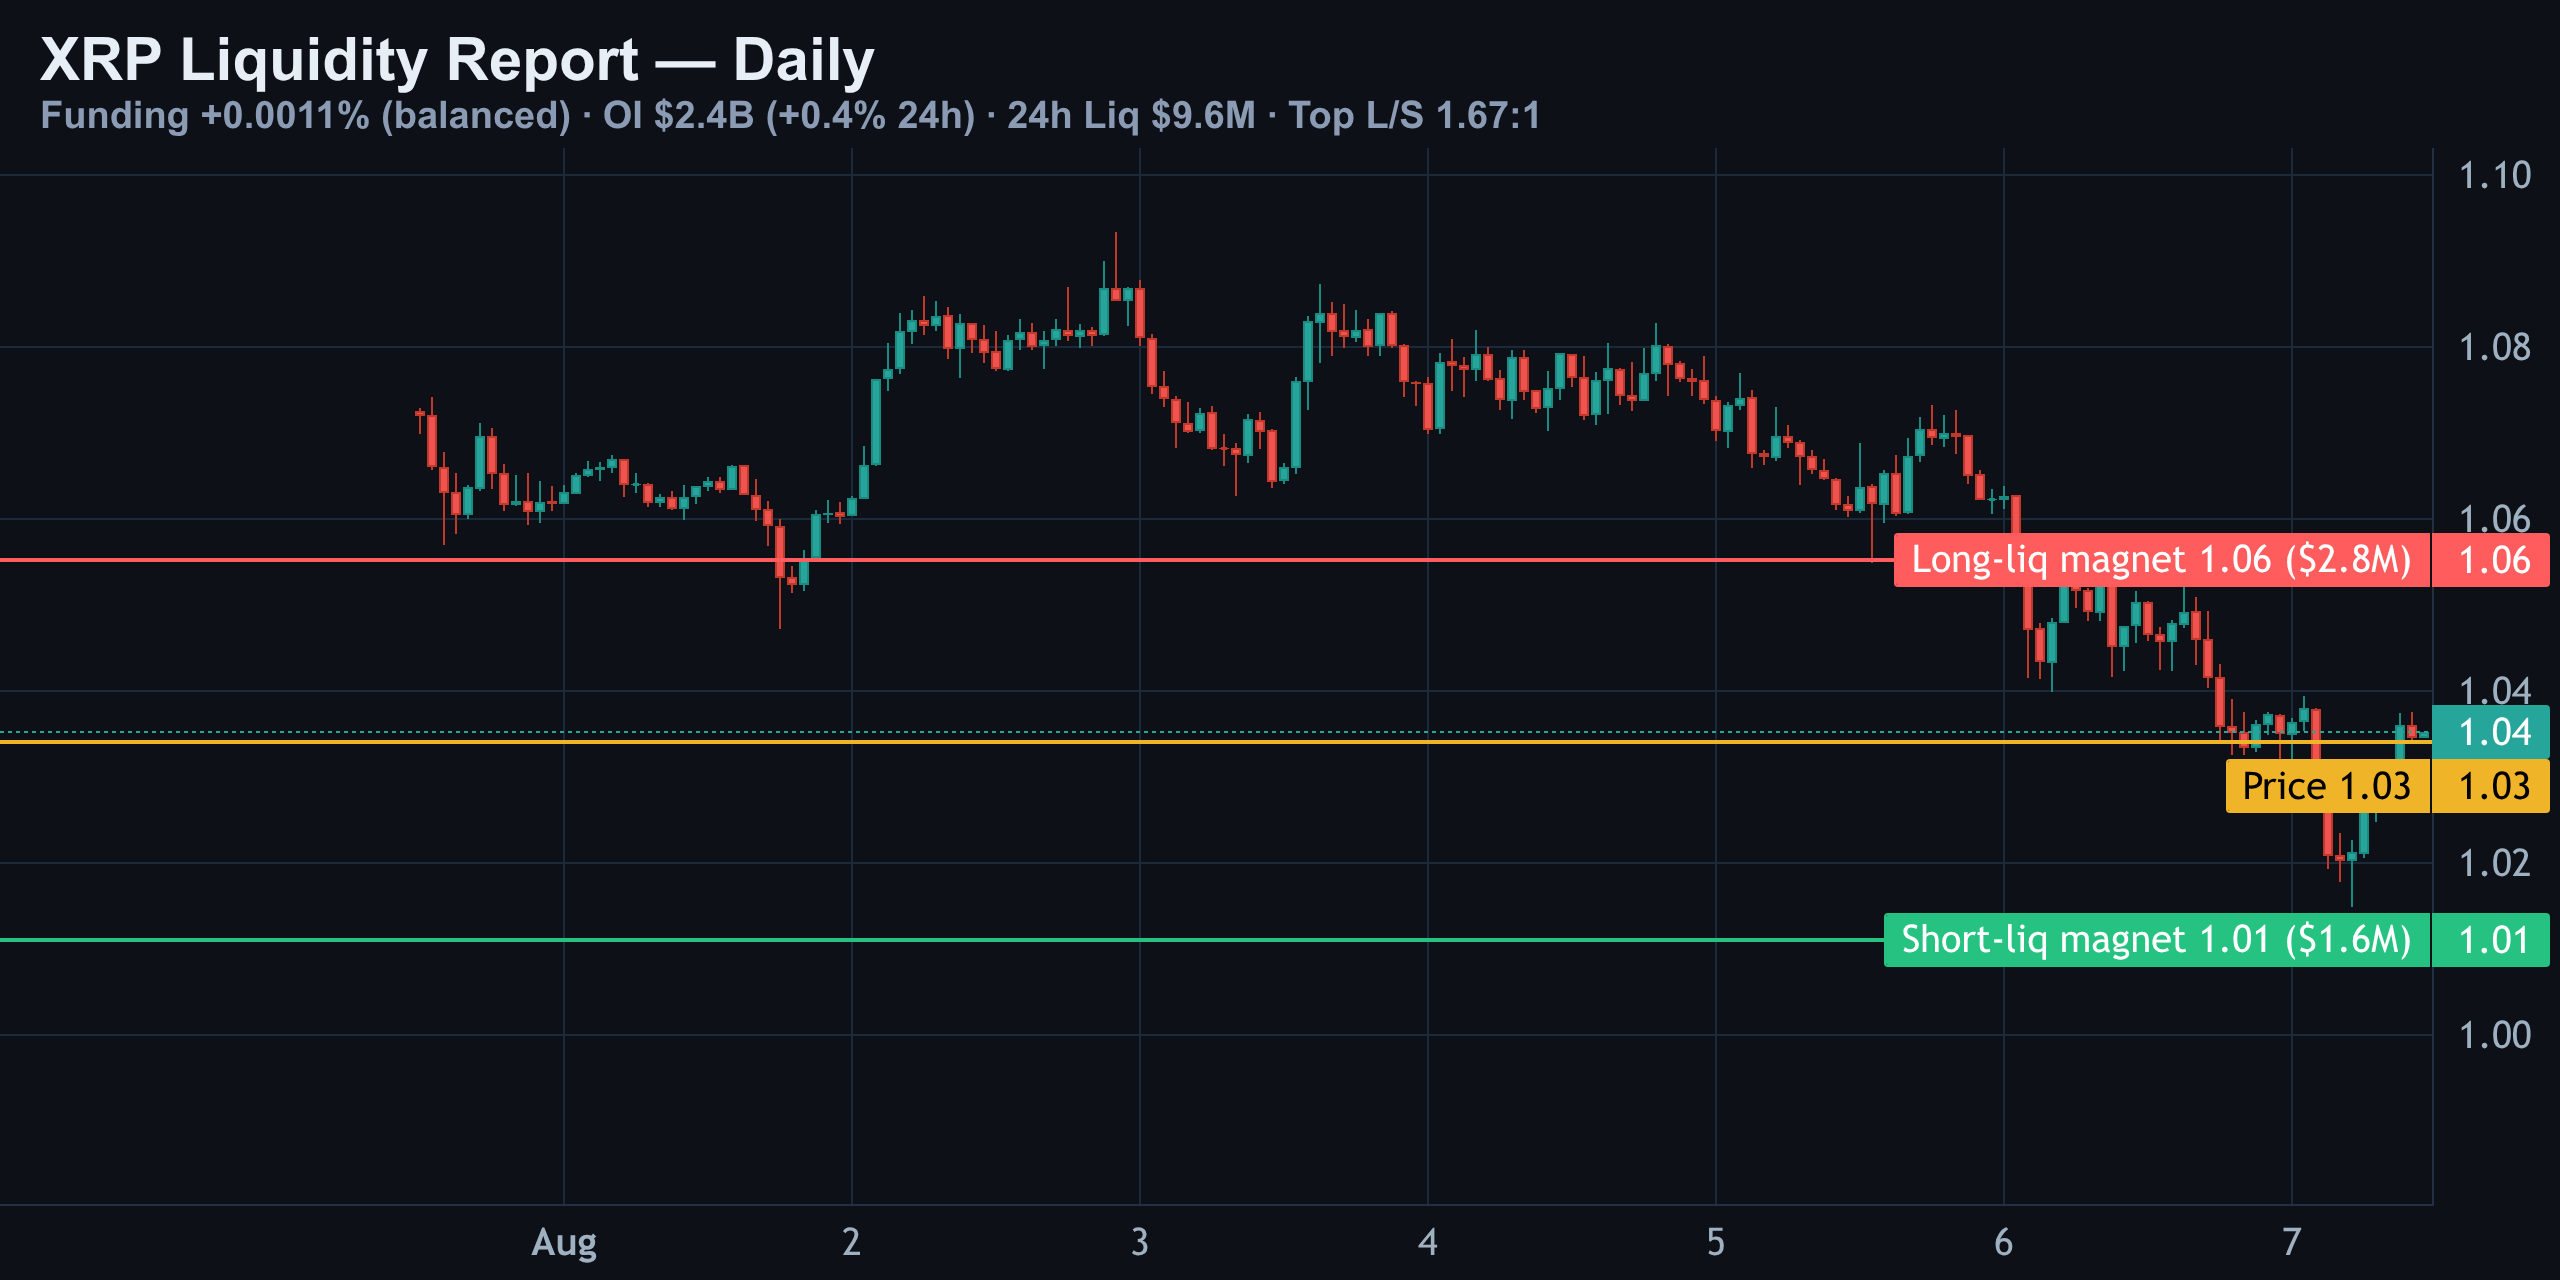
The two colored bands on the chart aren't arbitrary. The red zone at $1.06 marks $2.8 million of long-side leverage that stacked during the midweek highs — that supply is now overhead and gets hunted on any bounce attempt. The green zone at $1.01 marks $1.6 million of short-side stops resting just below current price. With XRP sitting only a couple of cents above that green line, it's the level to watch first.
Do Funding, Open Interest and Liquidations Agree?
Score it out of ten and today lands at a 4 — deliberately unconvincing, because the data disagrees with itself. Funding is essentially flat at +0.0011% (annualized to roughly 1.3%), which tells you there's no crowded side paying a toll to stay positioned. On its own, funding is a non-event today.
Open interest is the more telling piece. It's up 0.39% on the day to $2.4 billion while price is falling — and that combination matters. There are four ways OI and price can move together, and only one of them is happening right now:
- OI up + price up → new longs building a real trend
- OI up + price down → new shorts pressing into weakness (today's setup)
- OI down + price up → short covering, a squeeze that tends to fade
- OI down + price down → long capitulation, exhaustion
We're in the second bucket. Fresh short interest is entering as price drops, which is more durable selling pressure than a simple stop-run — sellers are adding size, not just riding an existing position.
The liquidation tape backs this up loudly. Total liquidations over 24 hours hit $9.6 million across 1,718 orders, and 97% of that — $9.3 million — came from the long side. That mirrors past long-liquidation events on this asset, where a single move wiped tens of millions in long positions in hours once key supports gave way. It's the previous wave of longs, likely built during the midweek push toward $1.08–$1.09, getting forcibly closed as price rolled over.
The Crowd vs the Top Traders: A Real Divergence
Here's where the leverage split gets genuinely interesting. The broader crowd's long/short ratio is 0.90:1 — meaning retail accounts are now, on balance, slightly net short. That's a market where the average trader chased the move down after getting burned going long into the top.
But top-trader positioning — position-weighted, not headcount-weighted — sits at 1.67:1 long. The largest accounts on the desk did not flip short after the drop; they're still leaning long into weakness. That single divergence is the reason this isn't a clean sell signal. It's a genuine fight between two cohorts of traders.
| Metric | Reading | Signal |
|---|---|---|
| Funding rate | +0.0011% (≈1.3% annualized) | Neutral |
| Open Interest | $2.4B, +0.39% on the day | Bearish (new shorts) |
| 24h Liquidations | $9.6M total, 97% long-side | Bearish (longs punished) |
| Crowd Long/Short Ratio | 0.90:1 (net short) | Bearish |
| Top Trader Long/Short Ratio | 1.67:1 (net long) | Bullish divergence |
This kind of split matters because it separates who is currently being forced out of the market from who is choosing to stay in it. It doesn't guarantee a bounce, but it does tell you the money with the largest average position size isn't capitulating alongside retail.
Where the Liquidation Magnets Sit
The magnets on the chart are essentially maps of where forced closures are waiting to happen. Above price, the $1.06 long-liq magnet holds $2.8 million in exposure — already tested and broken once this week, which is exactly why it's now acting as resistance rather than support. Below price, the $1.01 short-liq magnet holds $1.6 million, sitting just beneath where XRP trades right now.
| Level | Type | Size | Status |
|---|---|---|---|
| $1.06 | Long-liq magnet | $2.8M | Broken, now overhead supply |
| $1.03–$1.02 | Current price zone | — | Between magnets |
| $1.01 | Short-liq magnet | $1.6M | Untested, just below price |
If $1.01 breaks, that short pool gets swept, which typically accelerates the move lower rather than slowing it down — liquidation cascades feed on themselves. Some analysts are already flagging XRP's well-documented seasonal weakness: the asset has closed lower in August for four straight years, and a repeat of that pattern could open the door toward the $0.88–$0.90 region if support keeps failing. On the flip side, a reclaim of $1.06 would force short covering into that stacked long-liq zone, which is exactly the kind of squeeze that can move price fast in the other direction.
What This Leverage Split Actually Means for Traders
Put the pieces together and the picture is one of tension, not consensus. Funding gives you nothing. Rising open interest into falling price is a bearish tell. The liquidation tape confirms longs have already been punished hard this week. That's three bearish votes in a row from the flow data.
But the fourth piece — top-trader positioning at 1.67:1 long against a retail crowd that's now net short at 0.90:1 — is the wildcard. Larger accounts didn't chase the sell-off; they held their long exposure through the drop. That's not proof of an imminent reversal, but it's a meaningful signal that the smart-money cohort isn't reading this dip the same way retail is.
Context matters too. XRP's open interest had touched a six-month low just before this recent leg down, alongside ETF-inflow chatter and weakening near-term momentum — meaning some of today's fresh short interest may be new capital re-entering the market rather than existing large positions flipping bearish. That distinction changes how durable this pressure is likely to be.
Summary: A Split Market, Not a Clean Signal
XRP's leverage picture on August 7 is genuinely split. Longs have bled — 97% of today's liquidations came from that side, and the crowd has flipped net short. Open interest rising into a falling price says fresh short conviction, not exhaustion. Yet top traders, weighted by size, are still sitting at 1.67:1 long, refusing to capitulate alongside the broader market.
The chart above lays out the battlefield clearly: $1.06 above as broken resistance loaded with $2.8 million in long liquidations, and $1.01 below as the next magnet holding $1.6 million in short stops. Whichever level breaks first likely dictates the next fast move, given how thin the buffer is on both sides right now.
This is exactly the kind of setup where following price alone, without checking funding, OI and positioning together, would give you an incomplete story. Score it a 4 out of 10 — not because nothing is happening, but because two credible signals are pointing in opposite directions at the same time.
08/04/2026 — XRP Leverage Check: Shorts Squeezed, Whales Stay Long
XRP Leverage Check: Shorts Squeezed, Whales Stay Long
XRP Is Range-Bound at $1.07 — But the Leverage Underneath Isn't Calm
XRP is trading right around $1.07 as of this writing, having spent the past 24 hours ping-ponging between roughly $1.05 and $1.09. Yahoo Finance's daily print shows XRP opening near $1.0605 and probing as high as $1.0900 before settling back into the mid-range, and Binance's own short-term model puts XRP at $1.08 by the end of this week — basically pinned to where it's already trading. That's not a trend. That's a leverage-driven range, and the derivatives data explains exactly why price keeps stalling at the same two levels.
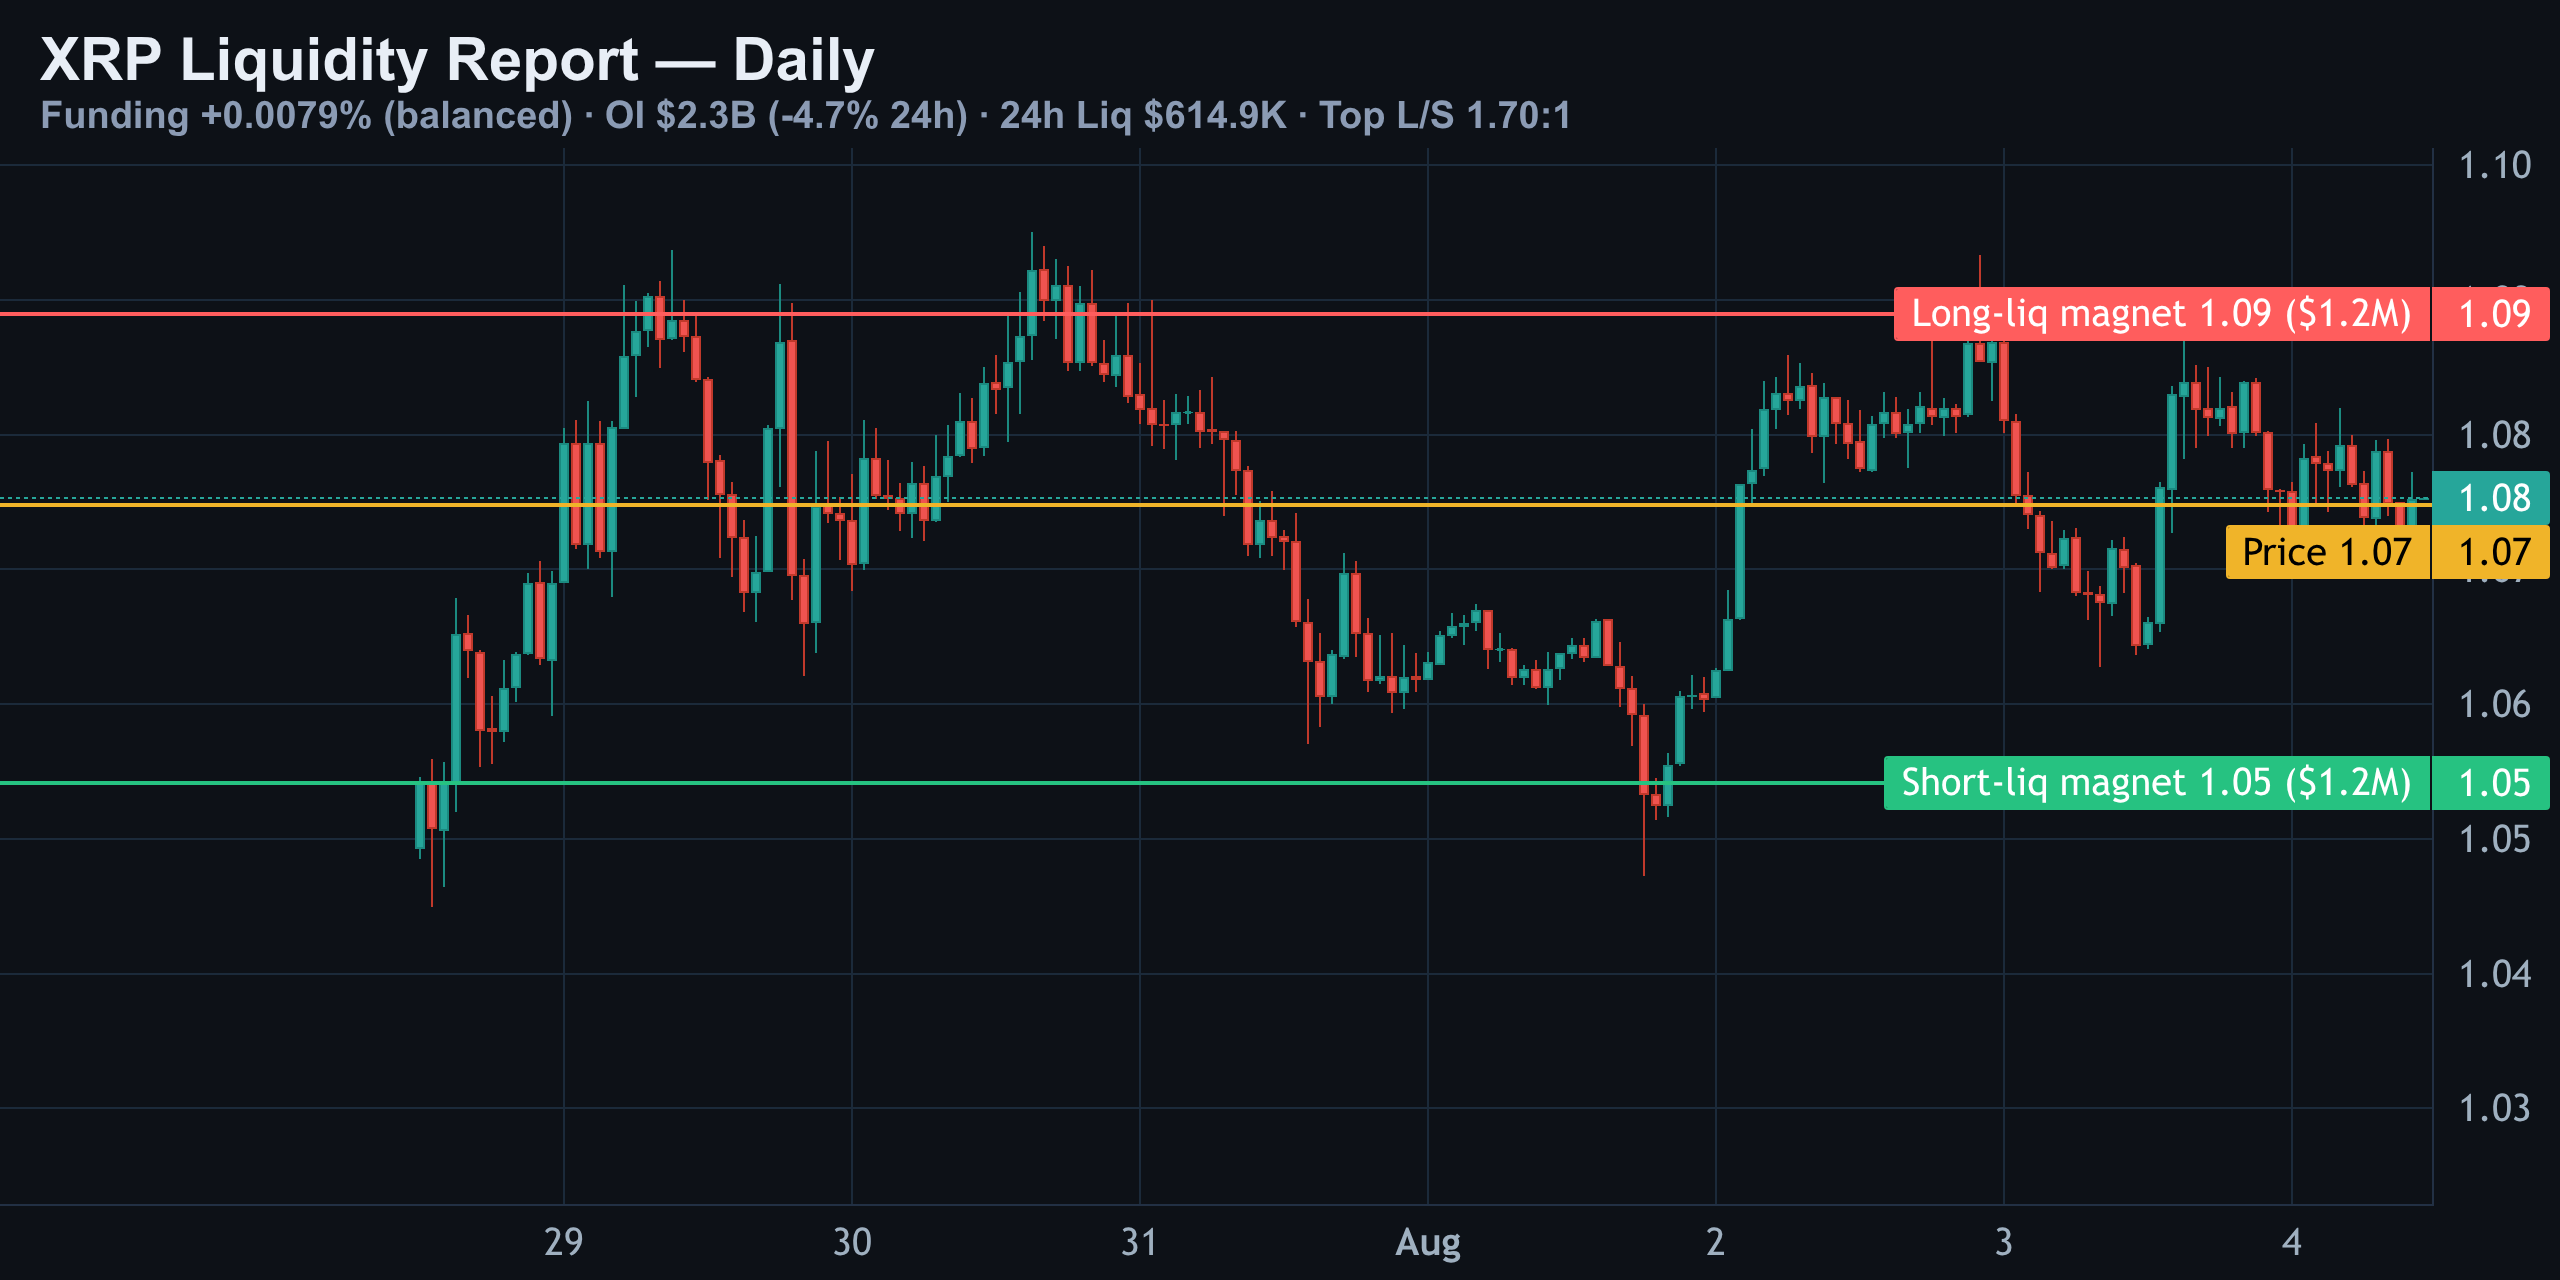
Zoom into the candles and the pattern is obvious: a sharp rally toward the top of the range, a fade back to the middle, another push near $1.09, and now a settle back at $1.07 — right under the $1.08 pivot that multiple price models are also flagging as the week's magnetic level,. Two colored liquidity bands explain the bounce points, and they're the whole story for this cycle.
Funding Is Dead Flat — There's No Crowded Trade to Punish
Start with funding, because it sets the baseline for everything else. XRP funding is printing +0.0079% per 8 hours, which annualizes to roughly 8.7% — close to nothing in crypto derivatives terms.
Flat funding means neither side is paying a toll to stay positioned. Longs aren't overcrowded and overpaying, shorts aren't desperate either. That also means there's no obvious squeeze fuel sitting on either side of the tape right now — which is rarer than it sounds, and it's the reason this range has felt so directionless even as price tests both extremes repeatedly.
Open Interest Just Dropped 4.65% — That's Short Covering, Not New Demand
This is the more important signal. Open interest sits at $2.3 billion, but it just fell 4.65% in 24 hours — and that drop happened while price was pushing up through the range toward $1.09.
When open interest falls while price rises, that combination has one dominant explanation: short positions are being closed, not new long positions being opened. The rally toward $1.09 wasn't built on fresh conviction — it was built by shorts running for the exit. That matters for what comes next, because covering-driven rallies are structurally weaker than demand-driven ones. Once the shorts who needed to cover have covered, the buying pressure that pushed price up disappears with them — unless real spot demand steps in to replace it.
| Metric | Value | Read |
|---|---|---|
| Price | ~$1.07 | Mid-range, under $1.08 pivot |
| Funding Rate (8h) | +0.0079% | Flat, ~8.7% annualized |
| Open Interest | $2.3B | Down 4.65% in 24h |
| 24h Liquidations | $614.9K / 339 orders | Shorts hit harder |
The Liquidation Tape Confirms It: Shorts Paid More Than Longs
Of the $614,900 liquidated across 339 orders in the last 24 hours, $343,300 came from shorts against $271,600 from longs. Shorts were more offside than longs — consistent with a squeeze that pushed price up through their stop levels.
That's exactly the kind of move that tends to stall once it's done its job. A short squeeze clears out weak-handed sellers and creates a sharp burst higher, but it doesn't automatically create the follow-through buying needed to sustain a new leg. The market now needs a genuinely new driver — either fresh long positioning or spot accumulation — if $1.09 is going to break cleanly rather than get rejected again.
| Side | Liquidated (24h) | Share of Total |
|---|---|---|
| Shorts | $343,300 | 55.8% |
| Longs | $271,600 | 44.2% |
| Total | $614,900 | 339 orders |
The Two Magnets: $1.2M in Longs at $1.09, $1.2M in Shorts at $1.05
Above current price, at $1.09, sits $1.2 million in long liquidations — leveraged longs that get force-sold if price tags that level with volume. Below, at $1.05, sits an almost mirror-image pool: $1.2 million in short liquidations.
Price has already tested both extremes multiple times in this window and pulled back each time, which tells you neither pool has been fully cleared yet. That's the technical definition of an actively hunted range — market makers and larger players are using both edges as liquidity to trade against, not letting either side run free.
- If $1.09 breaks with real volume (not just a wick), that long-liq pool gets swept and the path of least resistance opens toward the next cluster of longs above.
- If $1.05 breaks instead, the short pool triggers and you'd expect a fast air-pocket move lower before shorts reload.
- 247WallSt's August model actually expects XRP to spend the month between $1.00 and $1.18, finishing near $1.10 — which lines up almost exactly with these two liquidation magnets acting as the effective monthly range.
The Real Divergence: A Flat Crowd vs. Bullish Whales
Here's the piece that complicates the simple 'shorts covered, the move is over' read: top-trader positioning. The biggest accounts on the board are sitting at 1.70:1 long — meaningfully more bullish than the average retail crowd, which is dead flat at 1.00:1.
When the average trader is undecided but the largest, best-capitalized accounts are stacked long, that's a divergence worth respecting. It doesn't guarantee a breakout, but it does tell you where informed capital is leaning while everyone else waits for confirmation. Prediction-market pricing adds a data point here too: as of this week, bettors were assigning meaningfully higher odds to XRP holding above $1.05 than to it slipping below, broadly consistent with the long-leaning tilt from larger accounts.
| Group | Long/Short Ratio | Lean |
|---|---|---|
| Top traders | 1.70 : 1 | Long |
| Average crowd | 1.00 : 1 | Flat |
Score: 5/10 — A Genuine Split, Not a Hedge
Putting this all together lands at a 5 out of 10 — and that's an honest split, not a cop-out.
- Funding gives you nothing. It's flat, so there's no overcrowded side to punish in either direction right now.
- The open interest drop during the rally is a real caution flag. That's short covering doing the work, not new buyers — and covering-driven moves tend to run out of gas once the short base is drained.
- Top traders sit at 1.70:1 long while the average account is dead flat — informed capital wants upside.
- Two liquidation magnets, one directly above and one below at equal size ($1.2M each), mean the next real move likely comes from whichever pool gets swept first, not from a slow grind.
More on XRP: elliott wave · derivatives · technical analysis
Analysis and education, not investment advice. See our editorial policy.