Daily market analysis
XRP (XRP) elliott wave
Last updated
XRP Elliott Wave: $1.42 Decides the Next Impulse
XRP Elliott Wave: The Market Has Reached a Decision Point
XRP is trading around $1.47, pressing into the important $1.50 resistance wall. The market has already delivered the upside move that looked uncertain in the previous update: from $1.0001 to $1.4714, XRP gained approximately 47.1% in four days.
The earlier recovery question was whether XRP could reclaim $1.01. It did more than reclaim it. Price reached the previous upside objectives at $1.026, $1.048 and $1.066, forcing the Elliott Wave count to be refined rather than simply carried forward.
The new conflict is straightforward. A sustained reclaim of $1.50 would support the bullish continuation count, with $1.63 as the first major objective and $1.70 as the next potential extension. A decisive loss of $1.42 would invalidate the current primary count and increase the probability of a deeper correction.
| Level | Role | What it means |
|---|---|---|
| $1.70 | Higher resistance | Potential continuation target |
| $1.63 | Primary target | Completion or extension of the next impulse |
| $1.50 | Confirmation level | Reclaim supports bullish continuation |
| $1.47 | Current area | XRP is pressing into resistance |
| $1.42 | Decision and invalidation level | Holding supports the primary count; losing it invalidates the long setup |
| $1.34 | Lower structural objective | First major target if the bearish alternate develops |
4H Elliott Wave Structure: Bullish, but Not Blindly Bullish
The four-hour chart provides the higher-degree framework. Its authoritative swing sequence is the high at $1.16, the low at $0.9862, the rally to $1.70 and the latest major low at $1.42. That high-low-high-low sequence is more useful than relying on every automatic label printed by charting software.
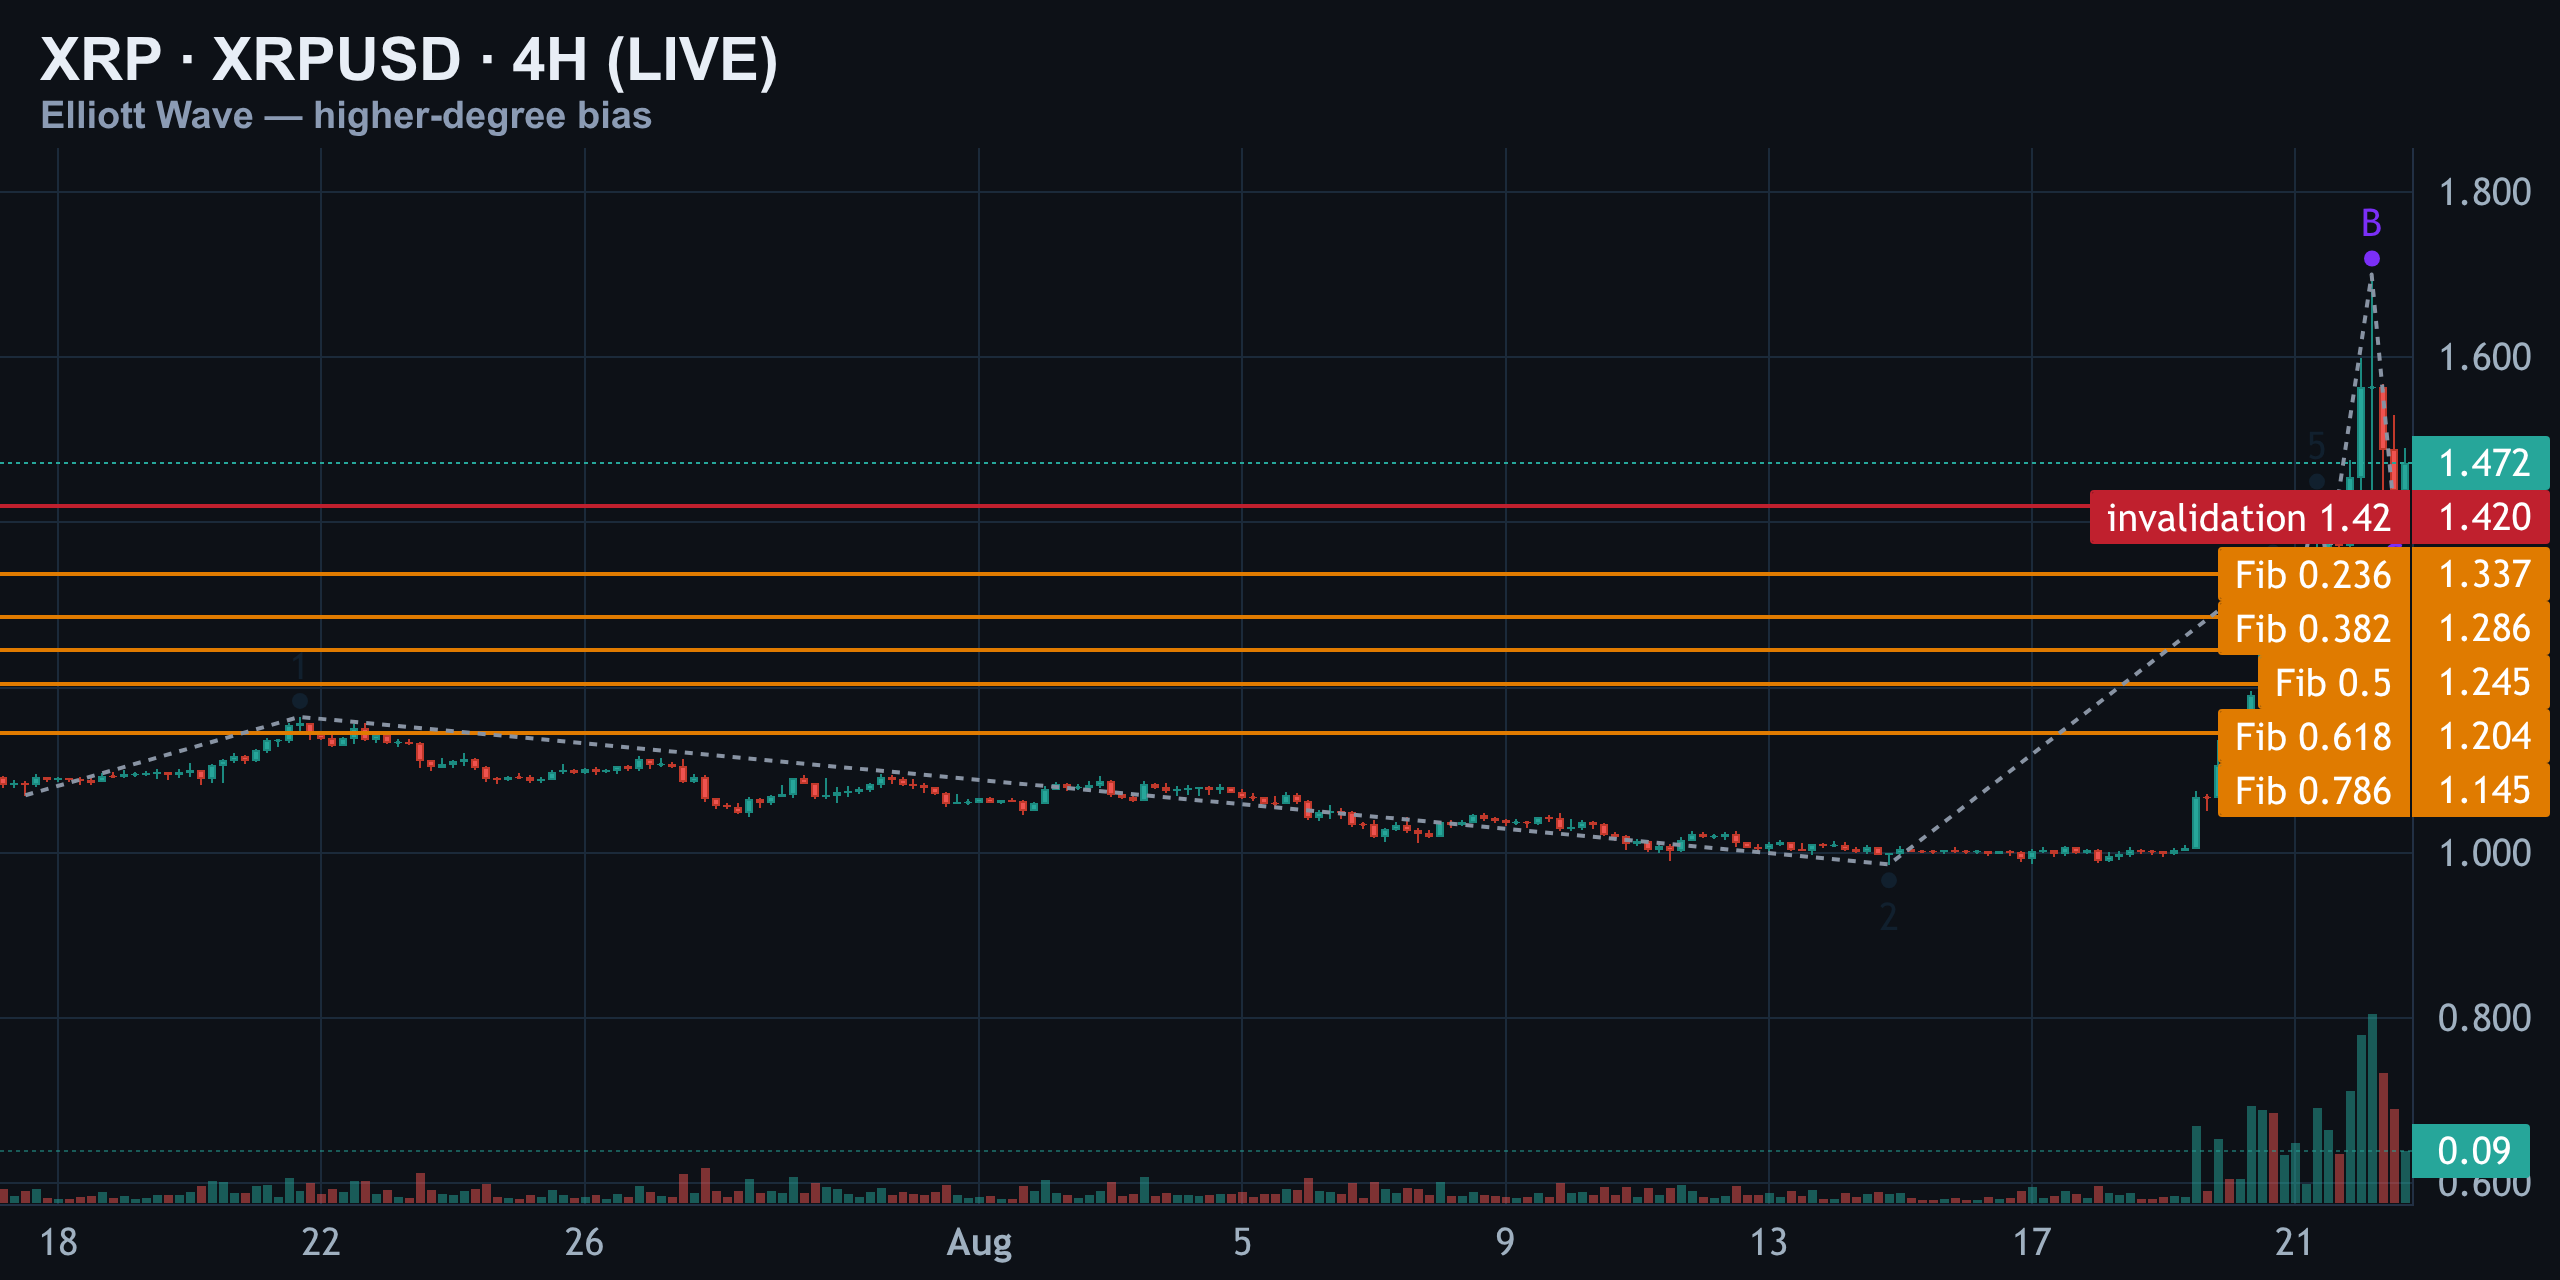
The automatic labels identify the move from $1.16 through $0.9862, $1.34, $1.23 and $1.43 as an impulse. That interpretation cannot be accepted without qualification. Wave two retraced more than 100% of wave one, which violates a hard Elliott Wave rule. This is not a minor labeling imperfection; it lowers the probability of that impulse interpretation.
The alternative structural reading focuses on the correction from $1.43 to $1.35, the rally to $1.70 and the decline to $1.42. The B-wave expanded to 4.26 times the A-wave, while the C-wave reached 3.38 times the A-wave. Those proportions are more consistent with expanded-flat or irregular-correction territory than with a clean impulse.
The four-hour Fibonacci swing from $1.07 to $1.42 places the 0.618 retracement near $1.204. XRP is now well above that area. This suggests the larger correction may already have completed at $1.42, although the structure that follows remains young and therefore conditional.
The resulting four-hour bias is cautiously bullish above $1.42. The completed-correction interpretation gives the bulls a credible foundation, but the earlier rule-broken impulse warns against treating the chart as a certainty. The one-hour structure is where the competing interpretations become more actionable.
1H Primary Count and the Three Scenarios
The primary one-hour count begins at $1.34, pulls back to $1.22, rallies in wave three to $1.70, corrects to $1.52 in wave four and then reaches $1.63 in wave five. This impulse skeleton passes the main hard rules: wave two does not fully retrace wave one, wave three is not the shortest wave and wave four does not overlap wave one.
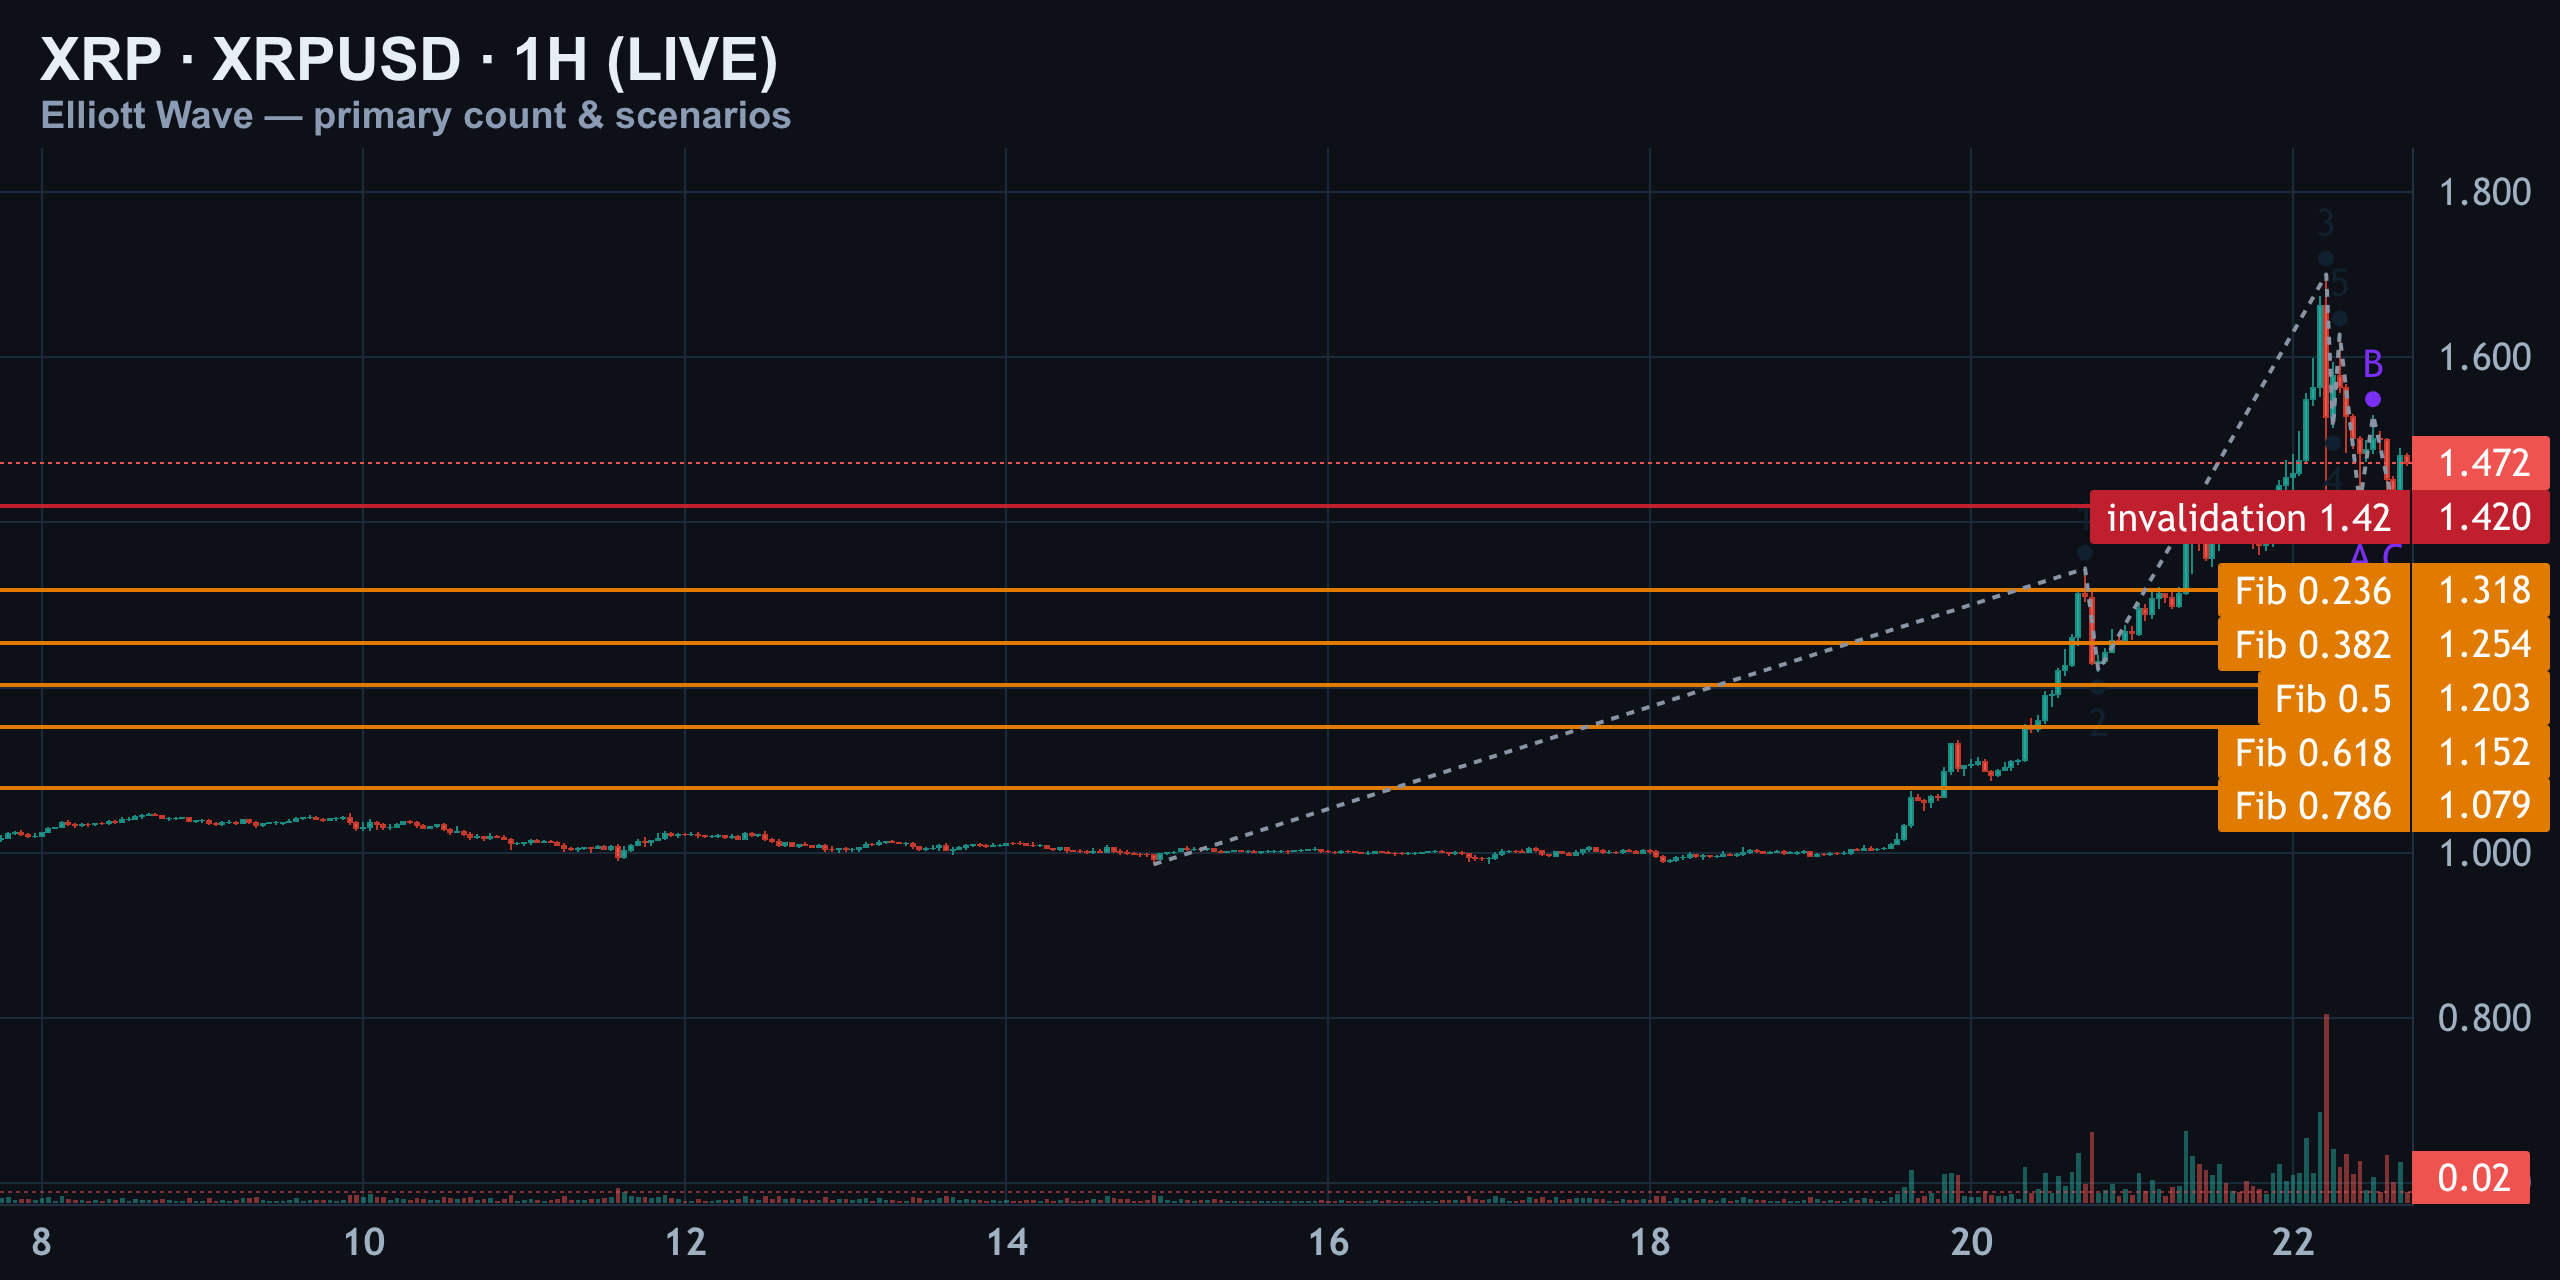
Following the $1.63 high, the correction moved down to an A-wave at $1.42, up to a B-wave at $1.53 and back to $1.42 in the C-wave. The B-wave measured approximately 0.52 of the A-wave, while the C-wave measured approximately 0.54. That compact relationship, combined with the double tag at $1.42, creates a clear decision floor.
Scenario one: bullish continuation
The primary scenario is that the C-wave completed at $1.42 and XRP is beginning a fresh impulsive advance. A reclaim of $1.50 would give this interpretation priority. The projected path is first toward $1.63 and then potentially toward $1.70.
Scenario two: expanded-flat continuation lower
If $1.42 breaks, the correction is probably not complete. An expanded-flat continuation would then become more likely, with $1.34 as the first major structural objective. A recovery through $1.50 would invalidate this bearish alternate.
Scenario three: sideways or complex correction
If $1.42 holds but $1.50 repeatedly rejects price, XRP may be developing a sideways triangle or another complex correction. In that case, the market remains neutral inside the $1.42 to $1.50 range until one boundary breaks decisively.
| Scenario | Trigger | Likely implication |
|---|---|---|
| Bullish primary | Reclaim and hold $1.50 | Continuation toward $1.63, then potentially $1.70 |
| Bearish alternate | Break below $1.42 | Correction extends toward $1.34 |
| Sideways alternate | $1.42 holds but $1.50 rejects | Range or triangle develops between both boundaries |
15M Entry Trigger: Confirmation, Not Prediction
The 15-minute chart is useful for timing, but it should not override the higher-timeframe thesis. Its local sequence runs from $1.34 to $1.22, then to the sharp wave-three high at $1.70. The local wave-four low is $1.44, followed by wave five at $1.63. The subsequent A-B-C correction returned to $1.42.
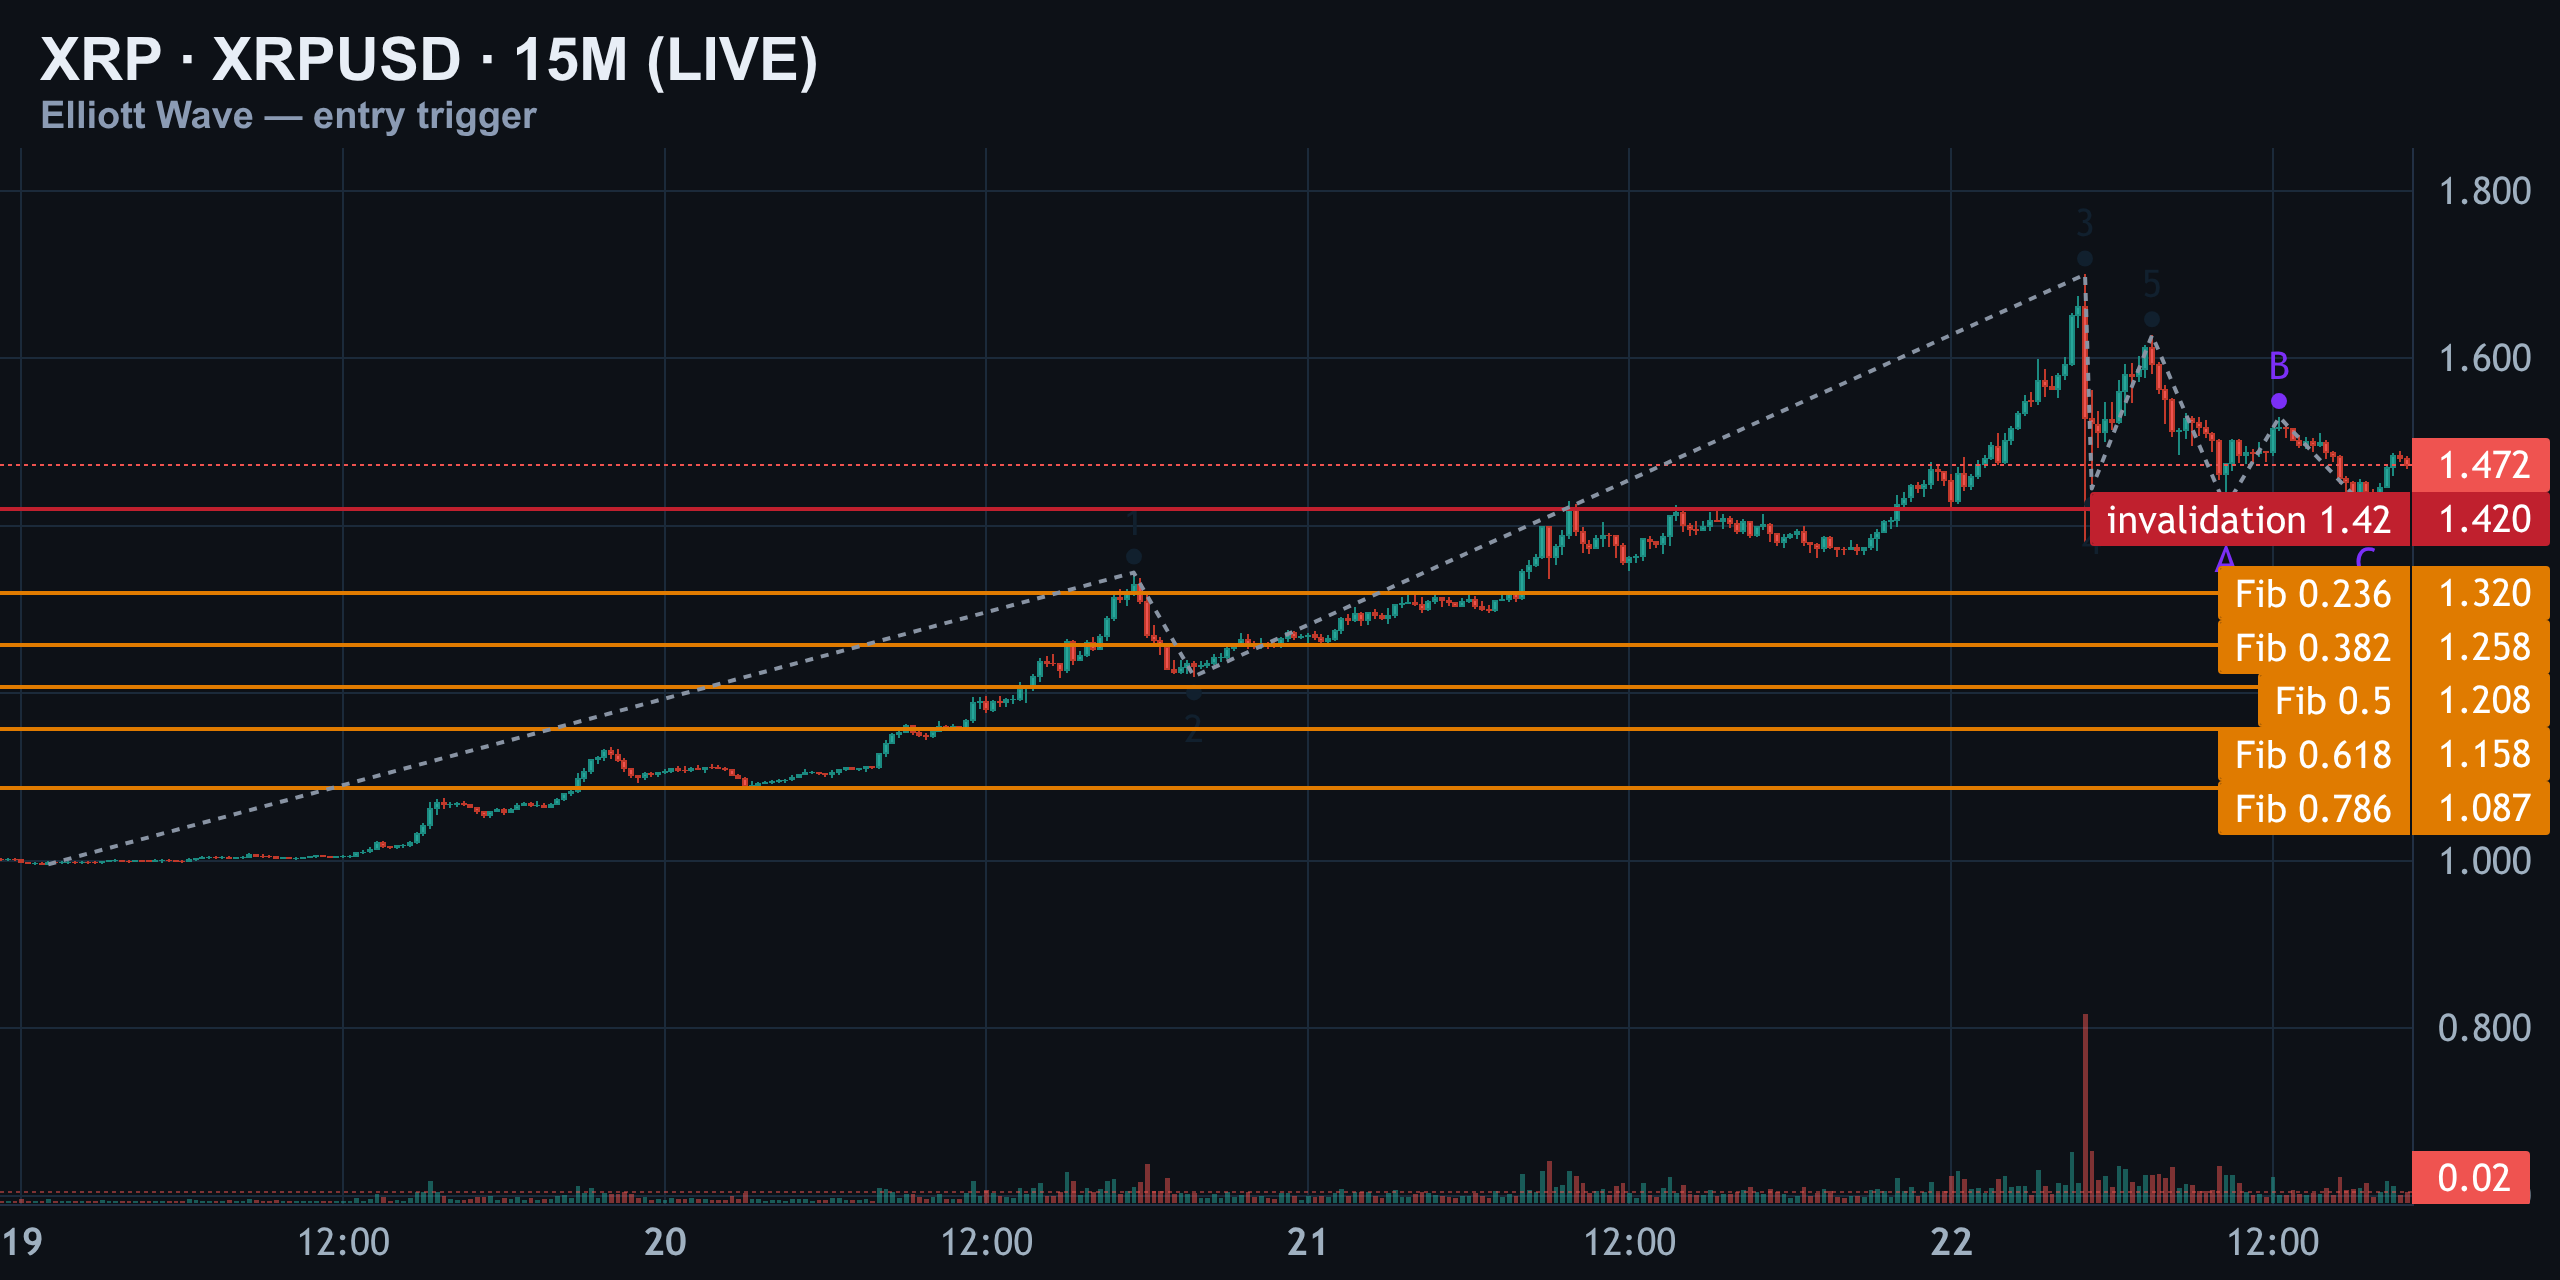
The local impulse passes the hard rules. Wave two retraced approximately 0.356, wave three reached about 1.38 times wave one and wave four retraced approximately 0.53. However, the deep wave-four pullback introduces an alternation and degree question. It does not invalidate the skeleton, but it reduces confidence in an immediate, perfectly clean launch.
The earlier 15-minute Fibonacci swing from $0.9959 to $1.42 places the 0.618 retracement near $1.158. That is no longer an entry zone. Instead, it illustrates how far XRP has extended from its earlier base and why chasing a vertical move at resistance can create poor risk-reward.
- Wait for XRP to reclaim $1.50 rather than assuming the breakout will occur.
- Look for price to hold $1.50 during a retest, preferably with improving momentum and participation.
- Treat a failure back below $1.50 as a warning that the corrective range remains active.
- Treat a break below $1.42 as invalidation of the long setup.
Positioning and Liquidation Clusters: The Edge Behind the Chart
Elliott Wave structure explains where XRP may be in its sequence, but positioning and order flow help explain how price could travel between the levels. Liquidation clusters can act as short-term magnets because leveraged traders are forced to close when price reaches their thresholds.
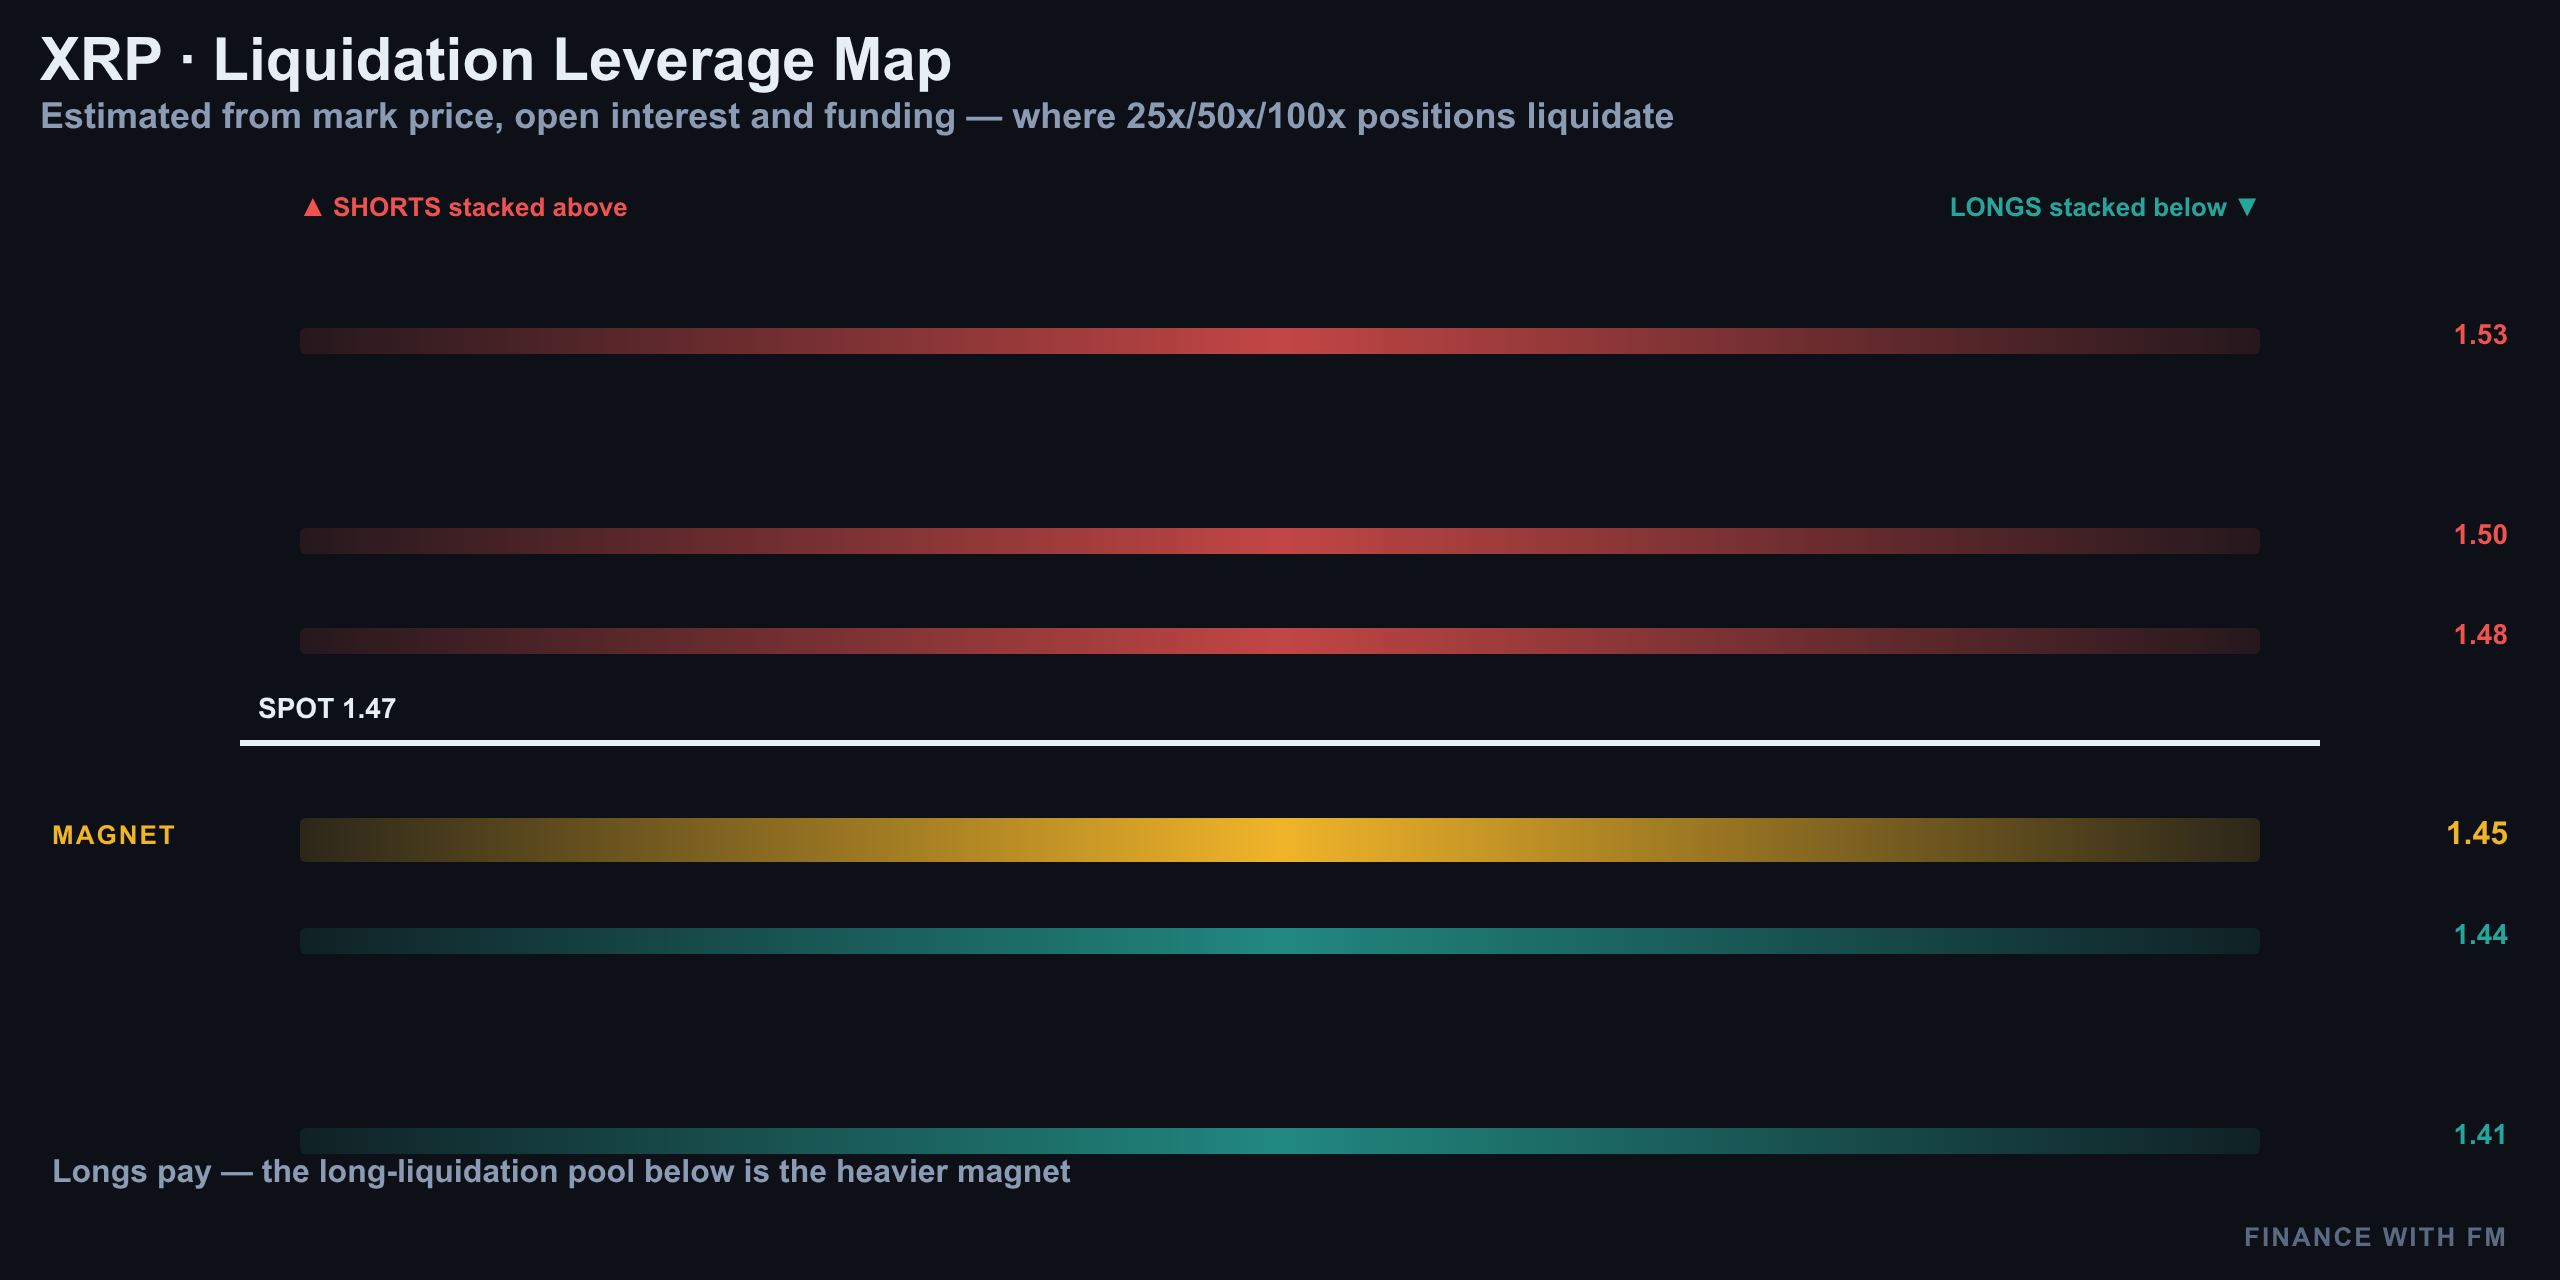
Near resistance, a reclaim of $1.50 could trigger short liquidations and provide the fuel for a faster move toward $1.63. That does not guarantee the bullish count, but it can make a genuine breakout more explosive than the initial candle suggests.
The opposite risk sits beneath $1.42. If many leveraged longs are positioned around the recent floor, a break of that level could create a liquidation cascade toward $1.34. In that environment, the first move below support may travel further and faster than a spot-market chart alone would imply.
Structure and positioning agree when a $1.50 breakout is accompanied by expanding participation and short liquidations, or when a $1.42 breakdown is accompanied by long liquidations. They disagree when price briefly pierces a level but quickly returns to the range. That type of move is more consistent with a liquidity sweep than with confirmed trend continuation.
- Bullish alignment: acceptance above $1.50, stronger momentum and short liquidations above resistance.
- Bearish alignment: loss of $1.42, expanding downside momentum and long liquidations below support.
- Neutral warning: isolated wicks through either boundary followed by a rapid reclaim.
Levels, Targets and a Count-Based Setup
The cleanest way to approach this XRP Elliott Wave setup is to define the condition first and the target second. The primary count does not call for blindly buying the current price. It calls for waiting to see whether XRP can convert $1.50 from resistance into support while $1.42 remains intact.
| Price | Technical role | Primary interpretation |
|---|---|---|
| $1.70 | Major upside reference | Potential extension after $1.63 |
| $1.63 | First bullish objective | Next impulse target |
| $1.50 | Breakout confirmation | Bullish momentum earns priority above this level |
| $1.42 | Structural floor | Primary count remains viable above it |
| $1.34 | Bearish objective | First downside target after invalidation |
| $1.204 | 4H 0.618 reference | Retracement reference from the $1.07 to $1.42 swing |
| $1.158 | 15M 0.618 reference | Historical extension reference, not an immediate entry zone |
The setup per the count, not advice
A bullish setup would require a confirmed reclaim of $1.50 and a hold on retest, with risk defined against the structure rather than against emotion. The first upside reference is $1.63, followed by $1.70. If XRP cannot reclaim $1.50, patience is preferable to forcing an entry inside a corrective range.
A break below $1.42 ends the long setup based on this count. The next structural reference would be $1.34, but that level is a scenario objective, not a guarantee. Traders should also account for volatility, slippage, leverage, position size and the possibility that Elliott Wave labels will need to be revised as new price data arrives.
Where XRP Sits in Its Count: Summary
XRP has moved from a recovery question into a confirmation test. The prior invalidation at $0.9862 held, the old objectives were reached and price produced a substantial 47.1% rally. That upside result matters, but it does not remove the need for confirmation at the next resistance.
On the four-hour chart, the bias is cautiously bullish above $1.42. On the one-hour chart, the primary count suggests the correction completed at that same level and that a new impulse may be starting. On the 15-minute chart, the execution trigger is a reclaim and retest of $1.50.
The market therefore has a simple map. Above $1.50, the bullish path toward $1.63 and potentially $1.70 becomes more credible. Between $1.42 and $1.50, XRP is still in a decision range. Below $1.42, the primary count is invalidated and $1.34 becomes the first meaningful downside reference.
- The earlier XRP recovery targets at $1.026, $1.048 and $1.066 were reached.
- $1.42 is now the key structural floor and primary-count invalidation level.
- $1.50 is the momentum confirmation level, not merely another resistance line.
- A confirmed breakout opens $1.63 and potentially $1.70.
- A break below $1.42 favors a deeper correction toward $1.34.
For now, the chart is constructive but conditional. The next impulse is not decided by the size of XRP's recent rally. It is decided by whether buyers can reclaim $1.50 while defending $1.42.
Previous days
08/18/2026 — XRP Broken Impulse: Reclaim $1.01 or Bull-Trap Below $0.9862?
XRP Broken Impulse: Reclaim $1.01 or Bull-Trap Below $0.9862?
XRP Is Stuck at $1.00 — And That's the Whole Story
XRP is trading almost exactly where it was 24 hours ago — right around $1.00, down roughly 0.2% on the day, with 24-hour volume near $880 million. Yahoo Finance's feed shows a nearly identical print, $1.0011, up a fraction of a percent — the kind of split-decision tape that tells you nothing has actually resolved yet.
That stagnation matters because it's happening at the single most important level on the chart. Yesterday's analysis drew a hard invalidation floor at $0.9862, and 24 hours later, that floor hasn't been touched. But this isn't a clean win for the bulls — it's a coin flip that hasn't been called yet. Zoom into the one-hour chart and you'll find wave three coming in shorter than wave one, a structural rule violation that kills the textbook impulse count outright.
The 4H Picture: A Grinding Decline That Never Behaved Like an Impulse
Pull back to the four-hour chart and the bigger picture comes into focus. XRP peaked near $1.16 in late July, and everything since has been one long grinding decline into the current dollar zone. Auto-pivots will happily label that decline waves one through five down to $0.9965, followed by an A-B-C bounce — but the labels don't survive a rule check.
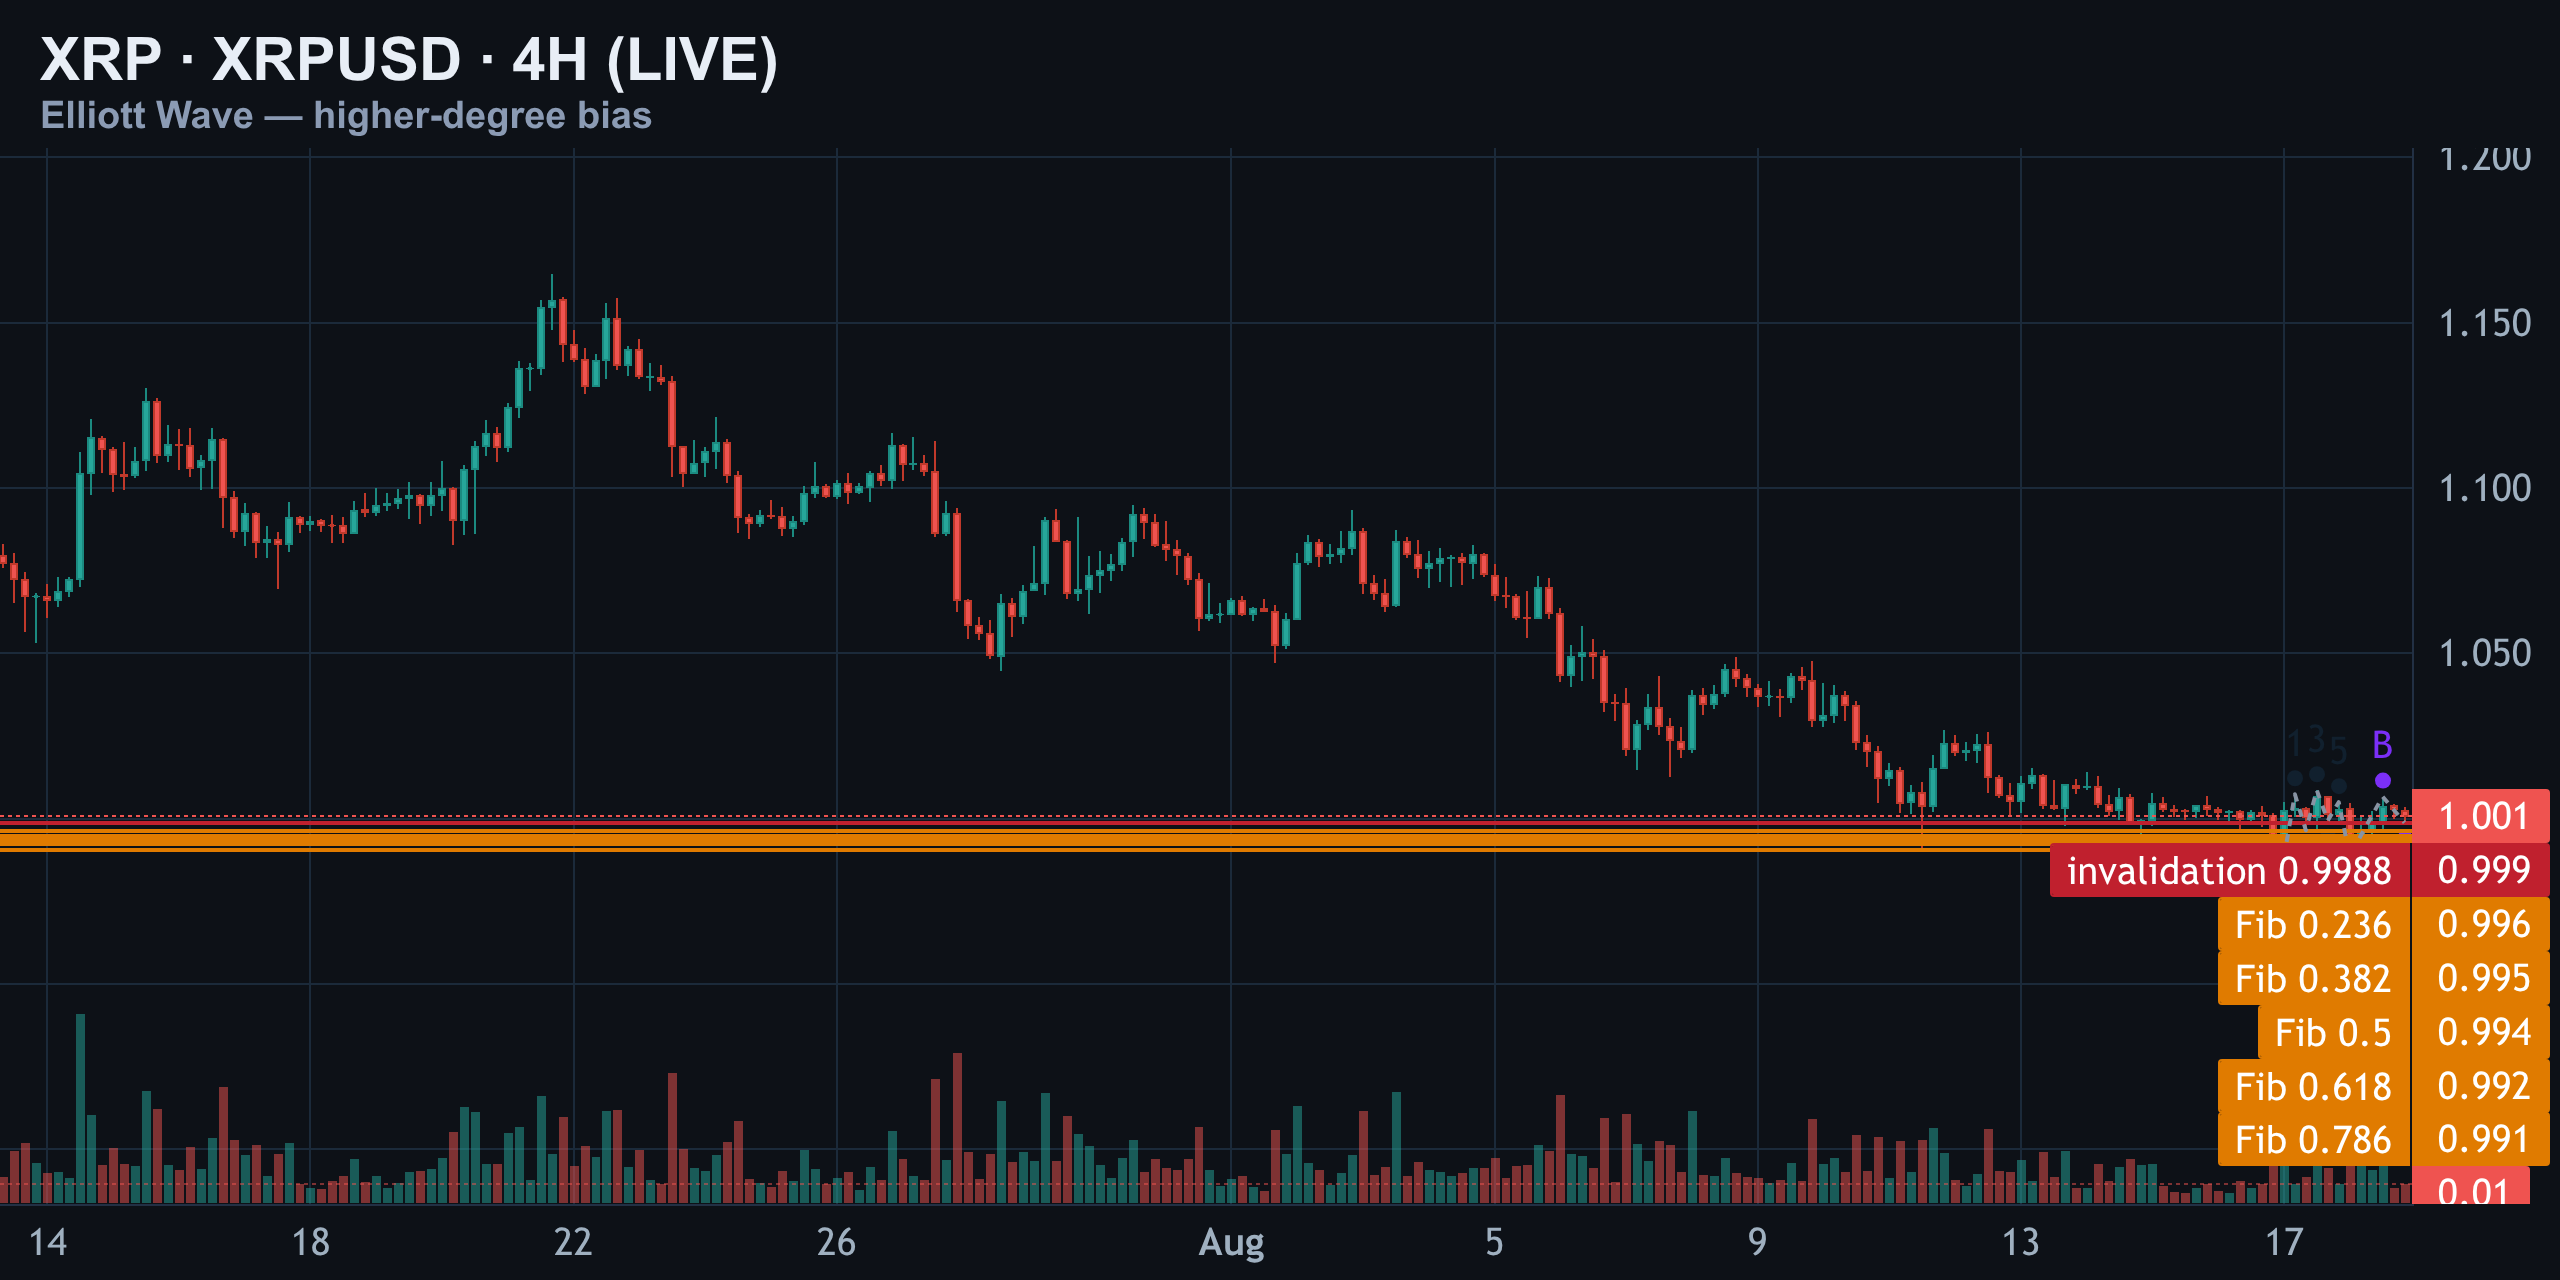
- Wave four dips to $0.9994 — deep inside wave one's territory. In a clean impulse, wave four is never allowed to overlap wave one.
- Wave three measures only 0.63x wave one — undersized for a genuine trending third wave.
- Wave four retraces a deep 76% of wave three, well past the standard 0.618 ceiling.
- The B-wave of the bounce overshoots the A-wave by 10%, and the C-wave is a shallow 49% of A — a classic irregular-flat signature, not a sharp zigzag.
Two rule breaks in the decline, plus an irregular-flat bounce, means this entire swing behaves more like a corrective structure than a textbook five-wave impulse. The whole range lives between $0.9882 and $0.9988, and that upper line is the tentative higher-degree invalidation. Price is currently stamped with a fresh B right at that shelf — meaning the higher-degree structure is still undecided. Either this B-wave rolls into one more C-wave down, or it's the last gasp before a real reclaim.
The 1H Primary Count: Two Paths From One Level
On the one-hour chart, price rallied from wave one near $1.01 up to wave two near $1.04 — a normal-looking pullback. But wave three only reached $1.01, barely poking above wave one's high. That technically makes wave three the shortest wave, a hard rule break for any impulse. Wave four then stretched to $1.05, overlapping wave one outright — a second violation. Two broken rules in one structure means this isn't a real impulse; it reads better as part of a larger flat or triangle.
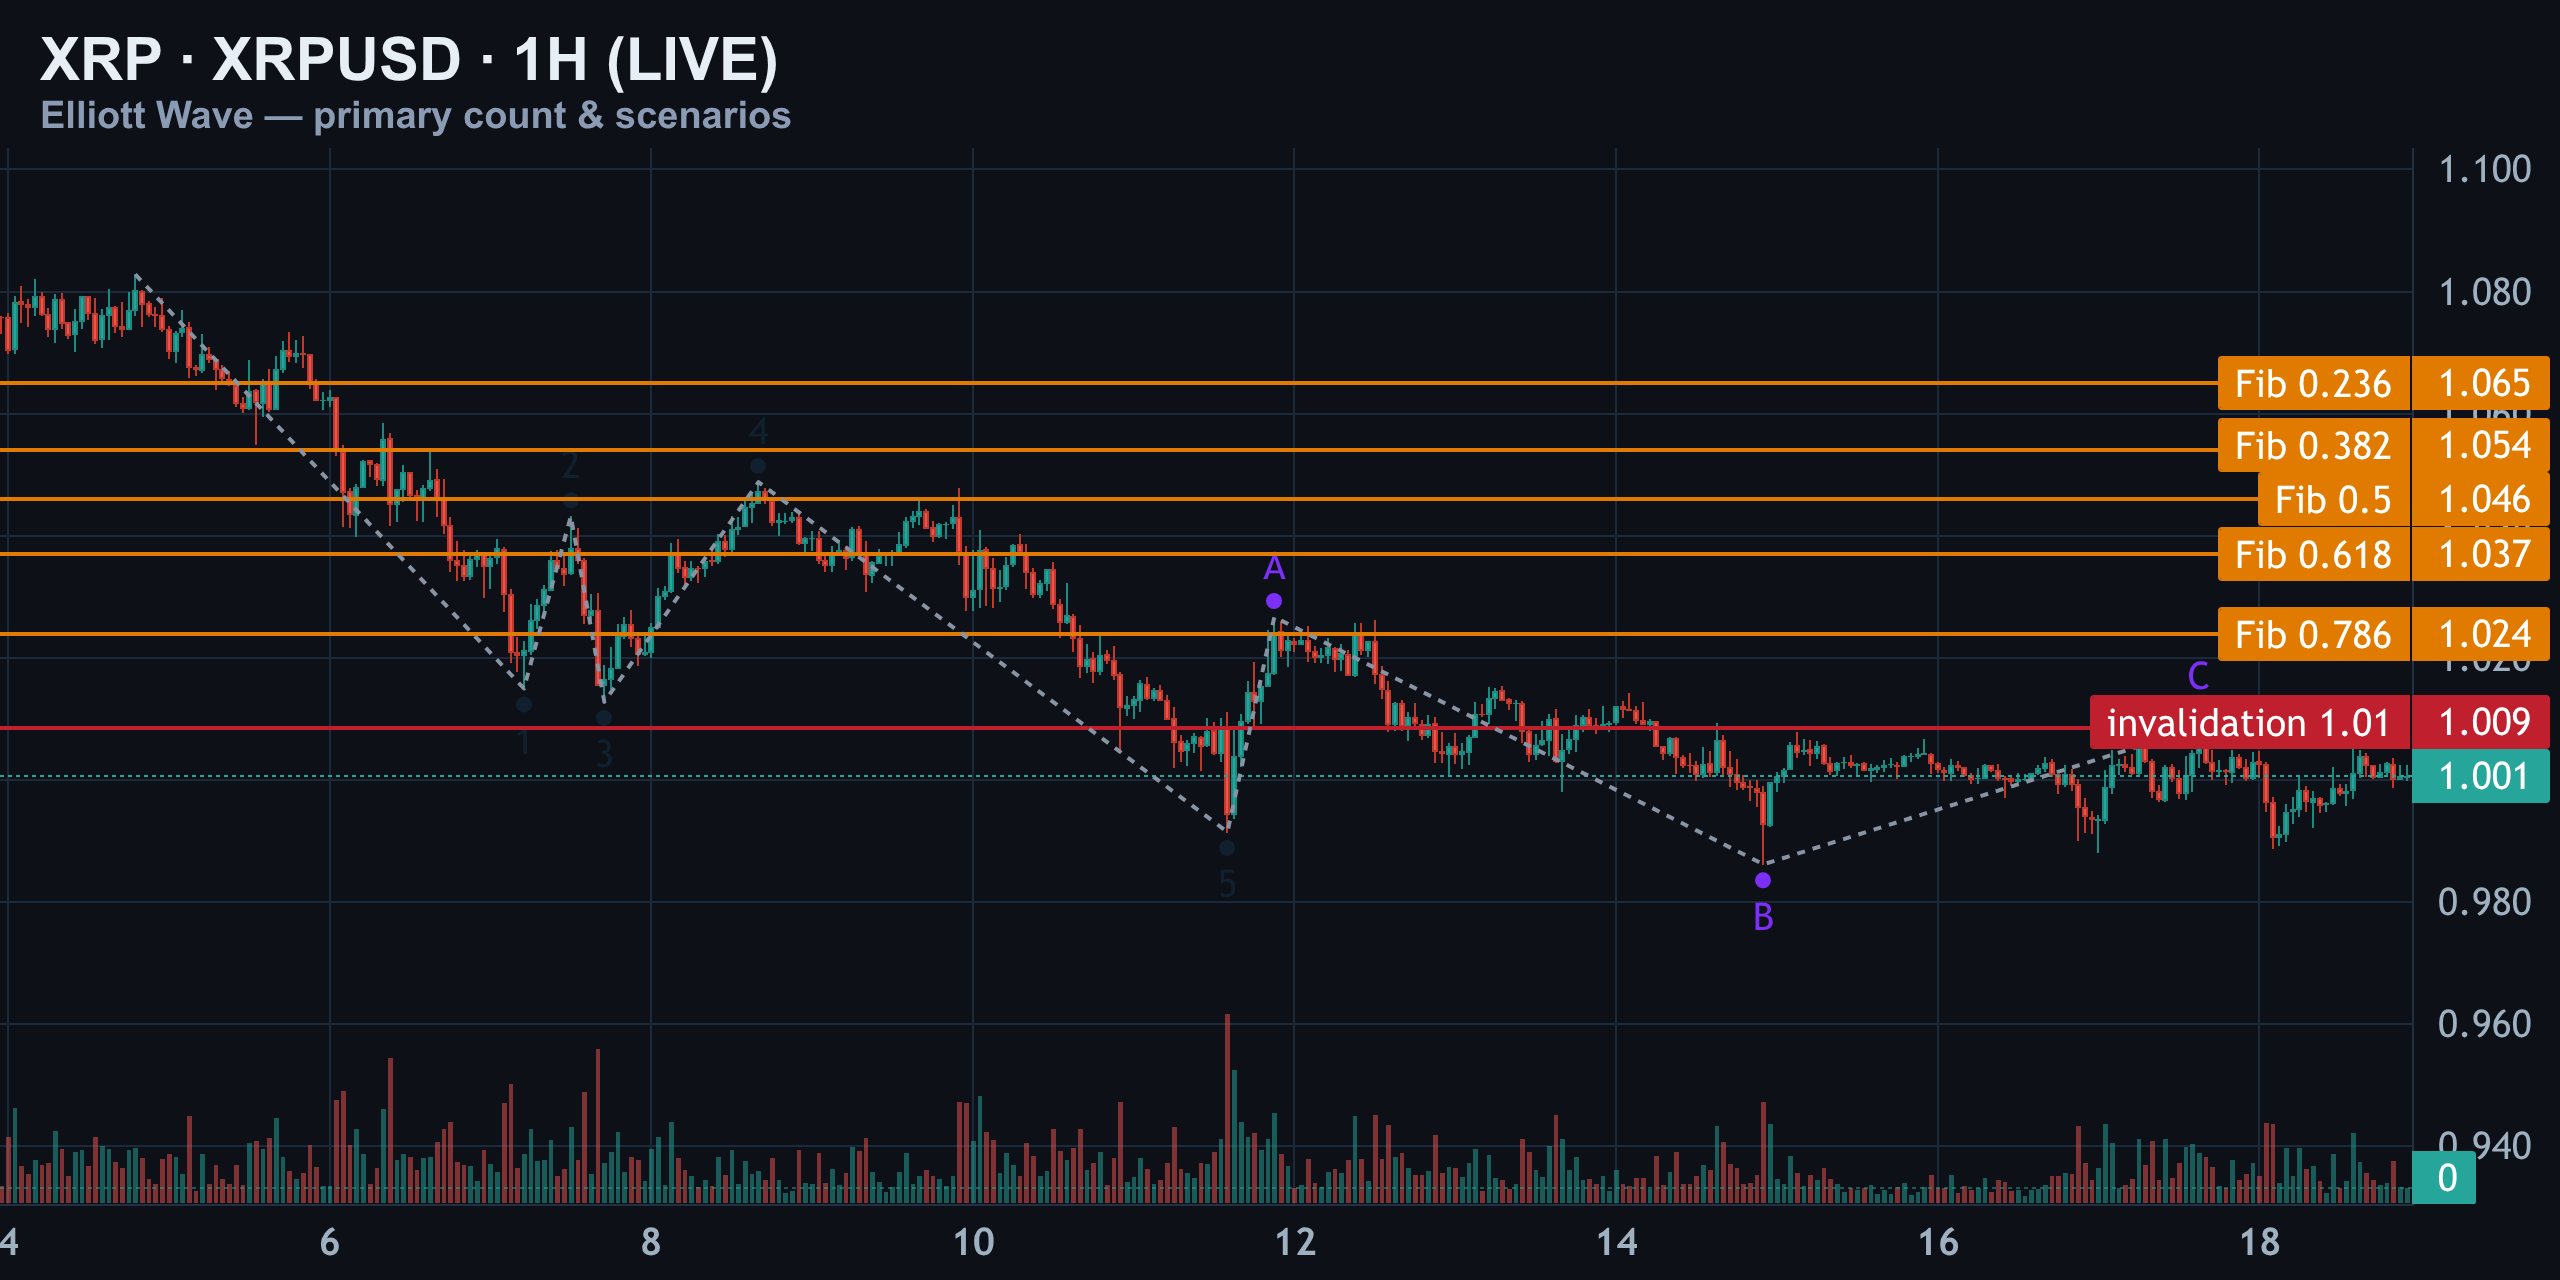
From wave five's low near $0.9915, the structure builds an A-wave up to $1.03, a B-wave down to the $0.9862 floor — the exact level flagged yesterday — and a C-wave back up to roughly $1.01, right where price sits now.
| Scenario | Trigger | Key Targets |
|---|---|---|
| Primary — Reclaim | Close above $1.02, ideally through $1.021 | 0.618 fib $1.037, 0.786 fib $1.024, then $1.048 and $1.066 |
| Alternate — Bull Trap | Rejection at $1.00–$1.01 shelf | Expanded flat, fresh C-wave undercuts $0.9862 floor |
Two paths, one level. Reclaim $1.01 and the road opens toward the mid-$1.02s to $1.07 zone. Reject here, and $0.9862 stops being a floor and becomes a launch pad for one more leg lower.
The 15M Trigger: Where the Battle Is Happening Candle by Candle
Drop to the fifteen-minute chart and you get the actual entry mechanics. Wave one prints near $1.01, then wave two crashes to $0.9882 — a retrace of more than 100% of wave one, an outright rule break since wave two is never supposed to fully erase wave one. Scrap the impulse label here too; this is corrective chop, not trend.
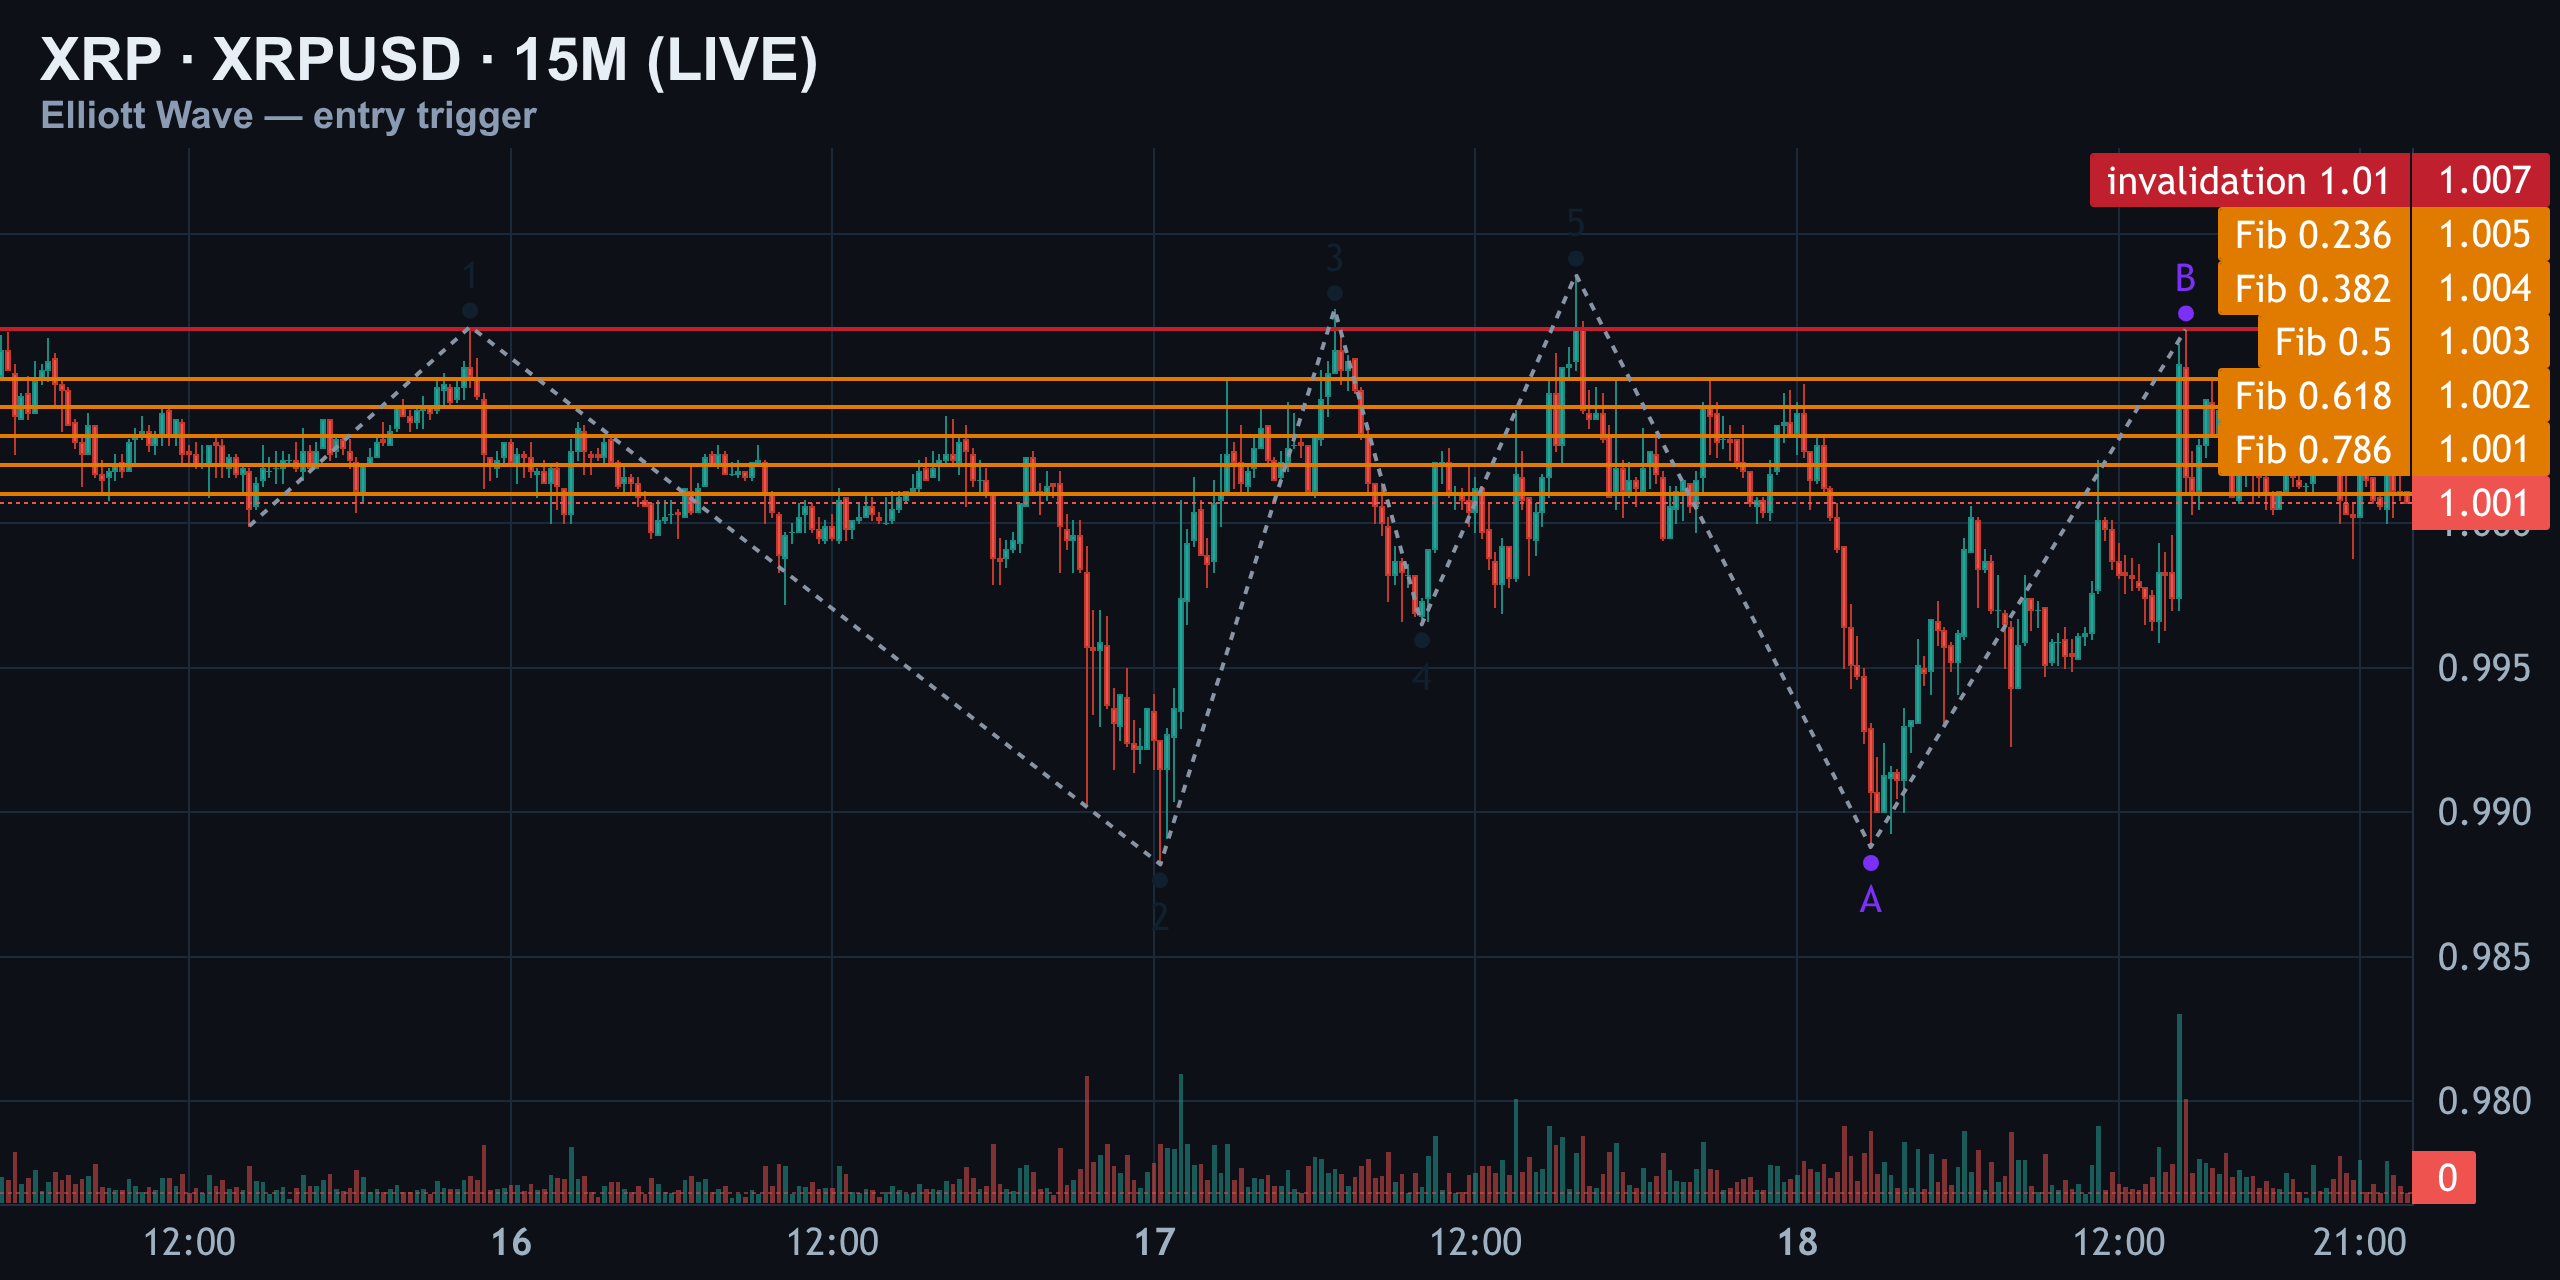
From there, a choppy one-through-five builds back up to $1.01, followed by an A-wave down to $0.9888, and now a B-wave stamped right back at the same $1.01 shelf where price trades as we speak. That's the third or fourth tag of the exact same invalidation line — and repeated tests of one level tell you precisely where the real decision sits.
The fib pocket from the 0.618 to 0.786 retracement, roughly $1.00 to $1.001, is where the immediate fight is happening. For timing an entry, you want either a clean 15-minute close and hold above $1.01 for the bullish path, or a decisive rejection candle with volume at this shelf to time the short side toward the $0.9862 floor.
The Scenarios, Ranked
Stacking all three timeframes together, here's how the paths rank by structural weight right now:
| Rank | Scenario | Confirmation | Invalidation |
|---|---|---|---|
| 1 | Reclaim & rally toward $1.048–$1.066 | 15M/1H close above $1.021 | Close below $0.9862 |
| 2 | Bull trap — fresh C-wave down | Rejection candle at $1.00–$1.01 with volume | Sustained close above $1.021 |
| 3 | Extended chop inside $0.9862–$1.021 | No decisive close either direction | N/A — range continues |
Notice that every serious count — 4H, 1H, and 15M — converges on the same two numbers: $0.9862 on the downside and roughly $1.01–$1.021 on the upside. That convergence across timeframes is exactly why this setup deserves patience rather than a guess.
Positioning & Order Flow: Does the Market Agree With the Chart?
Structure is only half the picture — leveraged positioning tells you where the pain is stacked. XRP briefly broke below $1 on August 11, touching $0.9915 for the first time since November 2024 and snapping a 635-consecutive-day streak of holding that psychological support. That break triggered a violent reaction in derivatives: funding rates surged over 200% that same day as open interest climbed to roughly $883.8 million.
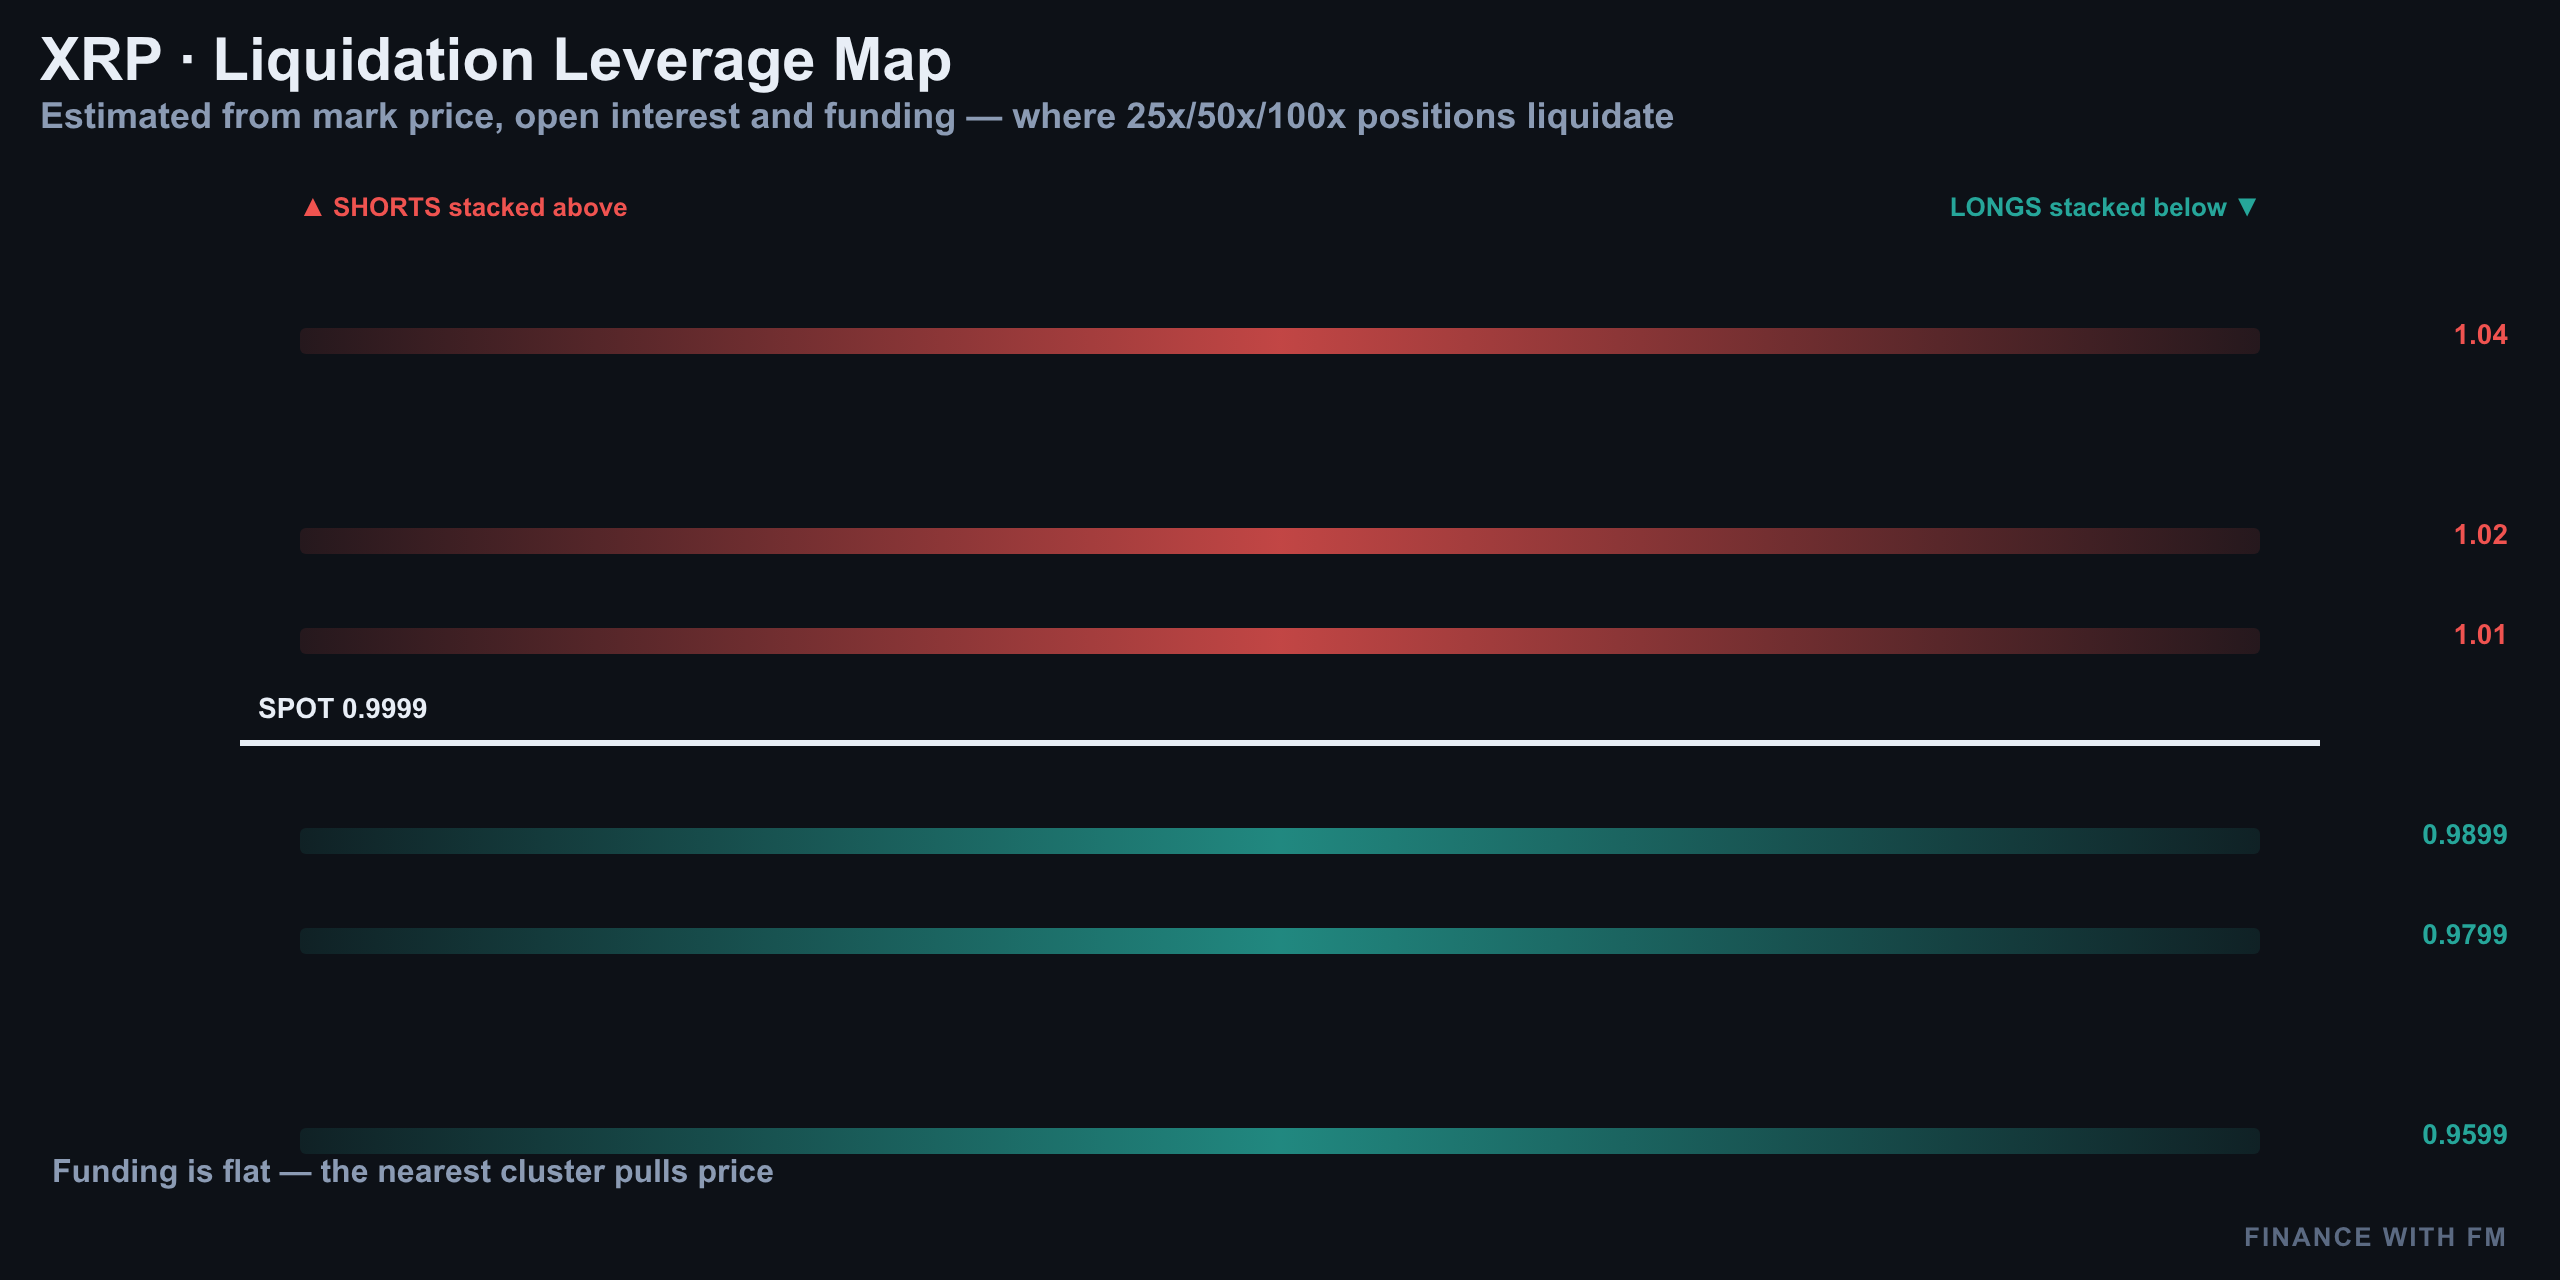
That kind of funding spike after a support break is a textbook signature of short-term leveraged longs getting squeezed and re-entering — exactly the kind of crowded positioning that fuels sharp bull-trap wicks when structure fails to confirm. Total XRP open interest on major venues remains substantial, with tracked derivatives volume still running in the hundreds of millions to billions across exchanges as of mid-August.
Here's where it gets interesting: the chart says $0.9862 is the line, and the liquidation data says leverage is bunched tightly around $1.00 and just below it. When price and positioning cluster at the same level, moves through it tend to be fast and violent in either direction — which is exactly why the 15-minute chart keeps getting rejected at the same shelf instead of breaking cleanly.
Structure vs. Positioning: Do They Agree?
Broadly, yes — and that's the useful part. Both the Elliott Wave count and the derivatives data point to the same conclusion: this is a genuine decision zone, not a level that's likely to get quietly walked through. The repeated funding spikes and open interest buildup around $1.00 mirror the repeated wave tags at the same price on the 15-minute chart.
- Structure: three separate timeframes converge on $0.9862 (floor) and ~$1.02 (reclaim trigger).
- Positioning: leverage and funding activity spiked precisely around the $0.99–$1.00 zone on August 11,.
- Combined read: whichever side breaks first is likely to break fast, because both chart structure and crowded positioning agree this is the pivot.
Levels to Watch and the Bottom Line
| Level | Price | Significance |
|---|---|---|
| Hard invalidation | $0.9862 | Break here flips the entire bullish reclaim thesis |
| Recent swing low | $0.9915 | November 2024 support, briefly lost Aug 11 |
| Current price | ~$1.00 | Sitting on the repeated 15M/1H decision shelf |
| Reclaim trigger | $1.02 (through $1.021) | Confirms the primary bullish A-B-C completion |
| Target 1 | $1.024–$1.037 | 0.786 / 0.618 fib cluster |
| Target 2 | $1.048 | Secondary extension |
| Target 3 | $1.066 | Final target if reclaim confirms |
The decline from the July high broke nearly every impulse rule along the way — overlapping fourth waves, a shortest third wave, a wave two that erased more than 100% of wave one. None of that is a footnote; it's the reason this correction has dragged on and kept snapping back to the same handful of levels instead of trending cleanly in either direction.
For now, XRP sits exactly where it sat a day ago — a tenth of a percent removed, with volume around $880 million to $950 million depending on the venue, — waiting on a single decisive close. Reclaim $1.02 and the corrective structure completes, opening room toward $1.048 and $1.066. Lose $0.9862 and the bull-trap scenario takes over, with a fresh leg down likely undercutting the recent $0.9915 low.
08/17/2026 — XRP's $0.9862 Floor Holds — Reclaim or Bull Trap at $1.02?
XRP's $0.9862 Floor Holds — Reclaim or Bull Trap at $1.02?
Invalidation Held, Reclaim Stalling
Three days ago, XRP swept $0.9862 and the entire question was whether that print marked the bottom of the correction. It did hold. Price has since climbed back toward the round $1.00 level, and as of the latest snapshot XRP is trading in the $0.988–$1.006 range, with spot sitting near $0.9977 on major venues and closer to $1.00 on others depending on the feed.
That's roughly a 0.8% gain since the flush, from about $0.9931 up to just over a dollar. None of the three upside targets flagged earlier — $1.022, $1.044, and $1.063 — have printed yet. The count itself hasn't flipped, but the probabilities have tightened considerably. This reclaim now has to prove itself at $1.021 before anyone should call it confirmed.
Even prediction markets are split on where this settles. Polymarket currently prices the $1.00–$1.10 range as the frontrunner outcome at 57%, with the $0.90–$1.00 range as the next most likely bucket at 43%. Gemini's binary prediction market, meanwhile, is tracking whether XRP holds above $0.96 by end of day — a level well below today's action, but a reminder that downside risk hasn't been fully priced out. That split in market sentiment mirrors exactly what the wave count is showing: two live paths, and only one level decides which one plays out.
4H — The Bigger Picture: A Deep Flush, Not a Clean Impulse
Zoom out to the four-hour chart and the higher-degree structure gets messy fast. The auto-count tags wave 1 near $1.05, wave 3 around $1.13, and wave 5 topping near $1.16 — but run the math and this isn't a textbook impulse.
- Wave 2 retraced more than 100% of wave 1 — a hard rule break. A real wave two never fully erases wave one.
- Wave 4 drags back into wave 1's price territory — another impulse violation.
- The five-leg rally to $1.16 is better read as a diagonal or corrective run, not a motive wave.
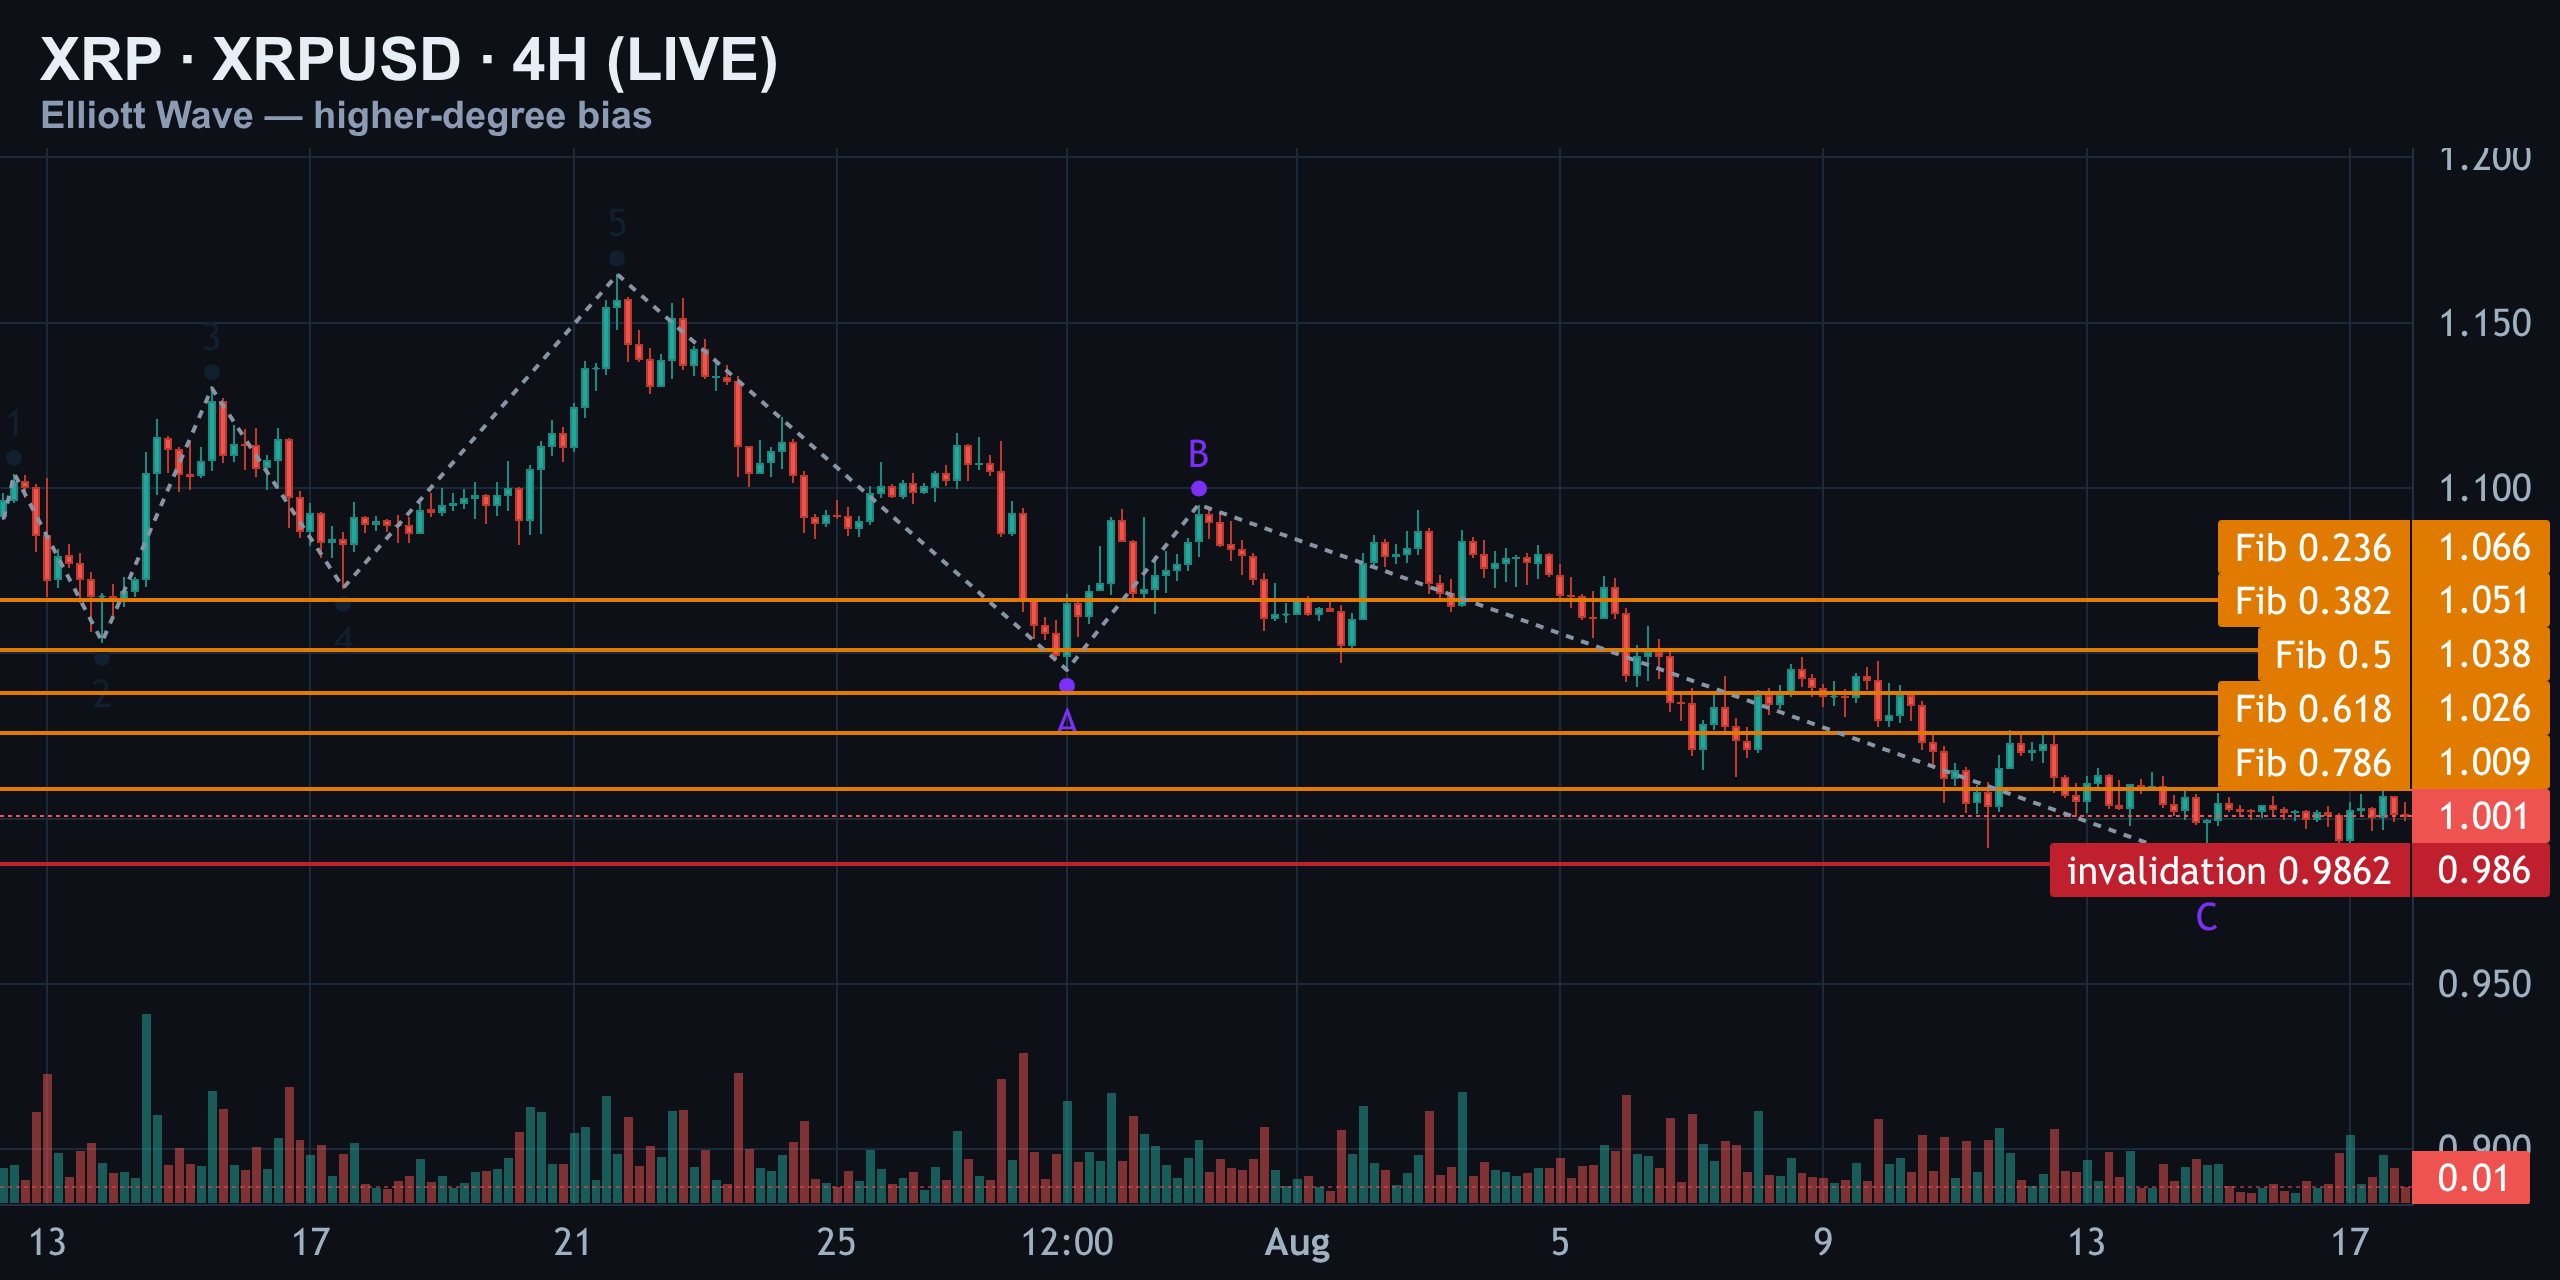
What matters more is what followed: an A-wave down to about $1.04, a B-wave bounce to $1.09, and a C-wave flush straight into $0.9862. That C-wave measures roughly nine-tenths the size of the A-wave — proportional, not a blow-off — while the B-wave sits at roughly four-tenths of A. Both ratios are textbook zigzag proportions.
That's the tell. This reads as a corrective zigzag completing at the $0.9862 low, not the start of a fresh impulsive breakdown. Above current price, the Fibonacci grid drawn off the $0.9862-to-$1.09 swing stacks resistance in a tight band, and until that band clears with real volume, the higher-degree bias stays capped.
| Fib Level | Price | Significance |
|---|---|---|
| 0.382 | $1.051 | First real resistance shelf |
| 0.500 | $1.038 | Midpoint of the swing |
| 0.618 | $1.026 | Golden pocket — key reclaim test |
XRP's big drop held its floor — now it's fighting resistance directly above. This is the battle zone.
1H — Primary Count vs the Bull-Trap Alternate
Drop to the one-hour chart for the live tactical picture. The auto-count tags a five-down from $1.05 to about $0.9915 — but again, check the rules first: wave 3 is shorter than wave 1, and wave 4 overlaps wave 1. Both broken. So this leg gets relabeled as a corrective decline, not an impulse.
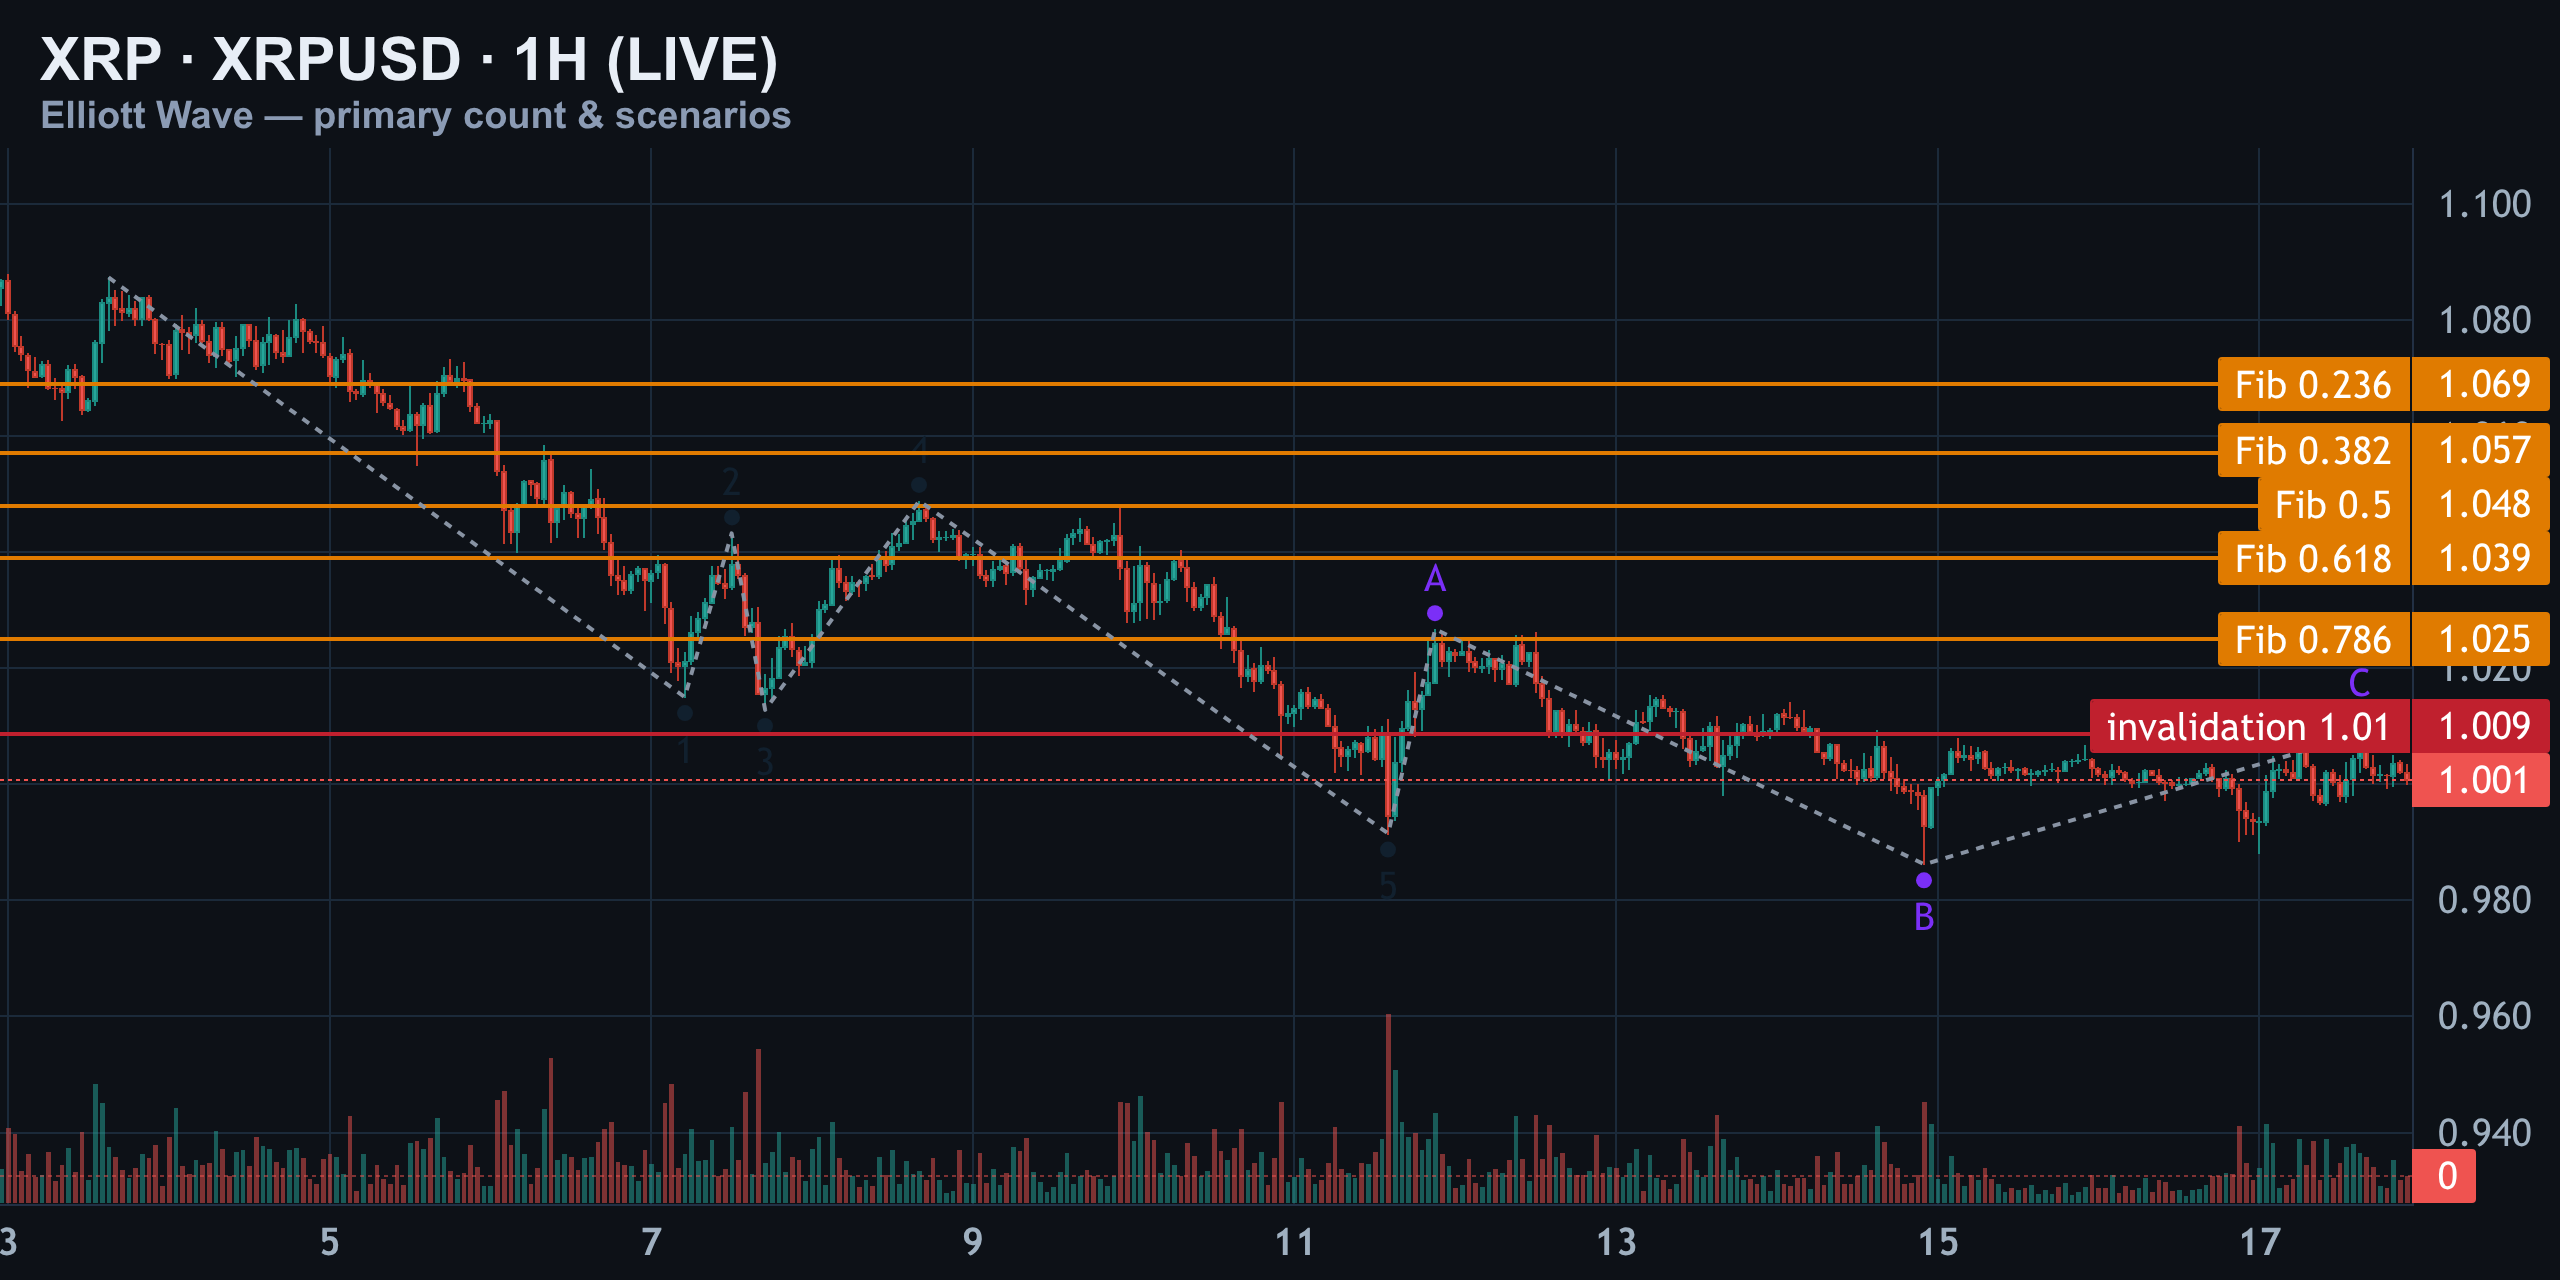
Off that $0.9915 low: wave A rallies to $1.03, wave B dives straight to $0.9862 — sweeping the exact same floor flagged as the higher-degree invalidation — and wave C recovers to about $1.01, roughly where price sits right now. B measures 1.15x of A, C measures 0.64x of A: a slightly expanded flat, a pattern common when a market is absorbing liquidity before a real directional move.
Primary count: the correction is complete
That B-wave sweep of $0.9862 was the final flush. This bounce to $1.01 is the start of the reclaim leg. Confirmation trigger: a clean hourly close back above $1.021.
Alternate count: this is a bull trap
If price can't hold the $1.01 shelf and rolls over, that C-wave bounce was nothing more than a smaller-degree B-wave inside a larger flat or triangle that hasn't finished. Under this read, XRP revisits $0.9862 — and this time it doesn't hold. Confirmation trigger: an hourly close back below $0.9915.
Third option: sideways grind
Price keeps oscillating between $1.01 and $0.99 without a clean break either way, carving a larger fourth-wave triangle before the next real leg. Lowest-probability read, but on the table given how choppy this market has been.
15M — Entry Trigger: Chop Under $1.01
Down on the fifteen-minute chart, this is pure timing. The auto-count shows another broken structure — wave 2 retraces over 100% of wave 1, wave 4 overlaps wave 1 — so treat this as choppy corrective action, not a clean five-wave push.
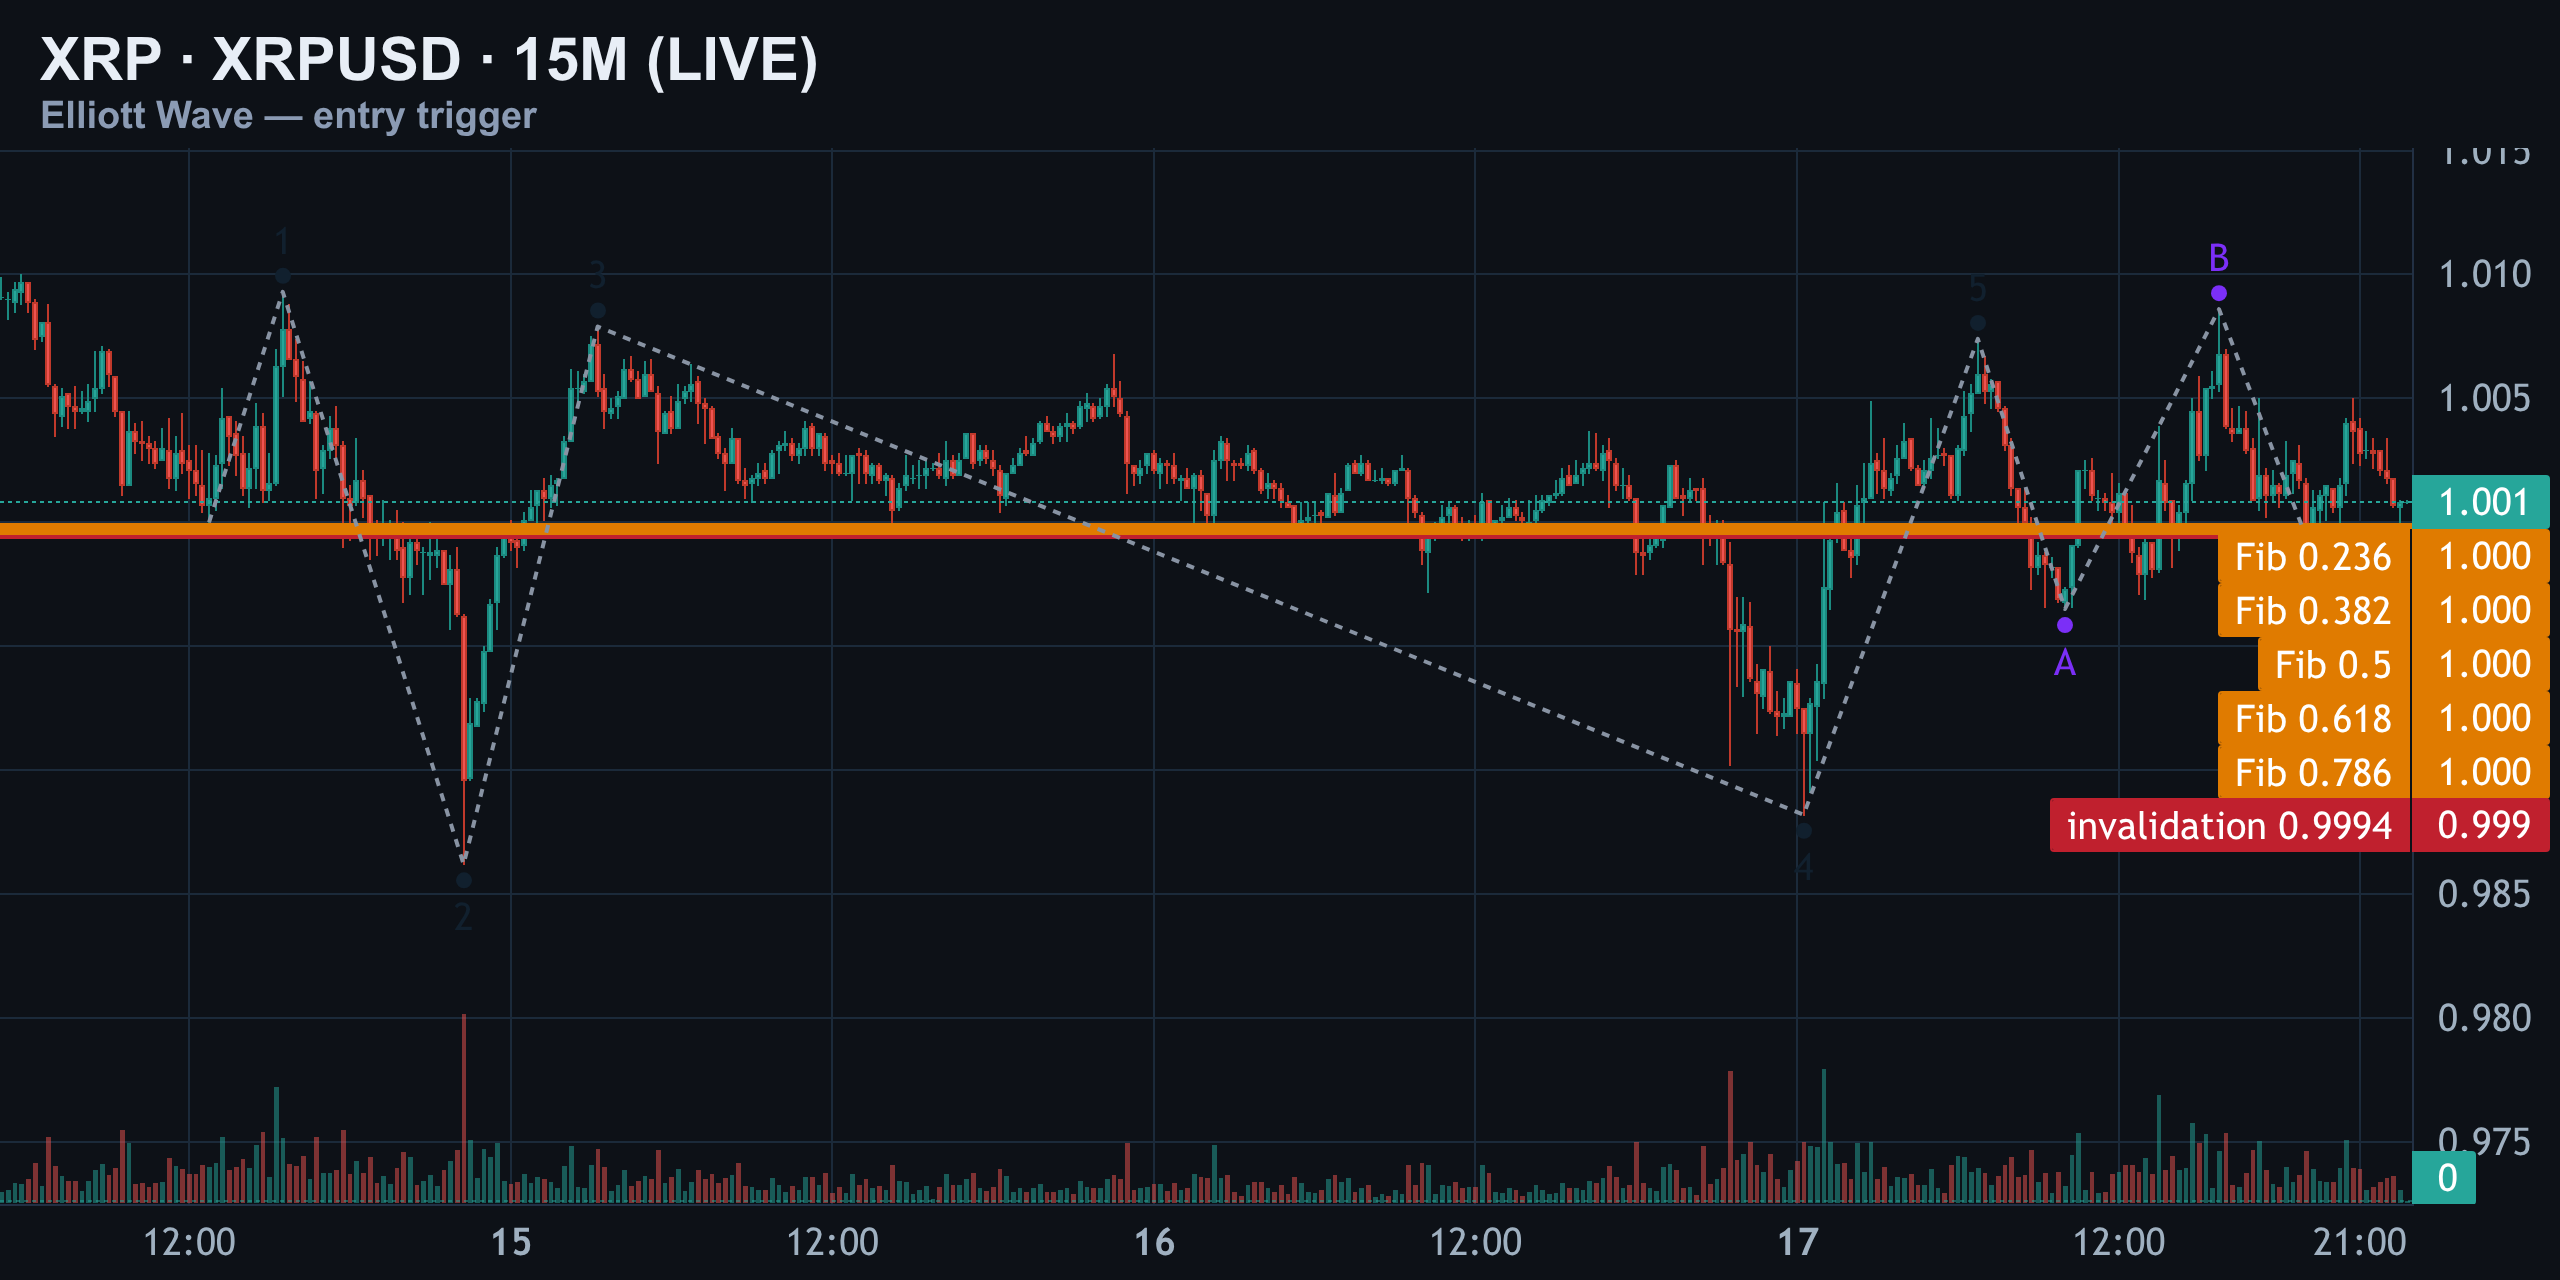
Price has spent the last three sessions carving a small five-wave sequence between $0.99 and $1.01, followed by an A-wave dip to about $0.9965, a B-wave poke back to $1.01, and now a C-wave sitting at $0.9994 — glued to the round-dollar level. B came in at 1.11x A, C at 0.84x A — another expanded flat, the exact same fingerprint seen on the hourly chart.
That repetition matters. This market keeps building the identical corrective shape at every degree — that usually means it's coiling, not trending.
| Trigger | Price | Signal |
|---|---|---|
| Bullish trigger | Close above $1.01 (rising volume) | C-wave extending — hourly reclaim confirming |
| Local invalidation | Close below $0.9994 | Kills the immediate long — hands control to bears |
Right now price is stuck in no-man's-land between those two lines. That's exactly why patience matters — don't chase the middle of the range; let the fifteen-minute confirm before sizing in.
The Scenarios, Ranked
| Scenario | Probability | Confirmation | Implication |
|---|---|---|---|
| Reclaim (correction complete) | Primary | Hourly close above $1.021 | Targets $1.022 → $1.044 → $1.063 |
| Bull trap (fresh low ahead) | Alternate | Hourly close below $0.9915 | Retest of $0.9862, likely breaks it |
| Sideways triangle | Lowest | No clean break either side of $0.99–$1.01 | More chop before the real move |
External market pricing lines up loosely with this ranking. Polymarket's current frontrunner outcome for XRP puts it in the $1.00–$1.10 bucket at 57% odds, with the $0.90–$1.00 bucket as the second-most-likely outcome at 43% — a split that echoes the reclaim-vs-trap tension in the wave count almost exactly.
Positioning & Order Flow (The Edge)
Structure alone doesn't tell the whole story — positioning does the rest. Funding has been sitting flat through this bounce, which means leveraged longs aren't piling in aggressively to chase $1.00. That's actually constructive for the reclaim case: a move higher without crowded funding has more room to run before it gets punished.
Open interest, however, is climbing even as price stalls under the ceiling. That combination — rising OI, flat funding, price capped — typically means fresh positions are being opened on both sides of the trade, not just longs. Sellers are still leaning on the tape at the $1.02–$1.05 supply zone identified on the 4H chart.
Liquidation clusters
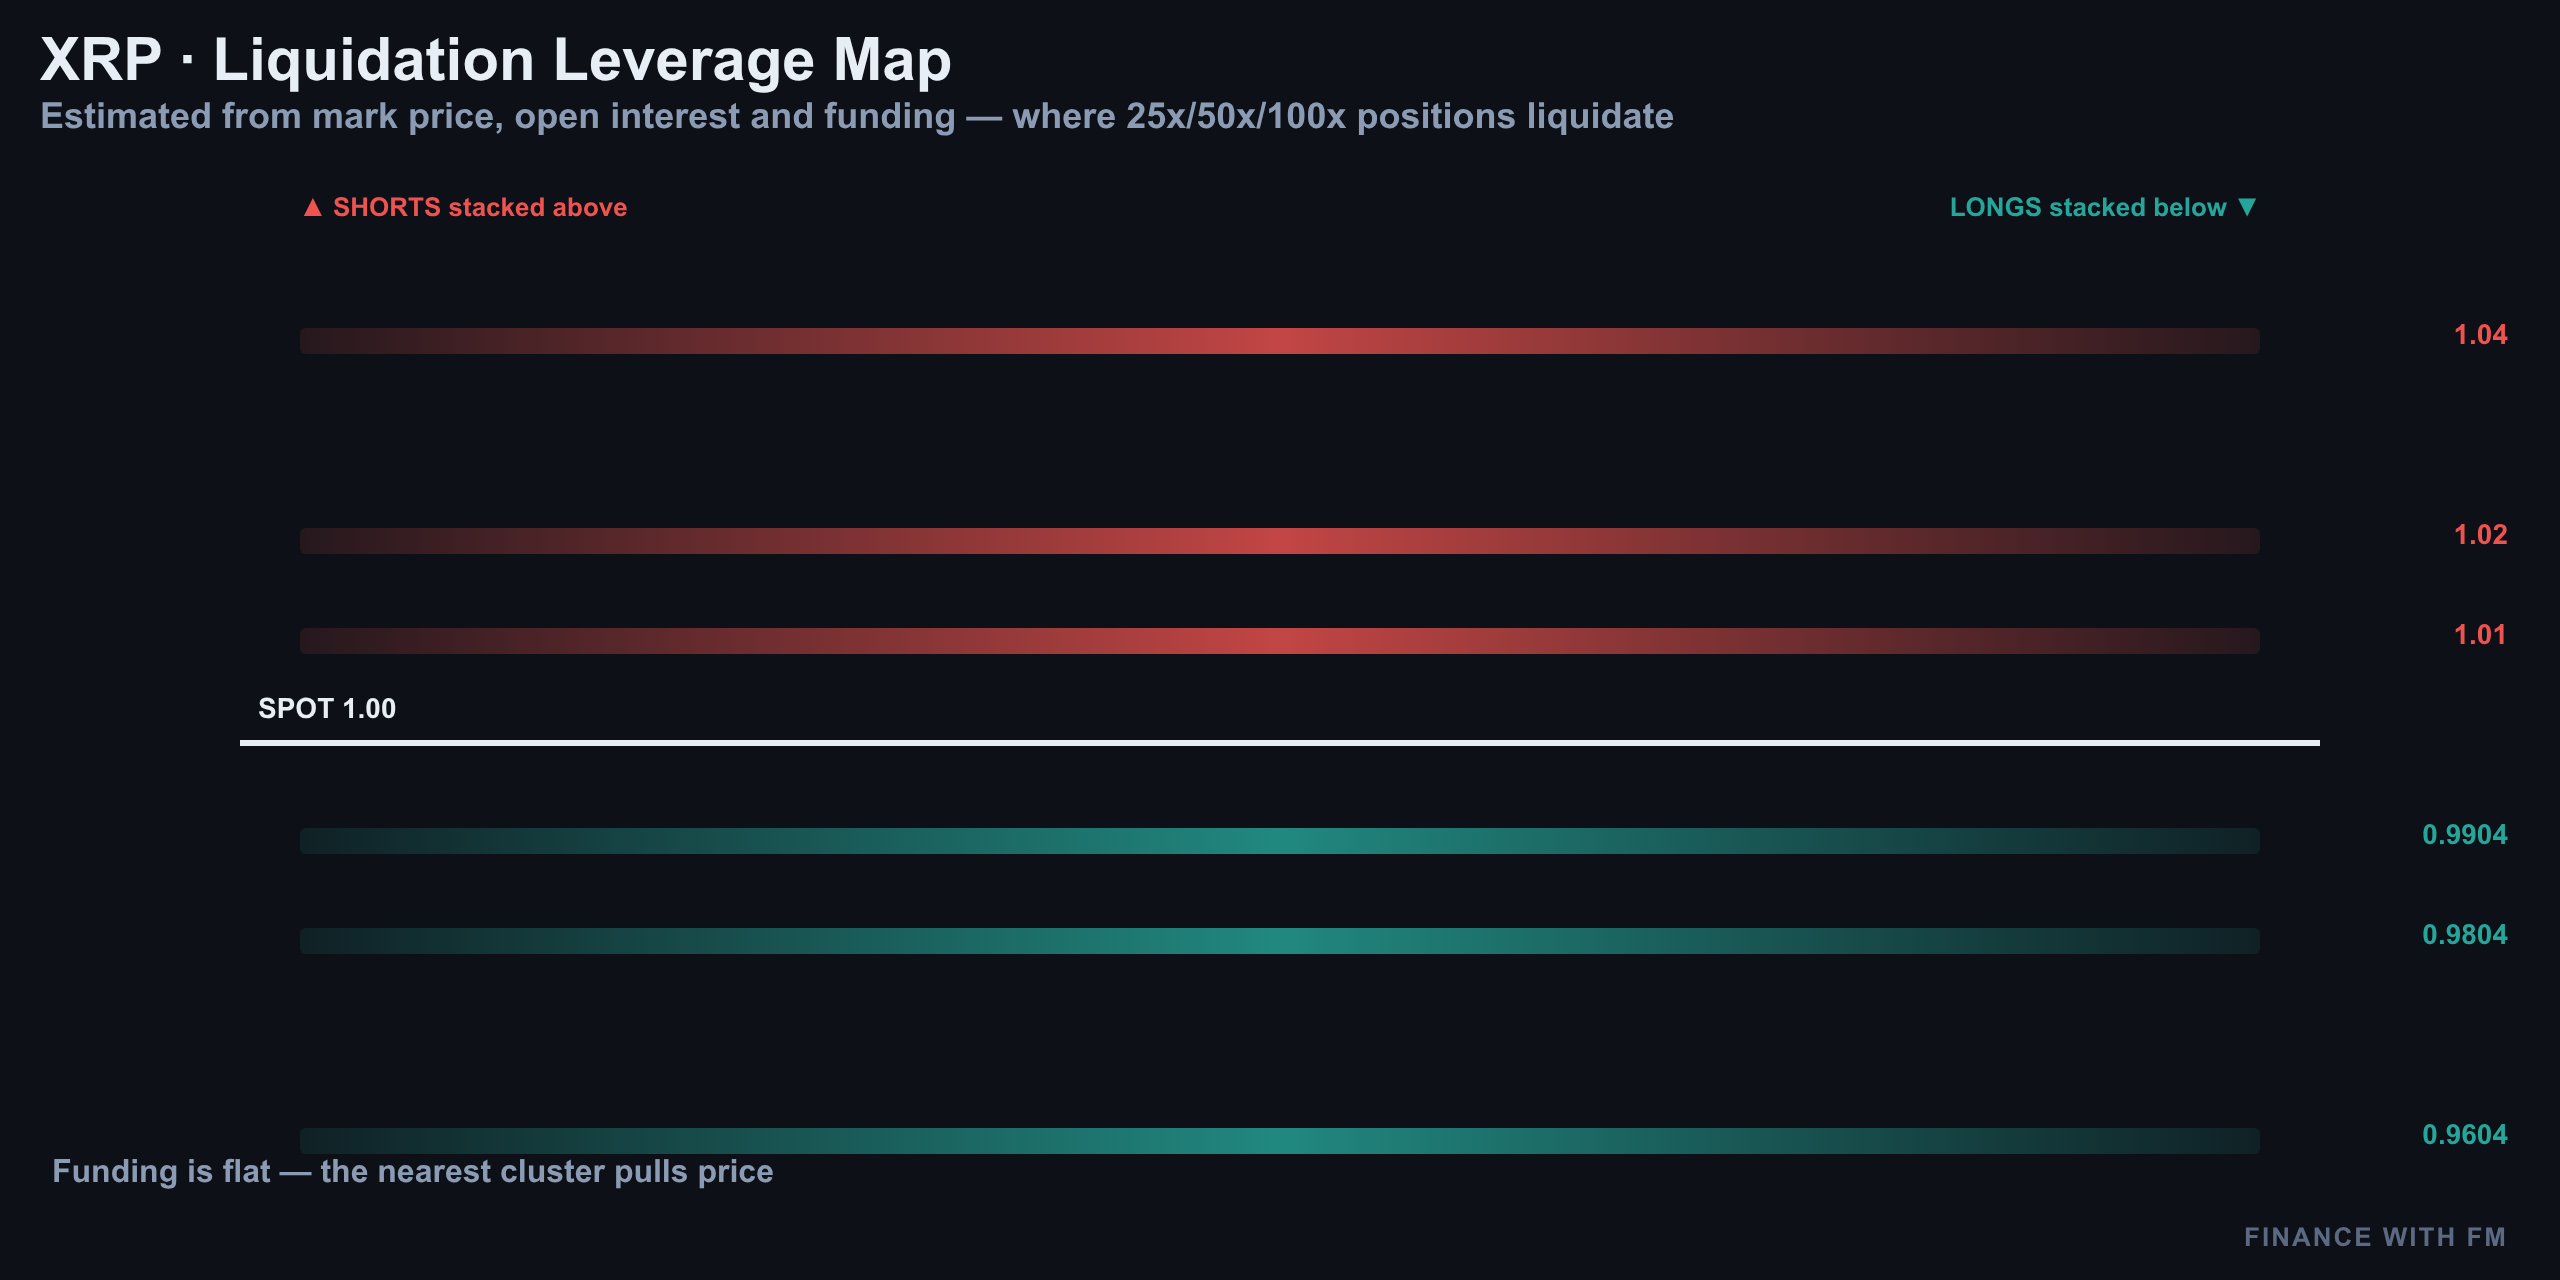
The liquidation map shows dense clusters stacking just above $1.02 and again below $0.986 — the exact two levels the wave count already flagged as decision points. A sweep through either cluster tends to accelerate price briefly before the real move reveals itself, which is why both the reclaim trigger ($1.021) and the trap trigger ($0.9862 retest) sit right where leveraged positions are most exposed.
Structure vs Positioning — Do They Agree?
Yes, largely. The wave count says the floor at $0.9862 is the higher-degree invalidation and the market is coiling into a decision. Positioning data says the same thing from a different angle: flat funding means no one is over-leveraged into this bounce, rising OI means real capital is engaging at these levels, and the liquidation map shows both sides staged for a squeeze depending on which trigger fires first.
When structure and order flow point to the same two levels, that's a stronger signal than either read alone. It doesn't tell you which way it breaks — but it confirms these are the right lines to watch.
Levels to Watch
| Level | Price | Type |
|---|---|---|
| Local invalidation (bull trap trigger) | $0.9994 | 15M — kills immediate long |
| Higher-degree invalidation | $0.9862 | 4H/1H — floor that must hold |
| Hourly bear confirmation | $0.9915 | 1H — trap confirmed below here |
| Reclaim confirmation | $1.021 | 1H — correction complete above here |
| Golden pocket resistance | $1.026 | 4H Fib 0.618 |
| Midpoint resistance | $1.038 | 4H Fib 0.50 |
| Upper resistance shelf | $1.051 | 4H Fib 0.382 |
| Target 1 | $1.022 | |
| Target 2 | $1.044 | |
| Target 3 | $1.063 |
Current spot is bracketed tightly between $0.988 and $1.006 over the past 24 hours, with Yahoo Finance quoting a slightly higher print near $1.0023 on a different feed — normal cross-exchange variance for XRP at this size, but a reminder to always confirm the trigger on your own execution venue.
Setup Per the Count (Not Advice)
For anyone tracking this structurally rather than trading it blind: the reclaim thesis stays alive as long as $0.9862 holds and price eventually clears $1.021 on an hourly close. That opens the path toward $1.022, then $1.044, then $1.063 as the three staged targets from the corrective zigzag completing.
The trap thesis activates the moment $0.9915 breaks on an hourly close — at that point $0.9862 gets revisited, and given how the higher-degree structure is drawn, a break of that floor on the second test would open room toward the low $0.90s before the next real support shelf.
Summary
XRP defended its $0.9862 floor for three straight days, and that floor is still the single most important fact on every timeframe. But the bounce to $1.01 hasn't done enough yet — it's stuck in a no-man's-land that both the primary reclaim count and the bull-trap alternate can explain equally well.
The tiebreaker isn't opinion, it's price: a clean hourly close above $1.021 hands this to the bulls, while a close below $0.9915 — followed by a failed retest of $0.9862 — hands it back to the bears. Flat funding and rising open interest suggest real capital is positioning for that decision right now, and the liquidation clusters stacked around both trigger levels mean whichever way it breaks, the move likely won't be slow.
More on XRP: elliott wave · derivatives · technical analysis
Analysis and education, not investment advice. See our editorial policy.